inventory manaement
110
CHAPTER I INTRODUCTION
-
Upload
rojamba2010 -
Category
Documents
-
view
244 -
download
4
Transcript of inventory manaement
CHAPTER I
INTRODUCTION

MEANING AND NATURE OF INVENTORY
Inventory can be referred to as sum of the value of raw materials fuels and lubricants, spare parts, maintenance consumables, semi processed materials and finished goods, stock at any given point of time.
In large companies inventory place a most significant part of the current assets. The business has about 15 to 30% of inventories in total assets.
Inventory is composed of assets that will be sold in feature in the normal course of business operations. The assets which firms stores as inventory is anticipation of need are raw materials, work in progress and finished goods.
MEANING OF INVENTORY MANAGEMENT
Inventory management consists of maintaining for a given financial investment an adequate of something in order to meet and accepted pattern of demand. Inventory considers control over costs of inventory on one hand an handle the size of inventory on other hand.
Controlling investments in inventories constitute crucial part in current assets.
An efficient inventory controlling system will decide,
What to purchaseWhen to purchaseHow to purchaseSize of purchase
2
And from where to purchase (Suppliers)
The main purpose of inventory management is to ensure
1. Required quantity of availability of raw materials 2. Minimize the investments in inventories 3. Maintain reasonable stock levels not excess or not under
stocks.
INVENTORY CONTORL
Inventory control is the system devised an adopted for controlling investments in inventory. It involves inventory planning and decision making with regard to the quantity and time of purchase, fixation of stock levels, maintenance of stock records and continuous stock – taking.
OBJECTIVES OF INVENTORY CONTROL
Inventory control includes not only of the physical stocks but also of the funds invested on it.
That twin objectives of inventory control are,
1. To maintain a balanced inventory.
2. To keep the amount invested in inventory as low as possible without hampering either flow of the production or deliveries of finished goods.
To avoid both under stocking and over stocking of inventory.
To eliminate duplication in ordering or replenishing stocks. This is possible with the help of centralized purchasing.
3

To ensure continues supply of materials, spares and finished goods so that production should not suffer and any time and customers demand should also be met.
To design proper structure for inventory management. A clear cut accountability should be fixed at various levels of the organizations.
To ensure right quality goods at reasonable prices. Suitable quality standards will ensure proper quality of stocks. The price analysis, the cost analysis will ensure paying of proper prices.
To facilitate furnishing of data for short term and long term planning and control of inventory.
NEED FOR INVENTORY MANAGEMENT
In this competitive business world each and every business organization need inventory management system for determining what to order, when to order, where and how much to order so that purchasing and storing costs are the lowest possible without affecting production and sales. Thus, inventory management control incorporates the determination of the optimum size of the inventory-how much to be order and when after taking into consideration the minimum inventory cost.
The over all inventory management includes design and inventory control organization with proper accountability establishing procedure for inventory handling disposal of scrap, simplification, standardization and codification of inventories, determining the size of inventory holdings, maintaining record points and safety stocks, economic order quantity, ABC analysis and VALUE analysis and finally framing an INVENTORY MANUAL.
4
OBJECTIVE OF THE STUDY
The main objective of the project work is to study and analyze and preparation INVENTORY MANAGEMENT in Tecumseh India products private Ltd.,
The objectives are :
1. To know the purchasing procedure of the inventories at
Tekumseh.
2. To know classification of inventories.
3. To know codification of inventories.
4. To know the analysis of the records of stock levels.
5. To know the analysis of the JIT system of Tecumseh India
products private Ltd.
6. To know the analysis of the two bin system.
7. To know the analysis of the inventory turn over ratio.
SCOPE OF THE STUDY
The study conducted with available data from the annual reports, internal reports etc… and also interacting with employees of Tecumseh and analysis was made accordingly.The study conducted for a period of 45 days it is may not be detailed in all aspects.
METHODOLOGY
5

To attain the objective of studying the inventory of Tecumseh Products India private Ltd. The information has been collected in two ways :
1. Primary data2. Secondary data
Primary Data :
In Primary data the analysis of purchasing procedure, inventory data, inventory turn over ratio, stock levels, ABC analysis, Two bin system, JIT has made possible by the discussions with various administrative executives and other concerned people of Tecumseh Products India Pvt Ltd.
Secondary Data :
The Secondary data has been collected from annual reports of organization, internet (www.Tecumseh.com) and books.
Problem identification
To design a optimum level of inventory to manufactures compressors to the organization .The optimum level of inventory avoids excess & deficits inventory. Which is dangerous for the organization.
6

Limitations:
1 The study period of 45 days as prescribed by university
2 The study is limited unto the date and information provided
by Tecumseh India products private Ltd and its annual
reports
3 The report will not provide exact Budgetary System status
and position in Tecumseh India products private Ltd; it may
vary from time to time and situation to situation.
4 This report is not helpful in investing in Tecumseh either
through disinvestments or capital market.
5 The accounting procedure and other accounting principles
are limited by the company changes in them may vary the
actual and budget performance.
7

CHAPTER IICOMPANY PROFILE
8

TECUMSEH
Mr. Ray Herrick a former employee of ford motor company
started the company in 1937 the company went into public with
an offering of 25000 shares. Mr. Ray Herrick has passed away in
1973 but vision lived through his son ken the current chairman of
the board and his grandson Mr. Todd W Herrick who has been
president and CEO since 1984 Tecumseh India is a preferred
supplier to world who of the Ac & Industry in India and in Middle
East SAARC Countries
Tecumseh products company is a US $ 2 billion cooling giant
having a global presence and a global vision with 24
manufacturing locations in 4 continents a cross 100 countries
employing over 20000 people it is the world largest independent
compressors manufacturing company with 10% market share of
the global 150 million units a year compressors Market.
Tecumseh products company products are grouped into 3
principal industry segments:
1. compressors products
2. engine and power
3. pump products
ORIGIN OF COMPANY:
9

The company was originally established and registered in 1963
under the name of USHA refrigeration industries limited(URIL)
this unit manufacturing compressors for water cooler air
conditions and water coolers lala sharat Ramji who was from
renowned industrial family of DGM and coromondal group of
companies started URIL in 1970 the URIL was changed to shri
ram refrigeration limited and the business was divers towards
Manufacturing of diesel engines and water coolers shri ram
industries played a great role line the field and capture more than
50% of market share in India shri ram industries also kept its
hands in Mr. Siddhartha c shriram ram industries also kept its
hands in Mr. Siddhartha c shriam became the chairman cum
managing director (M.D) The product saw sea change in the
industrial policy, which resulted in a great change in the industrial
sector. in the process for survival, shri Ram went into technical
collaboration with wasting house US and was named as siel
compressors.
Siel compressors were the first Indian
compressors. Later wasting House stopped manufacturing
compressors and steel went into technological collaboration with
Techmseh products company USA in 1988.TECUMSEH mean
CROUNCHING PANTHER derived from chief of the SHAWNEE tribe.
(1768-1813).it started operation to offer new state of art AW
series to Indian customers subsequently Tecumseh Products
Company took over siel group become 100% subsidiary company
of Tecumseh Products Company. As soon as Tecumseh took over
the company stopped manufacturing water coolness and
restricted its production to CFC/hermetically sealed compressor.
10

TPIPL is an ISO and 9001 certified American
based company Tecumseh India is a 100% subsidiary 10
Tecumseh products company USA, which is world only full line,
independent manufacturing locations is 4 continents across 100
countries employing over 19000 people. In India it has 20 sales
office and an extensive network of over 200 dealers and move
than 600 registered small scales industries.TPIPL has gained core
expertise in R&D AW assembly and AW machine shops such that
it acquired a lion’s shae compressors marked by gaining a 50%
share.
Hyderabad plant:
The Hyderabad plant is on a 54 acres land at the Balanagar
industrial belt 15km away from Hyderabad city on highway line
going towards HMT Limited Narsapur road at Hyderabad
TPIPL manufacture air conditioner form 100 BTU to 6lakhs BTU
(British Thermal Unit) and compressors for deep freezer, bottle
coolers and water coolers which are considered to be world’s no 1
in 150 million compressor market a year. The plant has the
manufacture capacity of 300 units per day. This plant has a
technology development center with full R&D facility. The plant is
also supported by two service centers AW service center and MC
service center and MC service center Hyderabad plant has six
regional offices among which four offices are metro cities The
remaining tow are at Ahmadabad and secunderabd., Besides
there are branch officers and depots located in prime cities
11

across the country. This plant also has network of about 177
dealers across the nation and his preferred supplies to key
original equipment manufactures like LG, VOLTAS, BLUESTAR,
GODERJ, VIDDEOCON, FEDDERS, AMTRIX, HITACHI, etc.TPIPL
Hyderabad plant was successful in getting the ISO 9001
certification for maintaining quality of compressor in 1994 and for
eco friendly environment maintenance the company has ISO
14001 certification . TPIPL Hyderabad has total of 829 permanent
employees.
In 1997 Tecumseh fully acquired SRI, Hyderabad.
In 1998 the turnover for the year was Rs.111.28 Crores with
on operational profit of Rs.14.14 Crores and PBT of Rs.
10.50 Crores.
Company not only meets its target but also increase it
market share and company think about amalgamates.
Employees for the current year are:
Permanent Worker 402
Staff 185
Officers 156
RSO 45
Total To-Dated 2006 Employees is: 788
Company have 1000 of contact Worker. It is divided as Badali
or Special Badali.
12

AC Compressors Business:
The Capacity is 3,00,000(expanding)
The plant is certified company with ISO 9001-2000
version, ISO 14001
Models Ac applications AW
Certification VDE,
Products:
Air conditioning (12,000-29, 5000 BTU per/h
Compressors
Compressors manufactured at Hyderabad:
AW series- AW.AWQ AWA etc
Rotaries (to be introduced in 2003)
The management has started development activates in
the following areas.
a) Effluent Treatment Plant
b) Tree Plantation
c) Biological Treatment Plant
d) Rain water harvesting is to increase the group
water level and TPIPL has the distinctions of
being the first organization in this regard.
13

e) Vermin culture is the process of utilizing
canteen food wastage for converting in to
natural manual.
A new project under the name of VIBHAV
ROTARY PROJECT is under construction this
completer by the month of july 2005 on
completion of this project, the production starts
form January of 2006, with a production of
10.000 units per day with this projects, the
market share of production of compressors of
Tecumseh increase to 15%
BALLABGARH PLANT
At Faridabad, in North India, they have a capacity of about a
million compressors. This plant is being relocated to an
integrated unit a Ballagarh with an investment of Rs. 200 Crores
(Approximately) This state of the art plant for manufacturing of
non-CFC compressors will be one of the best compressors
facilities in Asia. This is located on a 21 acre land on the Delhi-
Mathura National Highway.
Mr.Vipin Sondhi, Managing Director, head Tecumseh India, which
employs about 2500 people.
Tecumseh India a 100% subsidiary of Tecumseh product
company USA wills continue its mission of offering the latest
compressors to the discerning India customers.
14

Tecumseh India is the manufacturing of compressors in the
country catering to segments of segments air-conditioners,
domestic and commercial refrigeration and is a leading player
with growing Indian market for compressors in all the segments.
The company was incorporated on Jan 30.1997 &
operational commenced since 14th July 1997, after take over
of compressor division of Whirlpool of India Limited.
The company acquired the compressor business from WOIL
by taking over the plant & equipment of the compressors
division at Faridabad and the entire facilities of Ballabgarh
excluding the plastic division of WOIL.
The acquisition was funded by equity, but since taken over,
the company supplies to WOIL its requirement of
compressor.
The company recorded a turnover of Rs. Crores since taken
over till 31st Dec 1997 since purchase by WOIL did not
materialized the turnover has been less which led to net
loss Rs. 4.93 Crores.
The company is in process of implementing a major
expansion diversification programmed at Ballabgarh to
enable the manufacture of Compressor once the project
implemented by 1988 the company would be the pioneer in
manufacturing environment.
In 1998 the company recorded a turnover of 99.98 Crores
against turnover of RS 26.12 Crores for the period July 1997
to Dec 1997.
The net loss recorded was RS.6.87 Crores against RS.4.92
Crores during 1997.
15

Refrigiration+Commercial Business:
Plant is certified ISO 9001, R-134 a certified plant, and
Own limitation, Wire drawing facilities.
With capacity of 1,500,000
Models MLA ,TIE
PRODUCTS
Domestic refrigeration (330-1200 BTU per hr) and
Commercial (700 -3000 BTU per hr)
Compressors manufactured at ballabgarh ;
TIE models
MLA models
MLA CRA model
TPIPL vision:
We are not going to simply provide compressors
are going to provide customer solution”. It is our goal to be the
global leader in all of the markets which we choose to participate
we will pursue disruptive technologies to redefine our products.
TPIPL mission :
We will leverage our global expertise in mechanical,
electrical, flood handling related components and services to
provide comprehensive solution for our customers needs
16

compressors, engines, electrical motors, pumps, electronics and
controls.
We will be best in class and the most effective cost
producer by utilizing the principles of TQM,6 SIGMA and
LEAN.
Our origination will modify itself in response to change in
environment at a pace and amount of change that can be
made without eliminating or impeding our on going
effectiveness
Incisive continuous strategic thinking will be will
communicated and shared by the organization
Incisive continuous strategic thinking will be well
communicated and shared by the organization
Our commitments:
KEY BUSINESS ACTIVITIES:
Set the world industry standard of excellence for customer
satisfaction achieve total quality
To attain and surpass global quality and reliability standards
for our products.
Maintain clear technology leadership
Market share leadership with focus on customer needs.
17

Meet business and financial commitments.
IMAGE:
To build up a high degree of customers confidence by
sustaining international markets in regard to supply of spare
parts and after sale Service. The HRD policy of Tecumseh is
manifested in the code of conduct of TPIPL listed
Respect and mutual trust
Integrity and fairness in all matters
Team work
Best customer service
TPIPL QUALITY POLICY:
Committed to total customer satisfaction by meeting their needs,
expectation.
And aspiration stated, implied or latent
Striving to provide products and service of global quality
standard and to reach a position of leadership in the field of
operations, setting new values.
Continuous improvement across the organization an up
gradation of product technology and process supportive
environment, at least cost to society share be the means to
achieve the goals.
18

The approach will be through proper systems and procedures
and total involvement of employee’s vendors and other
business associates.
TPIPL ENVIRONMENT POLICY:
The vision of Tecumseh India is to be serene green and eco
friendly co-operation carrying out all its operation
contributing to preservation of environment and natural
resources for benefit at large
Among others this can be achieved through allocation of
company wide priority for sustainable development with total
involvement and commitment.
Evaluation and up gradation of current technology products
and raw materials for minimization handling and disposal of
solid liquid and gaseous waster
Realization of tangible objective and target set for continual
improvement to control and prevent pollution and conserve
resources.
Variable earning sharing of value addition
Agreement process organization needs
Non conformance reporting audits
Open house//communication meeting
Team assessment and feed back
Changing life sty les.
SAFETY POLICY:
Education and training
Creating a safe working environment
19

Providing adequate and required personal protective
equipment
Updating safety rules and procedures
Continuous improvement through safety audits Risk
assessment Audits
The Employees and all other share:
Follow safety rules and procedures.
Use all the required personal protective equipment
Adopt safe working methods
Take a proactive interest in maintaining safety standards.
TPIPL’S SEVEN DEADLYSINS:
a) Inconsistent product quality
b) Slow response to market place.
c) Lack of innovate competitive product
d) Un competitive cost structure
e) Inadequate employee involvement
f) Unresponsive customer service
g) Ineffective resource allocation
STATEGIES&PROCESS AT TPIPL:
Work place improvement.
Creativity club
KRA’S (improvement/suggestions)
20

The management has started development activities in the
following areas.
Efficient treatment plant.
Tree plantation.
Rain water harvesting is increase the ground water level and
TPIPL has distinction of being of first organization in this
regard.
Semi culture is the process of utilizing canteen food wastage
for converting into natural manure.
QUALITY IMPROVEMENT MEASURES:
Yours company’s Hyderabad &ballabgarh plant are ISO 9001
(version 2000) certification. Your company is constantly meeting
the quality requirement of Domestic& International customers.
Environmental protection & Conservation of Natural resources:
During the year, ISO 14001 first Annual Assessment after
Recertification Audit carried out by the corporate Director of
Environment control Hyderabad unit had scored 95 points and
reveal any non conformities
During Annual C0mpliance Assurance review carried out by the
corporate Director of Environment control Hyderabad unit had
scored 95 points and Ballabgarh unit had scored 89 points of
115 for 2004
21

The following conservation measures were undertaken by your
company.
Usage of De-mineralized water in place of Municipal/Bore
water in process.
I MECO BULLOWS components cleaning equipment have
been introduced in EOU for effective cleaning of
components ot minimize water & chemicals.
Export oriented unit is completely R-134 a compatible
plant.
Energy factory canteen renovation & new kitchen
equipment installation.
Construction of new septic tank for effective treatment of
sewage water.
Mezzanine floor fabrication &erection to install Dehydration
oven.
LPG yard renovation to Accommodate 5 ton LPG bullet to
cater pre treatment plant requirements.
RESEARCH AND DE VELOPMENT:
1. Specific areas in which R & D carried out by the
company
22

Designed and development high out by the energy efficient
compressors of the existing and higher cooling capacity
Improvement in product quality
Introduced AW 1000 q Compressor for small size air
conditioners
2. Benefits derived as a result of above R&D:
Development of new products
Improvement in product quality
Optimization of processing parameters
Improved customer satisfaction and developed new
customers
Lower power expense for the customer thus reducing his
recurring ex peen
3) Future plan of action:
Design improvements
High efficiency low noise compressors
Enhanced range of compressors
Product ionization of newly developed refrigerator
compressor
1) Efforts:
Technology absorption and innovation company has
focused on innovation and is working on a refrigeration
compressor, which would be equivalent or better than the best
available in the global market .
It has upgradedits test lab facilities and reduced its
dependence on foreign test labs. This gives indigenous capability
to develop, test and launch new products.
23

2) Benefits: Derived as a result of the above efforts is product
improvement, cost reduction, product development import
substitution etc.
Departments of TPIPL:
Rotary project(new)
Human resource development
It
Welfare department
FCD
CTS&S---
TDC
Attendance and pay office(A&PO)
Electronic data processing (EDP)
Provident fund and credit cooperative society(PF&CCS)
Maintenance and engineering department(MED)
EOU
Logistics
Quality control department
AW PRESS shop
Aw machine shop
Dispensary
Canteen
Chemical and technological laboratories
Legal compliance and going beyond setting new standards
Stores
Material and purchase
Accounts and audit
24

Products of Tecumseh:
Tecumseh products are grouped into 3 principal industry
segments
Compressor products
Engine and power train products
Pump products
New products from Tecumseh:
AW 1000QC COMPRESSRS
Compact 1-ton compressors
Ideal for Compact RAC units
Products from the well known AW series of compressors
Silent and efficient
Very well accepted by the market
AE 2415 AK Compressors:
A huge energy saving compressors that cuts power bills compact
and light weight
Wide voltage range
Manufactures with state of technology
Dependable friend for all deep freezers
Finance management:
1), cadres
25

2). Functions of Finance Department
Milestones:
1961: Technical collaboration with wasting house electrical
international company USA.
1962: The name IRI was changed to USHA Refrigeration
Industrial Limited
1964: Started production of Wasting house compressors, this
is known as SRX
1966: The name of USHA refrigeration industries limited was
again changed to shri ram refrigeration industries limited
1967: Manufacturing of water coolers was added.
1969: Added manufacturing of diesel engines pumps sets
1986: started marketing electronics voltage connectors
1987: Added manufacturing of room air conditioners entered
into technical collaboration agreement with Tecumseh
products company USA worlds largest manufacturer of air
conditioning compressors.
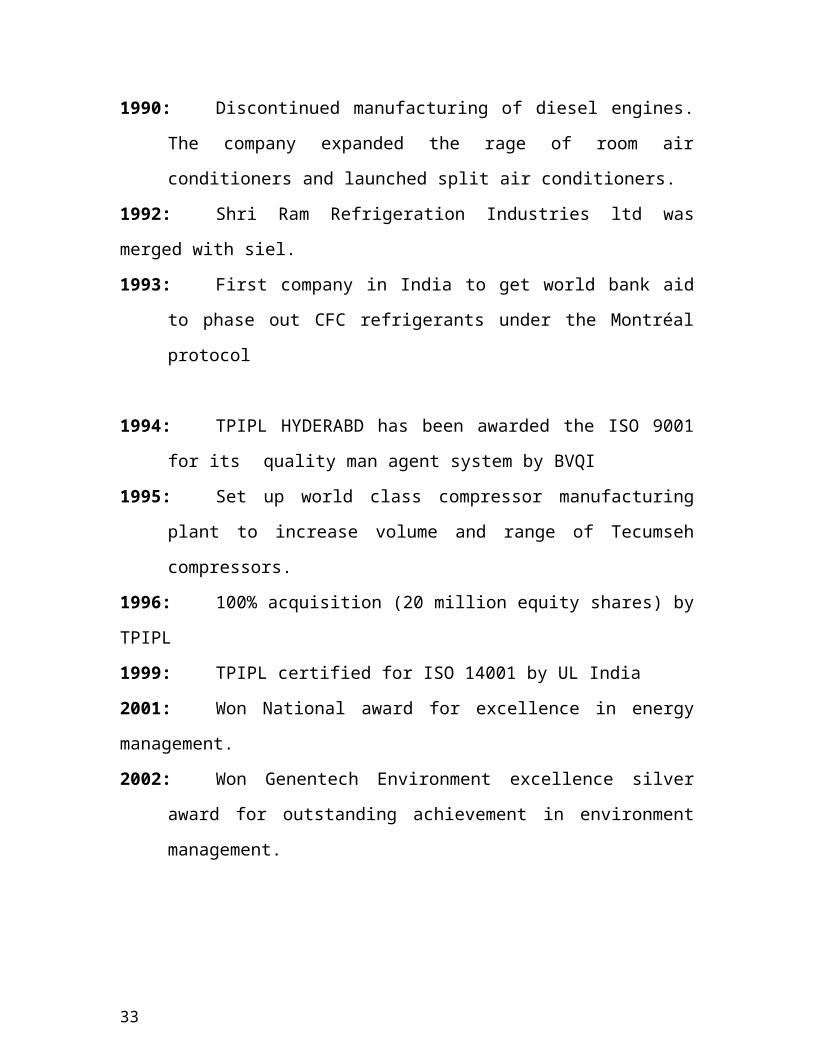
1990: Discontinued manufacturing of diesel engines. The
company expanded the rage of room air conditioners and
launched split air conditioners.
1992: Shri Ram Refrigeration Industries ltd was merged with
siel.
1993: First company in India to get world bank aid to phase
out CFC refrigerants under the Montréal protocol
26

1994: TPIPL HYDERABD has been awarded the ISO 9001 for
its quality man agent system by BVQI
1995: Set up world class compressor manufacturing plant to
increase volume and range of Tecumseh compressors.
1996: 100% acquisition (20 million equity shares) by TPIPL
1999: TPIPL certified for ISO 14001 by UL India
2001: Won National award for excellence in energy
management.
2002: Won Genentech Environment excellence silver award
for outstanding achievement in environment management.
2003: Won Genentech Environment excellence silver award
award for outstanding achievement in environment
management.
2004: TPIPL has achieved the prestigious National award for
excellence energy efficient unit conducted by CII at
Chennai.
2005: Won Genentech safety award.
27

CERTIFICATIONS:-
ISO 9001-2000 VERSION:
As Tecumseh is ISO 9001-2000 certified company it makes all the
employees aware of the OSO norms. The topics covered under
this training program are
1. Back ground to revision of ISO 9001 standards
2. Concepts used in the new standard.
3. Process based quality management system model.
4. Alignment with other standard for example ISO –EMS 14000,
health and safety
5. Overview of 9001:2000
a) Scope
b) Application normative reference
c) Terms and definitions
6. Key definitions in new standards
7. Concept of continual improvement
Under overview of 9001-2000 the program also include
information on five clauses
28

1. Quality management system: It includes
a) General requirement
b) Quality management
c) Documents requirement
d) Control of document
e) Control of records
2. Management responsibility: It includes
Management commitment
Customer focus
Quality policy
Quality objectives
Responsibility and authority
Communication
Management review
3. Resource management: It includes:
a) Provision of resources
b) Human resource competence and awareness and training
c) Infrastructure
d) Work environment
4. Product realization: It includes
a) Planning of public relations
b) Customer related process
c) Customer communication design
29

d) Purchasing
e) Control of production
f) Service provision
g) Control of monitoring
h) Measuring devices
5. Measurements analysis and improvement Monitoring
and measurement of
a) Customers
b) Internal audit
c) Procedures
d) Product
I. Control of non conforming product
II. Data analysis
III. Corrective actions and improvements
IV. Preventive action
Due to exposure to ISO 9001-2000 norms and requirement the
employees know how to carry out their work. They know about
record maintenance and its importance. Thus making all the
employees aware of these standards it will be easy for the
organizations to produce quality products.
30

CHAPTER IIICONCEPTUAL FRAMEWORK
INVENTORY MANAGEMENT
Tecumseh Products India Private Limited.
31

INTRODUCTION:
Every enterprise needs inventory for smooth running of its
activities. It server as a link between the production and
distribution process. The greater a time lag, the higher the
requirement of inventory the unforeseen fluctuation of inventory
demand and supply of goods, fluctuating inventory prices,
necessitate the need for inventory management.
The investment inventory constitutes the most significant
part of the current assets inventory of the under taking. Thus it is
very essential to have a proper control and management of
inventory.
Meaning and nature of inventory
The general meaning of inventory is stock of goods or list of
goods inventory. In accounting language it means stock of
finished goods. For inventory manufacturing concern it includes
raw materials, work in progress, consumables finished goods and
spares etc.
32
1) Raw materials:
If forms a major input inventory in organization. The
quantity of raw materials required will be determined by
the rate of consumption.
2) Work in Progress :
The work in progress is that stage of stocks, which are in
between raw materials and finished goods.
3) Consumables :
These are the material, which are needed to smoothen, the
process of production. These do not directly go into
production, but act as catalyst.
4) Finished Goods :
These are the goods, which are ready to sale for the
consumers. The stock of finished goods provides as buffer
between production and market.
5) Spares:
Spares also from a part of inventory. The stocking policies
differ from industry to industry.
Inventories cost account for nearly 55 percent of the cost of
production, as it is clear from an analysis of financial statements
of large number of private and public sector organizations. So, It
33

essential to establish suitable procedures for proper control of
materials from the time of purchase order placed with supplier
until they have been consumed properly and accounted for.
Definition:
The term inventory refers to assets, which will be sold in
future in the normal course of business operations. The
assets, which the firm stores as inventory in anticipation of
need, are raw materials, work-in-progress/process, and
finished goods.
Inventory often constitute a major element of a total working
capital and hence ft has been correctly observed, 'Good
inventory management is good financial management’.
Inventory control is a system, which ensures the provision of
the required quantity at the required time with the minimum
amount of capital.
Inventories are the second largest asset category for the
manufacturing firms next to plant and equipment.
Inventory control includes scheduling, the requirements,
purchasing, receiving and inspecting, maintaining stock
records and stock control. Inventory control is a matter of
34

coordination. A proper material control helps in improving
the input-output ratio.
Objective of inventory management
The main objective of inventory management are operational and
financial. The operational object means availability of materials
and spares in sufficient quantities for undisturbed flow of
production. The financial objective means investments in
inventories should not remain idle and minimum working capital
should be locked in it.
THE OTHER OBJECTIVES ARE:
1) To ensure continues supply of inventories to the production.
2) To avoid over stocking and under stocking.
3) To maintain optimum level of investment in inventories.
4) To keep material cost under control, to keep low cost of
production.
5) To eliminate duplication in ordering or replacing stocks.
6) To minimize losses through, deterioration, pilferage, wastage
and damages.
7) Designing structures for good inventory management.
35

8) Perpetual inventory control of materials.
9) To ensure right quality of goods at reasonable prices. Analysis
of prices cost and value.
10) To facilitate data for short and long term planning and
control of
inventory.
NEED FOR INVENTORY CONTROL:
If a cost accounting system is to be effective there must be a
proper control of inventory and supplies form the time orders
are placed with suppliers until they have been effectively
utilized in production.
Materials are equivalent to cash and they make up an
important part of the total cost. It is essential that materials
should be properly safeguarded and correctly accounted.
Proper control of material can make a substantial
contribution to the efficiency of a business. The success of a
business concern largely depends upon efficient purchasing,
storage, consumption and accounting.
In a large firm the planning and routing department is
responsible for arranging how and where the work is to be
done and issue instructions. It sets definite time schedules
so that necessary materials are delivered to the proper
36

department in proper time not too long before hand neither
lest it should interfere with other work nor after they are
required as this result in idle time.
Business firm keep inventories for different purposes. Every
firm big or small trading or manufacturing has to maintain
some minimum level of inventories. Based on some motives
the inventories are maintained.
a. Transaction motives:
Every firm has to maintain some level of inventory to meet
the day-to-day requirements of sales, production process,
customer demand etc. In this finished goods as well as raw
material are kept as inventories for smooth production
process of the firm.
b. Precautionary motive:
A firm should keep some inventory for unforeseen
circumstances also like loss due to natural calamities in a
particular area, strikes, lay outs etc so the firm must have
some finished goods as well as raw-materials tc meet
circumstances.
c. Speculative motive:
The firm may be made to keep some inventory in order to
capitalize an opportunity to make profit due to price
fluctuations.
37

REASONS AND BENEFITS OF INVENTORY:
The optimal level of maintaining inventory is a subjective
matter and depends upon the features of a particular firm,
(i) Trading firm:
In case of a trading firm there may be several reasons for
holding inventories because of sales activities that should
not be interrupted. More over it is not always possible to
procure the goods whenever there is a sales opportunity as
there is always a time gap required between purchase and
sale of goods. Thus trading concern should have some stock
of finished goods in order to under take sales activities
independent of the procurement schedule.
Similarly, a firm may have several incentives being offered in
terms of quantity discounts or lower price etc by the supplier
of goods. There is trading concern inventory helps in a de-
inking between sales activity and also to capitalize a profit of
opportunity due to purchase made at a discount will result in
lowering the total cost resulting in higher profits for the firm.
38

(ii) Manufacturing firm:
A manufacturing firm should have inventory of not only the
finished goods, but also of raw materials and work-in-
progress for following reasons.
(a) Uninterrupted production schedule:
Every manufacturing firm must have sufficient stock of raw
materials in order to have the regular and uninterrupted
production schedule. If there is stock out of raw materials in
order to have the regular and uninterrupted production
schedule. If there is stock out of raw material at any stage of
production process then the whole production may come to a
half. This may result in custom dissatisfaction as the goods
cannot be delivered in time more over the fixed cost will
continue to be incurred even ff there is no production.
Further work-in-progress would let the production process
run smooth. In most of manufacturing concerns the work in
progress is a natural outcome of the production schedule and
it also helps in fulfilling when some sales orders, even if the
supply of raw-materials have stopped.
(b) Independent sales activity:
Inventory of finished goods is required not only in trading
concern but manufacturing firms should also have sufficient
stock of finished goods. The production schedule is a time
39

consuming process and in most of the cases goods cannot be
produced just after receiving orders. Therefore, every firm
has to maintain minimum level of finished goods in order to
deliver the goods as soon as the order is received.
ESSENTIALS OF INVENTORY CONTROL:
The important requirements of Inventory control are:
a) The proper co-ordination among the departments
involved in buying, receiving, inspecting, ciorage,
consuming and accounting.
b) Centralization of purchasing under the control of
competent buyer whenever possible.
c) Proper scheduling of material requirements.
d) Proper classification of materials with codes, material
standardization and simplification.
e) The operation of a system of internal check to ensure
that all transactions involving materials and
equipment are checked by properly authorized and
independent persons.
f) The storage of materials is well planned and kept in
properly. Planned and kept in properly designated
location, subject to adequate safeguard and
supervision.
g) The operation of a system of perpetual inventory so
that it is possible to determine at any time, the
amount and value of each kind of material in stock.
40

h) A suitable method of valuation of materials is essential
because it affects the cost of jobs and the value of
closing stock of materials.
Objectives of Inventory Control:
The main objectives of inventory control are:
i. To maintain a large size of inventory for efficient and
smooth production and sales operation.
ii. To maintain a minimum investment in inventories to
maximize profitability.
iii. To ensure a continuous supply of raw materials to
facilitate uninterrupted production.
iv. To maintain sufficient stocks of raw materials in
periods of short supply and anticipate price change.
v. Maintain sufficient finished goods inventory for
smooth sales operation and efficient customer
service.
vi. Minimize the carrying cost and time.
vii. Control investment in inventories and keep it at an
optimum level.
41

Advantages of Inventory Control:
The following are suggested advantages:
I. Eliminates wastage in use of material,
II. It reduces the risk of loss from fraud and theft.
III. It helps in keeping perpetual inventory and other
records to facilitate the preparation of accurate
material reports to management,
IV. To reduces the capital tied up in inventories,
V. It reduces cost of storage,
VI. It furnishes quickly and accurately the value of
materials used in various department.
VII. It prevents delays in production due to lack of
materials by supplying, proper quantities at the right
time.
Disadvantages of Inventory Control:
Every firm has to maintain optimal level of inventories. It not
the following will be the result in form of losses.
I. Opportunity cost: Every firm has to maintain inventory for
that some investment is needed it is know as Opportunity
cost and handle the investment in inventory are more the
42

funds are blocks up with inventory.
II. Excessive inventories: It will lead to firm losses due to
excessive carrying costs and the risk of liquidity. It is also
referred as Danger level
III. Inadequate Inventory: it is another danger which results is
production hold-up and failure to meet delivery
commitments .In adequate raw materials and work -in -
process inventors will results in frequent production
interruptions .It finished goods are not sufficient customers
may shifts to competitors.
IV. Danger due to physical decoration: It is one of the reason
with the inventories due to maintaining stocks at high
levels they will be deteriorated due to passage of time,
some times due to mishandling or improper storage
facilities.
Costs involved in inventory:
Every firms maintains inventory depending upon requirement
and other features of firm for holding such inventory some
cost will be incurred there are as follows:
(a) Carrying Cost;
This is the cost incurred in Keeping or maintaining an
inventory of one unit of raw materials, work-in -process or
finished goods. Here there are two basic cost involved.
43

(i) Cost of storage:
It includes cost of storing one unit of raw materials by the
firm. This cost may be for the storage of materials. Like rent
of spaces occupied by stock, stock for security, cost of
infrastructure, cost of insurance, and cost of pilferage,
warehousing costs, handling cost etc.
(ii) Cost of financing:
This cost includes the cost of funds invested in the
inventories .It includes the required rate of return on the
investments in inventory in addition to storage cost etc. The
Carrying cost include there fore both real cost and
opportunity cost associated with the funds invested in the
inventories.
The total carrying cost is entirely variable and rise in directly
proportion to the level of inventories carried.
Total carrying cost = (carrying Cost per unit) x (Average
inventory)
(b) Cost of ordering:
The cost of ordering includes the cost of acquisitions of
inventories. It is the cost of preparation and execution of an
44

order including cost of paper work and Communicating with
the supplier.
The total ordering cost is inversely proportion to annual
inventory of firm. The ordering cost may have a fixed
component, which is not affected by the order size: and a
variable component, which changes with the order size.
Total Ordering Cost = (No.Of orders) x (cost per
order).
(c) Cost of stock out:
It is also called as Hidden cost. The stock out is the situation
when the firm is not having units of an item in stores but
there is a demand for that Item either for the customers or
the production department .The stock out refers to zero level
inventory .So there is a cost of stock out in the sense that
the firm face a situation of lost sales or back orders .The
stock outs are quite often expensive. Even the good will of
firm also be effected due to customers dissatisfaction and
may lose business in case of finished goods, where as in raw
materials or work in process can cause the production
process to stop and it is expensive because employees will
be paid for the time not spend in producing goods.
45

The carrying cost and the ordering cost are opposite forces
and collectively. They determine the level of inventors in a
firm.
Total cost =(cost of items purchased) +(Total Carrying
and ordering cost)
Valuation of Inventory:
The methods of valuing inventory are combination of the
actual cost and replacement cost plans. The chief advantage
of the cost or net realizable value rule is that it is
conservative. Hence the methods of Valuation of inventory
are quite independent of system of mincing.
In balance sheet closing stock is shown under current assets
and is also credited to manufacturing or trading accounts.
The inventories are valued on the basis as follows.
Cost of raw materials in stock may include freight
charges and carrying cost. But such cost should not
exceed market price,
46

Work -in -process is generally valued at cost, which
includes cost of materials, labor. And the proportionate
factory overhead, as it is reasonable according to degree
of completion,
Cost of finished goods wound normally to be total or full
cost it includes prime cost plus appropriate amount of
the overhead. Selling and distribution cost is deducted
on the other hand work in progress may be valued at
work in progress may be Valued at work cost, marginal
cost, prime cost or, even at direct materials.
ISSUE PRICING METHODS:
There are two categories:
(i) Cost prices:
(a) FIFO (First in First out)
(b) LIFO (last in first out)
(c) Specific price
(d) Base stock price
(e) HIFO (highest in first out)
(ii) Derived from cost prices:
(a) Simple average price
(b) Weighted average price
(c) Periodic simple average price
47
(d) Periodic weighted average price
(e) Moving simple average price
(f) Moving weighted average price
(iii) Notional prices:
(a) Standard price
(b) Inflated price
(c) Re-use price
(d) Replacement price
First in First out (FIFO)
This is the price paid for the material first taken into stock
from which the material to be priced could have been drawn.
Under this method stocks of materials may not be used up in
chronological order but for pricing purpose it is assumed that
items longest in stock are used up first. The method is most
suitable for use where in material is slow-moving and
comparatively high unit cost.
Advantages:
i. Price is based on actual cost and not on basis of
approximations such as no profits or losses arises by
reasons of adopting this method.
48

ii. The resulting stock balance generally represents fair
commercial valuation of stock.
iii. It is based on traditional principles.
Disadvantages:
i. The number of calculations in the stores ledger
involved tends to be complicated with increase in
clerical error.
ii. The cost of consecutive similar jobs will differ if the
price changes suddenly,
iii. In times of rising prices, the charge to production is
unduly low as the cost of replacing the material will
be higher.
Last in first out (LIFO)
This is the price paid for the material last taken into stock
from which the materials to be priced could have been
drawn. This method also ensure material being issued at the
actual cost. Its use is based on the principle that costs
should be as closely as possible related to current price
level. Under this method production cost is calculated on
basis on replacement cost.
Advantages:
49

i. Production is charged at the most recent prices so that it
is based on the principle that cost should be related to
current price levels.
ii. It obviates the necessity for continuously ascertaining the
replacement price.
iii. Neither profit nor loss is usually made by using this
method.
iv. In the times of rising prices there is no wind fall profit as
would have been obtained under FIFO method.
Disadvantages:
i. Needs more clerical work.
ii. Compassion among similar jobs is very difficult.
iii. Stock valves relating to prices of the oldest cost on hand
may be entirely out of the current replacement prices.
Weighted average price:
This is the price which is calculated by dividing the total cost
of material in the stock from which the material to be priced
have been drawn, by the total quantity of material in the
stock. This method differs from all other methods because
here issue prices are calculated on receipts of materials and
50

not on issue of materials. Thus as soon as new lot is received
a new price is calculated and issues are then taken.
Advantages:
i. This method is advantageous where the price varies
widely as its use even out the effect of these wide
variations.
ii. The basis of price calculations is a simple one
involving only the division of total amount of material
in stock by quantity in stock.
iii. Calculation of new prices arises only when receipt of
stocks are received.
iv. Stock records under this method give a fair indication
of the stock values, which can be used in financial
analysis.
Disadvantages:
This method is completed than simple average because it
takes into consideration the total quantities and total costs
in stock.
i. Profit or loss may be incurred as in simple average
price,
ii. As LIFO or FIFO this method calls for many
calculations,
iii. In order to calculate the accurate value of issues the
average price must normally be calculated to four to
five decimal places.
51

Standard price:
It is the predetermination of fixed price on basis of a
specification of all factors affecting price like the quantity of
materials in hand and to be normally purchased and rate of
discount compared with existing price including or excluding
freight and ware housing expense.
A standard price for each material is set and the actual price
paid is compared with standard. It is paid exceeds the
standard a loss will be realized if not profit will be obtained.
Advantages:
i. This method is easy to operate.
ii. Comparing the actual prices with the standard price
will determine the efficiency of purchase department.
iii. The effect of price variations is eliminated from job
costs.
iv. It reduces classical costs by eliminating detailed cost
records.
v. In times of inflation or price fluctuations is very
difficult to fix a standard price.
vi. This method also incurs a profit or loss on issues and
closing stock.
Inflated price:
This is the price, which includes a charge designed to
cover the cost
52

of contingencies or related costs
This price includes not only the cost involved in bringing
the material
to the purchases premises but also the loss due to
evaporation and
Breakage etc. as well as carrying costs.
MATERIAL PURCHASING AND PURCHASING PROCEDURE
Purchase of material is one of the important function of material
management. At times more than 50% of the total product cost
is material.
Functions of Purchase Department
1. Deciding the items to be purchased based on demand.
2. Selection of sources of supply.
53

3. Collection the price information.
4. Placing the ordered.
5. Follow-up the ordered.
6. Checking the invoices.
7. Maintenance of purchase records.
8. Maintenance of vendors relations.
PURCHASE PROCEDURE
Purchasing procedure start with the initiation of purchase
requisitions and ends with the receipt of materials in the stores.
CENTERIZED PURCHASING
It is most important and relevant to large organizations operating
deferent plants may or may not be located at different places.
For a single place organization decentralization might be feasible
on a very limited place. But where as M & M Ltd., is a multiple
plants operating organization.
In Mahindra and Mahindra Centralized purchasing procedure is
following to purchase of materials.
Centralized purchasing avoids duplications of efforts and
working at cross purpose from one plant to another.
Centralized purchasing permits consolidation of order of
materials commonly used for two or more plants. The
54

ultimately results in greater buying power, favorable
contracts and trade agreements.
Easier to maintain the quality of purchased parts / items
through centralized testing and inspection. It is also
possible to conduct testing and inspection facilities.
Centralized purchasing permits to avail facilities like
quantity discounts and cash discounts thus its helps to
reduce cost.
It is beneficial to vendor also in case the size of order
constituted major proportion of his total production
capacity
TECHNIQUES OF INVENTORY MANAGEMENT:
Main problems in inventory management are to answer.
(i) Are all items of inventory important if not what are
items to be given more importance?
(ii) What should be the size of the order for
55

replenishment be placed?
(iii) What should be the over level?
To answer these following techniques are used,
Economic Order Quantity
ABC Analysis
VED Analysis
RE-ORDER Level
Safety Stock
Just-in-time Inventory
ABC Analysis:
It is based on proposition that
(ii) Managerial items and efforts are scare and limited
(iii) Some items of inventory are more important than
others.
56
ABC ANALYSIS:
ABC analysis classifies various inventory into three sets or
groups of priority and allocates managerial efforts in
proportion of the priority the most important item are
classified into class-A, those of intermediate importance are
classified as "class-B" and remaining items are classified into
class-C'.
The financial manager has to monitor the items belonging to
monitor the items belonging to different groups in that order
of priority and depending upon the consumptions.
The items with the highest value is given top priority and
soon and are more controlled then low value item. The re-
rational limits are as follows.
Category % of Items % of total materials
A 5-10 70-85
B 10-20 10-20
C 70-85 5-10
Procedure:
57

(i) Items with the highest value is given top priority and
soon.
(ii) There after cumulative totals of annual value of
consumption are expressed as percentage of total
value of consumptions,
(iii) Then these percentage values are divided into three
categories.
ABC analysis helps in allocating managerial efforts in
proportion to importance of various items of inventory.
ECONOMIC ORDER QUANTITY:
After various inventory items are classified on the basis of
the ABC analysis the management becomes aware of the
type of control that would be appropriate for each of the
three categories of the inventory items.
The determination of the appropriate quantity to be
purchased in each lot to replenish stock as a solution to the
order quantity problems necessitates resolution of conflicting
goals. Buying in a higher average inventory level will assure.
(i) Smooth production / sale operation and
(ii) Lower ordering or setup costs. But it will involve
higher carrying costs. On the other hand small orders would
reduce the carrying cost of inventory by reducing the
average inventory level but the ordering costs would
58

increase, as there is a likelihood of interruption in operations
due to stock-outs. A firm should not place either too high or
small orders on the basis of a trade off between benefits
derived from the availability of inventory and the cost of
carrying that level of inventory, appropriate or optimum level
of order to be placed should be determined. The optimum
level of inventory is popularly referred to as the economic
order quantity or economic lot size. It may be defined as that
level of inventory order that minimizes the total lost
associated with inventory management. It is based on some
assumptions, which are restrictive.
a. The firm knows with certainty the annual usage of a
particular item of inventory.
b. Rate at which the firm uses inventory is steady over
time.
c. The orders placed to replenish inventory stocks are
received at exactly that point in time when inventories
reach zero.
d.
EOQ can be illustrated by
(i) Trial and error approach,
(ii) Mathematical approach.
Trial and Error approach:
59
In this approach the procedure of procuring the inventory is
assumed the smaller the lot the lower is average inventory
and vice versa and high average inventory would involve
high carrying costs. This approach is used for determination
of EOQ uses different permutations and combinations of lots
of inventory purchases so as to find out the least ordering
and carrying cost combinations. The carrying cost and
acquisition cost for different sizes of order to purchase
inventories are computed and the order size with lowest total
cost of inventory is EOQ.
Mathematical Approach:
The EOQ quantity can use a short-cut method calculated by
following
EOQ=
Where,
A = Annual usage of inventory
B = Buying cost per order
C = carrying cost per unit
Limitations:
60

While using EOQ it should be noted that it suffers from
shortcomings, which are mainly due to the restrictive nature
of the assumptions on which it is based.
The important limitation is assumption of a constant
consumption usage and, the instant replenishment of
inventory is of doubtful validity
There may be unusual and unexpected demand for stocks to
meet such [contingencies the firm has to keen additional
inventories like safety stocks. Another weakness is to
assume known annual inventories is open to question and
there is likelihood of a discrepancy between the actual and
expected demand leading to wrong estimate of EOQ.
VED ANALYSIS:
Vital Essential and Desirable analysis is done mainly for
control of spare parts keeping in view of the criticality to
production.
Vital spares are spare the stock-out of which even for a short
time will stop production for quite sometime. Essential
spares are spares the absence of which cannot be tolerated
for more than a few hours a day. Desirable spares are those,
which are needed, but their absence for even a week or so
will lead to stoppage of production.
61
THE RE-ORDER LEVEL:
The re-order level is the level of inventory at which the fresh
order for that item must be placed to procure fresh supply.
The re-order level depends upon
a) Length of time between the placement of an
order and receiving the supply.
b) The usage rate of the item. The inventory is
constantly being used up. The rate at which the
inventory is being used up. The rate at which
the inventory is being used up is called the
usage rate.
The reorder level can be determined as follows:
R = M+tu
R = Reorder level
M = Minimum level of inventory
T = Time gap / delivery time
62

U = Usage rate
The reorder level and inventory patterns have be shown as
follows:
The figure shows that if the usage rate is constant, the
orders are made at even intervals for the same amounts
each time and the inventory goes to zero just before an
order is received.
Safety Stock:
The safety stock protects firm from Trade offs due to
unanticipated demand for the items level of inventory
investment is however increased by the amount of safety
63

stock. Safety level is ascertained in inventory as a part
because there is always an uncertainty involved in time lag
usage rate or other factor.
Usually smaller the safety level greater the risk of stock-
outs. If stock-levels are predictable then there is a chance of
stock out occurring. However stock inflows and outflows are
unpredictable or lesser predictable it becomes to carry
additional safety stock to prevent unexpected stock outs so
usage rate is estimated if cost is low then no safety stock is
needed.
JUST-IN-TIME INVENTORY:
The basic concept is that every firm should keep a minimum
level of inventory on hand, relying suppliers to furnish stock
64

just in time as and when required. JIT helps in emphasizing
sufficient levels of stocks to ensure that production will not
be interrupted. Although the large inventories may be bad
idea due to heavy carrying JIT is a modern approach to
inventory management and the goal is essentially to
minimize such inventories and there by maximizing the
turnover.
JIT system significantly reduces inventory-carrying cost by
requiring that the raw materials be procured just in time to
be placed into production. Additionally the work in process
inventory is minimized by eliminating inventory is minimized
by eliminating inventory buffers between different
production departments.
If JIT is to be implemented successfully there must be a high
degree of coordination and co-operation between the
supplier and manufacturer and among different production
centers. JIT does not appear to have any relation with EOQ
however it is in fact alters some of the assumptions of EOQ
model. The average inventory level under the EOQ model is
defined as
Average inventory= 1/2 EOQ + safety level JIT attacks this
equation in two ways.
(i) By reducing the ordering cost
(ii) By reducing the safety stock.
65
The basic philosophy in JIT is that the benefits, associated
with reducing inventory and delivery time to a bare minimum
through adjustment in the EOQ model; will more than offset
the costs associated with the increased possibility of stock-
outs.
66

CHAPTER IV
DATA ANALYSIS
DETERMINATION OF STOCK LEVELS
Carrying of to much and too little of inventories is determinate to the firm. If the inventory level is too little, the
67

firm will face frequent stock – outs involving heavy ordering cost and if the inventory level of inventory where costs are the minimum and at the same time their ID.No.Stock-out, which may result in loss of sale or stoppage of production. Various stock levels are discussed below.
MINIMUM STOCK LEVEL
This is the lower limit below which the stock of any item should not normally be allowed to fall. This is also technically known as safety or buffer stock. The prime considerations in fixing the minimum stock level or safety stocks are :
a. Average rate of consumption.b. Lead time.
Minimum Stock Level = Reordering level - (Normal consumption X Normal Reorder Period)
Lead-Time :
A purchasing firm requires some time to process the order and time is also required by the supplying firm to execute the order. The time taken processing the order and the executing it is known as lead-time. It is essential to maintain some inventory during this period.
Reorder Level :
Reorder level is fixed between the minimum and maximum levels. When stock of a material reaches at this point, the store keeper should initiate action for the purchase of material. The reorder level is slightly more than minimum stock level to guard against
a. Abnormal usageb. Abnormal delay in supply
68

Reorder level = Maximum consumption X Maximum period required
during the period for delivery
MAXIMUM STOCK LEVEL :
Maximum stock level represents the upper limit beyond which the quantity of any item is not normally allowed to rise. The main object of establishing this limit is to ensure that unnecessary working capital is not blocked in stores. Theoretically, maximum stock level is the sum – total of minimum stock level and economic order quantity.
Maximum level = Reorder Level + Reordering quantity – Minimum consumption.
AVERAGE STOCK LEVEL :
The average stock level is calculated as such :
Average stock = minimum stock level + ½ of re-order quantity.
DANGER LEVEL :
This is generally fixed below the minimum stock level. Normal stock should not be below the minimum level. If it reaches the danger level at any point of time, urgent action for replenishment of stock must be taken to prevent stock out.
ESTIMATION OF STOCK LEVELS :
There are different techniques used in the calculation of the stock levels.
Reordering Quantity - 2500 units
Reordering Period - 4 – 5 weeks
69
Weekly usage :-
Maximum usage - 900 units
Normal usage - 700 units
Minimum usage - 500 units
Reordering Level = Maximum consumption X Maximum Reordering Period
= 900 X 5 = 4500 units.
Ex :- Consider “Load King” for calculation purpose.Calculated of the load king compressor as 500 units.
Normal Daily consumption = 700 units
Normal Reorder period = 4.5 weeks
Reorder level = 4500 units
Minimum usage = 500 units
Minimum Reorder period = 4 weeks
Maximum Reorder period = 5 weeks
MINIMUM STOCK LEVEL
= Reorder Level – (Normal consumption X Normal
Reorder Period)
= 4500 – (700 X 4.5)
= 4500 – 3150
= 1350 Units
MAXIMUM STOCK LEVEL
70

= Reorder Level + Reorder Quantity – (Minimum
consumption X
Minimum Reorder
Period)
= 4500 + 2500 – (500 X 4)
= 7000 – 2000
= 5000 Units
AVERAGE STOCK LEVEL
= Minimum stock + ½ of Reordering Quantity.
= 500 + (½ X 2500)
= 500 + 1250
= 1750 Units
Minimum Stock Level = 1350 Units
Average Stock Level = 1750 Units
Maximum Stock Level= 5000 Units
INVENTORY TURN OVER RATIO
“A Ratio which measures the number of times a firms average inventory is sold during a year” – Kohler.
Computation of inventory turn over ratios for different items of materials and comparison of the turnover ratios provide a useful guidance for measuring inventory performance. A high turnover rate indicates that the material in question is a fast moving one. A low turnover rate on the other hand indicates over investments and looking up of working capital on undesirable items.
71

“Inventory or Stock turnover is measured in terms of the ratio of the value of materials consumed to the average inventory during the period”. The ratio indicates the number of time the average inventory is consumed and replenished by dividing number of days for which the average inventory is held can be ascertained.
Comparing the number of days in the case of two different materials, it is possible to known which is fast moving and which slow on that basis attempt may be made to reduce the amount of capital locked up and prevent over stocking of slow moving items.
Average Inventory = Opening Stock + Closing Stock 2
Inventory turnover ratio = Material consumed Average Inventory
Inventory turnover in number of days = Number of days in a year
Inventory turnover ratio
INVENTORY TURNOVER RATIO
Cost of goods soldINVENTORY TURNOVER RATIO =------------------------------
Average inventory
(Rs in 000’s)Year Cost of goods
soldAverage inventory
Ratio
2002-03 2563442 358048 7.162003-04 2210210 439610 5.032004-05 2163508 528333 4.092005-06 2484589 596074 4.17
72
2006-07 3044561 697949 4.362007-08 4120957 1008066 4.09
INVENTORY HOLDING RATIO
365INVENTORY HOLDING RATIO=---------------
Inventory turnover ratio(Rs in 000’s)
Year Days Inventory turn over ratio
Inventory holding ratio
2002-03 365 7.16 512003-04 365 5.03 732004-05 365 4.09 892005-06 365 4.17 882006-07 365 4.36 842007-08 365 4.09 89
Ratio
7.76
5.034.09 4.17 4.36 4.09
0
1
2
3
4
5
6
7
8
9
2002-03 2003-04 2004-05 2005-06 2006-07 2007-08
Ratio
73

INVENTORY ANALYSIS AT TECUMSEH INDIA PRODUCTS PVT.LTD
(Rs in 000’s)Year Inventory Current assets % in inventory
&CA2002-03 495036 909946 54.402003-04 561630 1078274 52.092004-05 630518 1500977 42.012005-06 765380 1688733 45.322006-07 1250752 2307604 54.202007-08 1312456 2504689 55.23
Inventory holding ratio
51
7389 88 84 89
0102030405060708090
100
2002-03
2003-04
2004-05
2005-06
2006-07
2007-08
Inventory holding ratio
74

% in inventory &CA
54.4 52.0942.01 45.32
54.2 55.23
0
10
20
30
40
50
60
1 2 3 4 5 6 7 8
% in inventory &CA
YEARS 2008 2007 2006 2005 2004 2003
Opening Inventory (Rs. In Lakhs)
49970
45675
46904
55253
51554
43697
Closing Inventory(Rs. In Lakhs)
75983
49970
45675
46904
55253
51554
INVENTORY TURNOVER RATIO
YEARS
INVENTORY
CONSUMED (Rupees in Lakhs)
AVERAGE INVENTOR
Y(Rupees in
Lakhs)
INVENTORY
TURNOVER RATIO
INVENTORY
TURNOVER IN
NUMBER OF DAYS
75

March – 2008
459537.10
49970 + 75983
2= 62976.5
459537.1062976.5= 7.296
365..7.296
= 50.027
March – 2007
335286.52
45675 + 49970
2= 47822.5
335286.5247822.5= 7.01
366..7.01
= 52.21
March – 2006
250021.84
46904 + 45675
2= 46389.5
250021.8446389.5= 5.389
365..5.389
= 67.73
March – 2005
211723.1
55253 + 46904
2= 51078.5
211723.151078.5= 4.145
365..4.24
= 88.05
March – 2004
235858.13
51554 + 55253
2= 53403.5
235858.1353403.5= 4.416
365..4.41
= 82.65
March – 2003
221023.23
53697 + 51554
2= 47625.5
221023.2347625.5= 4.64
366..4.64
= 78.87
76

INVENTORY TURNOVER RATIO
4.64 4.416 4.1455.389
7.01 7.296
012345678
2003 2004 2005 2006 2007 2008
YEARS
% O
F
INV
EN
TO
RY
INVENTORY TURNOVER RATIO
INVENTORY TURNOVER RATIO
4.64 4.416 4.1455.389
7.01 7.296
012345678
2003 2004 2005 2006 2007 2008
YEARS
% O
F I
NV
EN
TO
RY
INVENTORY TURNOVER RATIO
77

INVENTORY IN NUMBER OF DAY
78.87 82.65 88.05
67.7352.21 50.027
0
20
40
60
80
100
2003 2004 2005 2006 2007 2008
YEARS
INVENTORY IN NUMBER OF DAY
78
I NV
EN
TO
RY
IN
NU
MB
E R O
F D
AY
S

INERPRETATION:
A high turnover ratio indicates that the material in question is a
fast moving one and also a low amount of stocks are replacing
stocks in large number of installment. In the year 2006, 2007,
2008, the stock turnover ratio is gradually decreasing and the
inventory faced a bad position in these three years. And from
2003, 2004, 2005, the stock turnover ratio continuously
increased from 5.38 to 7.296 and the inventory in number of
days is low. This position indicates that the stocks are fast
moving and get converted in to sales quickly.
INVENTORY IN NUMBER OF DAY
78.87 82.65 88.05
67.7352.21 50.027
0
20
40
60
80
100
2003 2004 2005 2006 2007 2008
YEARS
INV
EN
TO
RY
IN
NU
MB
ER
OF
DA
YS
INVENTORY IN NUMBER OF DAY
79

COMPRESSOR PRODUCTION AND DISPATCH
YEAR
COMPRESSOR PRODUCTION (QUANTITY IN
MIL.UNITS)
COMPRESSOR DISPATCH
(QUANTITY IN MIL.UNITS )
MARCH 31ST 2006 25,797 25,416
MARCH 31ST 2007 34,186 33,766
MARCH 31ST 2008 33,630 33,885
COMPRESSOR PRODUCTION & DISPATCH
0
5000
10000
15000
20000
25000
30000
35000
40000
2006 2007 2008
YEARS
P R O D U C TI
O N
&
DIS
PAT
CH
Production
Dispatch
80

INERPRETATION:
The inflow of raw materials and dispatch of finished goods from
the organization is in good position. In march 31st 2006 the
difference between the compressor production and dispatched is
381 and in march 31st 2005 the close stock in the go down is also
dispatched from the organization and as well as in the year 2007
31st march the stored compressors are dispatched from the
company. This indicates that the consuming storage cost is very
low and risk related to preservation of the stock is very less.
81

CHAPTER VFINDINGS
82

FINDINGS
On the personnel interaction with the financial department as
well as with the primary and secondary arrived they are :
1. The analysis is carried out for a period of five years i.e
2003-2004 to 2007-2008 is not sufficient to conclude the
inventory positions of the company as well taken up to
study for a period of 6 weeks Is too less still we strived
out best in exploiting the present inventory positions of
the company
2. Inventory valuations is followed in weighted average
method based on cost concept of the project costing is
undertaken.
3. The inventory is different items of production hence ABC
analysis and two bin system are followed
4. Some items are found to be slow and non moving the
slow moving items are spare and consumable goods
hence whenever necessary arises these items are being
used non moving items are also found in the inventory.
5. The reasons for non moving of inventory from stores are
studied. Due to MOQ(Minimum order quantity) clause
these items procured extra than the requirement.
6. The high inventory turnover ratio at indicates efficiency
of the firms inventory management
7. The material consumption was also increasing
simultaneously with sales.
83

8. The company s efficiency in turning its inventory is
increasing. The companies utilization of inventory in
generating sales is good they yearly holing of all types of
inventory is decreasing this is positive trend
9. The company efficiency in turning the inventory is
increasing the company’s utilization of inventory in
generating sales is good the yearly holing of all types of
inventory is decreasing this is positive trend.
10. The over all inventory position of the company is
satisfactory.
84

CONCLUSIONS
CONCLUSIONS
85

To days business scenario inventory management is
becoming very crucial part of the organization. The system of
inventory management in Tecumseh India products private
limited very effective. The organization is basically and
assembling unit and thus inventory place a most significant role
in the decision making process. From the various calculations
and figures relating to inventory management it is clear that the
inventory classification of A items are maintain for 1 – 3 days, as
a result it reduce investment in raw material, reducing the lead
time and also the large quantity discount because the stock are
kept for 1 – 3 days.
In the classification of ABC items XYZ procedure is following
in Tecumseh Plant has launched the different type of KANBAN
card system for class C items.
Class A & B items are consider under the just in time
philosophy as the procurement time has been reduced up to
greater extent by the proper co-ordination of buyer and supplier.
There is great improvement in the inventory turnover ratio
from 3 years. It is increased from 5.38 to 7.296% this position
indicates that the stocks are fast moving and get converted into
sales quickly in Tecumseh India Products Private Limited
Finally we conclude that Tecumseh India products Private
limited plant the inventory system is very good with high
Japanese techniques.
86

BIBLIOGRAPHY
BIBLIOGRAPHY :
87

* Cost Accounting – V.K. Saxena C.D. Vashist
* Cost Accounting - S.P. Iyenger
* Cost Accounting - S.N. Maheshwari
* Financial Management - Khan & Jain
* Cost ManagementAccounting - R.P. Thrivadi
Websites:
www.google.comwww.yahoofinance.comwww.Tecumseh.comwww.msn.com
88