Introduction to the PROMIS -Preference (PROPr) Summary Score · Introduction to the PROMIS...
42
Introduction to the PROMIS-Preference (PROPr) Summary Score Janel Hanmer, MD, PhD Barry Dewitt, PhD September 27, 2017
Transcript of Introduction to the PROMIS -Preference (PROPr) Summary Score · Introduction to the PROMIS...
Introduction to the PROMIS-Preference (PROPr) Summary ScoreJanel Hanmer, MD, PhDBarry Dewitt, PhD
September 27, 2017

Funding• I am supported by the National Institutes of Health
through Grant Number KL2 TR000146. • Data collection was supported the National Institutes of
Health through Grants Number UL1TR000005 and 3U54AR057951-04S4.
• I have no conflicts of interest to report.
Collaborators• David Cella – Northwestern • David Feeny – McMaster University• Baruch Fischhoff – Carnegie Mellon• Ron Hays – UCLA• Rachel Hess – University of Utah• Paul Pilkonis – University of Pittsburgh• Dennis Revicki – Evidera• Mark Roberts – University of Pittsburgh• Joel Tsevat – University of San Antonio • Lan Yu – University of Pittsburgh
Why Make A Preference-Based Score?• Descriptive health systems cannot indicated our
preferences
• Preference is a common metric to compare disparate domains of health
• Health utility scores can be integrated with life expectancy to generate Quality Adjusted Life Years (QALY)
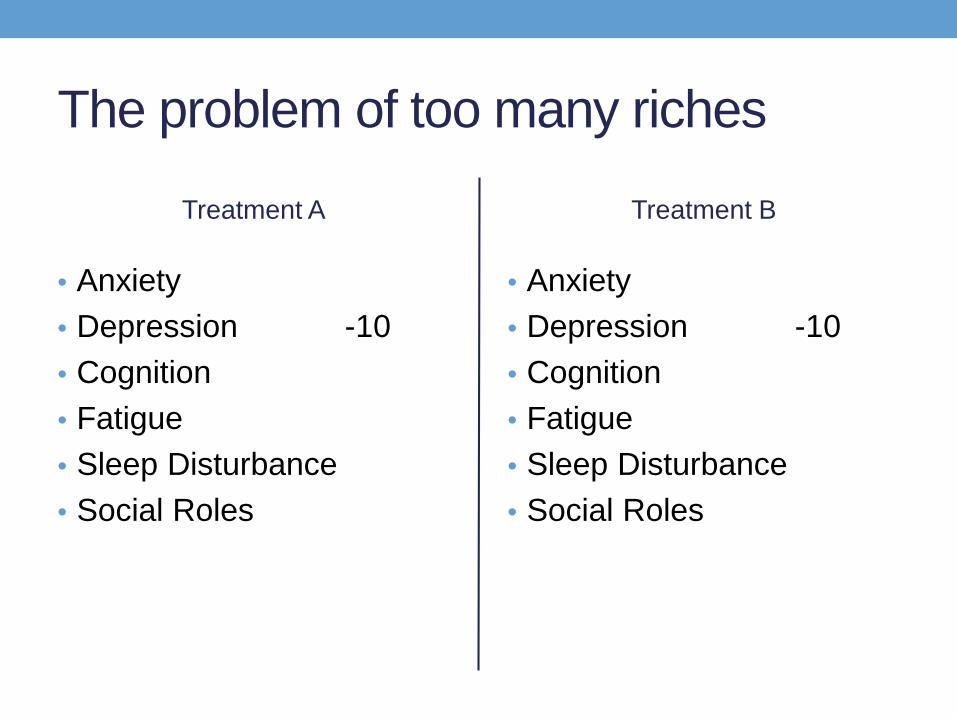
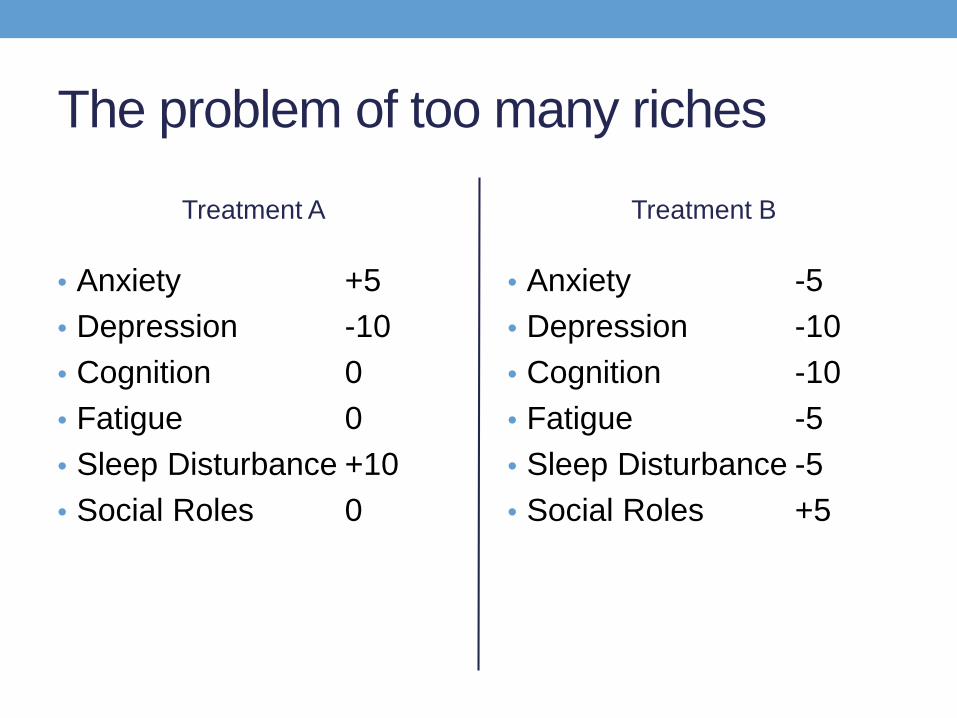
The problem of too many riches
Treatment A
• Anxiety• Depression -10• Cognition• Fatigue• Sleep Disturbance• Social Roles
Treatment B
• Anxiety• Depression -10• Cognition• Fatigue• Sleep Disturbance• Social Roles
The problem of too many riches
Treatment A
• Anxiety +5• Depression -10• Cognition 0• Fatigue 0• Sleep Disturbance +10• Social Roles 0
Treatment B
• Anxiety -5• Depression -10• Cognition -10• Fatigue -5• Sleep Disturbance -5• Social Roles +5
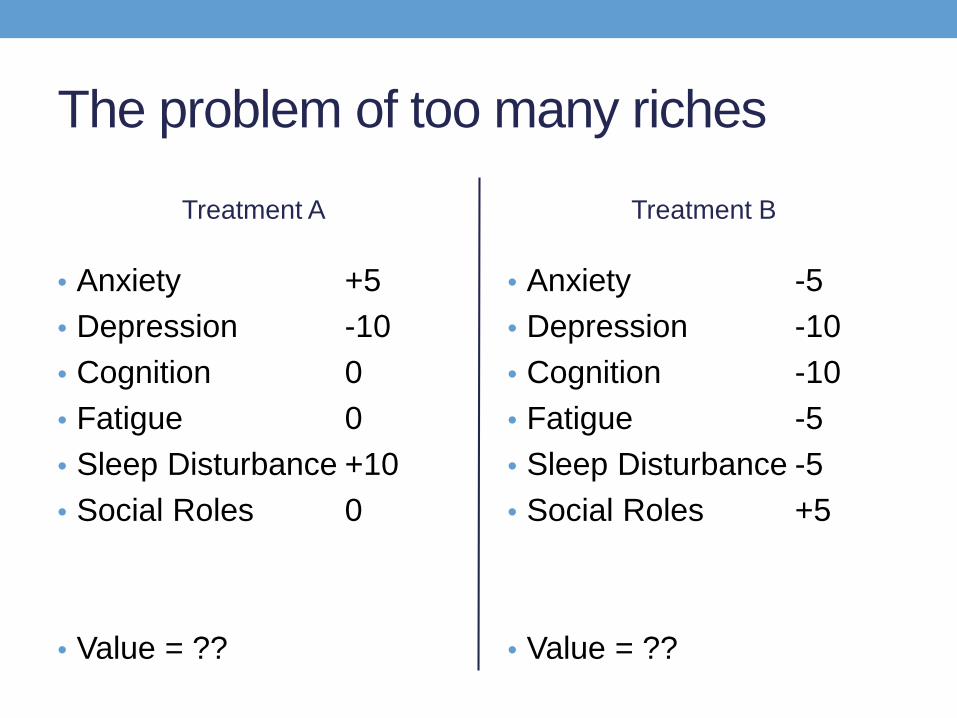
The problem of too many riches
Treatment A
• Anxiety +5• Depression -10• Cognition 0• Fatigue 0• Sleep Disturbance +10• Social Roles 0
• Value = ??
Treatment B
• Anxiety -5• Depression -10• Cognition -10• Fatigue -5• Sleep Disturbance -5• Social Roles +5
• Value = ??
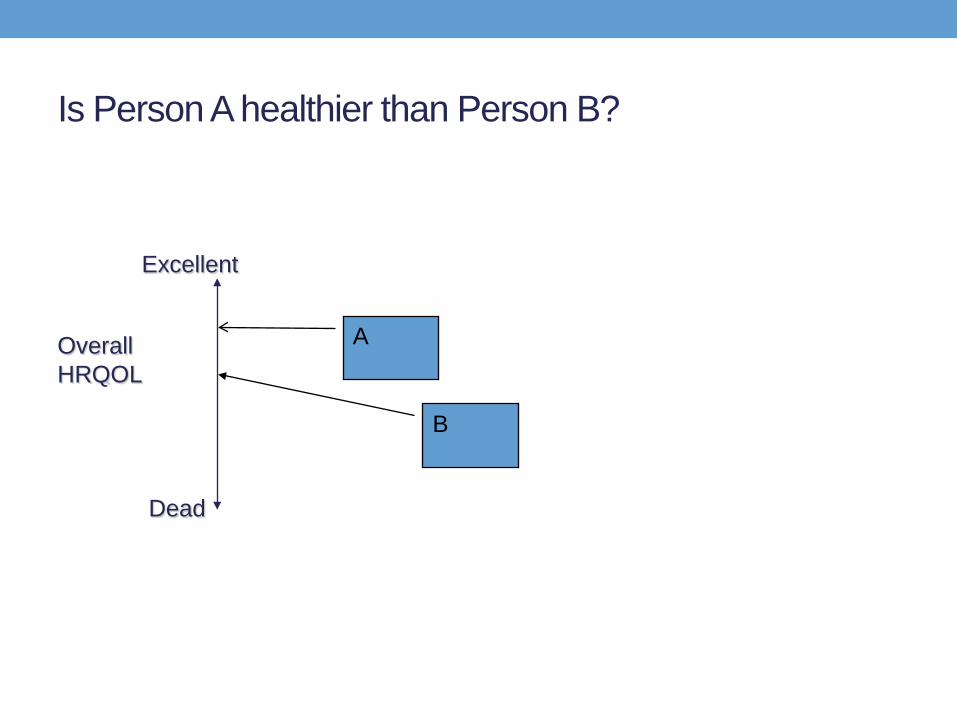
Is Person A healthier than Person B?
Dead
Excellent
Overall HRQOL
A
B
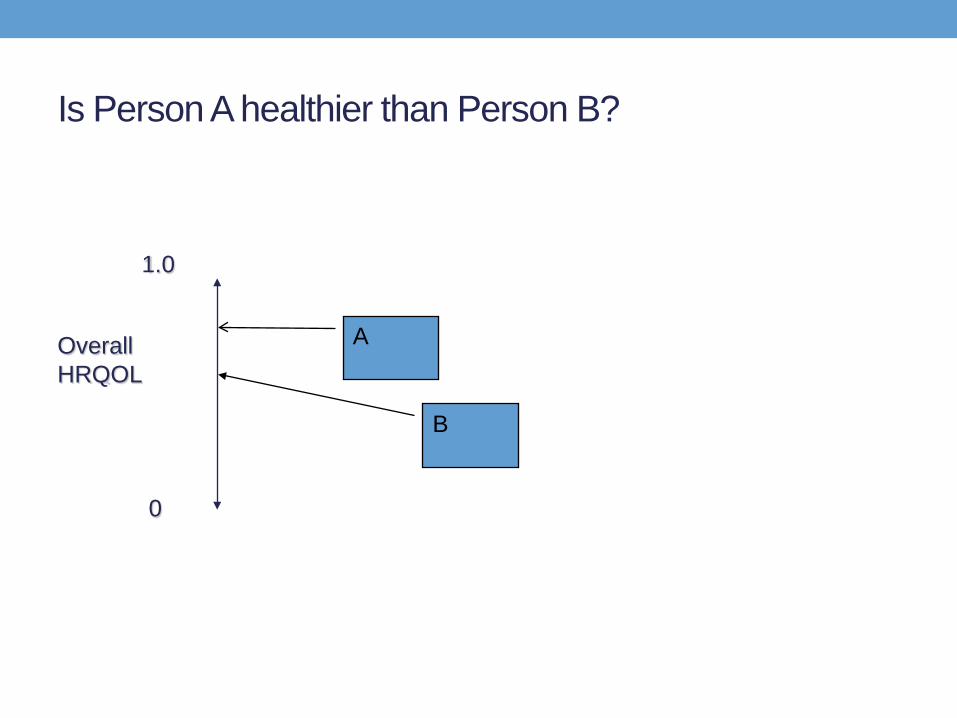
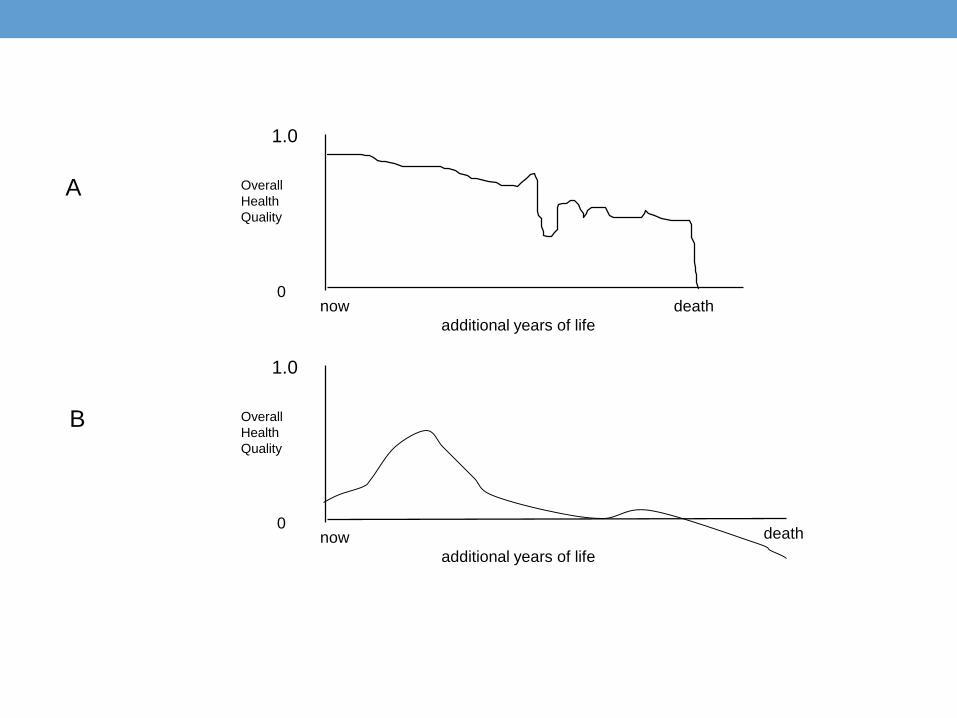
Is Person A healthier than Person B?
0
1.0
Overall HRQOL
A
B
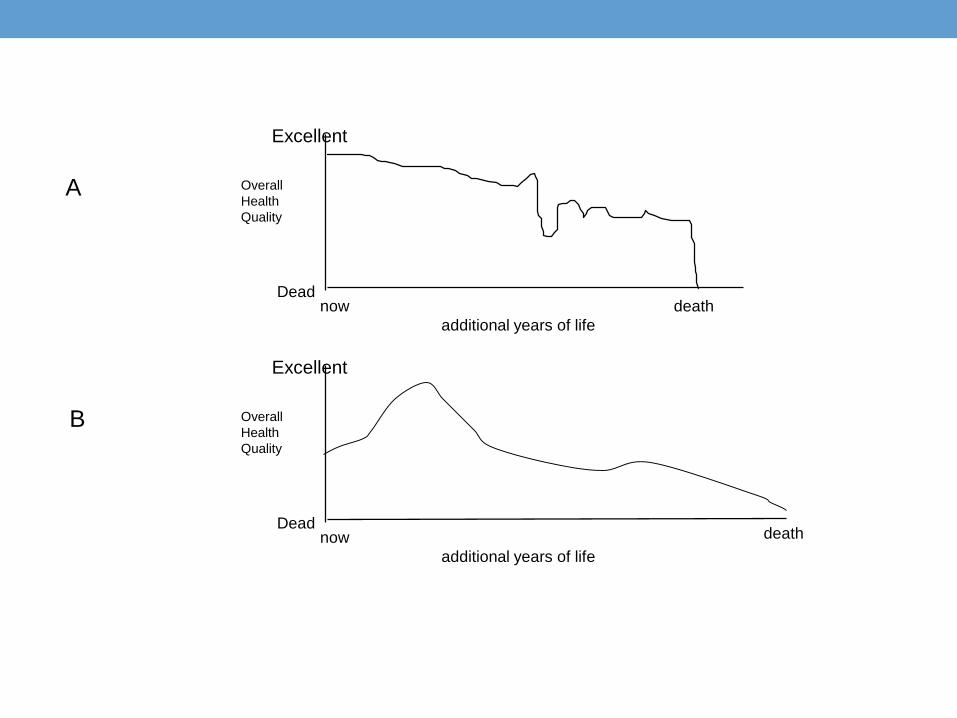
Dead
Excellent
Overall HealthQuality
additional years of lifenow death
A
B
Dead
Excellent
Overall HealthQuality
additional years of lifenow death
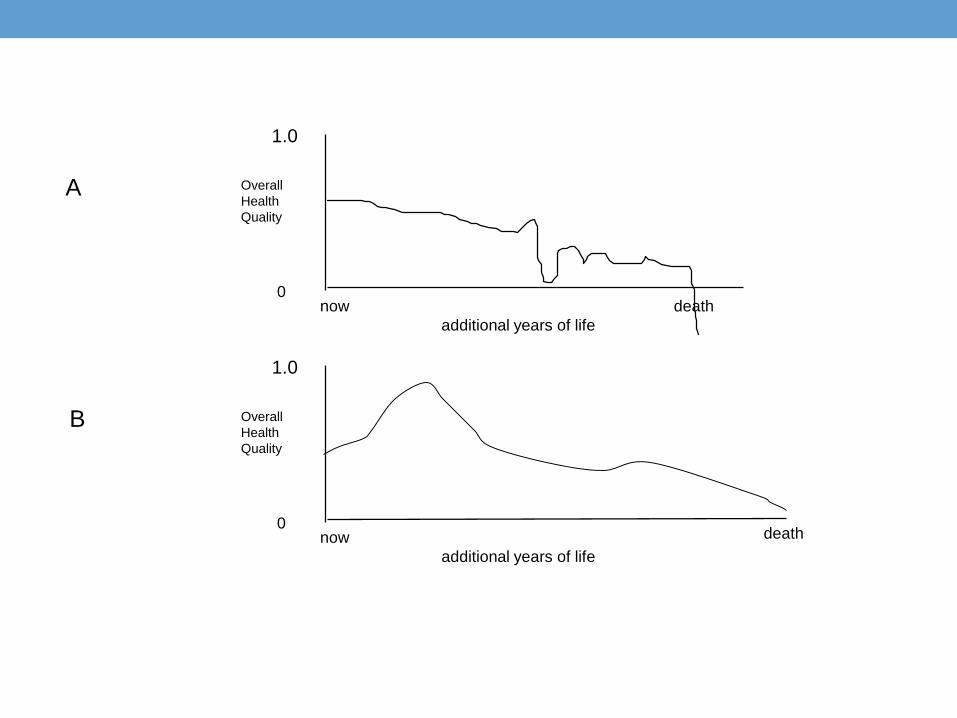
0
1.0
Overall HealthQuality
additional years of lifenow death
A
B
0
1.0
Overall HealthQuality
additional years of lifenow death
0
1.0
Overall HealthQuality
additional years of lifenow death
A
B
0
1.0
Overall HealthQuality
additional years of lifenow death
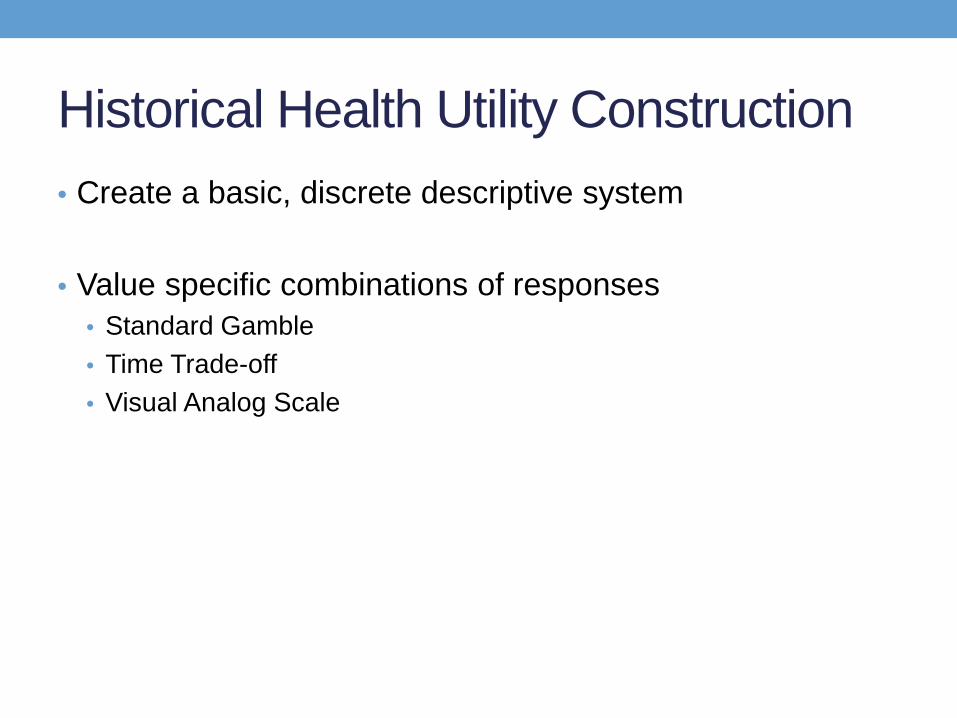
Historical Health Utility Construction• Create a basic, discrete descriptive system
• Value specific combinations of responses• Standard Gamble• Time Trade-off• Visual Analog Scale
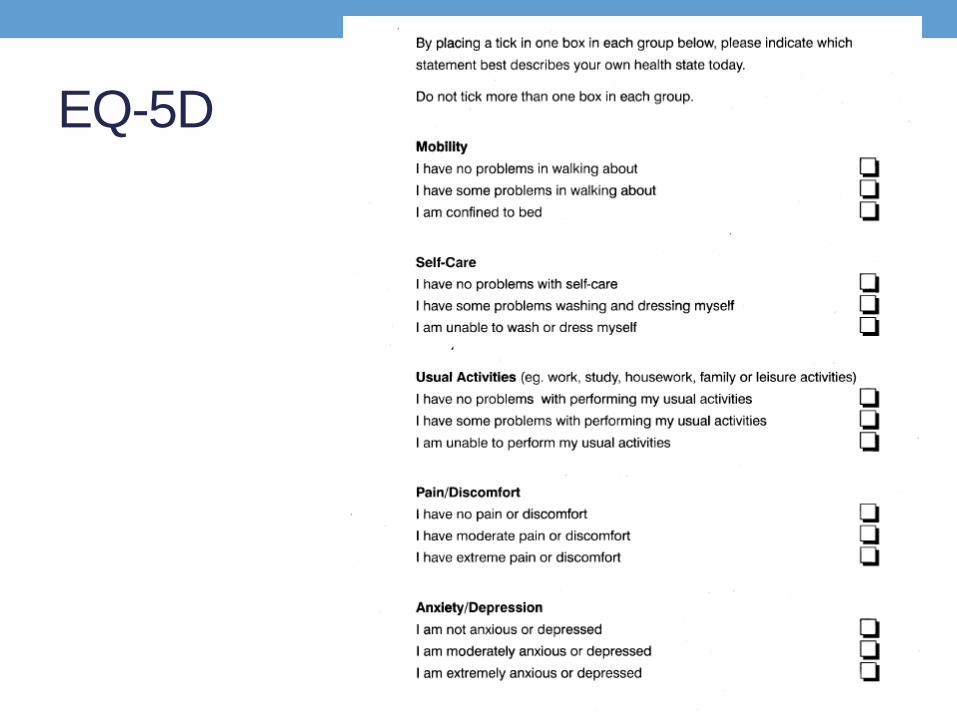
EQ-5D
Is that actually useful??• Vast literature showing these measures capture
movement in the same direction as more complex measures.
• No one thinks this is the only thing you should pay attention to.
• We use lots of useful coarse measures:• There are about 5,000 public companies in the US• The Dow Jones average uses 30
Problems with Prior Utility Measures• Ceiling and floor effects
• Too coarse for individual tracking or decision making
• Some with poorly constructed questions
• Some were proprietary
• Difficult to combine results from different measures

Problems Solved with PROMIS ®
• Ceiling and floor effects
• Too coarse for individual tracking or decision making
• Some with poorly constructed questions
• Some were proprietary
• Difficult to combine results from different measures
• So, we just need to put a utility measure on it . . .
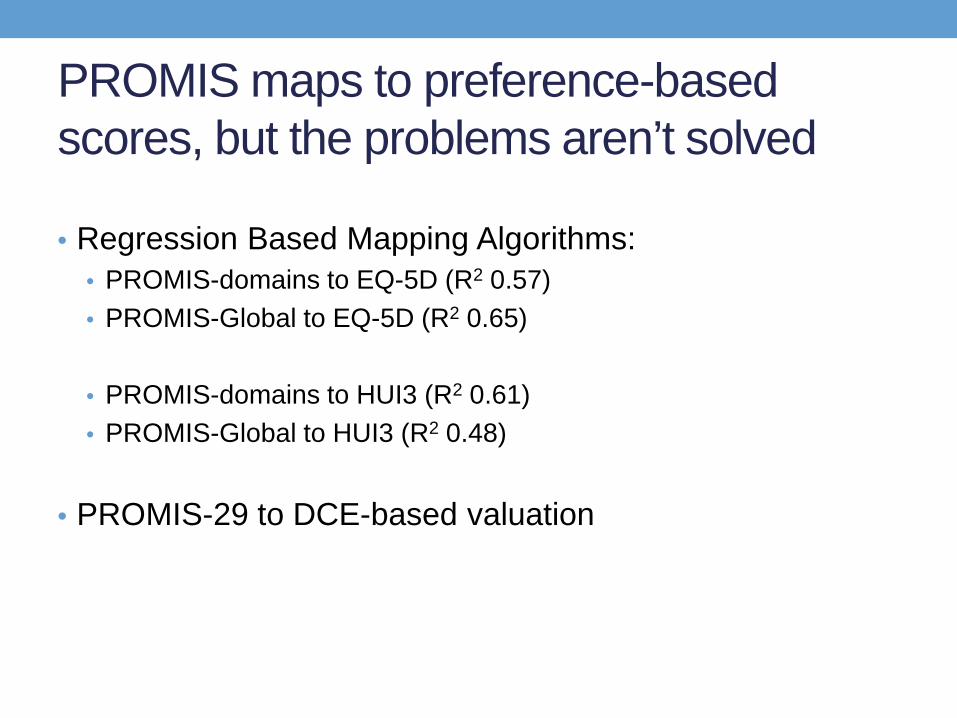
PROMIS maps to preference-based scores, but the problems aren’t solved
• Regression Based Mapping Algorithms:• PROMIS-domains to EQ-5D (R2 0.57)• PROMIS-Global to EQ-5D (R2 0.65)
• PROMIS-domains to HUI3 (R2 0.61)• PROMIS-Global to HUI3 (R2 0.48)
• PROMIS-29 to DCE-based valuation
Our Solution?• Use PROMIS item banks as the descriptive underpinnings
for a preference-based score
• This will allow simultaneous collection of descriptive scores and a preference-based summary score
• Value the function using a sample of the US
A preference-based score in 5 simple steps1. Select domains2. Figure out how to display domains3. Collect valuation data4. Create single-attribute scores5. Create a multi-attribute score
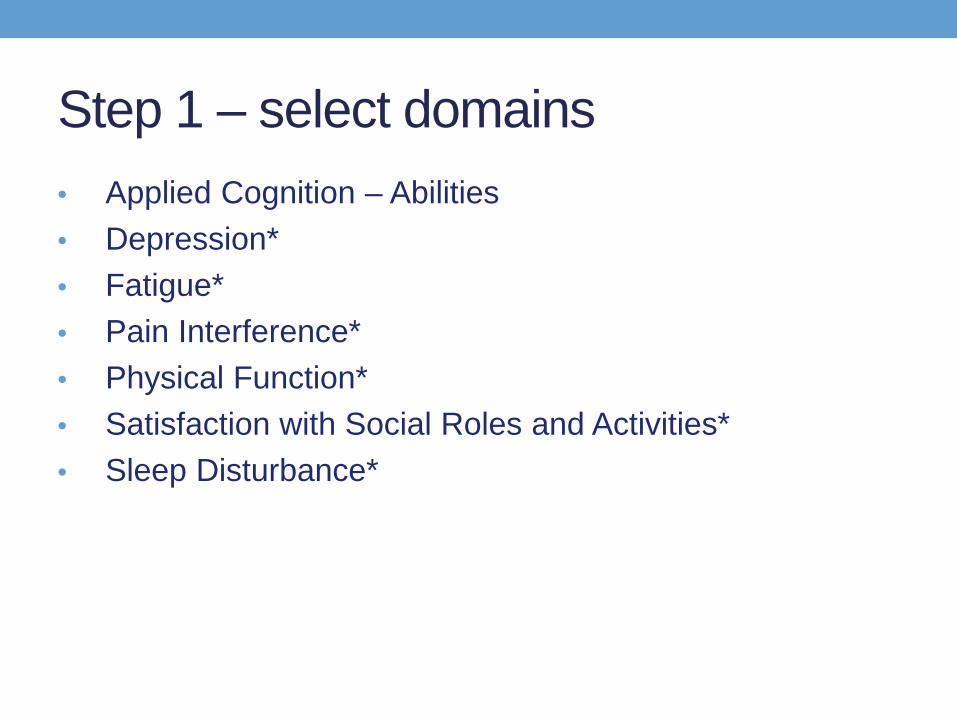
Step 1 – select domains• Applied Cognition – Abilities• Depression*• Fatigue*• Pain Interference*• Physical Function*• Satisfaction with Social Roles and Activities*• Sleep Disturbance*
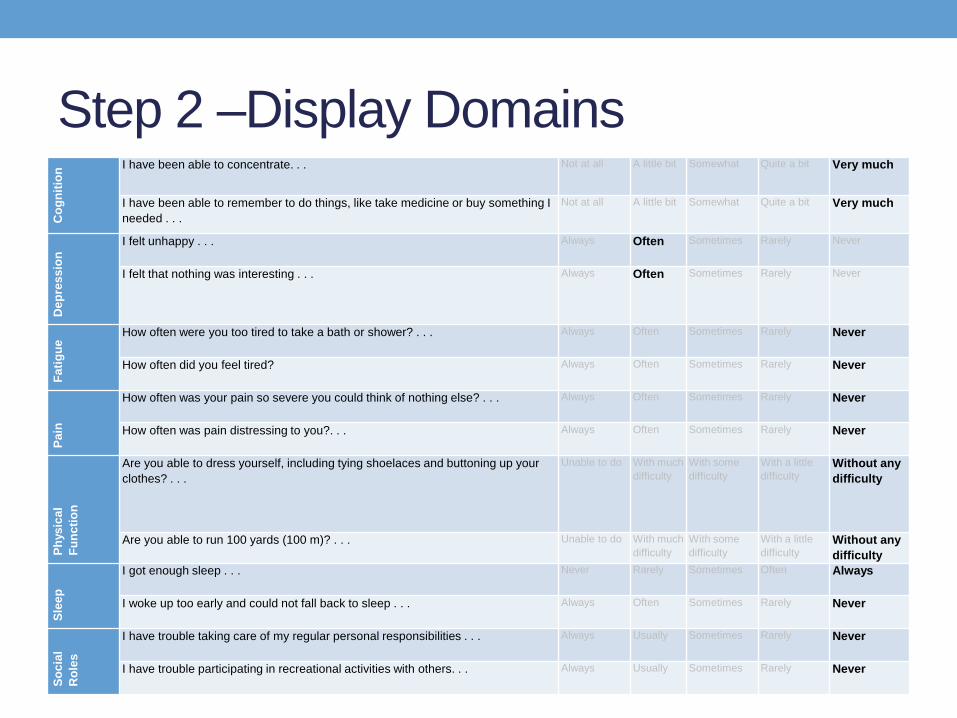
Step 2 –Display DomainsC
ogni
tion I have been able to concentrate. . . Not at all A little bit Somewhat Quite a bit Very much
I have been able to remember to do things, like take medicine or buy something I needed . . .
Not at all A little bit Somewhat Quite a bit Very much
Dep
ress
ion
I felt unhappy . . . Always Often Sometimes Rarely Never
I felt that nothing was interesting . . . Always Often Sometimes Rarely Never
Fatig
ue
How often were you too tired to take a bath or shower? . . . Always Often Sometimes Rarely Never
How often did you feel tired? Always Often Sometimes Rarely Never
Pain
How often was your pain so severe you could think of nothing else? . . . Always Often Sometimes Rarely Never
How often was pain distressing to you?. . . Always Often Sometimes Rarely Never
Phys
ical
Fu
nctio
n
Are you able to dress yourself, including tying shoelaces and buttoning up your clothes? . . .
Unable to do With much difficulty
With some difficulty
With a little difficulty
Without any difficulty
Are you able to run 100 yards (100 m)? . . . Unable to do With much difficulty
With some difficulty
With a little difficulty
Without any difficulty
Slee
p
I got enough sleep . . . Never Rarely Sometimes Often Always
I woke up too early and could not fall back to sleep . . . Always Often Sometimes Rarely Never
Soci
al
Rol
es
I have trouble taking care of my regular personal responsibilities . . . Always Usually Sometimes Rarely Never
I have trouble participating in recreational activities with others. . . Always Usually Sometimes Rarely Never
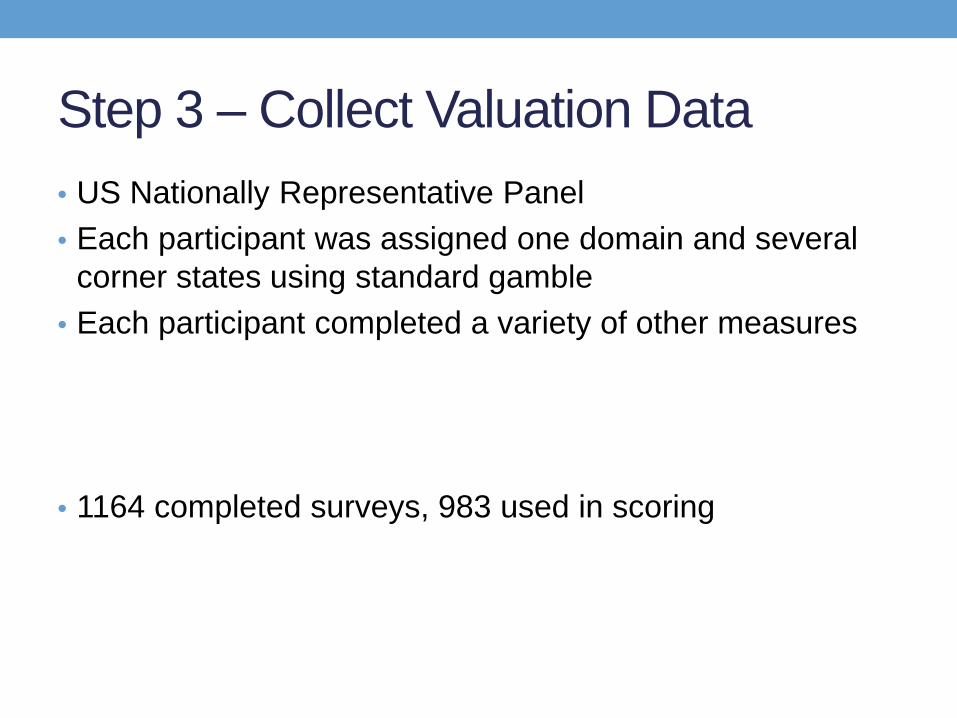
Step 3 – Collect Valuation Data • US Nationally Representative Panel• Each participant was assigned one domain and several
corner states using standard gamble• Each participant completed a variety of other measures
• 1164 completed surveys, 983 used in scoring
WARNING
These scores represent average societal preferencesNOT the preferences of individuals
DO NOT USE FOR INDIVIDUAL DECISION MAKING
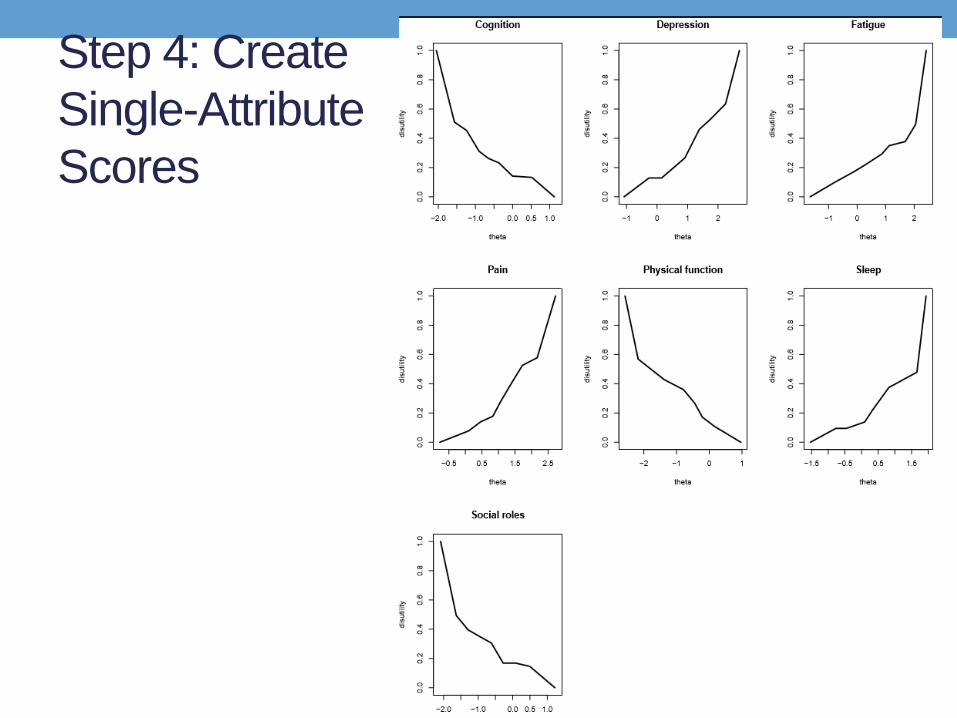
Step 4: Create Single-Attribute Scores
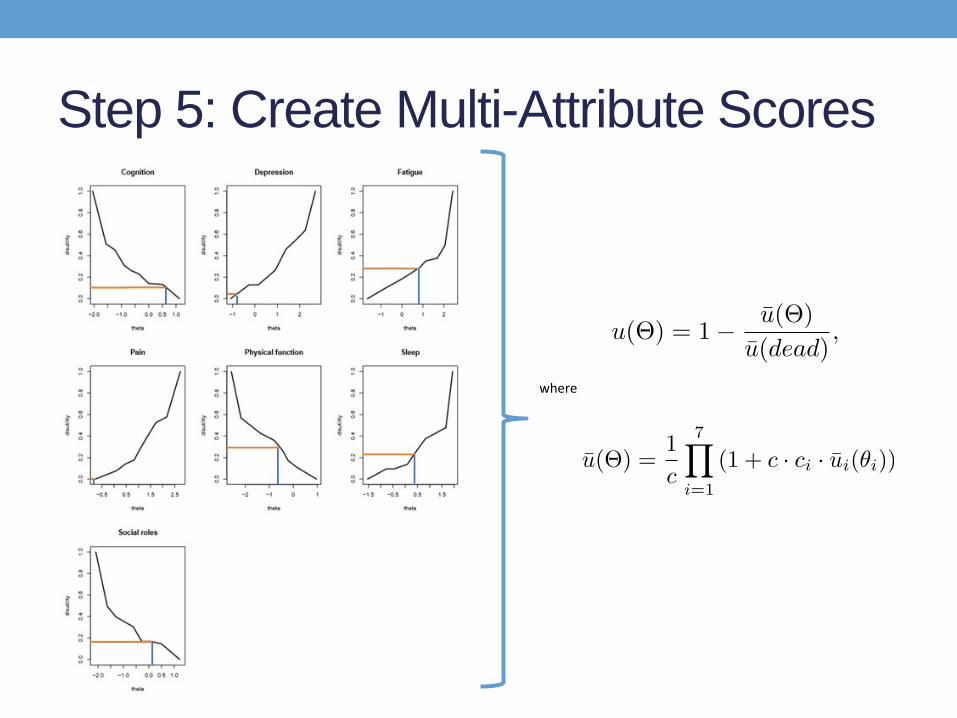
Step 5: Create Multi-Attribute Scores
where
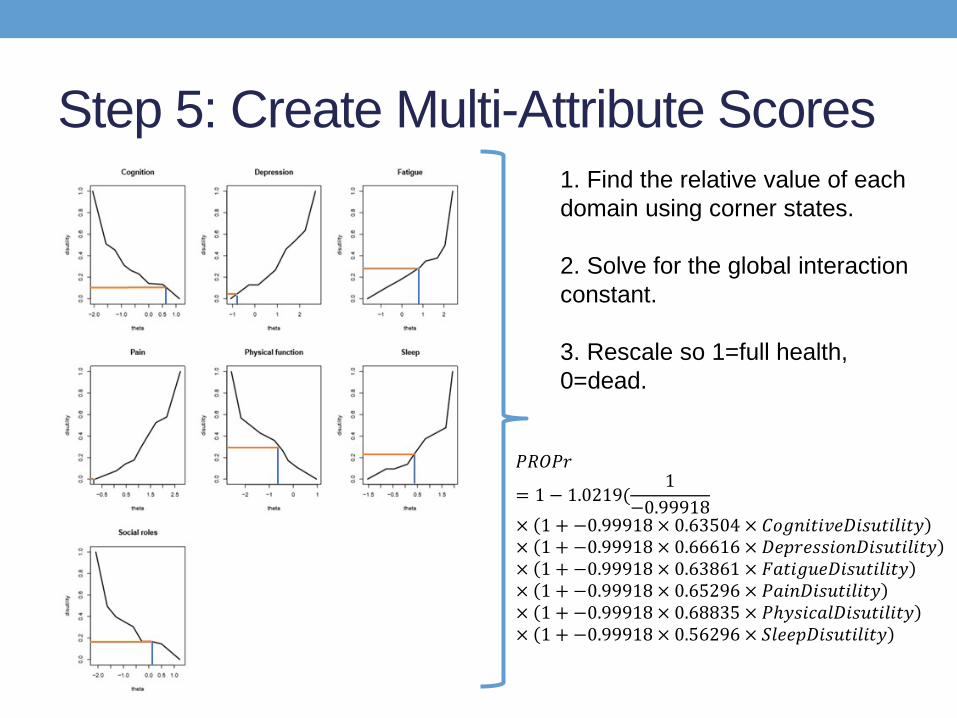
Step 5: Create Multi-Attribute Scores1. Find the relative value of each domain using corner states.
2. Solve for the global interaction constant.
3. Rescale so 1=full health, 0=dead.
𝑃𝑃𝑃𝑃𝑃𝑃𝑃𝑃𝑃𝑃
= 1 − 1.0219(1
−0.99918× 1 + −0.99918 × 0.63504 × 𝐶𝐶𝐶𝐶𝐶𝐶𝐶𝐶𝐶𝐶𝐶𝐶𝐶𝐶𝐶𝐶𝐶𝐶𝐶𝐶𝐶𝐶𝐶𝐶𝐶𝐶𝐶𝐶𝐶𝐶𝐶𝐶𝐶𝐶𝐶𝐶𝐶𝐶× 1 + −0.99918 × 0.66616 × 𝐶𝐶𝐶𝐶𝐷𝐷𝑃𝑃𝐶𝐶𝐶𝐶𝐶𝐶𝐶𝐶𝐶𝐶𝐶𝐶𝐶𝐶𝐶𝐶𝐶𝐶𝐶𝐶𝐶𝐶𝐶𝐶𝐶𝐶𝐶𝐶𝐶𝐶𝐶𝐶× 1 + −0.99918 × 0.63861 × 𝐹𝐹𝐹𝐹𝐶𝐶𝐶𝐶𝐶𝐶𝐶𝐶𝐶𝐶𝐶𝐶𝐶𝐶𝐶𝐶𝐶𝐶𝐶𝐶𝐶𝐶𝐶𝐶𝐶𝐶𝐶𝐶𝐶𝐶× 1 + −0.99918 × 0.65296 × 𝑃𝑃𝐹𝐹𝐶𝐶𝐶𝐶𝐶𝐶𝐶𝐶𝐶𝐶𝐶𝐶𝐶𝐶𝐶𝐶𝐶𝐶𝐶𝐶𝐶𝐶𝐶𝐶× 1 + −0.99918 × 0.68835 × 𝑃𝑃𝑃𝐶𝐶𝐶𝐶𝐶𝐶𝑃𝑃𝐹𝐹𝐶𝐶𝐶𝐶𝐶𝐶𝐶𝐶𝐶𝐶𝐶𝐶𝐶𝐶𝐶𝐶𝐶𝐶𝐶𝐶𝐶𝐶× 1 + −0.99918 × 0.56296 × 𝑆𝑆𝐶𝐶𝐶𝐶𝐶𝐶𝐷𝐷𝐶𝐶𝐶𝐶𝐶𝐶𝐶𝐶𝐶𝐶𝐶𝐶𝐶𝐶𝐶𝐶𝐶𝐶𝐶𝐶
Wait, what?
It is simpler than it soundsStep 1 – Get domain scoresStep 2 – Plug in to available code
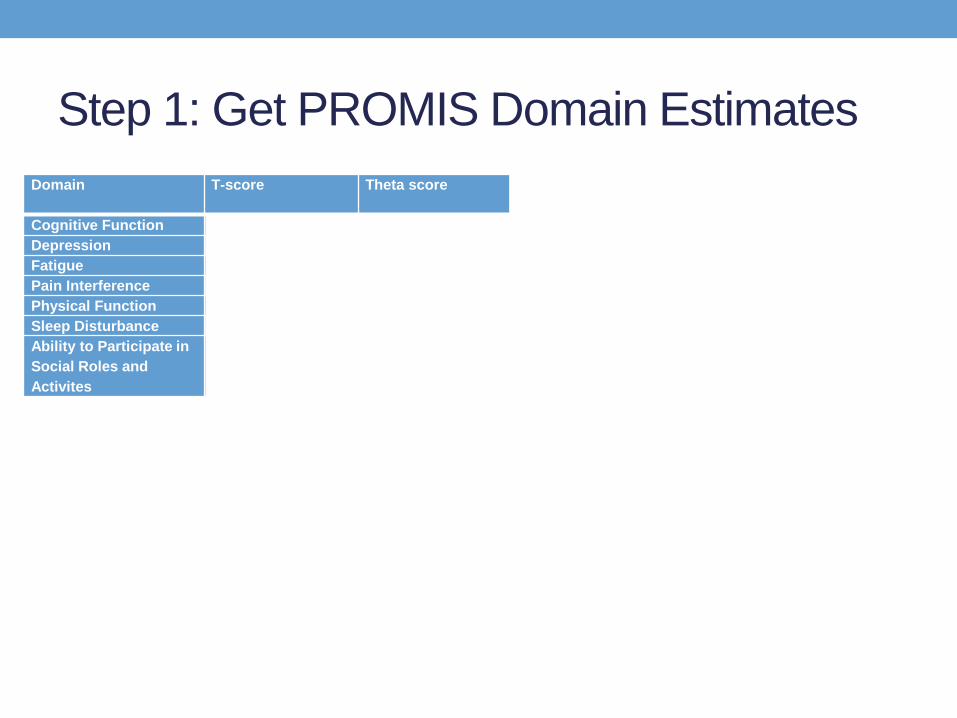
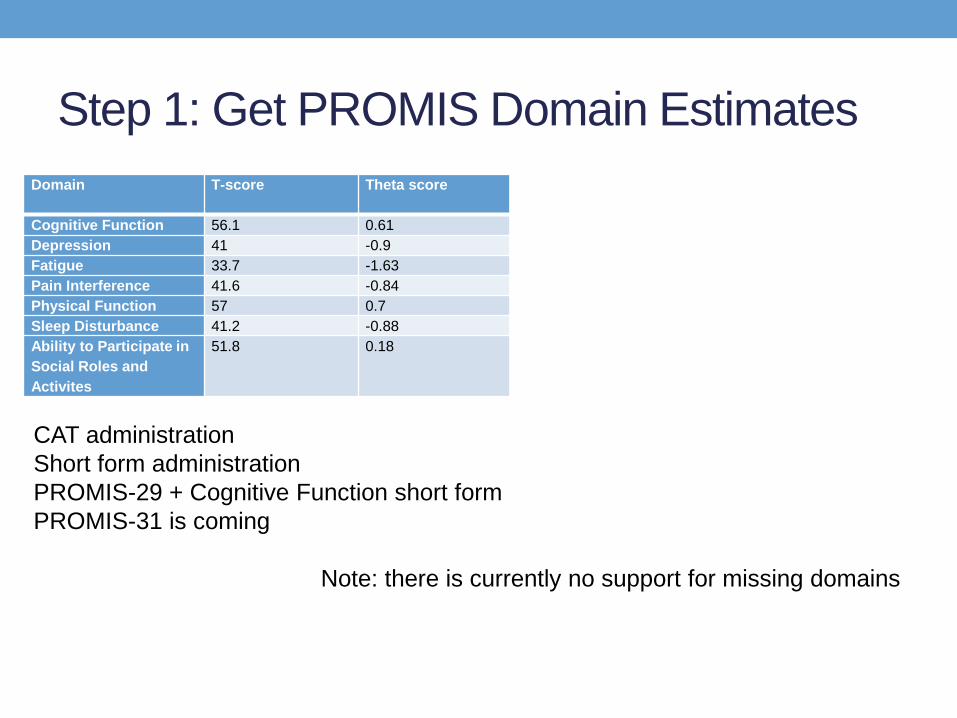
Step 1: Get PROMIS Domain EstimatesDomain T-score Theta score Disutility Estimate Single-attribute
Utility EstimateMultiattributeUtility Estimate
Cognitive Function 56.1 0.61 0.1062 0.8937
0.757
Depression 41 -0.9 0.0304 0.9695Fatigue 33.7 -1.63 0.0814 0.9185Pain Interference 41.6 -0.84 0 1Physical Function 57 0.7 0.0615 0.9384Sleep Disturbance 41.2 -0.88 0.1246 0.8753Ability to Participate in Social Roles and Activites
51.8 0.18 0.1833 0.8166
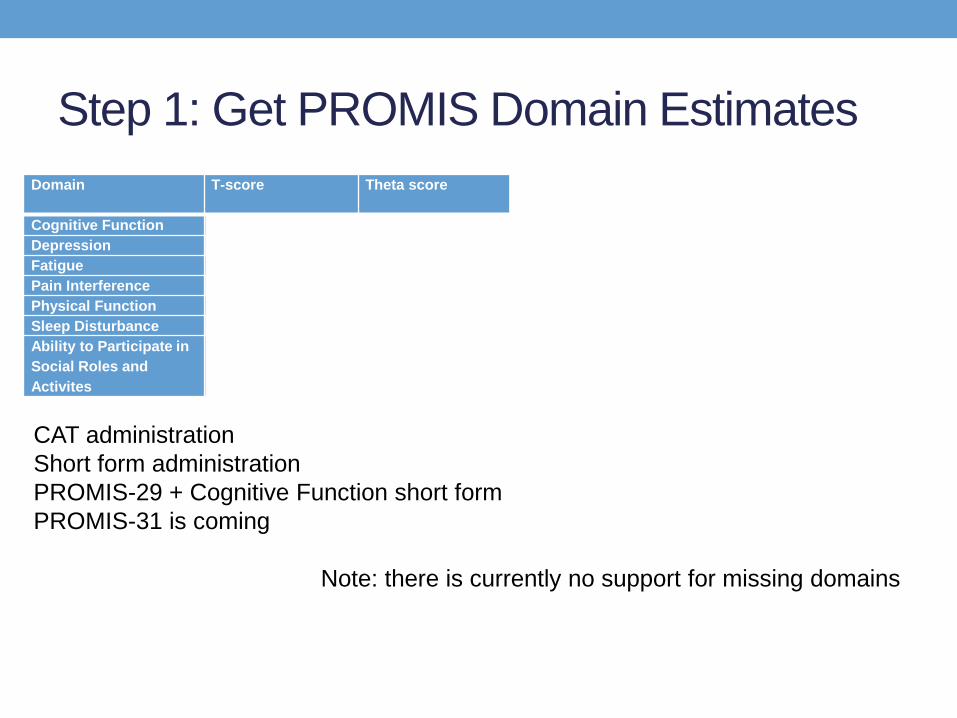
CAT administrationShort form administrationPROMIS-29 + Cognitive Function short formPROMIS-31 is coming
Note: there is currently no support for missing domains
Step 1: Get PROMIS Domain EstimatesDomain T-score Theta score Disutility Estimate Single-attribute
Utility EstimateMultiattributeUtility Estimate
Cognitive Function 56.1 0.61 0.1062 0.8937
0.757
Depression 41 -0.9 0.0304 0.9695Fatigue 33.7 -1.63 0.0814 0.9185Pain Interference 41.6 -0.84 0 1Physical Function 57 0.7 0.0615 0.9384Sleep Disturbance 41.2 -0.88 0.1246 0.8753Ability to Participate in Social Roles and Activites
51.8 0.18 0.1833 0.8166
CAT administrationShort form administrationPROMIS-29 + Cognitive Function short formPROMIS-31 is coming
Note: there is currently no support for missing domains
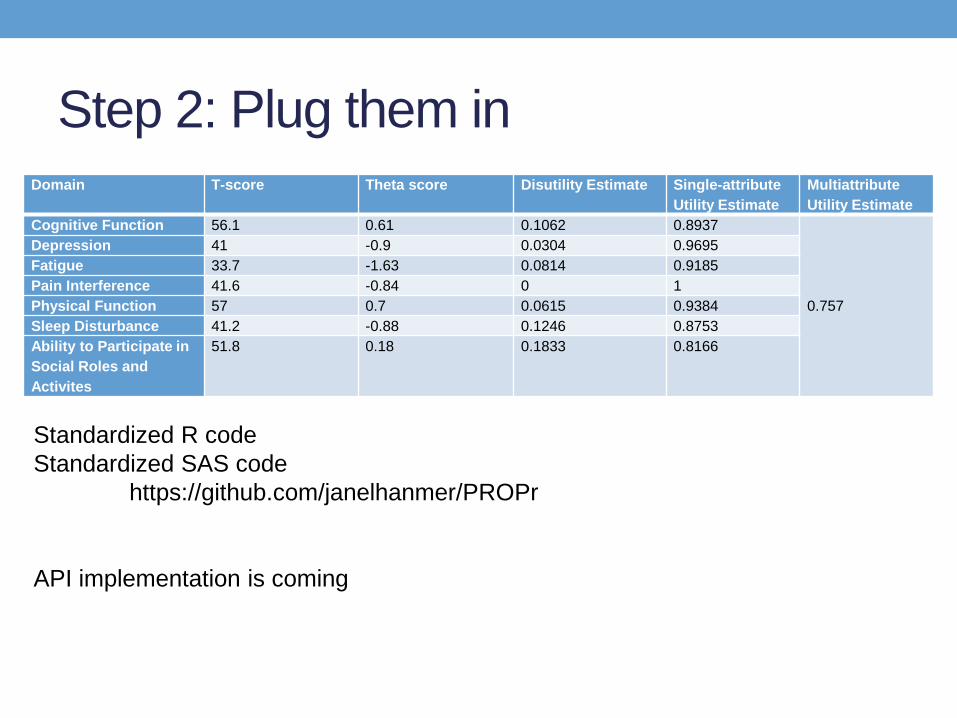
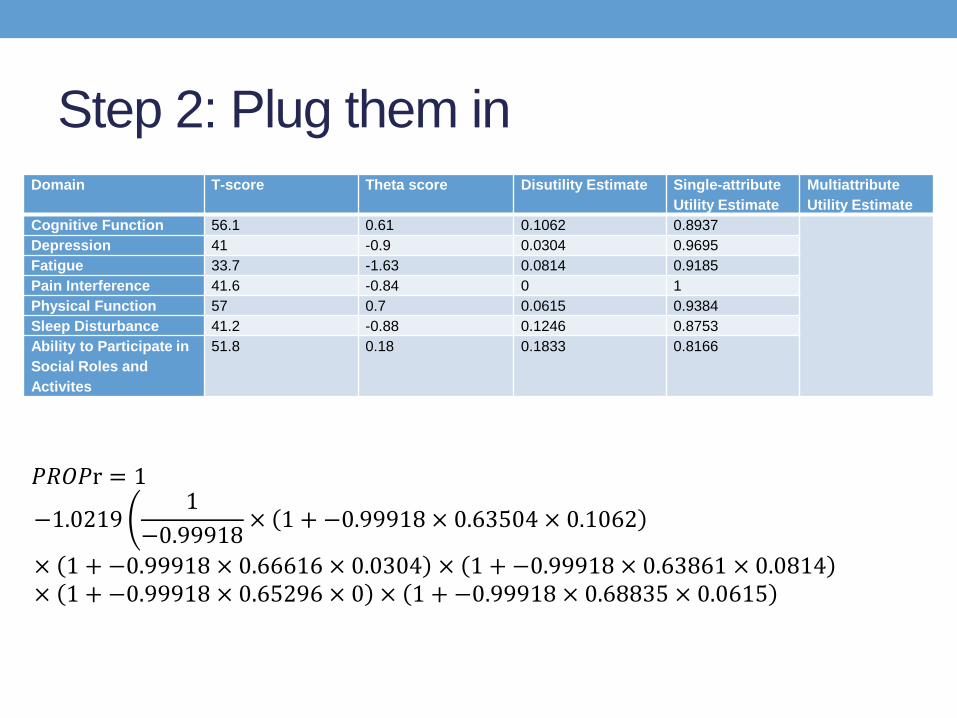
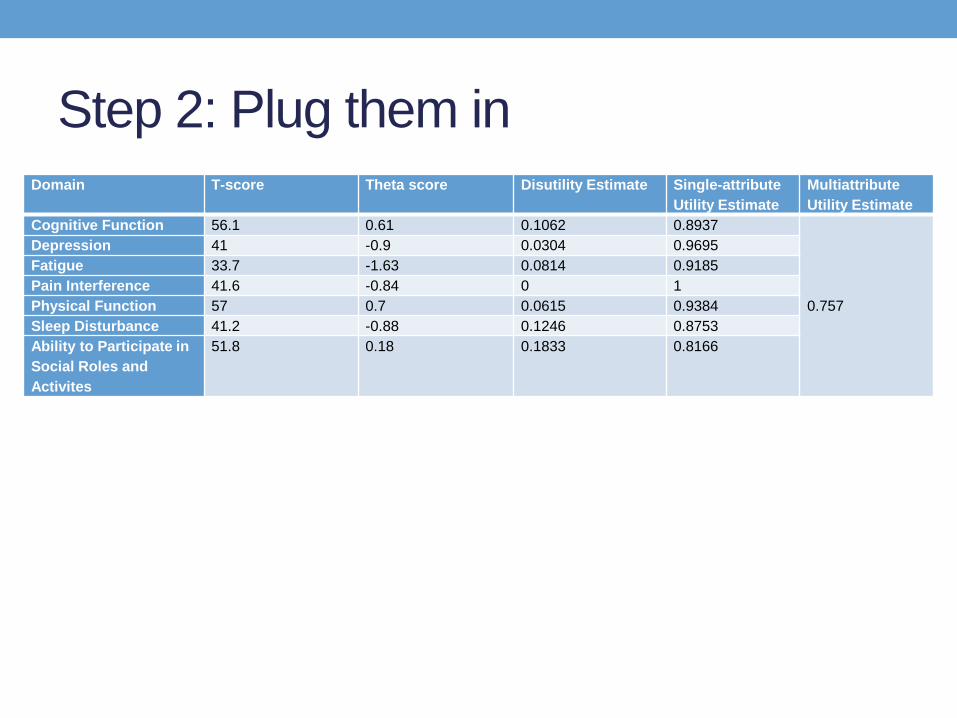
Step 2: Plug them inDomain T-score Theta score Disutility Estimate Single-attribute
Utility EstimateMultiattributeUtility Estimate
Cognitive Function 56.1 0.61 0.1062 0.8937
0.757
Depression 41 -0.9 0.0304 0.9695Fatigue 33.7 -1.63 0.0814 0.9185Pain Interference 41.6 -0.84 0 1Physical Function 57 0.7 0.0615 0.9384Sleep Disturbance 41.2 -0.88 0.1246 0.8753Ability to Participate in Social Roles and Activites
51.8 0.18 0.1833 0.8166
Standardized R codeStandardized SAS code
https://github.com/janelhanmer/PROPr
API implementation is coming
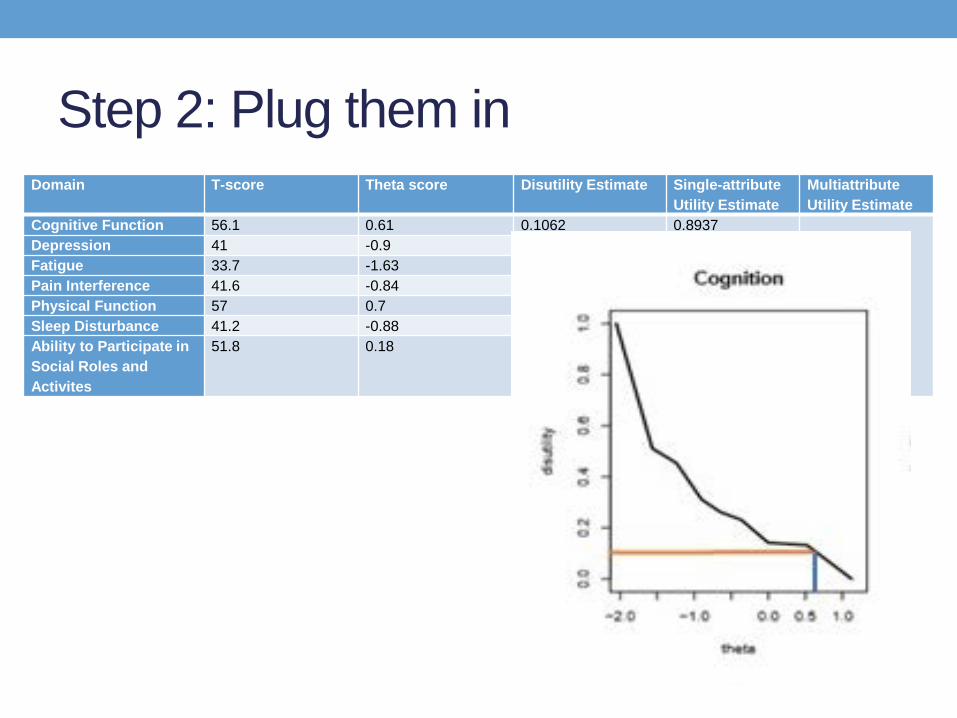
Step 2: Plug them inDomain T-score Theta score Disutility Estimate Single-attribute
Utility EstimateMultiattributeUtility Estimate
Cognitive Function 56.1 0.61 0.1062 0.8937
0.757
Depression 41 -0.9 0.0304 0.9695Fatigue 33.7 -1.63 0.0814 0.9185Pain Interference 41.6 -0.84 0 1Physical Function 57 0.7 0.0615 0.9384Sleep Disturbance 41.2 -0.88 0.1246 0.8753Ability to Participate in Social Roles and Activites
51.8 0.18 0.1833 0.8166
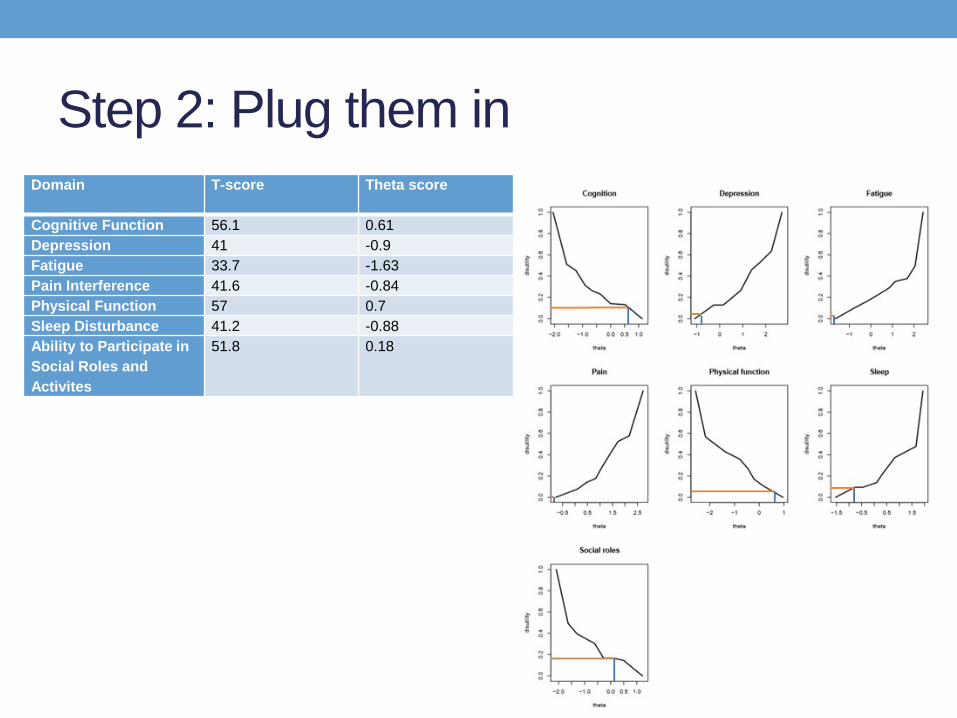
Step 2: Plug them inDomain T-score Theta score Disutility Estimate Single-attribute
Utility EstimateMultiattributeUtility Estimate
Cognitive Function 56.1 0.61 0.1062 0.8937Depression 41 -0.9 0.0304 0.9695Fatigue 33.7 -1.63 0.0814 0.9185Pain Interference 41.6 -0.84 0 1Physical Function 57 0.7 0.0615 0.9384Sleep Disturbance 41.2 -0.88 0.1246 0.8753Ability to Participate in Social Roles and Activites
51.8 0.18 0.1833 0.8166
−1.0219 �1
−0.99918 × 1 + −0.99918 × 0.63504 × 0.1062
× 1 + −0.99918 × 0.66616 × 0.0304 × 1 + −0.99918 × 0.63861 × 0.0814× 1 + −0.99918 × 0.65296 × 0 × 1 + −0.99918 × 0.68835 × 0.0615
𝑃𝑃𝑃𝑃𝑃𝑃𝑃𝑃r = 1
Step 2: Plug them inDomain T-score Theta score Disutility Estimate Single-attribute
Utility EstimateMultiattributeUtility Estimate
Cognitive Function 56.1 0.61 0.1062 0.8937
0.757
Depression 41 -0.9 0.0304 0.9695Fatigue 33.7 -1.63 0.0814 0.9185Pain Interference 41.6 -0.84 0 1Physical Function 57 0.7 0.0615 0.9384Sleep Disturbance 41.2 -0.88 0.1246 0.8753Ability to Participate in Social Roles and Activites
51.8 0.18 0.1833 0.8166
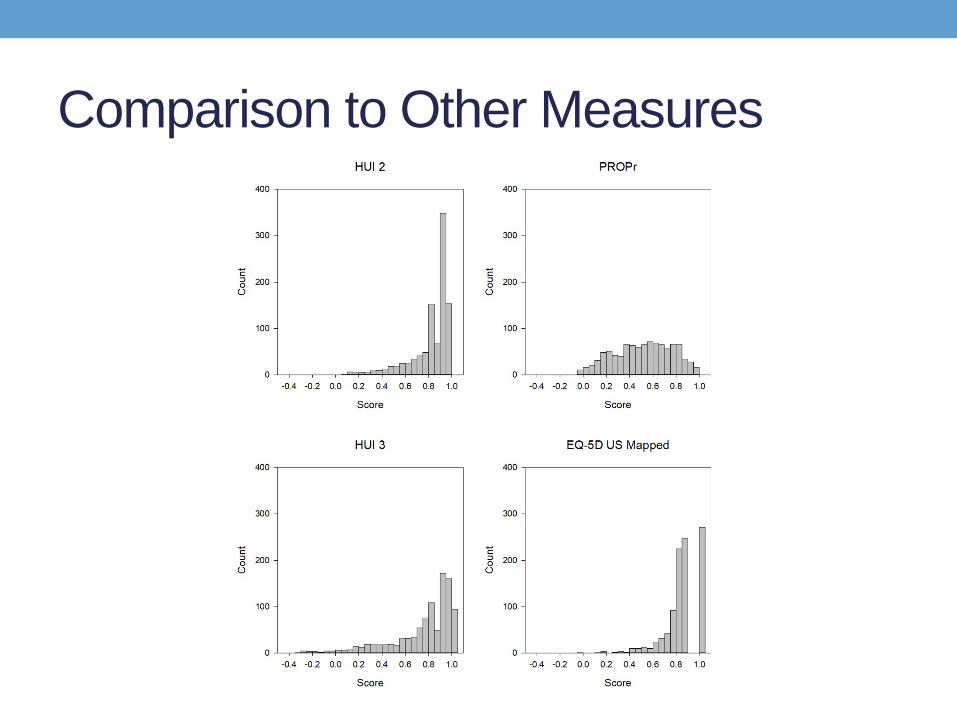
Comparison to Other Measures
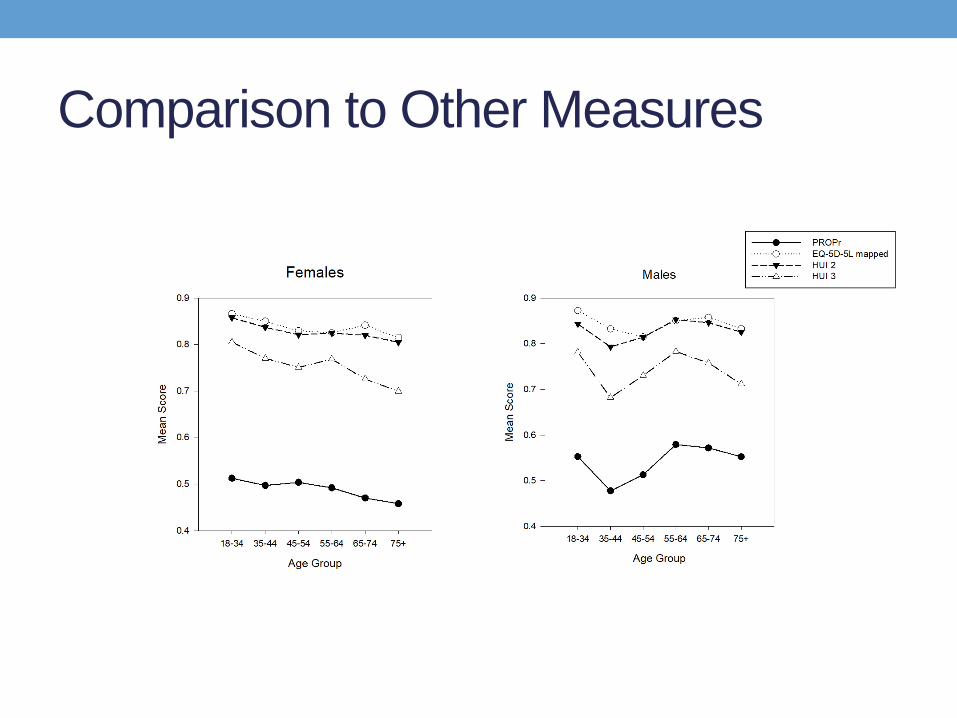
Comparison to Other Measures
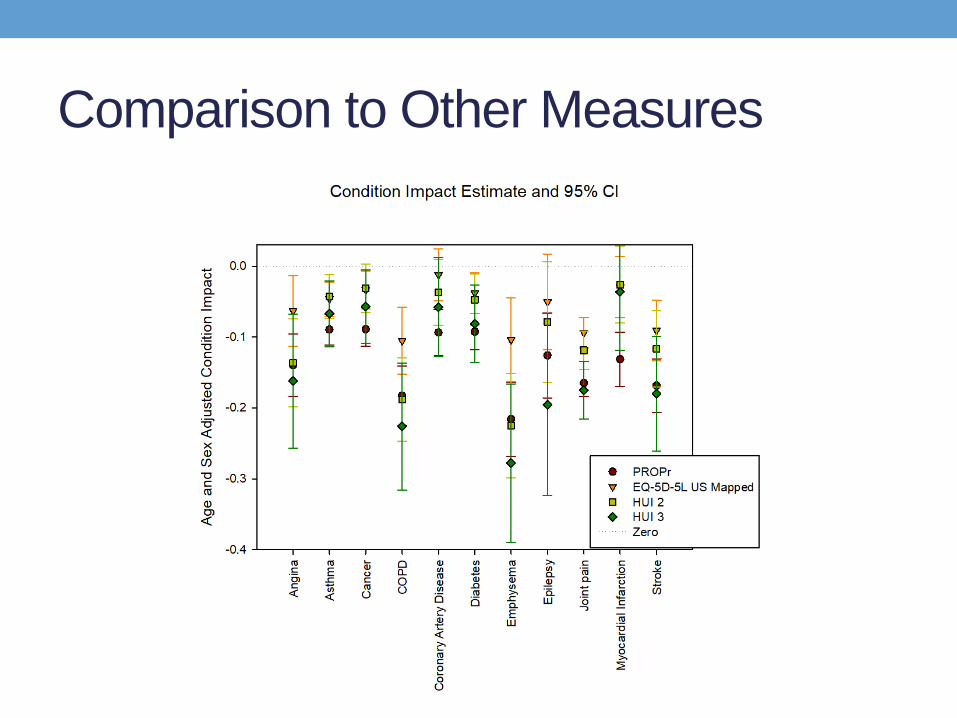
Comparison to Other Measures
Interpreting PROPr Scores• Minimally Important Differences have not been
established• In legacy measures, MID between 0.3 and 0.5• A conservative estimate would be ½ SD ~0.8
• These scores represent the average value for the health state in the US general population• THIS DOES NOT REPRESENT AN INDIVIDUAL’S VALUE
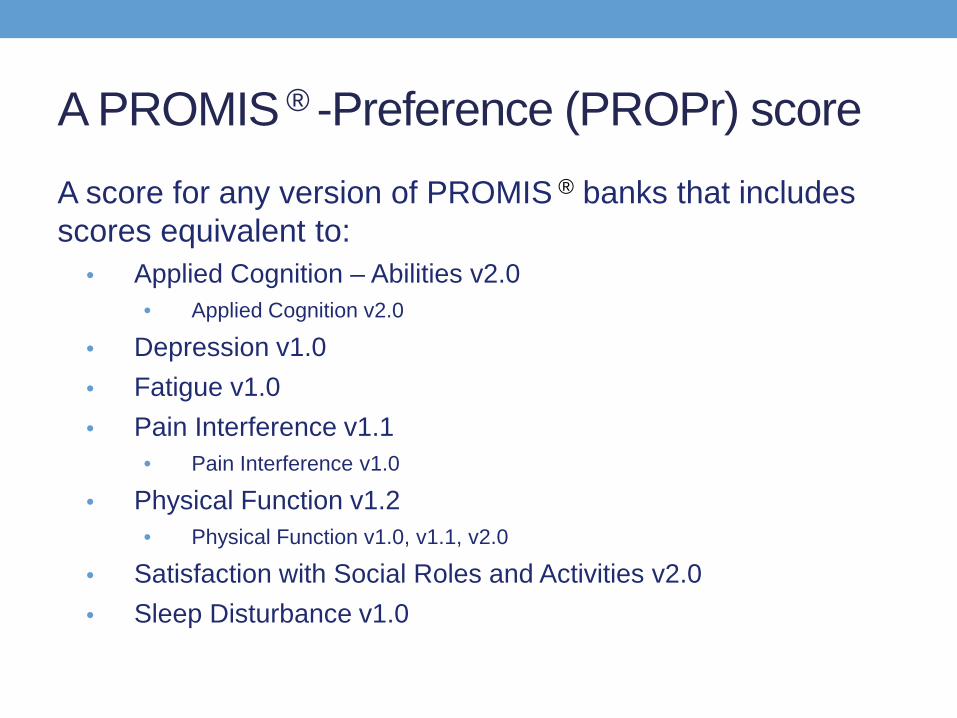
A PROMIS ® -Preference (PROPr) scoreA score for any version of PROMIS ® banks that includes scores equivalent to:
• Applied Cognition – Abilities v2.0• Applied Cognition v2.0
• Depression v1.0• Fatigue v1.0• Pain Interference v1.1
• Pain Interference v1.0
• Physical Function v1.2• Physical Function v1.0, v1.1, v2.0
• Satisfaction with Social Roles and Activities v2.0• Sleep Disturbance v1.0
Thank you!
Contact:• [email protected]• http://janelhanmer.pitt.edu/PROPr• https://github.com/janelhanmer/PROPr