
Introduction to Statistics with Algebra Exam 1 Name:1… · B. The standard deviation increases. C....
11
Introduction to Statistics with Algebra Exam 1 Name: ________________________________________________
Transcript of Introduction to Statistics with Algebra Exam 1 Name:1… · B. The standard deviation increases. C....

IntroductiontoStatisticswithAlgebraExam1Name:________________________________________________

1. 15, 18, 21, 22, 26, 28, 31, 39 (Population)
A. Mean B. Median C. Sum of squares D. Variance E. Standard deviation F. Convert the raw scores of 15 and 39 to standard scores. G. Convert the raw scores of 15 and 39 to percentile scores.


2. 145, 136, 198, 115, 128, 156 (Sample)
A. Mean B. Median C. Sum of squares D. Variance E. Standard Deviation
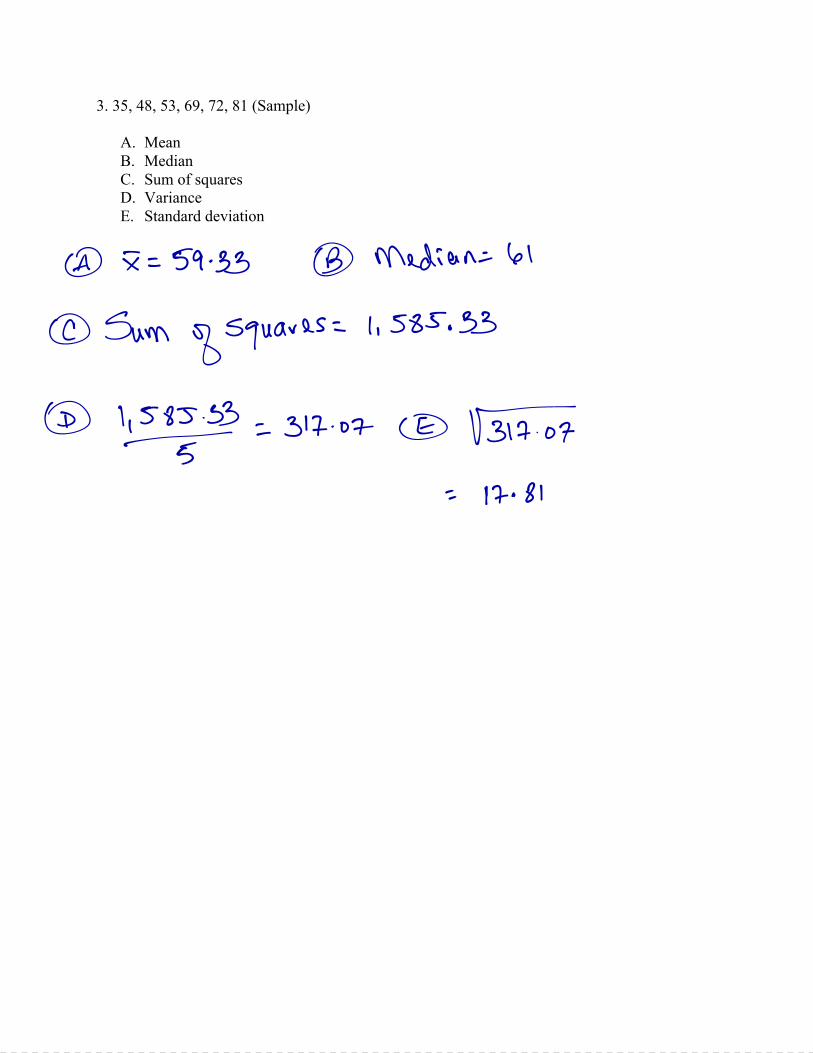
3. 35, 48, 53, 69, 72, 81 (Sample)
A. Mean B. Median C. Sum of squares D. Variance E. Standard deviation

4. A professor does not want his students to fail his class, so he is going to add three points to the lowest 10% of test scores. The mean test score is 145 and the standard deviation is 21. What is the lowest test score you can receive to get the extra three points?

5. The mean of a set of scores is 89 and the standard deviation is 12. What percent of scores fall between the raw scores of 76 and 93? What percent of scores fall between the raw scores of 83 and 97?

6. A clothing store needs to fire some employees. They decide to fire the employees who are selling at the bottom 15% of all sales people for the store. The mean total is $430 a day sold, with a standard deviation of $50. What is the least amount that a sales person can sell and still remain employed?

7. If the largest value of a data set is doubled, which of the following is false?
A. The mean increases. B. The standard deviation increases. C. The interquartile range increases. D. The range increases. E. The median remains unchanged.
8. The following list is a set of data ordered from smallest to largest. All values are integers.
2 12 y y y 15 18 18 19
I. The median and the first quartile cannot be equal. II. The mode is 18.
III. 2 is an outlier.
1. I only 2. II only 3. III only 4. I and III only 5. I, II, and III
9.TrueorFalse
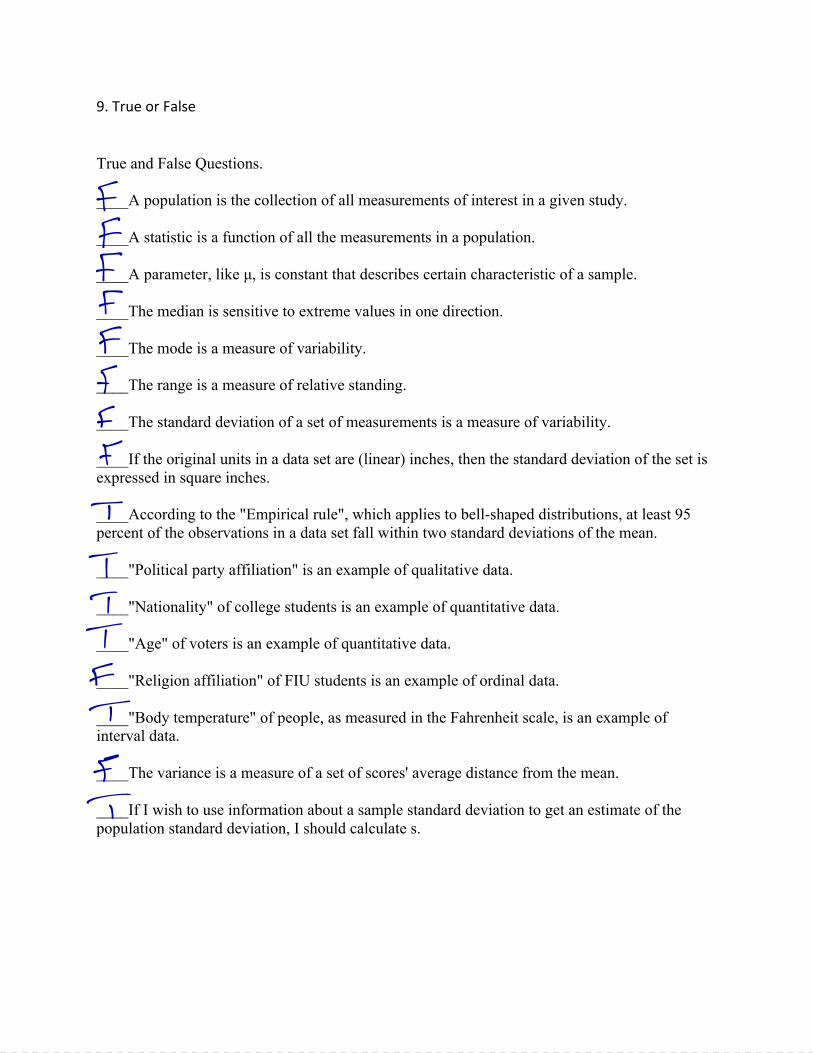
True and False Questions.
____A population is the collection of all measurements of interest in a given study.
____A statistic is a function of all the measurements in a population.
____A parameter, like µ, is constant that describes certain characteristic of a sample.
____The median is sensitive to extreme values in one direction.
____The mode is a measure of variability.
____The range is a measure of relative standing.
____The standard deviation of a set of measurements is a measure of variability.
____If the original units in a data set are (linear) inches, then the standard deviation of the set is expressed in square inches.
____According to the "Empirical rule", which applies to bell-shaped distributions, at least 95 percent of the observations in a data set fall within two standard deviations of the mean.
____"Political party affiliation" is an example of qualitative data.
____"Nationality" of college students is an example of quantitative data.
____"Age" of voters is an example of quantitative data.
____"Religion affiliation" of FIU students is an example of ordinal data.
____"Body temperature" of people, as measured in the Fahrenheit scale, is an example of interval data.
____The variance is a measure of a set of scores' average distance from the mean.
____If I wish to use information about a sample standard deviation to get an estimate of the population standard deviation, I should calculate s.

10. The mean length of a sample of 125 iguanas is 4.8 feet, with a standard deviation of 0.7 feet. The data set has a bell-shaped distribution.
(a) Estimate the number of iguanas that are between 4.1 and 5.5 feet long.
(b) Use a z-score to determine whether an iguana length of 3.1 feet is unusual.


