INTRODUCTION TO SQL SERVER REPORTING SEVICES
42
INTRODUCTION TO SQL SERVER REPORTING SEVICES Shane Risk Business Intelligence Consultant
description
INTRODUCTION TO SQL SERVER REPORTING SEVICES. Shane Risk Business Intelligence Consultant. Introduction to SSRS. Integrated End-to-End BI Offering. DELIVERY. COLLABORATION. CONTENT MANAGEMENT. SharePoint Server. SEARCH. Reports. Dashboards. Excel Workbooks. Analytic Views. - PowerPoint PPT Presentation
Transcript of INTRODUCTION TO SQL SERVER REPORTING SEVICES
INTRODUCTION TO SQL SERVER REPORTING SEVICESShane RiskBusiness Intelligence Consultant

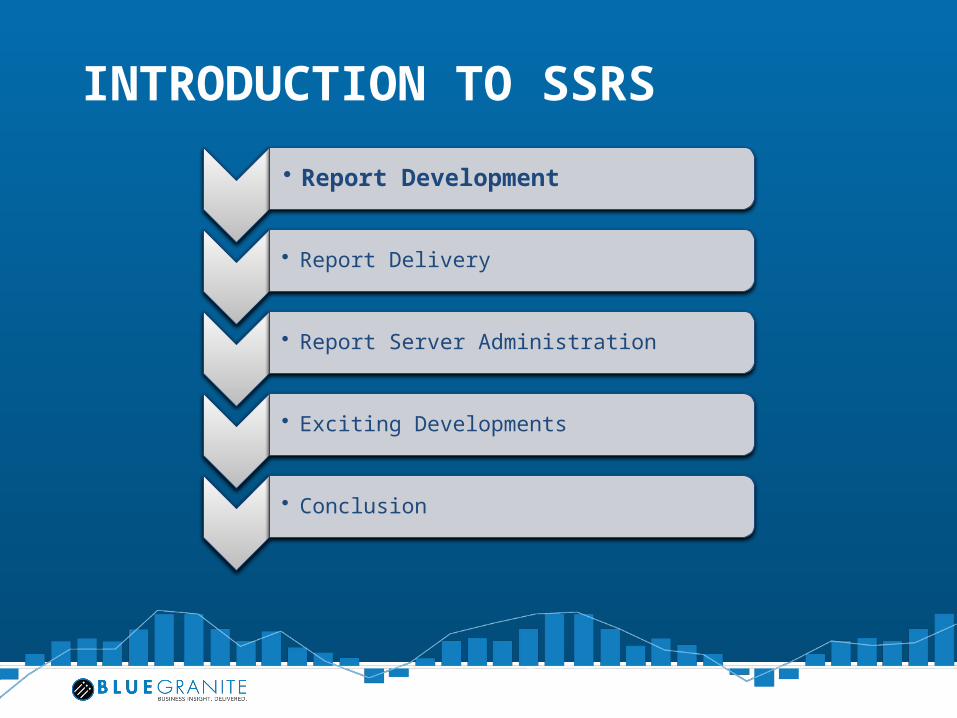
INTRODUCTION TO SSRS• Report Development
• Report Delivery
• Report Server Administration
• Exciting Developments
• Conclusion

END USER TOOLS AND PERFORMANCE MANAGEMENT APPSExcel PerformancePoint
ServerBI PLATFORM
SQL Server Reporting Services
SQL Server Analysis Services
SQL Server DBMS
SQL Server Integration Services
SharePoint Server
DELIVERY
Reports Dashboards Excel Workbooks
AnalyticViews Scorecards Plans
Integrated End-to-End BI Offering
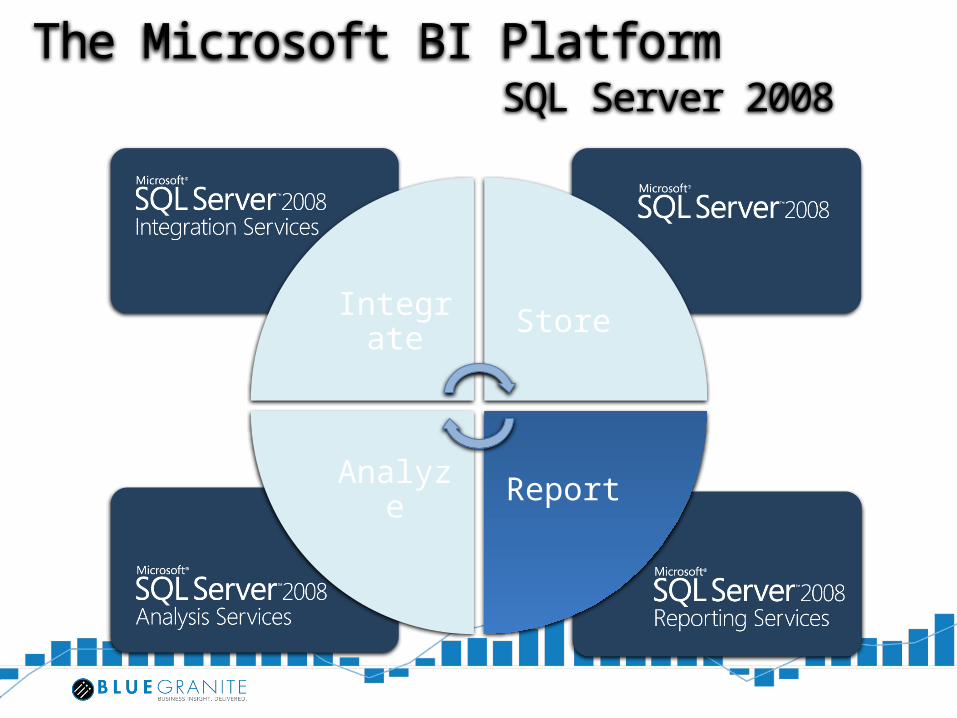
Integrate Store
ReportAnalyze
The Microsoft BI Platform SQL Server 2008
INTRODUCTION TO SSRS• Report Development
• Report Delivery
• Report Server Administration
• Exciting Developments
• Conclusion

Flexible Report Layout What is Tablix?
• The best of Table merged with the best of Matrix • Allows for fixed and dynamic columns and rows• Enables arbitrary nesting on each axis• Enables multiple parallel row/column members at each
level• Introduces optional omission of row/column headers
Innovative layout capabilities• Support for richly formatted text• Innovative grouping capabilities
Embed Reporting
Web Report

2001 2002 Total1,115 1,331 2,446
152 642 79411,156 13,312 24,4681,523 6,421 7,944
13,946 21,706 35,653
Retail AcmeNadir, Inc.
Wholesale ABC Corp.XYZ, Ltd.
Grand Total
CustomerRetail
AcmeNadir, Inc.
WholesaleABC Corp.XYZ, Ltd.
Grand Total
Growth
19%322%
19%322%56%
Tabl ixe + Matr

Embed Reporting
Web Report
Rich VisualizationsChart Types

Embed Reporting
Web Report
Rich VisualizationsGauge Types

Inline Charts• Greatly enhances report impact relative to a table of
values• All reports and gauges can be embedded in tables• Allows for interesting layouts that were previously
unsupported• Charts are rendered to the browser as images, be sure
to test client performance prior to rolling out to users

Sparkline Chart• Compact and concise view of
data ideal for dashboards• Provides meaningful historical
context • Allows understand time series
comparisons across entities• Link to other reports for more
detail
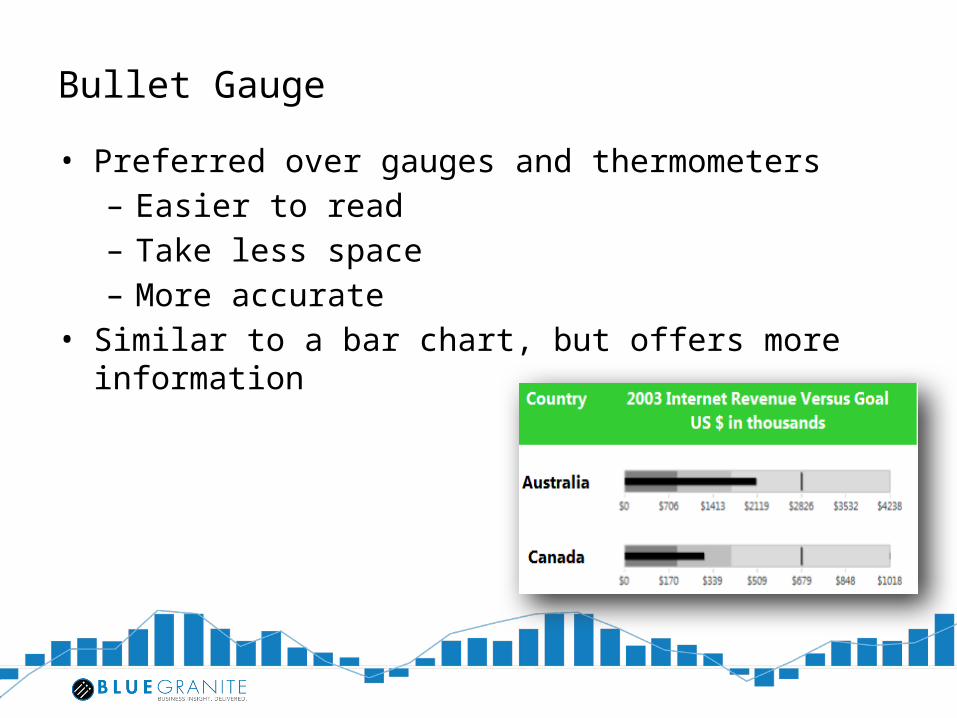
Bullet Gauge• Preferred over gauges and thermometers
– Easier to read– Take less space– More accurate
• Similar to a bar chart, but offers more information

Report Development Demo 1
• Tablix• Inline Charts
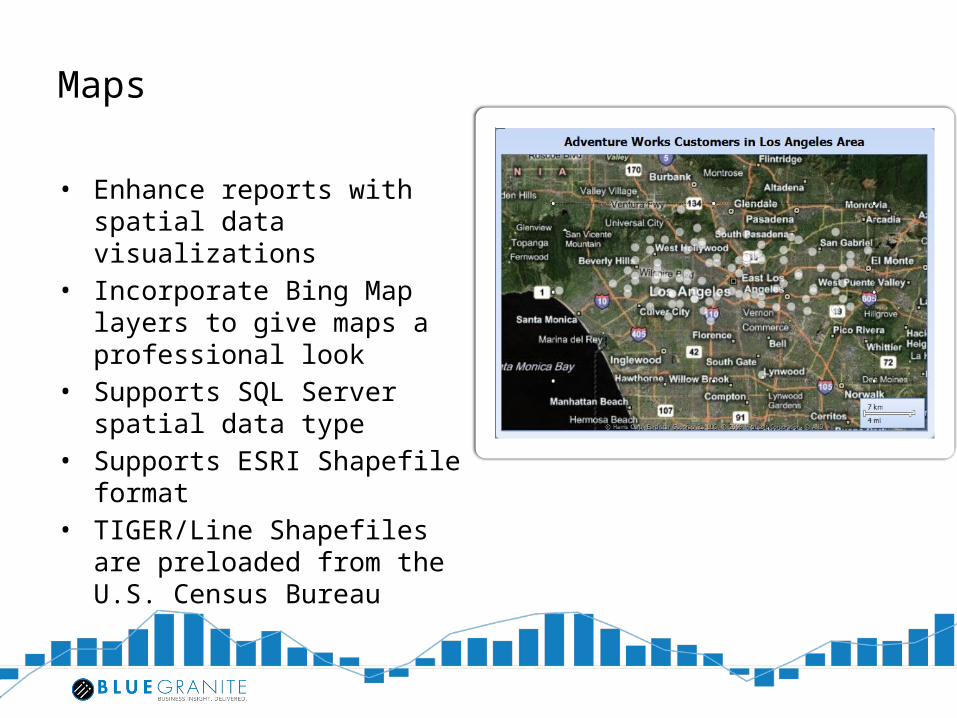
Maps
• Enhance reports with spatial data visualizations
• Incorporate Bing Map layers to give maps a professional look
• Supports SQL Server spatial data type
• Supports ESRI Shapefile format• TIGER/Line Shapefiles are
preloaded from the U.S. Census Bureau
Report Builder 3.0
• Most recent version of the Report Builder tool• Same code base as BIDS report designer• Additional functionality allows you to utilize Shared Datasets and
Shared Report Components not present in BIDS• Allows end users to design their own reports• Thin client accessible through Report Manager (Native) or
SharePoint (Integrated)

Shared Components
• Shared Datasets– Share datasets across reports for simplified maintenance and
improved performance– Can be cached independently from any reports– Can be reused by end users building reports in Report Builder
3.0• Shared Report Parts
– Share report components between reports– Build a report visualization once and use it in many reports– Can be reused by end users building reports in Report Builder
3.0

Report Development Demo 2
• Report Builder 3.0• Shared Report Parts• Shared Datasets

INTRODUCTION TO SSRS• Report Development
• Report Delivery
• Report Server Administration
• Exciting Developments
• Conclusion
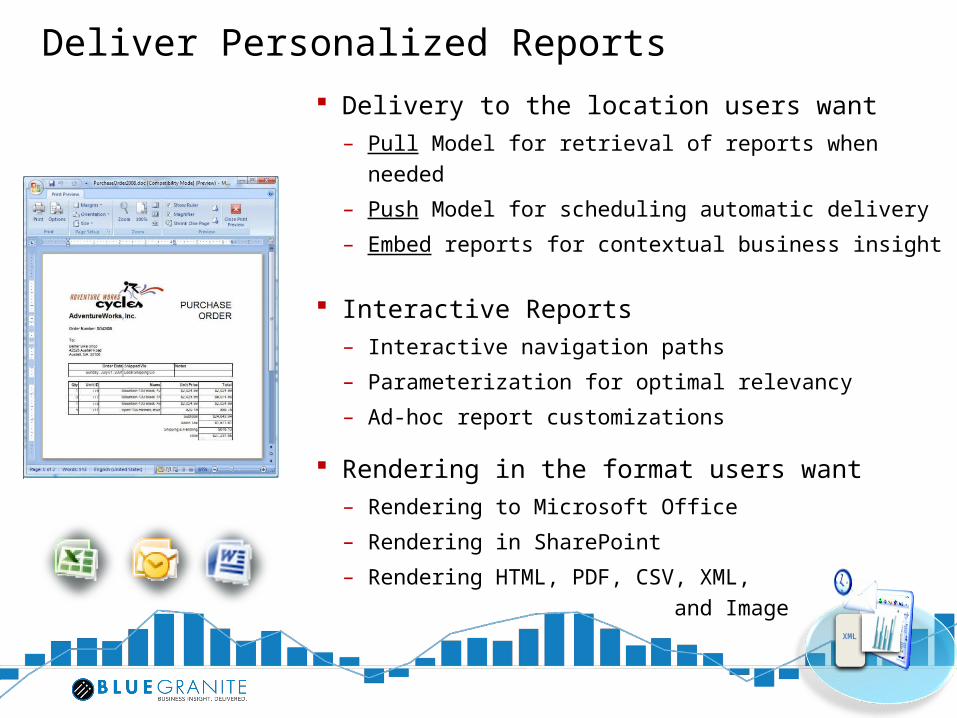
Deliver Personalized Reports Delivery to the location users want
– Pull Model for retrieval of reports when needed– Push Model for scheduling automatic delivery – Embed reports for contextual business insight
Interactive Reports– Interactive navigation paths– Parameterization for optimal relevancy – Ad-hoc report customizations
Rendering in the format users want– Rendering to Microsoft Office– Rendering in SharePoint– Rendering HTML, PDF, CSV, XML,
and Image XML

My Reports
• Personal folder where report publishers can deploy their own reports
• Useful for creating one-off reports from existing reports for one time use
• Can be used as a poor man’s development environment– Develop and QA reports deployed to My Reports prior to public
release– System Administrators can view reports in user’s My Report
folders
My Subscriptions
• Users can subscribe to reports through the Report Manager interface
• Report subscriptions can be viewed and maintained on the My Subscriptions page
• Allows users to easily manage report delivery without administrative assistance

Data Driven Subscriptions
• Table driven report delivery • Report parameters are specified via table columns• Each row in the table is a separate report instance• Reports can be delivered via email, to a file share, or to a
SharePoint list
SharePoint Portal – Key Benefits– Single place to View, Manage, & Deliver reports with-in
SharePoint UI– Same site access for all business documents, including reports,
report models, and shared data sources– Deep level of database and security integration– Easy integration with other information delivery tools &
technologies
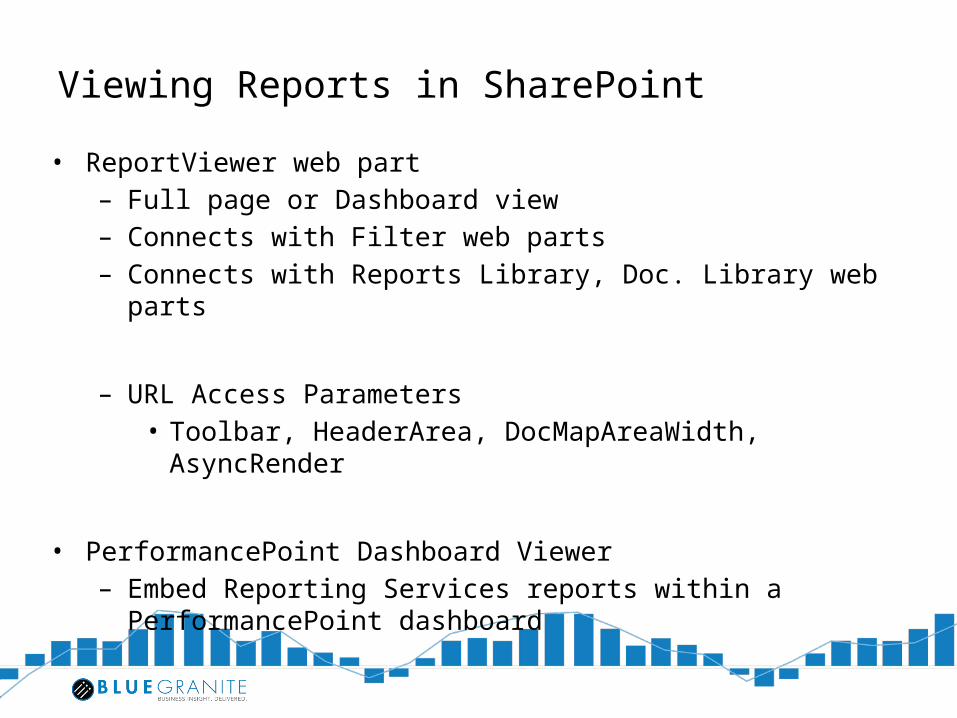
Viewing Reports in SharePoint• ReportViewer web part
– Full page or Dashboard view– Connects with Filter web parts – Connects with Reports Library, Doc. Library web parts
– URL Access Parameters• Toolbar, HeaderArea, DocMapAreaWidth, AsyncRender
• PerformancePoint Dashboard Viewer– Embed Reporting Services reports within a PerformancePoint
dashboard
Report Delivery Demo
• My Reports• My Subscriptions

INTRODUCTION TO SSRS• Report Development
• Report Delivery
• Report Server Administration
• Exciting Developments
• Conclusion

Reporting Services Security
• Users are granted role based access to specific folders
• There are a number of predefined roles that come out of the box
• New report roles can be created through SQL Server Management Studio
• Roles: Browser, Publisher, My Reports, Content Manager, System User, System Administrator
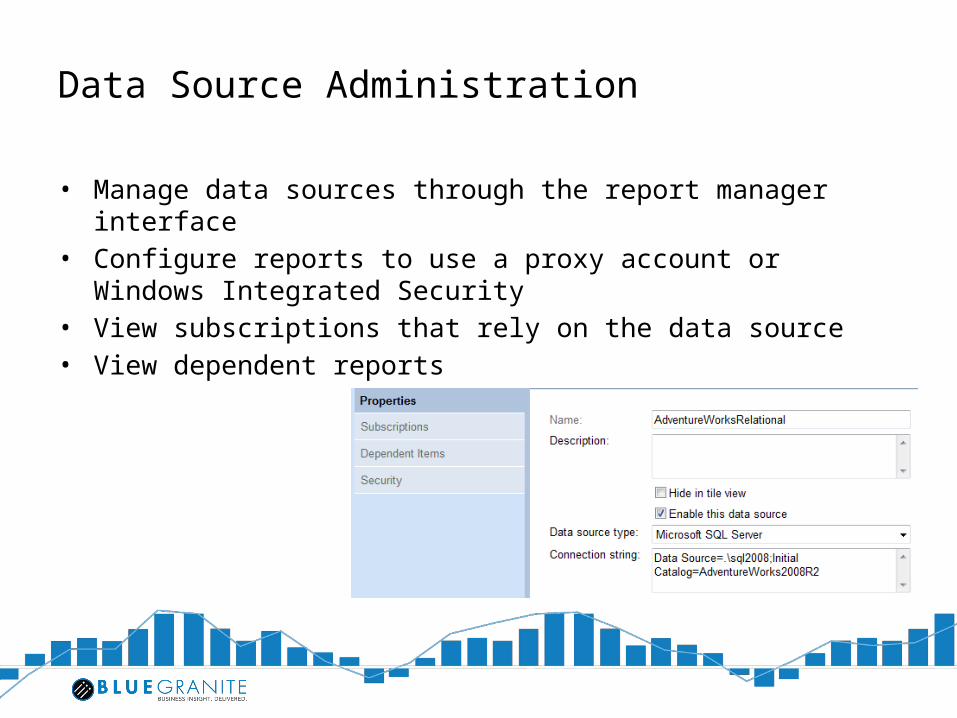
Data Source Administration
• Manage data sources through the report manager interface• Configure reports to use a proxy account or Windows Integrated
Security• View subscriptions that rely on the data source• View dependent reports
Report Caching
• A report optimization technique that caches report data• Set a report to keep a temporary copy of the report when
executed or refresh the cache on a schedule• Report caches can be expired after a number of minutes
or according to a schedule• Caching requires the use of stored data source report
credentials
Report Snapshots
• Used to retain point in time reports• Report snapshots can be configured to run on a
specified schedule• Snapshots store report data in the Report Server
database• Render at runtime using stored snapshot data• Requires stored report credentials
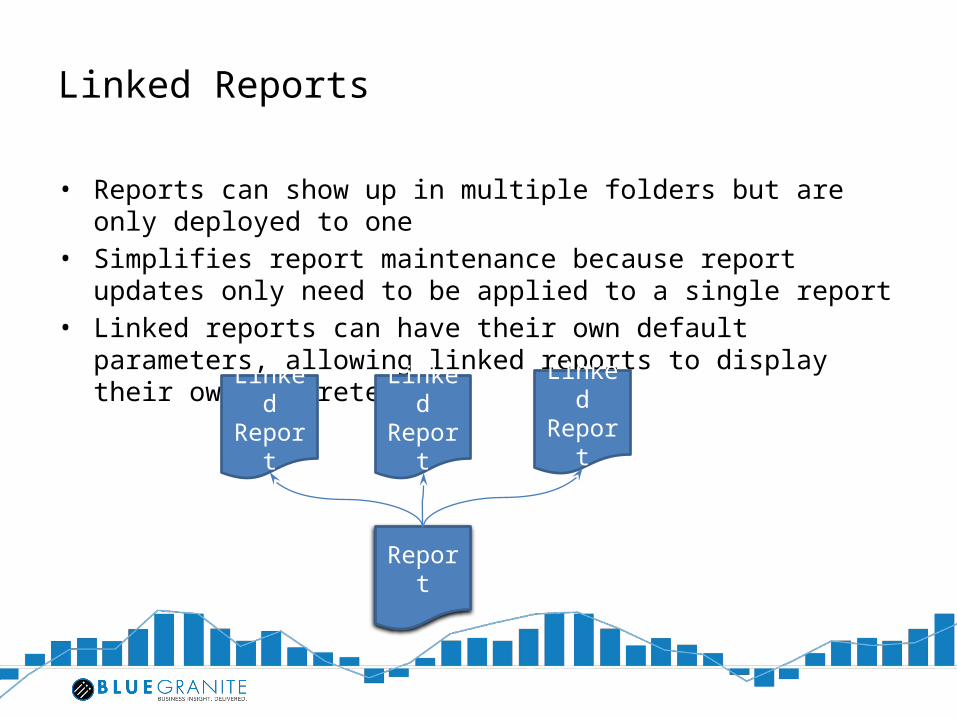
Linked Reports
• Reports can show up in multiple folders but are only deployed to one
• Simplifies report maintenance because report updates only need to be applied to a single report
• Linked reports can have their own default parameters, allowing linked reports to display their own discrete data
Report
Linked Report
Linked Report
Linked Report
Manage, Deliver & Publish – Manage Report Items in SharePoint
• Report parameters, Data sources, Processing Options, Snapshots etc.
• Data Sources, Dependent Items• Model Item Security
– Report Delivery from / to SharePoint • Report subscriptions & Shared Schedules
– Publish to SharePoint• Report Builder, Report Designer, Model Designer

SSRS Features NOT Supported in SharePoint Integrated Mode• Custom SSRS Security Extensions• Report Manager Administration of Reports• Linked Reports• My Reports• My Subscriptions• SSRS Batching Methods
Report Server Administration Demo
• Roles• Data Source Administration• Report Snapshots• Report Caching• Linked Reports

INTRODUCTION TO SSRS• Report Development
• Report Delivery
• Report Server Administration
• Exciting Developments
• Conclusion
Azure Reports
• Cloud based access to Reporting Services• Alleviate the overhead of hosting your own
SSRS servers• Provide per user access to reports via the
internet
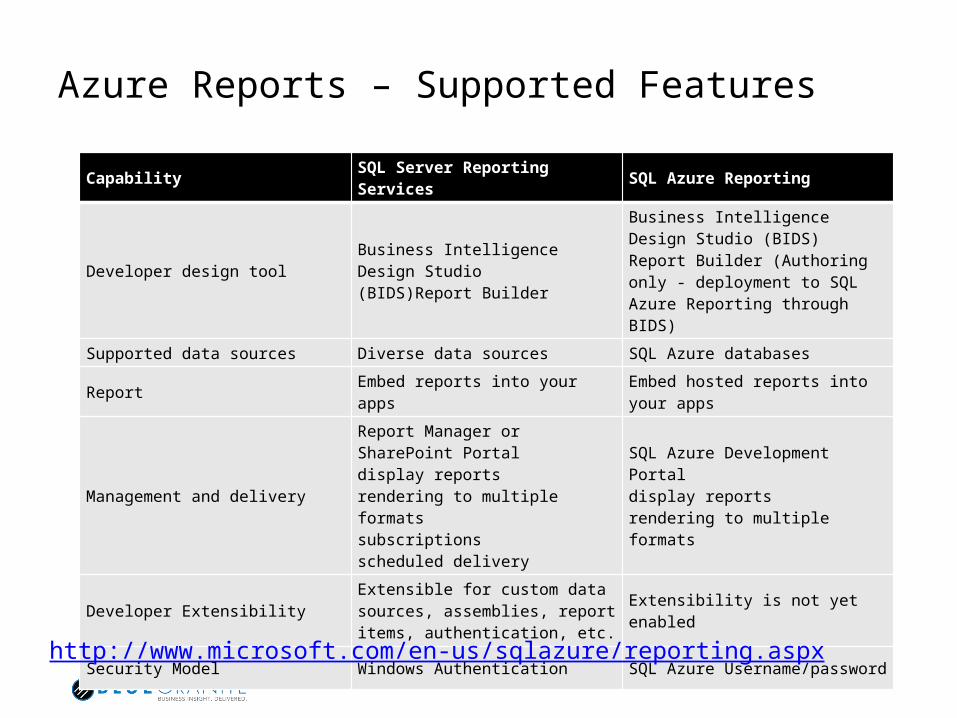
Azure Reports – Supported Features
Capability SQL Server Reporting Services SQL Azure Reporting
Developer design tool Business Intelligence Design Studio(BIDS)Report Builder
Business Intelligence Design Studio (BIDS) Report Builder (Authoring only - deployment to SQL Azure Reporting through BIDS)
Supported data sources Diverse data sources SQL Azure databases
Report Embed reports into your apps Embed hosted reports into your apps
Management and delivery
Report Manager or SharePoint Portal display reports rendering to multiple formats subscriptions scheduled delivery
SQL Azure Development Portal display reports rendering to multiple formats
Developer ExtensibilityExtensible for custom data sources, assemblies, report items, authentication, etc.
Extensibility is not yet enabled
Security Model Windows Authentication SQL Azure Username/password
http://www.microsoft.com/en-us/sqlazure/reporting.aspx
Project Crescent
• Silverlight Ad Hoc Reporting tool coming in SQL “Denali”• Enhanced self service BI offering for PowerPivot• Supports drag and drop report building for the end user• Features highly interactive visualizations and animations• Allows visualizations to be embedded in PowerPoint
presentations for powerful real time presentations• http://blogs.msdn.com/b/bi/archive/2010/11/09/data-visuali
zation-done-right-project-crescent.aspx

INTRODUCTION TO SSRS• Report Development
• Report Delivery
• Report Server Administration
• Exciting Developments
• Conclusion
Conclusion
• Reporting services is – a powerful enterprise reporting
platform– capable of meeting your report
delivery needs– simple to administer– constantly evolving to become
even more powerful

Additional Resources• Books
– Microsoft SQL Server 2008 Reporting Services by Brian Larson– Applied Microsoft SQL Server 2008 Reporting Services by Teo
Lachev
• Web Sites– http://msdn.microsoft.com/en-us/sqlserver/cc511478.aspx
• Blogs– Reporting Services Team Blog -
http://blogs.msdn.com/b/sqlrsteamblog/– Robert Bruckner - http://blogs.msdn.com/b/robertbruckner/
Questions?Shane RiskBusiness Intelligence [email protected]: 734 478 5905www.blue-granite.comhttp://www.linkedin.com/in/shaneriskhttp://twitter.com/srisk