Introduction to Biomechanical Evaluation - painfreefeet · Introduction to Biomechanical Evaluation...
17
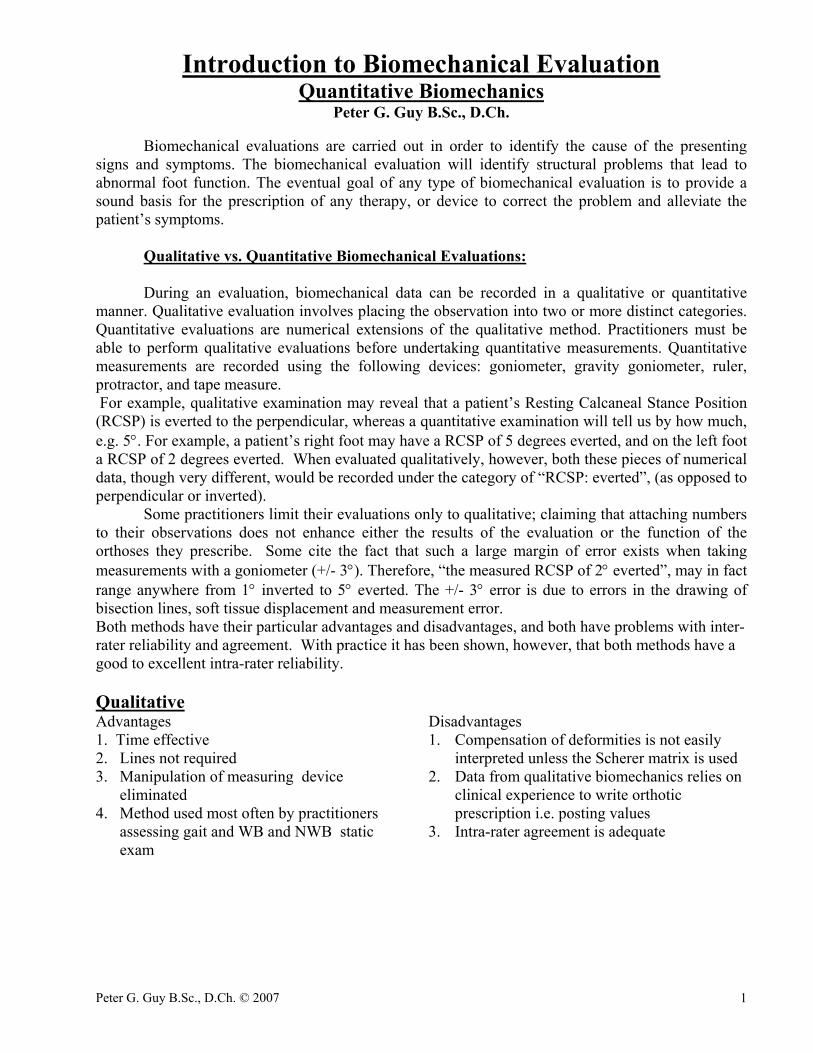
Peter G. Guy B.Sc., D.Ch. © 2007 1 Introduction to Biomechanical Evaluation Quantitative Biomechanics Peter G. Guy B.Sc., D.Ch. Biomechanical evaluations are carried out in order to identify the cause of the presenting signs and symptoms. The biomechanical evaluation will identify structural problems that lead to abnormal foot function. The eventual goal of any type of biomechanical evaluation is to provide a sound basis for the prescription of any therapy, or device to correct the problem and alleviate the patient’s symptoms. Qualitative vs. Quantitative Biomechanical Evaluations: During an evaluation, biomechanical data can be recorded in a qualitative or quantitative manner. Qualitative evaluation involves placing the observation into two or more distinct categories. Quantitative evaluations are numerical extensions of the qualitative method. Practitioners must be able to perform qualitative evaluations before undertaking quantitative measurements. Quantitative measurements are recorded using the following devices: goniometer, gravity goniometer, ruler, protractor, and tape measure. For example, qualitative examination may reveal that a patient’s Resting Calcaneal Stance Position (RCSP) is everted to the perpendicular, whereas a quantitative examination will tell us by how much, e.g. 5°. For example, a patient’s right foot may have a RCSP of 5 degrees everted, and on the left foot a RCSP of 2 degrees everted. When evaluated qualitatively, however, both these pieces of numerical data, though very different, would be recorded under the category of “RCSP: everted”, (as opposed to perpendicular or inverted). Some practitioners limit their evaluations only to qualitative; claiming that attaching numbers to their observations does not enhance either the results of the evaluation or the function of the orthoses they prescribe. Some cite the fact that such a large margin of error exists when taking measurements with a goniometer (+/- 3°). Therefore, “the measured RCSP of 2° everted”, may in fact range anywhere from 1° inverted to 5° everted. The +/- 3° error is due to errors in the drawing of bisection lines, soft tissue displacement and measurement error. Both methods have their particular advantages and disadvantages, and both have problems with inter- rater reliability and agreement. With practice it has been shown, however, that both methods have a good to excellent intra-rater reliability. Qualitative Advantages 1. Time effective 2. Lines not required 3. Manipulation of measuring device eliminated 4. Method used most often by practitioners assessing gait and WB and NWB static exam Disadvantages 1. Compensation of deformities is not easily interpreted unless the Scherer matrix is used 2. Data from qualitative biomechanics relies on clinical experience to write orthotic prescription i.e. posting values 3. Intra-rater agreement is adequate
Transcript of Introduction to Biomechanical Evaluation - painfreefeet · Introduction to Biomechanical Evaluation...
Peter G. Guy B.Sc., D.Ch. © 2007 1
Introduction to Biomechanical Evaluation Quantitative Biomechanics
Peter G. Guy B.Sc., D.Ch.
Biomechanical evaluations are carried out in order to identify the cause of the presenting signs and symptoms. The biomechanical evaluation will identify structural problems that lead to abnormal foot function. The eventual goal of any type of biomechanical evaluation is to provide a sound basis for the prescription of any therapy, or device to correct the problem and alleviate the patient’s symptoms.
Qualitative vs. Quantitative Biomechanical Evaluations: During an evaluation, biomechanical data can be recorded in a qualitative or quantitative
manner. Qualitative evaluation involves placing the observation into two or more distinct categories. Quantitative evaluations are numerical extensions of the qualitative method. Practitioners must be able to perform qualitative evaluations before undertaking quantitative measurements. Quantitative measurements are recorded using the following devices: goniometer, gravity goniometer, ruler, protractor, and tape measure. For example, qualitative examination may reveal that a patient’s Resting Calcaneal Stance Position (RCSP) is everted to the perpendicular, whereas a quantitative examination will tell us by how much, e.g. 5°. For example, a patient’s right foot may have a RCSP of 5 degrees everted, and on the left foot a RCSP of 2 degrees everted. When evaluated qualitatively, however, both these pieces of numerical data, though very different, would be recorded under the category of “RCSP: everted”, (as opposed to perpendicular or inverted).
Some practitioners limit their evaluations only to qualitative; claiming that attaching numbers to their observations does not enhance either the results of the evaluation or the function of the orthoses they prescribe. Some cite the fact that such a large margin of error exists when taking measurements with a goniometer (+/- 3°). Therefore, “the measured RCSP of 2° everted”, may in fact range anywhere from 1° inverted to 5° everted. The +/- 3° error is due to errors in the drawing of bisection lines, soft tissue displacement and measurement error. Both methods have their particular advantages and disadvantages, and both have problems with inter-rater reliability and agreement. With practice it has been shown, however, that both methods have a good to excellent intra-rater reliability. Qualitative Advantages 1. Time effective 2. Lines not required 3. Manipulation of measuring device eliminated 4. Method used most often by practitioners assessing gait and WB and NWB static exam
Disadvantages 1. Compensation of deformities is not easily interpreted unless the Scherer matrix is used 2. Data from qualitative biomechanics relies on clinical experience to write orthotic prescription i.e. posting values 3. Intra-rater agreement is adequate
Peter G. Guy B.Sc., D.Ch. © 2007 2
Quantitative Advantages 1. Provides a tool in which the types of compensation and end range of motion of a biomechanical condition can be discussed. 2. The assessment of the grasp of understanding of the biomechanical condition in teaching situations is readily identified
Disadvantages 1. Drawn bisections required(error) 2. Goniometer required(error) 3. Time consuming 4. Intra-rater reliability is adequate
Quantitative biomechanics requires the practitioner to identify the position of the structural deformity (qualitative), and measure the non-weight bearing (NWB) and weight bearing (WB) forefoot and rearfoot angles. The most significant quantified angles and linear measurements are listed as follows: NWB Angles Maximum inverted tibia to calcaneus angle Maximum everted tibia to calcaneus angle Tibia to calcaneus neutral Forefoot to rearfoot relationship Reduced forefoot to rearfoot relationship
MTJ range of motion (ROM) based on sub talar joint (STJ) position Malleolar position Ankle joint ROM knee extended Ankle joint ROM knee flexed External and internal hip ROM
WB Angles and Linear Measurements Neutral tibia to ground NCSP RCSP Relaxed calcaneus to tibia Neutral calcaneus to tibia
Maximum pronation Neutral to relaxed navicular height difference Leveling of iliac crest (LLD)
Calculations Total STJ ROM Inversion and eversion from neutral position Forefoot supinatus
Static pronation Total rearfoot to ground Total forefoot to ground
Bisection of the Tibia and the Calcaneus Please review the bisection of the tibia and calcaneus in “Introduction to Biomechanical Evaluation”1 Maximum Inverted and Everted Tibia to Calcaneal Angles The maximum inverted and everted tibia to calcaneus angles are frontal plane angles. Both of these angles are measured with the patient in the prone position with the one leg flexed at the knee to form the number four. This will allow the visualization of the bisections of the tibia and calcaneus and facilitate the measurement of these angles with a goniometer. In 1996, Nekrasas reported intra-rater reliability of bisection vs. no bisections in the measurement of the calcaneal tibial angle2. The intra-rater reliability was better with lines drawn. The intra-rater reliability for maximum inverted tibia to calcaneus angle was higher than the maximum everted tibia to calcaneus angle. The maximum inverted and everted tibia to calcaneal angles are used to calculate the STJ ROM. (Figure 1).
Peter G. Guy B.Sc., D.Ch. © 2007 3
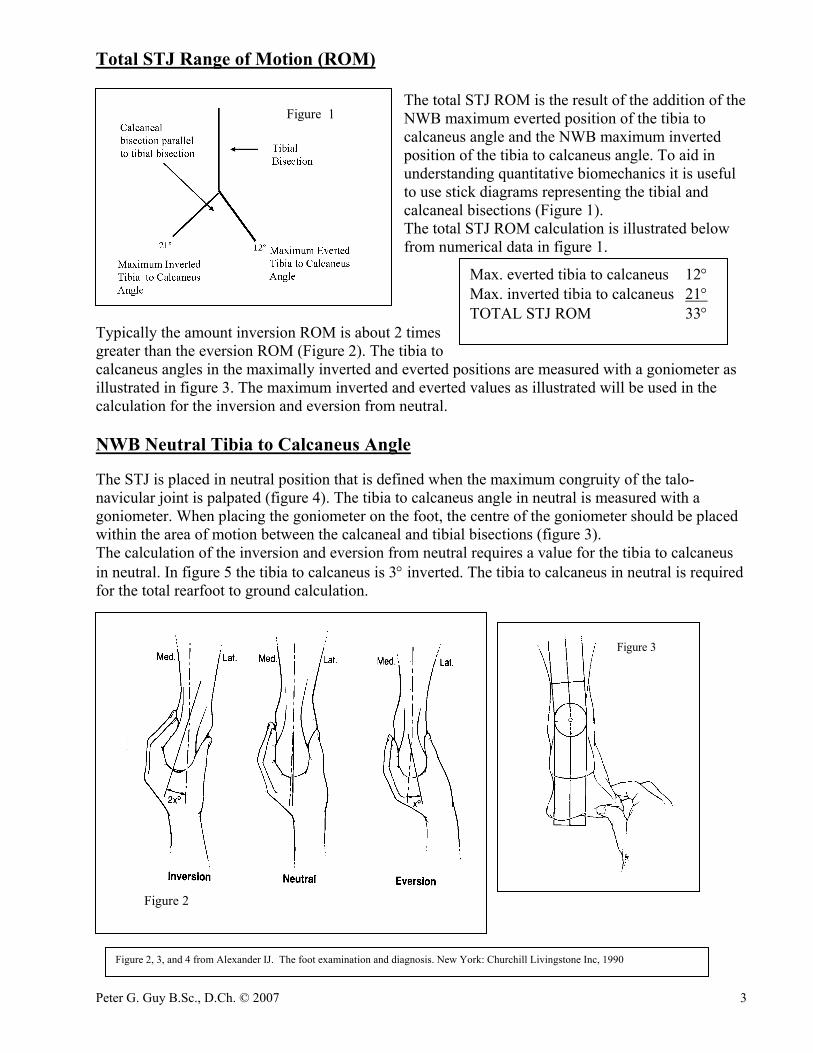
Total STJ Range of Motion (ROM) The total STJ ROM is the result of the addition of the NWB maximum everted position of the tibia to calcaneus angle and the NWB maximum inverted position of the tibia to calcaneus angle. To aid in understanding quantitative biomechanics it is useful to use stick diagrams representing the tibial and calcaneal bisections (Figure 1). The total STJ ROM calculation is illustrated below from numerical data in figure 1.
Typically the amount inversion ROM is about 2 times greater than the eversion ROM (Figure 2). The tibia to calcaneus angles in the maximally inverted and everted positions are measured with a goniometer as illustrated in figure 3. The maximum inverted and everted values as illustrated will be used in the calculation for the inversion and eversion from neutral. NWB Neutral Tibia to Calcaneus Angle The STJ is placed in neutral position that is defined when the maximum congruity of the talo-navicular joint is palpated (figure 4). The tibia to calcaneus angle in neutral is measured with a goniometer. When placing the goniometer on the foot, the centre of the goniometer should be placed within the area of motion between the calcaneal and tibial bisections (figure 3). The calculation of the inversion and eversion from neutral requires a value for the tibia to calcaneus in neutral. In figure 5 the tibia to calcaneus is 3° inverted. The tibia to calcaneus in neutral is required for the total rearfoot to ground calculation.
Figure 2
Figure 1
Max. everted tibia to calcaneus 12° Max. inverted tibia to calcaneus 21° TOTAL STJ ROM 33°
Figure 3
Figure 2, 3, and 4 from Alexander IJ. The foot examination and diagnosis. New York: Churchill Livingstone Inc, 1990
Peter G. Guy B.Sc., D.Ch. © 2007 4
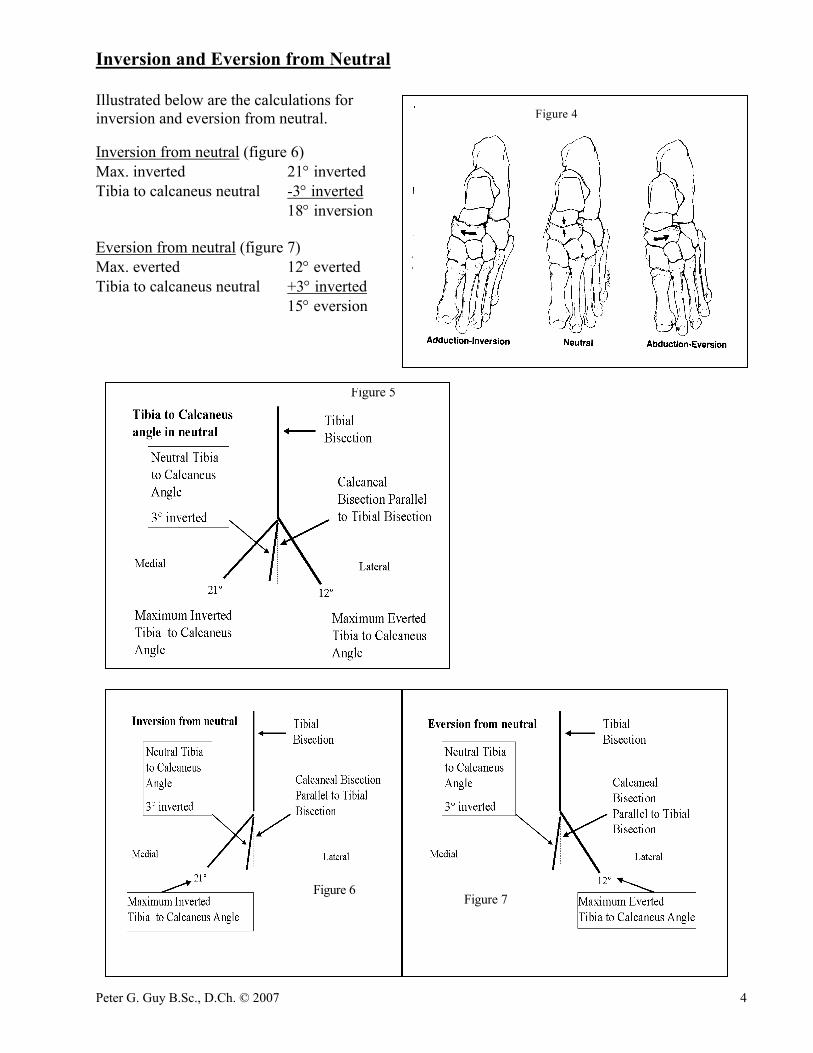
Inversion and Eversion from Neutral Illustrated below are the calculations for inversion and eversion from neutral. Inversion from neutral (figure 6) Max. inverted 21° inverted Tibia to calcaneus neutral -3° inverted 18° inversion Eversion from neutral (figure 7) Max. everted 12° everted Tibia to calcaneus neutral +3° inverted 15° eversion
Figure 5
Figure 6
Figure 7
Figure 4
Peter G. Guy B.Sc., D.Ch. © 2007 5
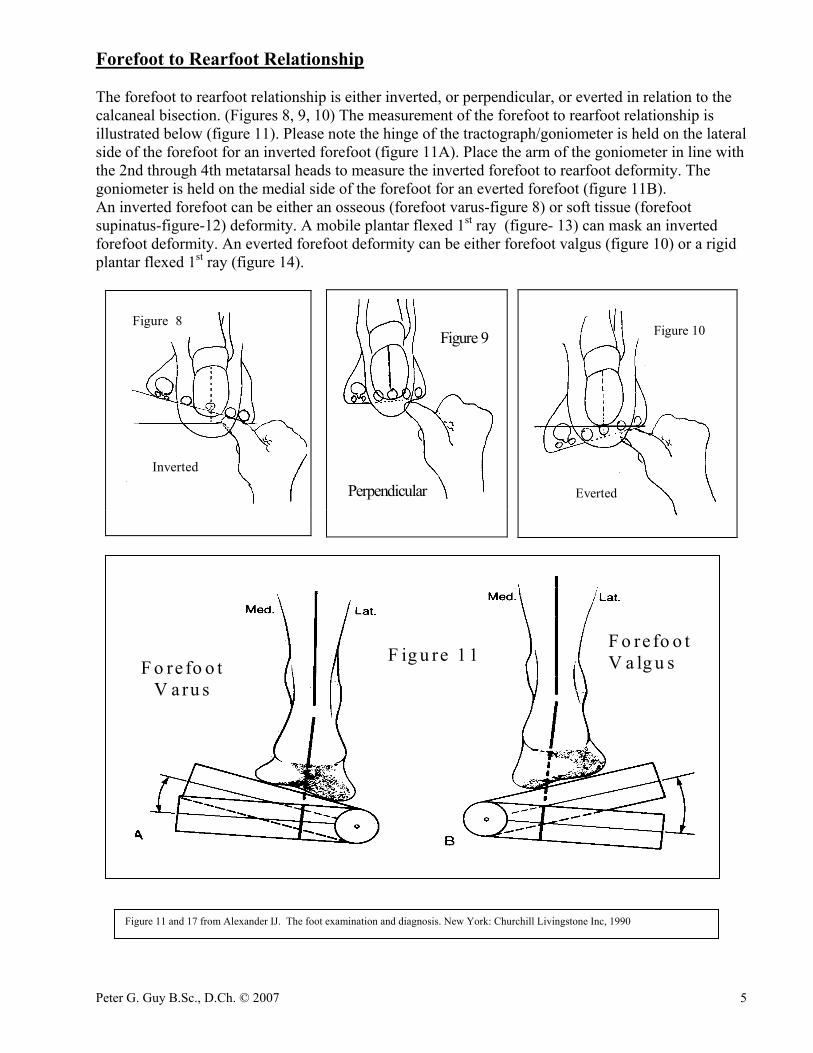
Forefoot to Rearfoot Relationship The forefoot to rearfoot relationship is either inverted, or perpendicular, or everted in relation to the calcaneal bisection. (Figures 8, 9, 10) The measurement of the forefoot to rearfoot relationship is illustrated below (figure 11). Please note the hinge of the tractograph/goniometer is held on the lateral side of the forefoot for an inverted forefoot (figure 11A). Place the arm of the goniometer in line with the 2nd through 4th metatarsal heads to measure the inverted forefoot to rearfoot deformity. The goniometer is held on the medial side of the forefoot for an everted forefoot (figure 11B). An inverted forefoot can be either an osseous (forefoot varus-figure 8) or soft tissue (forefoot supinatus-figure-12) deformity. A mobile plantar flexed 1st ray (figure- 13) can mask an inverted forefoot deformity. An everted forefoot deformity can be either forefoot valgus (figure 10) or a rigid plantar flexed 1st ray (figure 14).
Figure 8
Inverted
Perpendicular
Figure 9
Figure 10
Everted
F ig u re 1 1F o re fo o t
V a ru s
F o re fo o tV a lg u s
Figure 11 and 17 from Alexander IJ. The foot examination and diagnosis. New York: Churchill Livingstone Inc, 1990
Peter G. Guy B.Sc., D.Ch. © 2007 6
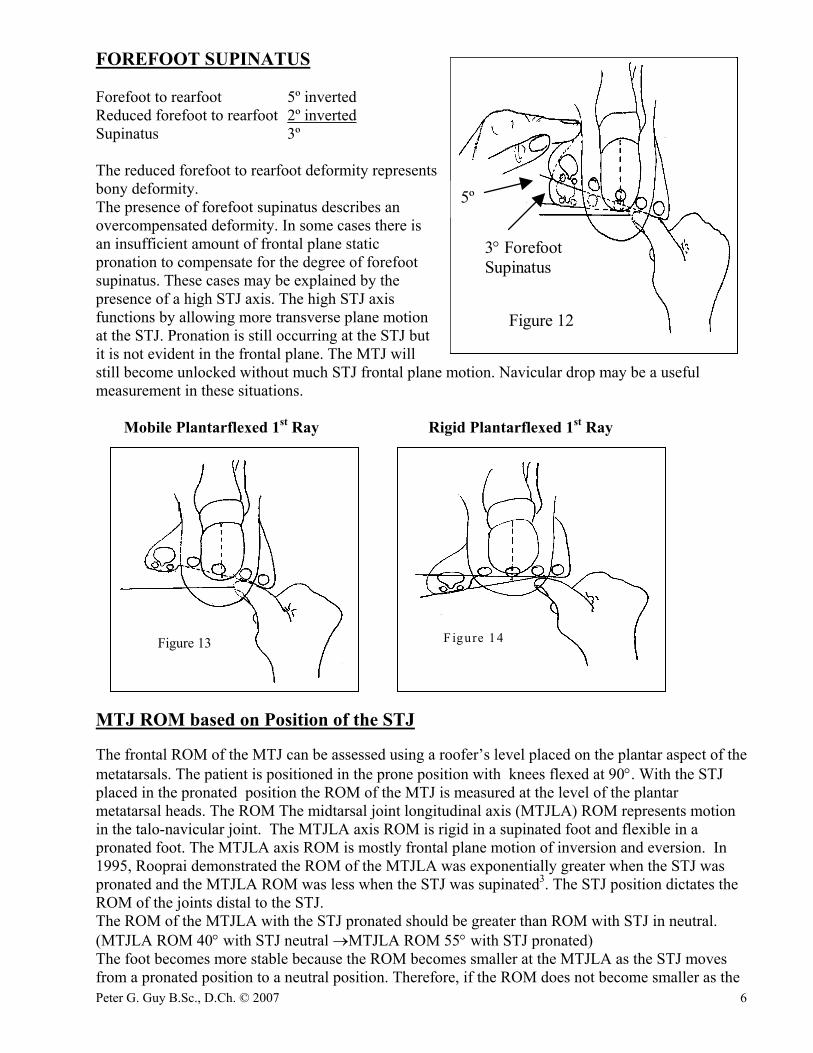
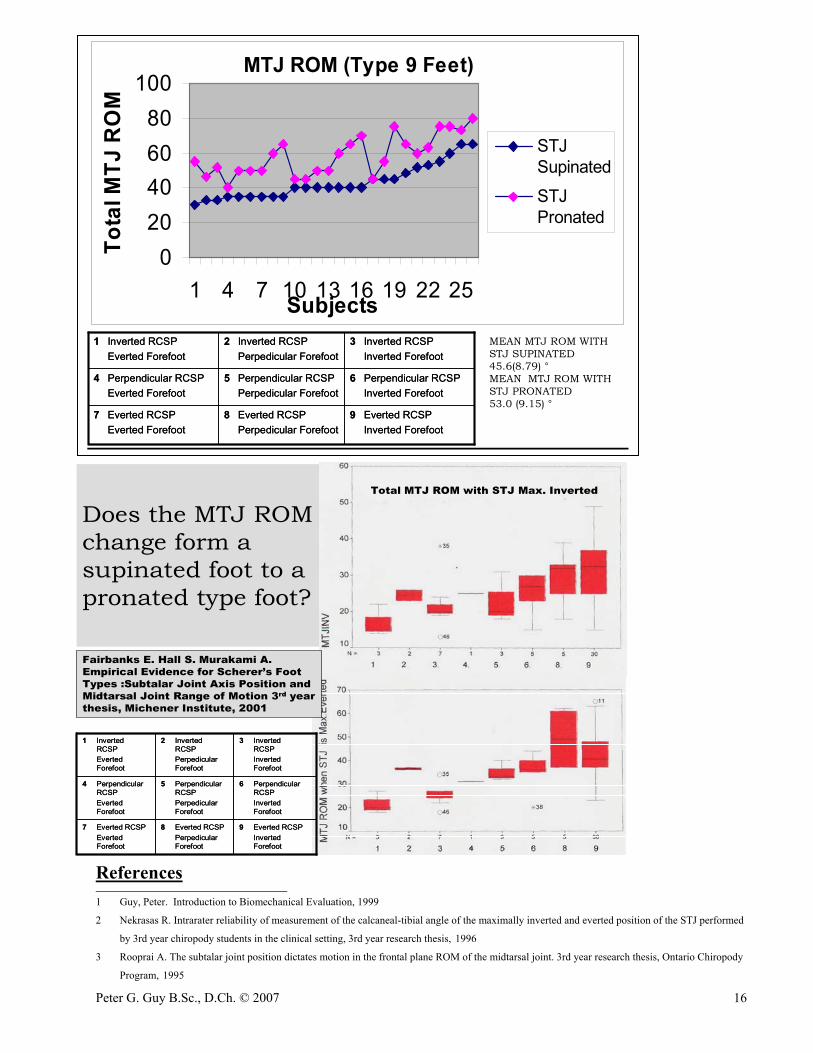
FOREFOOT SUPINATUS Forefoot to rearfoot 5º inverted Reduced forefoot to rearfoot 2º inverted Supinatus 3º The reduced forefoot to rearfoot deformity represents bony deformity. The presence of forefoot supinatus describes an overcompensated deformity. In some cases there is an insufficient amount of frontal plane static pronation to compensate for the degree of forefoot supinatus. These cases may be explained by the presence of a high STJ axis. The high STJ axis functions by allowing more transverse plane motion at the STJ. Pronation is still occurring at the STJ but it is not evident in the frontal plane. The MTJ will still become unlocked without much STJ frontal plane motion. Navicular drop may be a useful measurement in these situations. Mobile Plantarflexed 1st Ray Rigid Plantarflexed 1st Ray MTJ ROM based on Position of the STJ The frontal ROM of the MTJ can be assessed using a roofer’s level placed on the plantar aspect of the metatarsals. The patient is positioned in the prone position with knees flexed at 90°. With the STJ placed in the pronated position the ROM of the MTJ is measured at the level of the plantar metatarsal heads. The ROM The midtarsal joint longitudinal axis (MTJLA) ROM represents motion in the talo-navicular joint. The MTJLA axis ROM is rigid in a supinated foot and flexible in a pronated foot. The MTJLA axis ROM is mostly frontal plane motion of inversion and eversion. In 1995, Rooprai demonstrated the ROM of the MTJLA was exponentially greater when the STJ was pronated and the MTJLA ROM was less when the STJ was supinated3. The STJ position dictates the ROM of the joints distal to the STJ. The ROM of the MTJLA with the STJ pronated should be greater than ROM with STJ in neutral. (MTJLA ROM 40° with STJ neutral →MTJLA ROM 55° with STJ pronated) The foot becomes more stable because the ROM becomes smaller at the MTJLA as the STJ moves from a pronated position to a neutral position. Therefore, if the ROM does not become smaller as the
Figure 12
3° ForefootSupinatus
5º
F igure 14Figure 13
Peter G. Guy B.Sc., D.Ch. © 2007 7
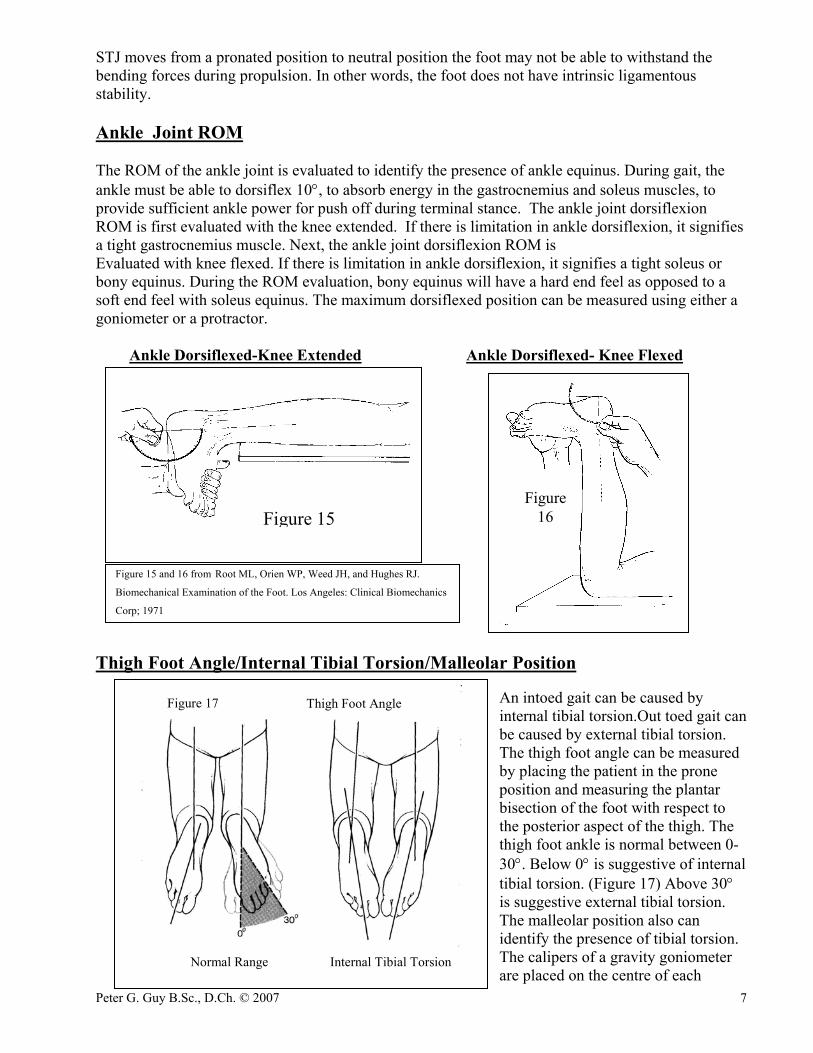
STJ moves from a pronated position to neutral position the foot may not be able to withstand the bending forces during propulsion. In other words, the foot does not have intrinsic ligamentous stability. Ankle Joint ROM The ROM of the ankle joint is evaluated to identify the presence of ankle equinus. During gait, the ankle must be able to dorsiflex 10°, to absorb energy in the gastrocnemius and soleus muscles, to provide sufficient ankle power for push off during terminal stance. The ankle joint dorsiflexion ROM is first evaluated with the knee extended. If there is limitation in ankle dorsiflexion, it signifies a tight gastrocnemius muscle. Next, the ankle joint dorsiflexion ROM is Evaluated with knee flexed. If there is limitation in ankle dorsiflexion, it signifies a tight soleus or bony equinus. During the ROM evaluation, bony equinus will have a hard end feel as opposed to a soft end feel with soleus equinus. The maximum dorsiflexed position can be measured using either a goniometer or a protractor. Ankle Dorsiflexed-Knee Extended Ankle Dorsiflexed- Knee Flexed
Thigh Foot Angle/Internal Tibial Torsion/Malleolar Position
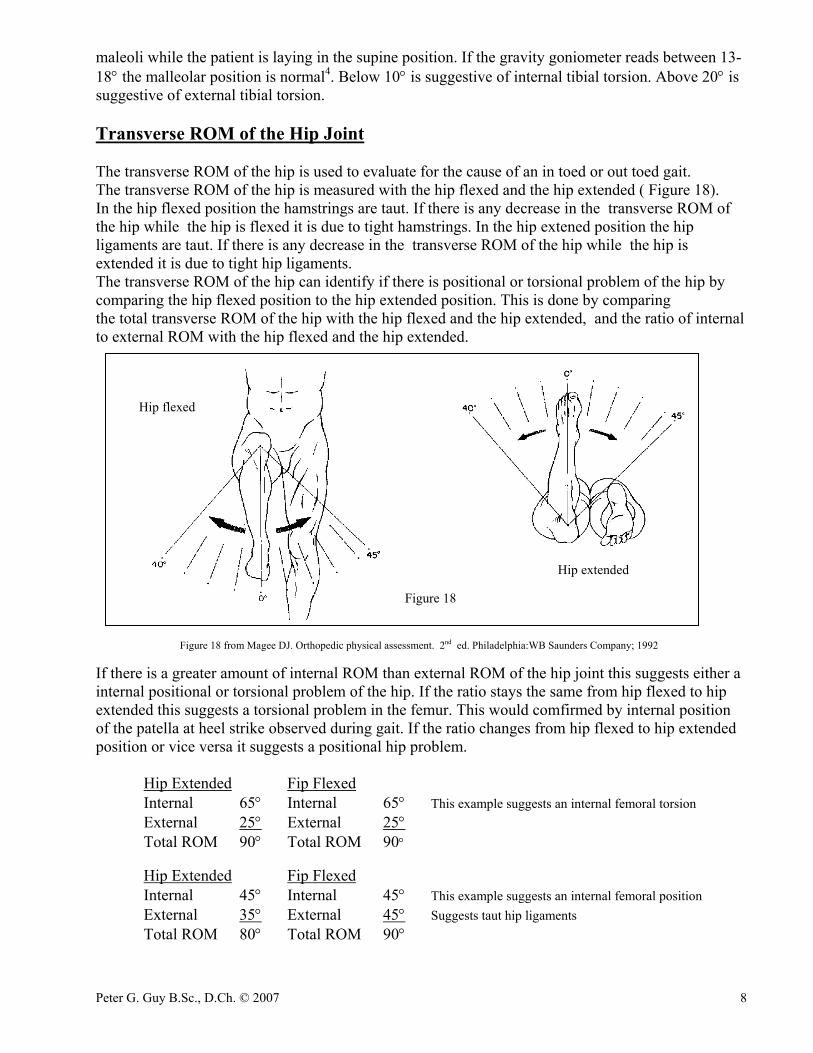
An intoed gait can be caused by internal tibial torsion.Out toed gait can be caused by external tibial torsion. The thigh foot angle can be measured by placing the patient in the prone position and measuring the plantar bisection of the foot with respect to the posterior aspect of the thigh. The thigh foot ankle is normal between 0-30°. Below 0° is suggestive of internal tibial torsion. (Figure 17) Above 30° is suggestive external tibial torsion. The malleolar position also can identify the presence of tibial torsion. The calipers of a gravity goniometer are placed on the centre of each
Thigh Foot Angle
Normal Range Internal Tibial Torsion
Figure 17
Figure 15Figure
16
Figure 15 and 16 from Root ML, Orien WP, Weed JH, and Hughes RJ.
Biomechanical Examination of the Foot. Los Angeles: Clinical Biomechanics
Corp; 1971
Peter G. Guy B.Sc., D.Ch. © 2007 8
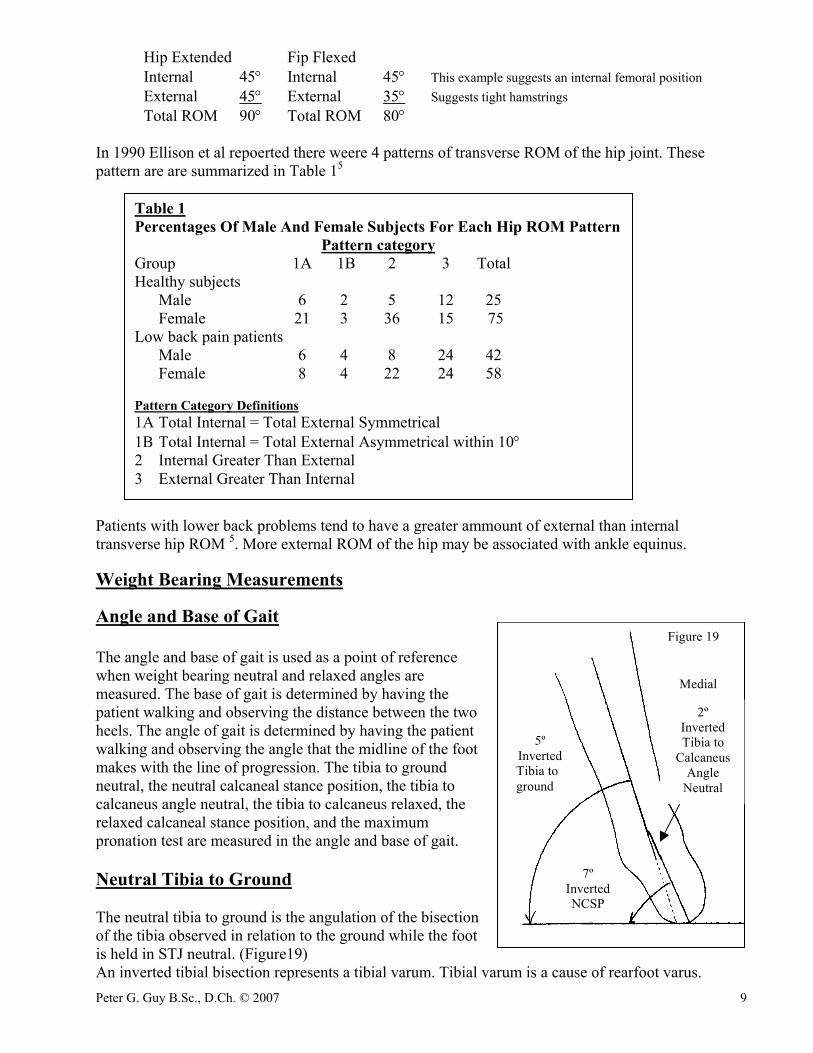
maleoli while the patient is laying in the supine position. If the gravity goniometer reads between 13-18° the malleolar position is normal4. Below 10° is suggestive of internal tibial torsion. Above 20° is suggestive of external tibial torsion. Transverse ROM of the Hip Joint The transverse ROM of the hip is used to evaluate for the cause of an in toed or out toed gait. The transverse ROM of the hip is measured with the hip flexed and the hip extended ( Figure 18). In the hip flexed position the hamstrings are taut. If there is any decrease in the transverse ROM of the hip while the hip is flexed it is due to tight hamstrings. In the hip extened position the hip ligaments are taut. If there is any decrease in the transverse ROM of the hip while the hip is extended it is due to tight hip ligaments. The transverse ROM of the hip can identify if there is positional or torsional problem of the hip by comparing the hip flexed position to the hip extended position. This is done by comparing the total transverse ROM of the hip with the hip flexed and the hip extended, and the ratio of internal to external ROM with the hip flexed and the hip extended. Figure 18 from Magee DJ. Orthopedic physical assessment. 2nd ed. Philadelphia:WB Saunders Company; 1992 If there is a greater amount of internal ROM than external ROM of the hip joint this suggests either a internal positional or torsional problem of the hip. If the ratio stays the same from hip flexed to hip extended this suggests a torsional problem in the femur. This would comfirmed by internal position of the patella at heel strike observed during gait. If the ratio changes from hip flexed to hip extended position or vice versa it suggests a positional hip problem. Hip Extended Fip Flexed Internal 65° Internal 65° This example suggests an internal femoral torsion External 25° External 25° Total ROM 90° Total ROM 90° Hip Extended Fip Flexed Internal 45° Internal 45° This example suggests an internal femoral position External 35° External 45° Suggests taut hip ligaments Total ROM 80° Total ROM 90°
Hip flexed
Hip extended
Figure 18
Peter G. Guy B.Sc., D.Ch. © 2007 9
Hip Extended Fip Flexed Internal 45° Internal 45° This example suggests an internal femoral position External 45° External 35° Suggests tight hamstrings Total ROM 90° Total ROM 80° In 1990 Ellison et al repoerted there weere 4 patterns of transverse ROM of the hip joint. These pattern are are summarized in Table 15 Patients with lower back problems tend to have a greater ammount of external than internal transverse hip ROM 5. More external ROM of the hip may be associated with ankle equinus. Weight Bearing Measurements Angle and Base of Gait The angle and base of gait is used as a point of reference when weight bearing neutral and relaxed angles are measured. The base of gait is determined by having the patient walking and observing the distance between the two heels. The angle of gait is determined by having the patient walking and observing the angle that the midline of the foot makes with the line of progression. The tibia to ground neutral, the neutral calcaneal stance position, the tibia to calcaneus angle neutral, the tibia to calcaneus relaxed, the relaxed calcaneal stance position, and the maximum pronation test are measured in the angle and base of gait. Neutral Tibia to Ground The neutral tibia to ground is the angulation of the bisection of the tibia observed in relation to the ground while the foot is held in STJ neutral. (Figure19) An inverted tibial bisection represents a tibial varum. Tibial varum is a cause of rearfoot varus.
Table 1 Percentages Of Male And Female Subjects For Each Hip ROM Pattern
Pattern category Group 1A 1B 2 3 Total Healthy subjects Male 6 2 5 12 25 Female 21 3 36 15 75 Low back pain patients Male 6 4 8 24 42 Female 8 4 22 24 58 Pattern Category Definitions 1A Total Internal = Total External Symmetrical 1B Total Internal = Total External Asymmetrical within 10° 2 Internal Greater Than External 3 External Greater Than Internal
Figure 19
Medial
2ºInvertedTibia to
CalcaneusAngle
Neutral
7ºInvertedNCSP
5ºInvertedTibia toground
Peter G. Guy B.Sc., D.Ch. © 2007 10
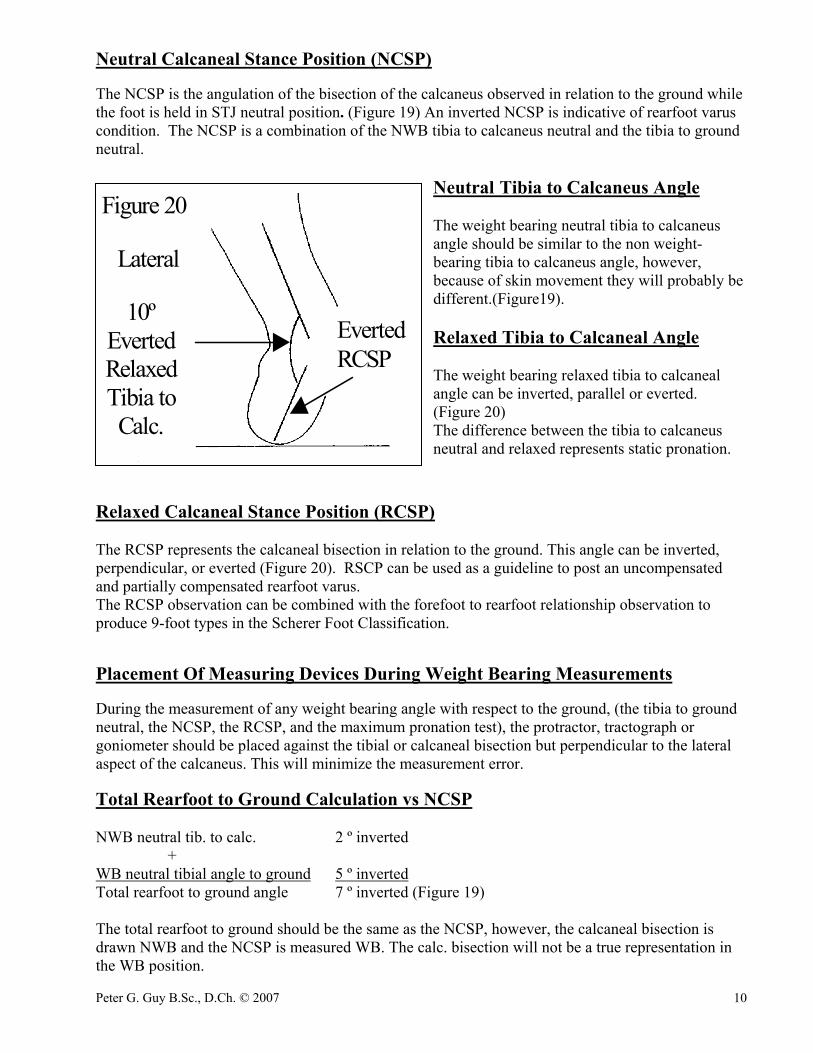
Neutral Calcaneal Stance Position (NCSP) The NCSP is the angulation of the bisection of the calcaneus observed in relation to the ground while the foot is held in STJ neutral position. (Figure 19) An inverted NCSP is indicative of rearfoot varus condition. The NCSP is a combination of the NWB tibia to calcaneus neutral and the tibia to ground neutral.
Neutral Tibia to Calcaneus Angle The weight bearing neutral tibia to calcaneus angle should be similar to the non weight-bearing tibia to calcaneus angle, however, because of skin movement they will probably be different.(Figure19). Relaxed Tibia to Calcaneal Angle The weight bearing relaxed tibia to calcaneal angle can be inverted, parallel or everted. (Figure 20) The difference between the tibia to calcaneus neutral and relaxed represents static pronation.
Relaxed Calcaneal Stance Position (RCSP) The RCSP represents the calcaneal bisection in relation to the ground. This angle can be inverted, perpendicular, or everted (Figure 20). RSCP can be used as a guideline to post an uncompensated and partially compensated rearfoot varus. The RCSP observation can be combined with the forefoot to rearfoot relationship observation to produce 9-foot types in the Scherer Foot Classification. Placement Of Measuring Devices During Weight Bearing Measurements During the measurement of any weight bearing angle with respect to the ground, (the tibia to ground neutral, the NCSP, the RCSP, and the maximum pronation test), the protractor, tractograph or goniometer should be placed against the tibial or calcaneal bisection but perpendicular to the lateral aspect of the calcaneus. This will minimize the measurement error. Total Rearfoot to Ground Calculation vs NCSP NWB neutral tib. to calc. 2 º inverted + WB neutral tibial angle to ground 5 º inverted Total rearfoot to ground angle 7 º inverted (Figure 19) The total rearfoot to ground should be the same as the NCSP, however, the calcaneal bisection is drawn NWB and the NCSP is measured WB. The calc. bisection will not be a true representation in the WB position.
Figure 20
10ºEvertedRelaxedTibia toCalc.
Lateral
EvertedRCSP
Peter G. Guy B.Sc., D.Ch. © 2007 11
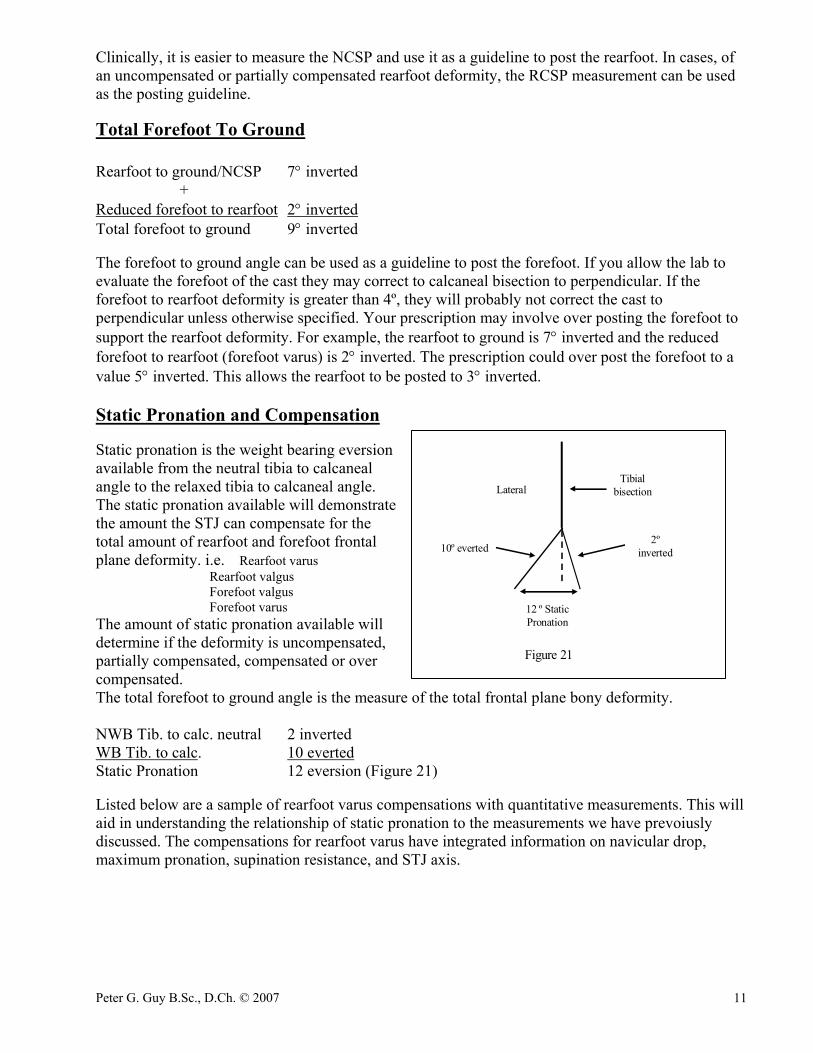
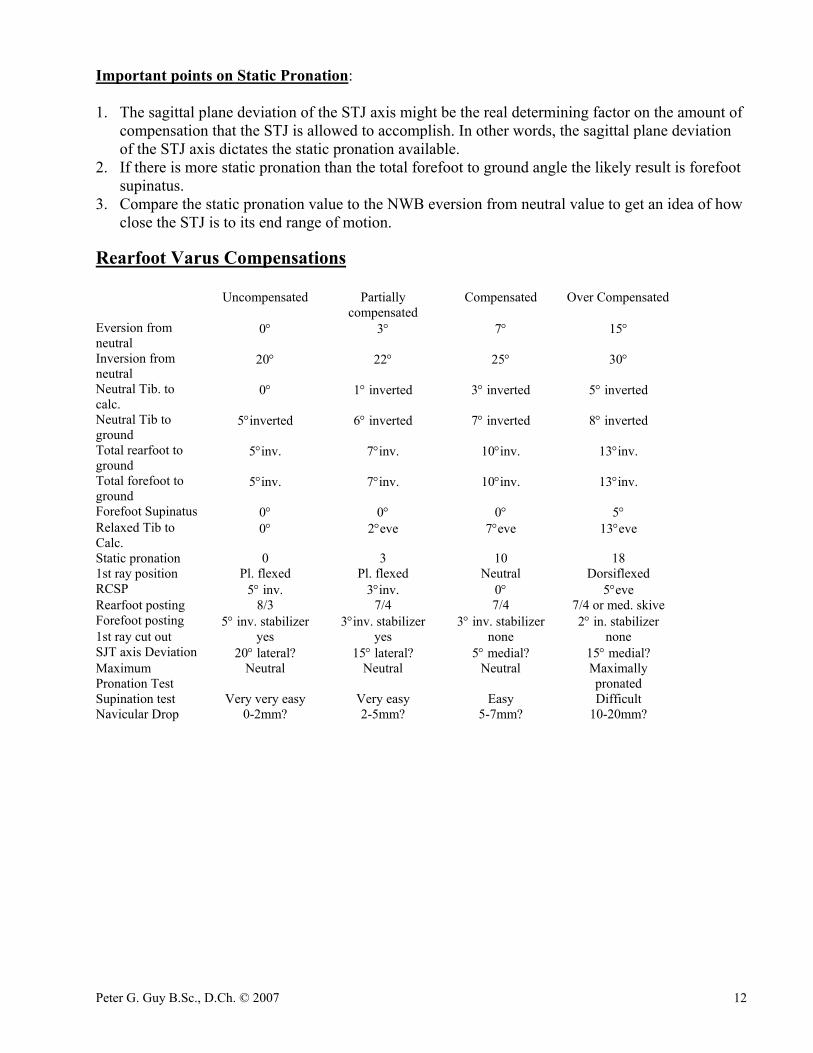
Clinically, it is easier to measure the NCSP and use it as a guideline to post the rearfoot. In cases, of an uncompensated or partially compensated rearfoot deformity, the RCSP measurement can be used as the posting guideline. Total Forefoot To Ground Rearfoot to ground/NCSP 7° inverted + Reduced forefoot to rearfoot 2° inverted Total forefoot to ground 9° inverted The forefoot to ground angle can be used as a guideline to post the forefoot. If you allow the lab to evaluate the forefoot of the cast they may correct to calcaneal bisection to perpendicular. If the forefoot to rearfoot deformity is greater than 4º, they will probably not correct the cast to perpendicular unless otherwise specified. Your prescription may involve over posting the forefoot to support the rearfoot deformity. For example, the rearfoot to ground is 7° inverted and the reduced forefoot to rearfoot (forefoot varus) is 2° inverted. The prescription could over post the forefoot to a value 5° inverted. This allows the rearfoot to be posted to 3° inverted. Static Pronation and Compensation Static pronation is the weight bearing eversion available from the neutral tibia to calcaneal angle to the relaxed tibia to calcaneal angle. The static pronation available will demonstrate the amount the STJ can compensate for the total amount of rearfoot and forefoot frontal plane deformity. i.e. Rearfoot varus Rearfoot valgus Forefoot valgus Forefoot varus The amount of static pronation available will determine if the deformity is uncompensated, partially compensated, compensated or over compensated. The total forefoot to ground angle is the measure of the total frontal plane bony deformity. NWB Tib. to calc. neutral 2 inverted WB Tib. to calc. 10 everted Static Pronation 12 eversion (Figure 21) Listed below are a sample of rearfoot varus compensations with quantitative measurements. This will aid in understanding the relationship of static pronation to the measurements we have prevoiusly discussed. The compensations for rearfoot varus have integrated information on navicular drop, maximum pronation, supination resistance, and STJ axis.
LateralTibial
bisection
2ºinverted10º everted
12 º StaticPronation
Figure 21
Peter G. Guy B.Sc., D.Ch. © 2007 12
Important points on Static Pronation: 1. The sagittal plane deviation of the STJ axis might be the real determining factor on the amount of
compensation that the STJ is allowed to accomplish. In other words, the sagittal plane deviation of the STJ axis dictates the static pronation available.
2. If there is more static pronation than the total forefoot to ground angle the likely result is forefoot supinatus.
3. Compare the static pronation value to the NWB eversion from neutral value to get an idea of how close the STJ is to its end range of motion.
Rearfoot Varus Compensations Uncompensated Partially
compensated Compensated Over Compensated
Eversion from neutral
0° 3° 7° 15°
Inversion from neutral
20° 22° 25° 30°
Neutral Tib. to calc.
0° 1° inverted 3° inverted 5° inverted
Neutral Tib to ground
5°inverted 6° inverted 7° inverted 8° inverted
Total rearfoot to ground
5°inv. 7°inv. 10°inv. 13°inv.
Total forefoot to ground
5°inv. 7°inv. 10°inv. 13°inv.
Forefoot Supinatus 0° 0° 0° 5° Relaxed Tib to Calc.
0° 2°eve 7°eve 13°eve
Static pronation 0 3 10 18 1st ray position Pl. flexed Pl. flexed Neutral Dorsiflexed RCSP 5° inv. 3°inv. 0° 5°eve Rearfoot posting 8/3 7/4 7/4 7/4 or med. skive Forefoot posting 5° inv. stabilizer 3°inv. stabilizer 3° inv. stabilizer 2° in. stabilizer 1st ray cut out yes yes none none SJT axis Deviation 20° lateral? 15° lateral? 5° medial? 15° medial? Maximum Pronation Test
Neutral Neutral Neutral Maximally pronated
Supination test Very very easy Very easy Easy Difficult Navicular Drop 0-2mm? 2-5mm? 5-7mm? 10-20mm?
Peter G. Guy B.Sc., D.Ch. © 2007 13
Figure 22
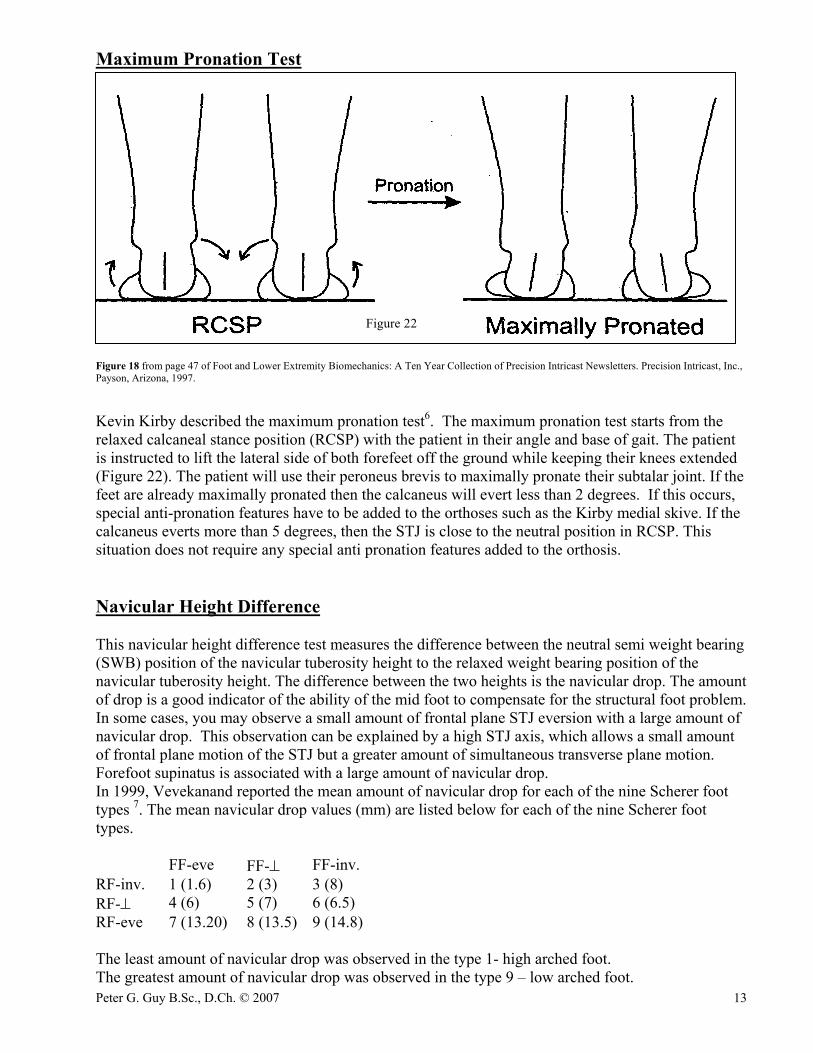
Maximum Pronation Test
Figure 18 from page 47 of Foot and Lower Extremity Biomechanics: A Ten Year Collection of Precision Intricast Newsletters. Precision Intricast, Inc., Payson, Arizona, 1997. Kevin Kirby described the maximum pronation test6. The maximum pronation test starts from the relaxed calcaneal stance position (RCSP) with the patient in their angle and base of gait. The patient is instructed to lift the lateral side of both forefeet off the ground while keeping their knees extended (Figure 22). The patient will use their peroneus brevis to maximally pronate their subtalar joint. If the feet are already maximally pronated then the calcaneus will evert less than 2 degrees. If this occurs, special anti-pronation features have to be added to the orthoses such as the Kirby medial skive. If the calcaneus everts more than 5 degrees, then the STJ is close to the neutral position in RCSP. This situation does not require any special anti pronation features added to the orthosis. Navicular Height Difference This navicular height difference test measures the difference between the neutral semi weight bearing (SWB) position of the navicular tuberosity height to the relaxed weight bearing position of the navicular tuberosity height. The difference between the two heights is the navicular drop. The amount of drop is a good indicator of the ability of the mid foot to compensate for the structural foot problem. In some cases, you may observe a small amount of frontal plane STJ eversion with a large amount of navicular drop. This observation can be explained by a high STJ axis, which allows a small amount of frontal plane motion of the STJ but a greater amount of simultaneous transverse plane motion. Forefoot supinatus is associated with a large amount of navicular drop. In 1999, Vevekanand reported the mean amount of navicular drop for each of the nine Scherer foot types 7. The mean navicular drop values (mm) are listed below for each of the nine Scherer foot types. FF-eve FF-⊥ FF-inv. RF-inv. 1 (1.6) 2 (3) 3 (8) RF-⊥ 4 (6) 5 (7) 6 (6.5) RF-eve 7 (13.20) 8 (13.5) 9 (14.8) The least amount of navicular drop was observed in the type 1- high arched foot. The greatest amount of navicular drop was observed in the type 9 – low arched foot.
Peter G. Guy B.Sc., D.Ch. © 2007 14
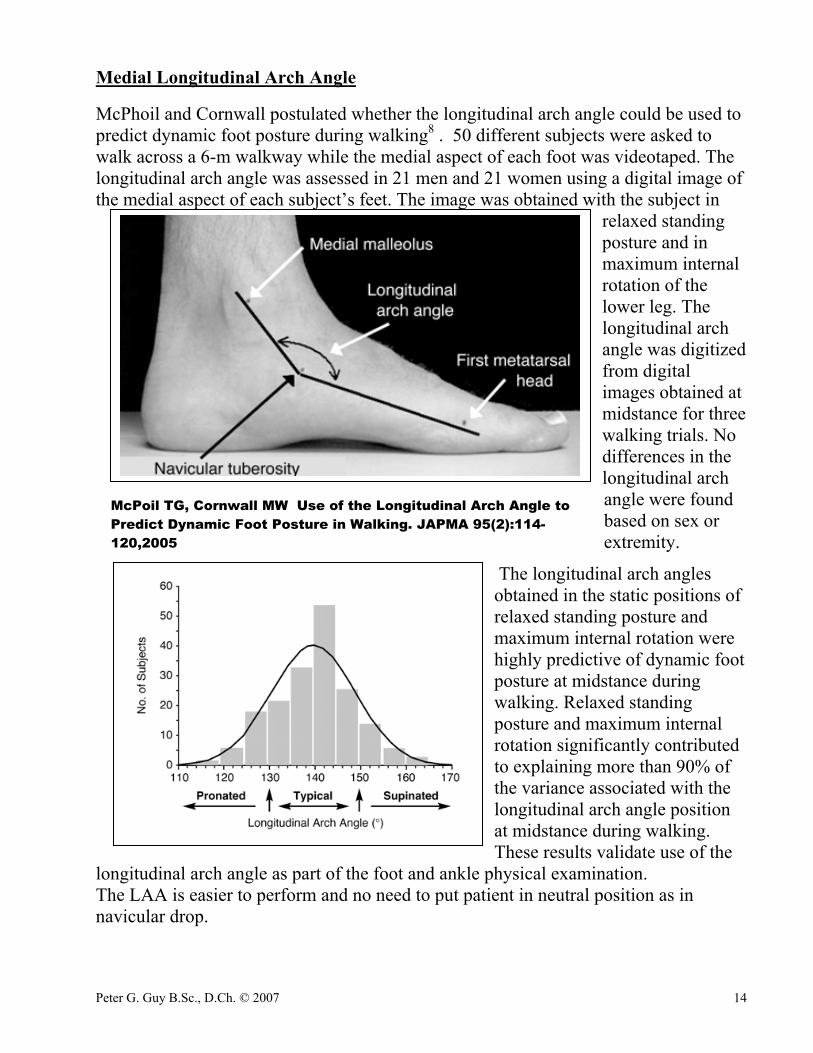
Medial Longitudinal Arch Angle McPhoil and Cornwall postulated whether the longitudinal arch angle could be used to predict dynamic foot posture during walking8 . 50 different subjects were asked to walk across a 6-m walkway while the medial aspect of each foot was videotaped. The longitudinal arch angle was assessed in 21 men and 21 women using a digital image of the medial aspect of each subject’s feet. The image was obtained with the subject in
relaxed standing posture and in maximum internal rotation of the lower leg. The longitudinal arch angle was digitized from digital images obtained at midstance for three walking trials. No differences in the longitudinal arch angle were found based on sex or extremity.
The longitudinal arch angles obtained in the static positions of relaxed standing posture and maximum internal rotation were highly predictive of dynamic foot posture at midstance during walking. Relaxed standing posture and maximum internal rotation significantly contributed to explaining more than 90% of the variance associated with the longitudinal arch angle position at midstance during walking. These results validate use of the
longitudinal arch angle as part of the foot and ankle physical examination. The LAA is easier to perform and no need to put patient in neutral position as in navicular drop.
McPoil TG, Cornwall MW Use of the Longitudinal Arch Angle to Predict Dynamic Foot Posture in Walking. JAPMA 95(2):114-120,2005

Peter G. Guy B.Sc., D.Ch. © 2007 15
Measurement of Leg Length Differences The lower malleoli during standing will indicated the side with functional leg length difference. Functional leg length differences are due to one foot pronating more than the other foot. Controlling the excessive unilateral pronation will address the functional leg length difference.
The iliac crest height can be used as reference point to level a structural leg length9 10. A known thickness of material can be placed under the short leg until the iliac crests are level. The leg length difference should be corrected to half the measured difference. Usually, full foot lifts are required to address structural leg length differences. The supine push- pull test of the tibia and femur while the hip is 90º and the knees are extended is a quick way to identify if there is structural leg length difference (LLD). This will aid in explaining the presence of the following gait indicators: shoulder tilt, uneven arm swing, hip tilt, and scoliosis. This will also give you an idea of the amount of heel lift therapy is required. LLDs can cause unilateral pronation at the STJ. MTJ Sanner suggested to measure the total ROM of the MTJ in the supinated and pronated position to assess intrinsic stability11. MTJ intrinsic stability can be assess by having the patient lying prone with the knee 90 °and the leg held vertical and the ankle at 90°. The STJ is held maximally supinated and the MTJLA ROM is measured with a fluid goniometer. This procedure is repeated with STJ held maximally pronated.
Peter G. Guy B.Sc., D.Ch. © 2007 16
References 1 Guy, Peter. Introduction to Biomechanical Evaluation, 1999
2 Nekrasas R. Intrarater reliability of measurement of the calcaneal-tibial angle of the maximally inverted and everted position of the STJ performed
by 3rd year chiropody students in the clinical setting, 3rd year research thesis, 1996
3 Rooprai A. The subtalar joint position dictates motion in the frontal plane ROM of the midtarsal joint. 3rd year research thesis, Ontario Chiropody
Program, 1995
MTJ ROM (Type 9 Feet)
020406080
100
1 4 7 10 13 16 19 22 25Subjects
Tota
l MTJ
RO
MSTJSupinated
STJPronated
9 Everted RCSPInverted Forefoot
8 Everted RCSPPerpedicular Forefoot
7 Everted RCSPEverted Forefoot
6 Perpendicular RCSPInverted Forefoot
5 Perpendicular RCSPPerpedicular Forefoot
4 Perpendicular RCSPEverted Forefoot
3 Inverted RCSPInverted Forefoot
2 Inverted RCSPPerpedicular Forefoot
1 Inverted RCSPEverted Forefoot
MEAN MTJ ROM WITH STJ SUPINATED 45.6(8.79) °MEAN MTJ ROM WITH STJ PRONATED53.0 (9.15) °
Does the MTJ ROM change form a supinated foot to a pronated type foot?
Total MTJ ROM with STJ Max. Inverted
Fairbanks E. Hall S. Murakami A. Empirical Evidence for Scherer’s Foot Types :Subtalar Joint Axis Position and Midtarsal Joint Range of Motion 3rd year thesis, Michener Institute, 2001
9 Everted RCSPInverted Forefoot
8 Everted RCSPPerpedicularForefoot
7 Everted RCSPEverted Forefoot
6 Perpendicular RCSPInverted Forefoot
5 Perpendicular RCSPPerpedicularForefoot
4 Perpendicular RCSPEverted Forefoot
3 Inverted RCSPInverted Forefoot
2 Inverted RCSPPerpedicularForefoot
1 Inverted RCSPEverted Forefoot

Peter G. Guy B.Sc., D.Ch. © 2007 17
4 Root ML, Orien WP, Weed JH, and Hughes RJ. Biomechanical Examination of the Foot. Los Angeles: Clinical Biomechanics Corp; 1971
5 Ellison J, Rose S, and Sahrmann S. Patterns of hip rotation range of motion: A comparison between healthy subjects and patients with low back
pain. Phys Ther 1990; 70(9):537-41
6 Kirby, K A. : Foot and Lower Extremity Biomechanics: A Ten Year Collection of Precision Intricast Newsletters. Precision Intricast, Inc.,
Payson, Arizona, 1997
7 Vivekanand, B. Investigation into the Relationship of Navicular Height Difference and Foot Classification According to Morphology. 3rd year
thesis, Ontario Chiropody Program. 1999
8 McPoil T G. Cornwall M W. Use of the Longitudinal Arch Angle to Predict Dynamic Foot Posture in Walking
J Am Podiatr Med Assoc 95(2): 114-120, 2005 9 Blake R and Ferguson H. Limb Length Discrepancies. JAPMA. 82:33-38,1992
10 Hoikka V, Ylikoski M, Tallroth K Leg-length inequality has poor correlation with lumbar scoliosis. A radiological study of 100 patients with
chronic low-back pain. Arch Orthop Trauma Surg 1989; 108(3):173-5
11 Sanner WH. Clinical methods for predicting the effectiveness of functional foot orthoses. Clin Podiatr Med Surg 11: 279, 1994.