Introduction of Chinese iced tea drinks into the Spanish ...
36
1 MEMÒRIA DEL TREBALL DE FI DE GRAU DEL GRAU EN NEGOCIS I MÀRQUETING INTERNACIONALS (ESCI) Introduction of Chinese iced tea drinks into the Spanish market AUTOR/A: Sílvia Bau Pineda NIA: 02266 CURS ACADÈMIC: 2012/13 DATA: 10 de juny de 2013 DIRECTOR/S: Lluís Arasanz
Transcript of Introduction of Chinese iced tea drinks into the Spanish ...

1
MEMÒRIA DEL TREBALL DE FI DE GRAU DEL GRAU EN NEGOCIS I MÀRQUETING INTERNACIONALS (ESCI)
Introduction of Chinese iced tea drinks into the Spanish market
AUTOR/A: Sílvia Bau Pineda
NIA: 02266
CURS ACADÈMIC: 2012/13
DATA: 10 de juny de 2013
DIRECTOR/S: Lluís Arasanz

2
Table of contents 1. Introduction .......................................................................................................................... 3
2. Objective ............................................................................................................................... 3
3. Ready-to-drink tea ................................................................................................................ 4
3.1. Previous iced tea ventures ............................................................................................ 4
4. WAHAHA ............................................................................................................................... 5
4.1. Corporate strategy ....................................................................................................... 5
5. Analysis of the Spanish Market ............................................................................................. 6
5.1. Market definition .......................................................................................................... 6
5.2. Beverage Industry ......................................................................................................... 7
5.2.1. Structure ................................................................................................................ 7
5.3. Consumer and user analysis .......................................................................................... 8
5.3.1. Market size and growth ........................................................................................ 8
5.3.2. Market segments .................................................................................................. 8
5.3.3. Consumer behavior ............................................................................................... 9
5.4. Distribution analysis .................................................................................................... 10
5.5. The RTD Iced tea sector............................................................................................... 10
5.5.1. Competitive analysis ........................................................................................... 10
6. SWOT analysis ..................................................................................................................... 12
7. Commercial plan ................................................................................................................. 13
7.1. Entry plan .................................................................................................................... 13
7.1.1. Product ................................................................................................................ 13
7.1.2. Price ..................................................................................................................... 14
7.1.3. Promotion............................................................................................................ 15
7.1.4. Place .................................................................................................................... 16
8. Financial statement ............................................................................................................. 17
9. Conclusions ......................................................................................................................... 18
10. References ....................................................................................................................... 19
Exhibits ........................................................................................................................................ 21

3
1. Introduction
Beverages’ main purpose is to hydrate and refresh our body; it can be drunk alone or in social
gatherings. In fact, we normally ask for refreshing drinks such as carbonated and sugary drinks
when we meet our friends or relatives, however, products such as iced tea beverages can also
refresh us while taking care of our health and Spain lacks good quality iced tea drinks.
Tea is original from China and according to (Macfarlane and Macfarlane 2004) tea it is the
second most widely consumed beverage worldwide after water. Indeed, it is healthy and it has
calming effects, even if it contains caffeine (sometimes called theine). In addition, it is
appropriate for fighting against thirst in the Spanish summers. Therefore, my motivation for
writing this paper came after feeling a lack of iced tea products in the Spanish market. This is
why I believe in the introduction of the original Chinese ready to drink iced tea into our market.
We considered Wahaha as the most feasible company because it is the drink leader company
in China and it is already selling the product we want to introduce. In addition to it, Wahaha is
already considering the entrance in the European market; therefore we are in charge for the
Spanish region. At a personal level, the project will give life to the personal goal of introducing
a product into our market and it will be the first occasion to fully apply the knowledge learnt
during the undergraduate program.
In this paper the idea of importing tea into the Spanish market is going to be studied.
Therefore, we will first present the product and company to introduce, then we will analyze
the context of the Spanish market and we will deep into the beverage industry.
Finally, we will develop the entry plan to explain the best way to introduce the tea drink into
the specific Spanish market.
2. Objective
The main objective of this project is to describe what, who and how the Chinese product is
going to be introduced in the Spanish market.
What it is going to be introduced is a ready to drink iced tea beverage to the Spanish
consumers. Therefore, we will analyze the product and the market where we are going to sell
it. We want to determine which kind of iced-tea beverage we want to sell and whether it will
fit the market.

4
The player in the study will be a distributor buying tea from the Chinese company Wahaha, the
actual leading beverage company in China that already produces a successful iced tea
beverage for the Chinese market.
Finally, there is going to be a description of the product, price, promotion and place strategy in
order to shape the way how to enter the Spanish market and track whether the whole strategy
will be successful or not.
3. Ready-to-drink tea
We aim to introduce low sugar and sugar free original tea drinks in the Spanish market since
having real tea-flavor taste tea has not been done before in the country. We want to introduce
the varieties of Green tea, Jasmine tea and Oolong tea. Black tea would be excluded due to its
bitterer flavor. Therefore, Wahaha, the leading beverage company in China seems the perfect
partner for the introduction of Chinese tea in Spain.
Wahaha tea portfolio includes all range of low and sugar-free original tea series, iced tea drink
with different fruit flavors and herbal fruit tea drink (See Exhibits 1).
Launching the original tea series will show the western drinkers the real Chinese tea concept
which consists of the authentic tea flavor without any other additional flavoring component. A
fruit-based tea drink would be perceived for consumers as a westernized sweetened tea which
has already been launched previously. On the contrary, the Chinese, natural approach from
Wahaha tea will differentiate this product from the previous introduced cases.
3.1. Previous iced tea ventures
It is not the first time RTD iced tea is launched in Spain; actually, besides the successful Nestea
and Arizona tea, there have been several failures as well. Nevertheless, it is hard to track them
down since businesses are reluctant to talk about their failures. Therefore, based on
consumer’s memory the most recent cases will be studied.
In 2006, Trina hit the market with Trina T a tea beverage combining 4 different fruits - apple,
peach, melon and lemon - and 4 different teas – green, red, white and black - . In this case,
there were PET 500ml bottles sold in supermarkets and 250ml glass bottles sold in bars and
restaurants. According to consumer’s opinions on (Ciao 2007), the product was refreshing,
sweet and tasty, however people felt Trina T did not taste as tea and sometimes it was even
watery.

5
The following case was Pascual that launched Tealia in 2007, a product composed of tea, less
than 0.2%, and fruit. The drink was presented in 250ml exotic-looking bottles and the price for
1 litter of Tealia in the supermarket went between 1.36€ and 1.60€. According to consumer’s
opinions on (Ciao 2007), the product was sweet and tasty yet it was missing tea flavor.
All products launched in Spain have been a combination of tea and fruit or even honey as
Arizona is doing right now. Still, the product we want to introduce is pure tea without any fruit
content because our objective is to offer a refreshing, healthy, pure tea-flavored drink. In
addition, Wahaha tea contains 4.3g/l of tea which represents nearly four times more quantity
of tea than Nestea 1.1g/l.
4. WAHAHA
Wahaha Group Co., Ltd, founded in 1987, is the largest beverage company in China. Nowadays
it has 150 subsidiaries around the country and sells in Singapore, USA, Canada, Italy and Japan.
The company has 9 category products and more than 100 SKUs. Nevertheless, 3 of the
categories; dairy drinks, tea drinks and convenience-food constitute the major part of the
company’s income.
Wahaha was founded by Mr. Zong Qinghou and two retired teachers. Initially, the business
was set to produce a special beverage for children with a medicinal effect to increase their
appetite. Yet, in few years, the company was such a success that it merged and acquired other
companies and it ended up producing several kinds of drinks (Wahaha 2012).
4.1. Corporate strategy
Wahaha’s mission is to share a healthy and happy life with the consumers all over the world;
therefore the company pursues to satisfy the thirst of as many consumers as possible from all
the range of ages and all possible countries.
Wahaha’s values are professionalism, confidence, passion and innovation.
Their vision is to become a world-class beverage provider, having a long lasting enterprise and
taking social responsibilities. The company’s mid-term objective is to expand both in Europe
and the USA. So Spain lies within their scope of possibilities.
Wahaha’s portfolio comprises bottled tea, milk drinks, energy drinks, bottled mineral water,
fruit juice, porridges, carbonated drinks and yoghurt beverages.

6
Wahaha’s distribution model in China is based on agents. The account managers are
responsible to contact first-level agents and supervise them to assure they obtain profit. The
company must assure agents make profits as they strongly believe agents are the key element
in the distribution channel to obtain success.
According to an interview with (Zong 2012), Wahaha’s founder, the company avoids the
country planned sales networks since it involves fierce competition on price, instead, Wahaha
has their own agents located over all the Chinese region.
5. Analysis of the Spanish Market
5.1. Market definition
Spain is a European democracy located in a South-Europe peninsula which lies in between the
Atlantic Ocean and the Mediterranean Sea. Therefore, it is an excellent sea communication’s
center. In addition its currency is Euro which facilitates relations between countries.
In 2012 there was a population of 46.8 million people (Instituto Nacional de Estadistica 2013)
which has increased by 2.65% in the last 5 years. If we want to nuance, 49.34% are men and
50.66% are women. The regions in the peninsula with the hugest population rates are
Andalusia, 17.88%, Catalonia, 16.02% and Madrid, 13.75%. On the opposite, the ones with the
lowest population are Rioja 0.17%, Cantabria 0.18% and Navarra 0.68% (see Exhibits 2).
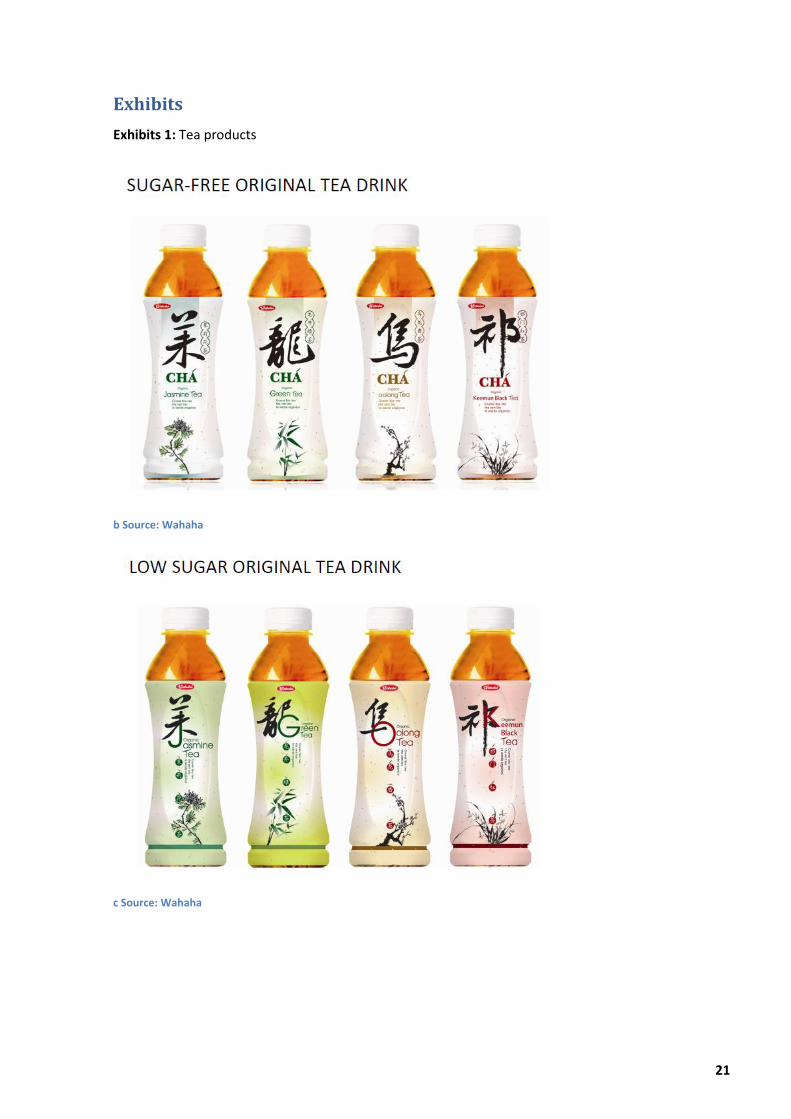
In terms of population density, inside the peninsula, Madrid turns out to be the region with
highest number of people per km, 809.52, followed by the Basque country, 303.32, and
Catalonia, 235.92 habitants per kilometer (see Exhibits 3). This data is going to be relevant to
plan the distribution strategy.
Finally, it must be pointed out that according to INE (Instituto Nacional de Estadistica 2013)
Spain has an aged population due to a birth-date life expectancy averaged 82.09 years in 2011
combined with an average of 1.36 children per woman.
Regarding the economy, Spain is facing a strong crisis with an outrageous unemployment of
27.16% (Instituto Nacional de Estadistica 2013) by the end of 2013 first term. This fact is having
an effect in all the sectors, including the beverage one.
Products sold in Spain carry a 21% VAT tax and EU custom tariffs must be checked in order to
import a product from China.

7
Spain’s relation with China is increasing, actually, from 2006 to 2010 imports from the Asian
country increased by 31.64%. Hence, introducing a new Chinese product seems feasible.
In terms of culture, in the 1980’s new social and beauty canons hit the Spanish society and
people began to worry about their appearance and personal care. Therefore, ANFABRA
(Asociación Nacional de Bebidas Refrescantes Analcoholicas 2010) claims that the soft drinks
market pioneer in offering low calorie drinks maintaining good flavor to adapt to the new
demands. Moreover, due to Spain’s warm weather and traditions, we are used to having social
gatherings in public bars and restaurants.
5.2. Beverage Industry
The Spanish soft-drinks industry offers a huge variety of choices for each different occasion
and palate. It comprises a wide range of beverages: carbonated and non-carbonated drinks,
juices, tonics, sport beverages and iced tea or coffee drinks all in different packaging and sizes.
Low-calorie beverages are also among the choices and, actually, it already represents 30% of
the offer. And increased concern for a healthy and beauty body is considered the key for such
an increase in the low-calorie products consumption.
According to ANFABRA (Asociación Nacional de Bebidas Refrescantes Analcoholicas 2010), low
calories soft drinks and energy drinks consumption have both increased during last year (4.6%
and 10% respectively). On the contrary, juices and tea drinks consumption has decreased
during the same period of time (-35% and -4%).
ANFABRA is the Spanish association of non-alcoholic soft drinks producers and it regulates the
sector and gives information about it. UNESDA is the European Association of the same
industry and it gathers all EU country members to offer information and directions towards a
harmonized industry. Moreover, the Spanish Food and Nutrition Security Agency is the entity
in charge of guaranteeing the product security and regulate the industry.
5.2.1. Structure
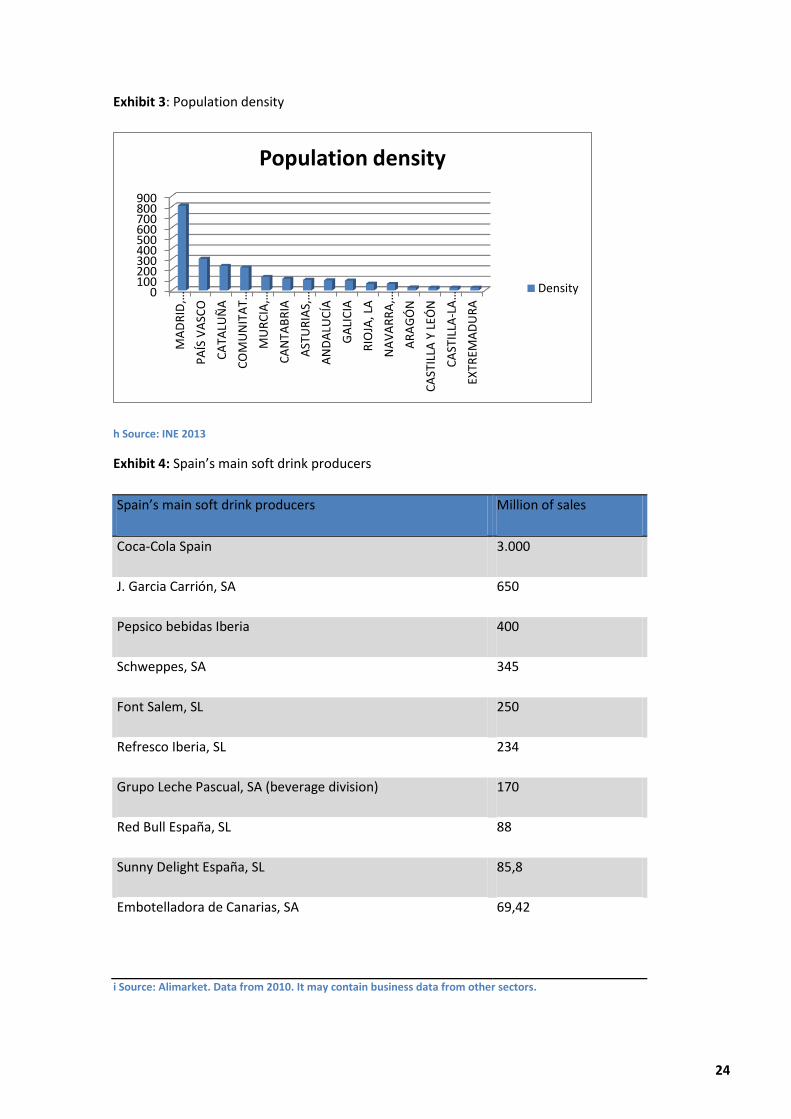
Spain has around 70 soft drink producers highly differentiated (see Exhibits 4). Despite the
huge number of businesses, few big companies dominate the market. In fact, 68% of
businesses have 10 or fewer workers (see Exhibits 5) and the biggest company has 58.8% of
sales and 71.3% of market value meaning that there is huge concentration in the market
(Mercasa 2011).

8
There is a shortage of information regarding the beverage imports due to a low quantity of
imports. Transport costs and warehouse eat out the product’s benefit. Hence, foreign
businesses tend to set plants in the country in order to compete with the local producers. In
2010, imports were around 100 million liters which represents 2.1% of the total consumption1.
The beverage industry is a highly innovative area where new products are launched regularly
to meet new consumer expectations. Actually in 2011, 148 new products hit the market
(Campos and Gómez Bengoechea 2013), so even if not all of them succeed, the industry is
highly dynamic and consumer oriented. In fact, innovation is following low calorie products,
sport beverages and tea flavors as these are the products experiencing an increasing but slow
growth evolution (see Exhibits 6).
5.3. Consumer and user analysis
5.3.1. Market size and growth
In 2011, the Spanish soft drinks market reached 4567.2 million of liters which is 95.8 liters per
capita. Compared to 2010, the market has grown by 0.96% recovering for its downturn since
the beginning of the crisis. In fact, over the last 5 years statistics show a decrease of 0.8%
(Canadean 2012).
Actually, there is an overall of 36,870,000 consumers; 12,857,000 homes consuming soft drinks
and 239,191 businesses from the HORECA2 sector selling soft drink beverages as well as 19,454
other food businesses (Campos and Gómez Bengoechea 2013).
Beverages are sold in different packages, the most used is the plastic PET3 56% followed by the
cans 26% and glass bottles 13% (Asociación Nacional de Bebidas Refrescantes Analcoholicas
2010).
5.3.2. Market segments
According to (Asociación Nacional de Bebidas Refrescantes Analcoholicas 2010), the beverage
market has been segmented into age, geography and sex.
Regarding age, ANFABRA (Asociación Nacional de Bebidas Refrescantes Analcoholicas 2010)
claims that young consumers prefer sweet flavors against bitter ones and besides that; they
are prone to trying new products. However, the older the consumer the more bitter he prefers
1 Data calculated with information from Munimerca and the consumption analysis in 2011 from UNESDA.
2 Spanish acronym that stands for: Hotels, Restaurants and Caterings.
3 PET is a container made of Polyethylene Terephthalate.

9
the drinks and in a higher intensity flavor. Despite of the huge number of annual innovations,
aged people tend to stick to traditional flavors resulting in a difficult market for new flavor
participants.
Concerning geography, Levante and Andalucia are the Spanish regions with the highest
consumption of beverages due to higher temperatures which increase the need for hydration
among consumers. Catalonia and Madrid show the highest preference among autonomous
communities for the low-calorie beverages and Catalonia, Aragón and Baleares are the less
traditional flavor attached people. Finally, tea it is most consumed in northern regions such as
Navarra, País Vasco and Cantabria.
And last, regarding sex, men preferences are cola drinks, non-carbonated drinks and energy
beverages. Whereas women prefer functional drinks4 or low calorie beverages due to a higher
concern towards health. Hence, women are the ones who prefer iced tea drinks.
5.3.3. Consumer behavior
As it has been mentioned before, the Spanish consumer has a traditional palate, meaning that
he tends to prefer the classical flavors against the new ones. To exemplify it, in 2010 cola
drinks were the favorite drinks for the Spanish consumers, followed by the orange and lemon
drinks. Tea drinks only counted as favorite drink in 3% of the cases meaning that our country is
reluctant to changes in the flavors and drinks (see Exhibits 7).
Regarding the consumption moment, 55% of Spaniards consume soft drinks during the week
and 75% consume them during the weekend (Asociación Nacional de Bebidas Refrescantes
Analcoholicas 2010). The explanation lays in the fact that Spaniards tend to associate drinking
soft beverages with a social gathering moment.
People have different drinking preferences, and they do not always consume the same product.
Variances come because of the moment of the day, the place, food, activity, etc. So one
consumer drinks a range of different beverages and is not loyal to the same drink in all the
occasions.
Spain is a southern Mediterranean country and as such its population is attracted by colorful
and sweet drinks. On the contrary, Northern countries in Europe prefer functional beverages
(Asociación Nacional de Bebidas Refrescantes Analcoholicas 2010).
4 Functional drinks are beverages with higher nutritional effects that represent a benefit for health.

10
5.4. Distribution analysis
Beverages are distributed mainly through wholesalers to the HORECA sector and through
supermarkets, hypermarkets and traditional points of sale to the home consumers.
Even if HORECA accounts for 30% of the sales (Asociación Nacional de Bebidas Refrescantes
Analcoholicas 2010), there is a clear downsizing tendency due to the current crisis. Consumer’s
habits have been shaping due to the economic recession and social gatherings in the bar have
been substituted by the same encounters at home. Therefore, consumption has maintained.
5.5. The RTD Iced tea sector
According to Canadean (Canadean 2012) the ready to drink (RTD) iced tea drinks market is
defined by all the range of beverages carbonated and non-carbonated packaged tea-based
drinks. It can contain black, green, oolong, barley, rooibos, white and mate tea, fruit, flower
and herbal teas. The production of RTD iced tea can be both brewed tea or tea extract and the
product can either be hot or cold-filled.
It is considered RTD Iced tea even when it contains additional flavorings such as fruit, flowers,
herbs, fruit juice, sweeteners and others.
All products that have tea as the base flavor are also included in this category containing at
least 5-30% of tea5. However, it is not considered into RTD iced tea drinks category the
products where tea acts as a flavor ingredient instead of base ingredient.
In Spain the RTD Iced tea market accounts for 136.5 million liters which represents 3% of the
total soft drink market.
5.5.1. Competitive analysis
According to Porter (Porter 2009) companies must study more players than the mere direct
competitors. Therefore, the threat of new entrants, suppliers and buyers, the industry rivalry
and the threat of substitutes are going to shape our final success in the iced tea beverage
industry.
First of all, the threat of new entrants is low due to the initial capital investment for an
efficient marketing campaign, given the fact that it is a new product; the access to the
distribution channels, regulations for international companies to enter the Spanish market and
finally the custom tariff for Non-EU products. To nuance on the legislation; imported food
5 It may vary depending on the country. For example USA admits lower levels for premium products.

11
must have the equivalent hygiene level as the national. Therefore Wahaha should consider its
water quality according to Directive 98/83/CE 1998 and its hygienic maintenance according to
the Annex II in the regulation (EC) 852/2004 from the European parliament and the council.
Nevertheless, regulations apply to whole Europe, so once Wahaha has entered one market
they will have fewer difficulties to enter the other EU ones.
Secondly, the threat of suppliers is low since the iced-tea production raw materials is tea and
China is the biggest tea producer country in the world6, tea is not a product that can be widely
differentiated, however, it cannot be easily substituted and should iced tea products have
great profits, they could consider producing it themselves.
Thirdly, the threat of buyers is medium since even if there are several of them, supermarkets
are big companies with high competence to reach the shelves. A part from that, if we nuance
to the end consumer point of view, the threat is also medium since there are a huge number of
consumers that make low quantity sales, however they can easily produce it at home and
Spanish consumers are facing a crisis which is shaping its behavior.
Fourthly, the industry rivalry is high since the Spanish iced tea industry is small and it has few
different-sized competitors.
The biggest and most important player in the arena is Coca-cola with its Nestea drinks;
according to data from Nielsen gathered in Alimarket web page, (Rodero 2012)Nestea has a 63%
of the market volume and 86% of its value. The rest of the market volume and value is shared
among Lipton ice Tea from PepsiCo, Arizona Tea and some other minor brands. Looking at the
numbers, it is clear that Nestea is the clear leading aspiration brand in the industry which
reduces the possibilities for new entrants and, in addition, there is moderate market growth.
Finally, the treat of substitutes is very high since several different similarly-priced beverages
can cover the same need; reduce thirst. Therefore, competence between different kinds of
beverages will be high.
Overall, competition appears to be high and Wahaha might have to overcome big obstacles in
case they enter the Spanish beverage market.
6 In 2011, China was ranked the first among the world’s production, which reached 1,620,000 tons.

12
6. SWOT analysis
SWOT analysis should be further studied to discover Wahaha’s possibilities to hit and succeed
in the Spanish market.
STRENGHTS
- Wahaha is already experienced in selling into other markets
- It is a multinational big company so it already competes with economies of scale
- Wahaha is already a successful brand in China therefore it is already a solid company
- Iced tea beverages are already a successful product in China
WEAKNESSES
- Manufacturing centers are distant from the final point of sale in Spain
- Wahaha is inexperienced towards the Spanish market, which is different from the
Chinese one.
- Language and culture is completely different in both markets.
OPPORTUNITIES
- Chinese origin denomination adds value to the final product
- Undisclosed market
- Capacity to grow in a new market
- Consumer increasing desire for oriental or functional products
THREATS
- Unknown brand for Spanish population
- The Spanish and European legislation on the imports of food products hinders the
exchange.
- Relatively new and unknown product
- Spanish market size is small compared to the Chinese one.
- Wahaha is a Non-European company
After balancing the pros and cons, Wahaha has a place to get into the Spanish market that it is
barely touched and the company is strong enough to face the entry. Nevertheless, they must

13
face increased uncertainty due to huge distance between both markets, not only in terms of
geography but also in terms of culture.
7. Commercial plan
7.1. Entry plan
The 4 P in the marketing mix; product, price, promotion, place, will perfectly define the way in
which to maximize the benefits of the entrance, reach a wider population and reduce
uncertainty.
7.1.1. Product
We wanted to test whether our healthy, low-sugary oriental tea concept was going to be
accepted in the Spanish society; therefore we carried on a survey among 365 women
participants in the area of Barcelona to see the reasons why they drink iced-tea beverages (see
Exhibits 8).
It was discovered that in 31% of the cases the first reason for drinking iced tea beverages was
for its health benefits and 20% for its flavor. On top of that, it was given the opportunity to
distribute 91 samples of Wahaha tea among 91 students in Barcelona to give feedback on the
real product taste (see Exhibits 9). The results showed that 44 people said the product was
tasteless and watery, 26 claimed it was a real tea drink, 12 of them stated the product was too
bitter and still 9 people complained the product was too sweet. In light of the results above,
Wahaha should consider increasing the tea flavor to avoid consumers complaining about the
wateriness.
Regarding the product’s packaging we recommend to use the plastic PET bottle as it is
recyclable and low-cost; in addition, it is the actual packaging the company is using in China
which will favor economies of scale. Besides that, the actual selling size is 500ml which fits the
consumer’s needs and is sufficient to turn down thirst. Yet, 16 out of the 91 people trying the
samples considered the quantity excessive so Wahaha could plan smaller sizes in the future to
cover all the preferences.
Concerning the brand name, the best option will be to avoid setting Wahaha as the product
name as to prevent the attachment of the brand name to only the tea drink. Instead, having a
long-term vision we recommend using a different name to foster further product introductions.
In order to link the brand company name and the new products one, we suggest Teahaha
which combines both to tea and Wahaha. This tea brand name is both easy to remember and

14
funny, hence we expect people to recall it fast. Moreover, we suggest that in the introduction
of further products the name structure is maintained; for instance in case Wahaha wants to
launch energy drinks the company should name it after Tsihaha7.
In terms of labeling, the surveys showed that 62% of the people felt more attracted towards a
floral design than a landscape 25% or an Asiatic looking girl 13%. In addition among the floral
option, the colorful background one was preferred 36% in front of the white background one
26%. Consequently, our recommendation for Wahaha is to use a colorful floral label to sell in
Spain.
7.1.2. Price
Our principal objectives setting the price strategy is to avoid the Chinese low-price, low-quality
stereotype. Hence, we aim to place Wahaha iced-tea beverage among the premium products
due to its exoticness and quality.
After conducting the survey among 365 women, where they were asked how much they would
pay for 500ml of Chinese Ice tea, 157 claimed they would not consider buying Chinese tea.
However, 130 of them are already not ice tea drinkers, therefore 88.51% of the regular or
sporadic drinkers in the sample would consider buying our product. The following chart studies
further their willingness to pay (see Exhibits 10).
Price
number of potential buyers in the sample8
% of potential buyers in the sample
Total potential buyers in Spain9
Total potential bottles in one year10
Expected penetration rate
Expected number of bottles sales
Expectected revenue sales
1 201 55% 2.790.989 56.388.760 5,0% 2.819.438 2.819.438,01
1,2 166 45% 2.304.996 46.569.822 5,0% 2.328.491 2.794.189,32
1,5 156 43% 2.166.140 43.764.411 5,0% 2.188.221 3.282.330,82
2 113 31% 1.569.063 31.701.144 5,0% 1.585.057 3.170.114,38
In light of these results, with a 95% confidence level, a 5.1% sample error and assuming that
the penetration rate will remain stable, our recommended retail price (RRP) for the iced-tea
drinks is 1.5 EUR for a 500ml bottle.
7 Tsihaha comes from 气 “qi” (pronounced Tsi) meaning energy in Chinese.
8Number of people who would buy Chinese cold tea at 1 EUR or above.
9 Number of women between 20 and 35 years old in Spain multiplied by the percentage of potential
buyers in the sample. 10
Number of total potential buyers multiplied by the average number of bottles drank per woman in a year

15
7.1.3. Promotion
The success of the introduction of iced tea in the Spanish market has a strong dependence on
its promotion strategy. Hence, it is paramount to get the right message in the right place to
assure the right people discover this new drink.
Following the survey carried out in Barcelona, it was discovered that the first reason why
people drink iced-tea is to get refreshed 31% and actually, just 11% of people relate it in first
place with an awaking drink. Therefore, iced tea drinks, contrary to the hot tea beverage, is not
a substitute of coffee but a substitute of refreshing drinks such as cola flavored or orange
flavored ones. It was further discovered that 31% of the people drink iced tea beverages in the
first place because they believe it to be healthy and 20% drink it in the first place for its flavor.
In view of these results, the right message to send must appeal to the refreshing effect of the
drink, its functionality and the oriental origin of the product.
End consumers are mostly young women between the age of late teens and late thirties, thus,
in order to reach them, Wahaha must appear in the communications channels used by them.
In first place, to arouse curiosity for the product, Youtube ads should be placed. We give
preference to it over the TV since we will be able to reach our interested target, paying only
for the watched videos (pay per click) and giving us the possibility to trace down statistics on
who has watched it. Not to mention, it will permit to allocate the exact budget wanted to the
promotion given there is no minimum. Communications through a web page and social media
to permit clients get information of the product and the company through internet will also be
important.
At the same time, listing fees should be placed to get into supermarkets and afterwards
organize product tasting events so as to let clients try the new product for free and get to
know what Teahaha is. A part from it, twice a year place promotions such as the second unit at
half price should be placed.
Regarding the HORECA distribution, budget must be allocated on merchandise products such
as napkin holders to place in public bars and restaurants.
Finally, we propose to advertise Wahaha tea in health magazines. Given the data in the
following chart the best option would be placing the commercial in Mente Sana and Cuerpo y
Mente as this is the way to reach a higher part of our target and at the lowest cost possible.

16
People reached
11
Price of the ad
12
Price per person
Clara 49500 14.110 € 0,29 €
Mente Sana 60000 8.450 € 0,14 €
In Style 45760 14.210 € 0,31 € Cuerpo y mente 49940 5.540 € 0,11 €
The perfect moment for promotion launches will be in summer since the consumption of iced
tea drinks is seasonal and its pick sales lay in the hottest months of the year.
7.1.4. Place
Since iced-tea drinks are both consumed at home and in the restaurant or bar, we must reach
both wholesaler and retailer.
As we are focusing on a premium price strategy, 1.50€ per 500ml and we are promoting our
product to reach tea lovers and people interested in health, therefore our distribution strategy
must be consistent to it.
We recommend Wahaha to choose distributors in Spain in order to supply HORECA, the
supermarkets, hypermarkets and specialized points of sale since it will have to contact several
low quantity order clients instead of low number of high quantity order buyers.
In order to reach HORECA we must first supply the wholesalers and actually the Spanish
wholesalers market is extremely spread. There are 4 major players; Makro, Miquel Alimentació
Covalco and Dinosol and together they only account for 28.86% of the number of shops and
38.6% of the total surface. Therefore, it means that 71.14% of the wholesaler shops account
for small players. This is beneficial for bargaining power as wholesalers will not be powerful
but reaching them all will incur higher costs.
Number of shops surface m2
% of total shops
% of total surface
MAKRO (METRO) 34 237.917,00 5,36% 16,43% MIQUEL ALIMENTACIÓ 54 156.711,00 8,52% 10,82% COVALCO 59 97.635,00 9,31% 6,74% DINOSOL 36 65.972,00 5,68% 4,56% OTHERS 451 889.601,00 71,14% 61,44%
TOTAL 634 1.447.836,00 100% 100% 1 Dextal international
11 Number of readers between the age of 25 and 34 years.
12 General price for placing the ad in the inside if the magazine.

17
Regarding supermarkets there are several different companies being Mercadona, Eroski, Dia
and Carrefour the biggest ones (see Exhibits 11). As we are selling premium price products, we
should avoid selling into cost based supermarkets such as Dia or Lidl as we will not reach our
target consumers. To sell in supermarkets we will have to take into account the listing fees
required to enter, this means that selling through supermarkets will have higher costs than
through wholesalers.
a Source: Dextal international
Given the fact that the product is in an introductory stage, transport must be fast and
warehouses reduced. Iced tea would arrive from China in containers and should be stored at a
central warehouse before being distributed to all the different centers.
Last but not least, it must strongly be considered that iced tea drinks have seasonal
consumption meaning that sales will be higher during summer and lower during winter time.
As a consequence of that, it is recommended to preview it in order to avoid stock outs in
summer or excessive warehouse costs in winter.
8. Financial statement
Since the production price for a Wahaha tea bottle is unknown for us, we will first determine
the price range at which the distributor can import the bottles based on the final price in the
market.
14,70%
10,50%
10,10%
7,87%
4,38% 3,93%
3,68% 3,67%
3,54% 2,57%
2,43%
1,96%
1,71%
1,52%
27,45%
Percentage of total surface Mercadona
Eroski Group
Dia
Carrefour
El Corte Inglés
Lidl
Consum
Auchan
Coviran
Dinosol
Elarbol
Aldi
Gadisa
Condis
Others

18
We considered three different scenarios, having a 1%, 3% or 5% market penetration, in the
first 3 years (See Exhibits 12). In the most optimistic scenario 5%, we could afford buying the
product at 0.44 EUR FOB Shanghai price and in the most pessimistic scenario 1% we could only
accept 0.19 EUR FOB Shanghai price. Therefore, when entering into negotiations with Wahaha
the distributor’s BATNA13 should be below 0.44 EUR FOB Shanghai price. In case Wahaha’s
BATNA is around these prices, there could be an agreement. CIF Barcelona prices were
discarded since costume tariffs apply to the import price and it would mean paying higher
tariffs. Precisely, iced tea bottled drinks have to pay 11.5% of the import price14. At a FOB price,
import costs account between 6 and 8% of the total RRP which hinders competition against
national produced iced tea drinks.
Taking three price possibilities and expecting a 3% or a 5% market penetration, there six
different cash-flow scenarios (see Exhibits 13). In the best scenario, 5% penetration market
and 0.19 EUR cost per bottle, benefit arouse in the second year, NPV, assuming a 10% discount
factor, is 778,528.94 EUR and IRR 93%. On the contrary, the worst scenario; 3% penetration
market and 0.44 EUR cost per bottle, earnings do not appear until third year, NPV, assuming a
10% discount factor, is -419,879.27 EUR and IRR -57%, therefore this last scenario must be
avoided since it represents a too slow entry with a too high price.
The introduction activity will have a positive NPV as long as a 5% market penetration rate is
achieved. In case there is a 3% market penetration rate, the acquisition cost per bottle will
need to be 0.19 EUR or lower.
9. Conclusions
After analyzing our market, the expected product to introduce and the introduction procedure
we must pinpoint Wahaha rejected the entry plan in Spain.
Reasons for rejecting the entrance are, in first place, for the market size; just in terms of
population, Spain accounts for 4% of the Chinese total population. And nuancing, Spanish ice
tea consumption is relatively low; it accounts for just 3% of the total beverage sales.
In second place, for consumption habits; Spaniards are used to classical flavors and are
reluctant to try new products. In addition, given that Spain is a Mediterranean country,
13 BATNA: Best alternative to a Negotiation agreement
14 TARIC code: 2101 12 92 20 (Taxation and custom Union 2013)

19
Spaniards are prone to sweet products against functional drinks. In addition to this, the results
of the sample trial showed that 44 out of the 91 surveyed people complained that the product
was too watery. Therefore, introducing tea in Spain would probably require an adaptation.
In third place, for legislation issues; Wahaha standards in China differ from the ones in Spain
and the European Union, therefore to reach a small market, the company would probably be
forced to adapt its factories.
In fourth place, distance; due to the distance between China and Spain, import costs are
between a 6-8% of the RRP. The fact is that, transport costs do not add any extra value to the
end consumer and yet eat out profits from the company.
We suggest then two options for Wahaha in order to be able to enter the Spanish market.
First option is to enter bigger and heavier consumer countries in Europe before moving into
Spain, in this case, entering the Spanish market will just represent a marginal cost as the
product will be already in Europe.
Second option is to open an industrial franchise in Spain in order to obtain only revenues from
our market and avoid the non-adding value transport costs.
To sum up, Spain is a challenging market in the moment for Wahaha since we are not heavy
tea drinkers, however we believe it not an impossible market so we encourage Wahaha to
rethink their entry Strategy plan in the future for the entrance into Spain 慢慢来15。
10. References
Agencia Española de Seguridad Alimentaria y Nutrición. Tasas para el registro general sanitario
de empresas alimentarias y alimentos . 2013.
http://www.aesan.msc.es/AESAN/docs/docs/cadena_alimentaria/procedimientos/TAS
AS_RGSA.pdf (accessed May 31, 2013).
Asociación Nacional de Bebidas Refrescantes Analcoholicas. "Informe socioeconomico:
ANFABRA." 2010. http://www.refrescantes.es/ (accessed January 15, 2013).
Campos, Rolf, and Gonzalo Gómez Bengoechea. "Las bebidas refrescantes y su impacto
socioeconómico en España." IESE insight. 2013.
http://www.ieseinsight.com/doc.aspx?id=1449&ar=6&idioma=1 (accessed May 10,
2013).
15 慢慢来 (màn màn lái) meaning that it will slowly progress.

20
Canadean. "Sample pages from a typical Soft Market Insight report." 2012.
http://www.canadean.com/ (accessed April 1, 2013).
Canadean. "UNESDA." 2012. http://www.unesda.org/industry (accessed April 27, 2013).
Ciao. Opiniones Té frío. 2007. http://www.ciao.es/Opiniones/Pascual_Tealia__798442
(accessed May 10, 2013).
Compés Lopez, Raúl, and Silvia Andrés Gonzalo-Moralejo. "Mercasa." 2004.
http://www.mercasa.es/files/multimedios/1292517140_DYC_2004_74_69_76.pdf
(accessed May 31, 2013).
Instituto Nacional de Estadistica. INE. Abril 2013. http://www.ine.es (accessed May 10, 2013).
Macfarlane, Alan, and Iris Macfarlane. The Empire of Tea. The Overlook Press, 2004.
Mercasa. Munimerca: Información por sectores. 2011.
http://www.munimerca.es/mercasa/alimentacion_2012/pdfs/pag_459-
462_Refrescos.pdf (accessed January 15, 2013).
Ministerio de Hacienda y administraciones publicas. "Agencia Tributaria." 2012.
http://www.agenciatributaria.es/static_files/AEAT/Contenidos_Comunes/La_Agencia_
Tributaria/Segmentos_Usuarios/Empresas_y_profesionales/Empresario_individuales_
y_profesionales/I.V.A./Manual_IVA_2012.pdf (accessed May 31, 2013).
Porter, Michael E. "Ser Competitivo. Edición actualizada y aumentada." In Ser Competitivo.
Edición actualizada y aumentada, by Michael E. Porter, 31-50. Barcelona: Ediciones
Deusto, 2009.
Rodero, Milagros. Alimarket. May 11, 2012. http://www.alimarket.es/noticia/94474/Coca-
Cola-se-pone-verde (accessed May 30, 2013).
Taxation and custom Union. European Comission. June 03, 2013.
http://madb.europa.eu/madb/indexPubli.htm (accessed June 3, 2013).
Wahaha. About us. 2012. http://en.wahaha.com.cn/aboutus/index.htm (accessed April 3,
2013).
Zong, Qinghou, interview by Anne Tsui and Xin Katherine. Chinese Companies Need Strong and
Open-minded Leaders (June 2012).
21
Exhibits
Exhibits 1: Tea products
b Source: Wahaha
c Source: Wahaha

22
d Source: Wahaha
e Source: Wahaha

23
f Source: Wahaha
Exhibit 2: Spain’s distribution population by region
g Source: Instituto Nacional Estadística 2013
17,88%
16,02%
13,75% 10,85%
5,88%
5,39%
4,64%
4,49%
4,48% 3,12%
2,86%
2,37%
2,34%
2,28% 1,36%
1,26% 0,68%
0,18% 0,17%
Spain's distribution of population by regions ANDALUCÍACATALUÑAMADRID, COMUNIDAD DECOMUNITAT VALENCIANAGALICIACASTILLA Y LEÓNPAÍS VASCOCASTILLA-LA MANCHACANARIASMURCIA, REGIÓN DEARAGÓNBALEARS, ILLES
24
Exhibit 3: Population density
h Source: INE 2013
Exhibit 4: Spain’s main soft drink producers
Spain’s main soft drink producers Million of sales
Coca-Cola Spain 3.000
J. Garcia Carrión, SA 650
Pepsico bebidas Iberia 400
Schweppes, SA 345
Font Salem, SL 250
Refresco Iberia, SL 234
Grupo Leche Pascual, SA (beverage division) 170
Red Bull España, SL 88
Sunny Delight España, SL 85,8
Embotelladora de Canarias, SA 69,42
i Source: Alimarket. Data from 2010. It may contain business data from other sectors.
0100200300400500600700800900
MA
DR
ID,…
PA
ÍS V
ASC
O
CA
TALU
ÑA
CO
MU
NIT
AT…
MU
RC
IA,…
CA
NTA
BR
IA
AST
UR
IAS,
…
AN
DA
LUC
ÍA
GA
LIC
IA
RIO
JA, L
A
NA
VA
RR
A,…
AR
AG
ÓN
CA
STIL
LA Y
LEÓ
N
CA
STIL
LA-L
A…
EXTR
EMA
DU
RA
Population density
Density

25
Exhibits 5: Spain soft drinks business structure
j Source: ANFABRA
Exhibit 6: Low calorie beverage consumption
k Source: ANFABRA
68%
22%
6% 4%
Soft drink business structure
Less than 10 workers
Between 10-50
Between 50-200
Over 200
2002 2005 2011
15%
25%
30%
Low calorie beverage evolution
% of the totalconsumption ofbeverages

26
Exhibits 7: Favorite flavors among Spanish consumers in 2010
l Source: ANFABRA
Exhibits 8: Survey results
Sample information Number of surveyed people 365
Age 20 - 35
Gender Female
Area Barcelona
Do you normally drink iced tea? Never 130 35,6%
Sometimes 154 42,2%
Frequently 81 22,2%
Which is the first reason why you drink iced tea? It is refreshing 123 38%
It is healthy 103 31%
It gives me energy 35 11%
It is tasty 66 20%
55%
11%
8%
5%
6%
3%
2% 2%
8%
Favorite flavors among Spanish consumers 2010
Cola
Orange
Lemon
"Gasosa"
Sport drinks
Tea
Tonic
Lima
Other

27
Why don't you drink ice tea? I don't like iced tea
83 63,8% I don't like the iced tea in the market/it's too sweet 33 25,4%
It is too expensive
2 1,5%
It contains theine
2 1,5%
I have never tried it
10 7,7%
Would you buy Chinese original tea-taste drink? Yes 208 57,0%
No 157 43,0%
0
5
10
15
0.8 1.84 2.88 3.92 4.96 Greater than4.96
Fre
cue
ncy
Price
Non-current drinkers who would buy Chinese tea histogram
0
10
20
30
40
50
60
0.5 1.95 3.4 4.85 6.3 7.75 9.2 10.65 12.1 13.55 Graterthan13.55
Fre
cue
ncy
Price
Non-regular drinkers histogram

28
Packaging preference
Option A 87 26%
Option B 124 36%
Option C 85 25%
Option D 45 13%
Exhibits 9: Survey results
Sample information Number of surveyed people 91
Gender Women
Age 20 - 25
Area Barcelona
02468
101214161820
1 1.5 2 2.5 3 3.5 4 4.5 graterthan 4.5
Fre
cue
ncy
Price
Regular drinkers histogram

29
What do you think about the taste?
Too sweet 9
Too bitter 12
Real tea drink 26
Tasteless drink - too much water 44
Exhibits 10: Price estimation
Sample error for a proportion (to buy or not to buy at 0.5 probabilities each)
Sample error N 5.068.213
n 365 Confidence level 95%
Sample error 5,13%
16 According to (Instituto Nacional de Estadistica 2013)
17 According to (Asociación Nacional de Bebidas Refrescantes Analcoholicas 2010)
18 According to (Asociación Nacional de Bebidas Refrescantes Analcoholicas 2010)
19 Calculated through the obtained data
Market data Spanish women (20 - 40 y old)16 5.068.213
total soft drinks bottles sold (2011)17 4.551.000.000
Total iced-tea bottles sold (2011)18 136.530.000 Average bottles drink per woman per year19 20,20
1*
5,0*
2
N
nN
ne c

30
Exhibit 11: Supermarkets in Spain
Number of shops Surface m2
% of total shops
% of total surface
Mercadona 1356 1768600 6,89% 14,70%
Eroski Group 1583 1262408 8,05% 10,50%
Dia 2826 1214796 14,37% 10,10%
Carrefour 343 946000 1,74% 7,87%
El Corte Inglés 344 527223 1,75% 4,38%
Lidl 527 472339 2,68% 3,93%
Consum 596 442093 3,03% 3,68%
Auchan 296 441026 1,51% 3,67%
Coviran 2116 426237 10,76% 3,54%
Dinosol 405 308998 2,06% 2,57%
Elarbol 430 292297 2,19% 2,43%
Aldi 247 235904 1,26% 1,96%
Gadisa 373 205438 1,90% 1,71%
Condis 415 183017 2,11% 1,52%
Alimerka 173 166114 0,88% 1,38%
Ahorramas 224 164828 1,14% 1,37%
Froiz 233 146395 1,18% 1,22%
Uvesco 263 143125 1,34% 1,19%
Bon Preu 153 142992 0,78% 1,19%
Unide 752 136448 3,82% 1,13%
Miquel alimentació 612 130981 3,11% 1,09%
Others 5400 2270600 27,46% 18,88%
Total 19667 12027859 m Source: Dextal international
Exhibits 12: BATNA calculations
Reference information Packaging size (ml) 500
Packaging method Cartons
Bottles per carton 15
Gross weight per carton (Kg) 8,5
Cubic meters per carton 0,016
Cartons in 20" FCL 2.000
Cartons in 40" FLC 2.940
Price 20" FCL 2.500
Price 40" FLC 3.000 n Source: Dextal international

31
5% market penetration rate
Total transport costs
1% market penetration rate
Total transport costs
3% market penetration rate
Total transport costs
# of bottles sold 2.188.221
437.644
1.312.932 montly sales bottles 182.352
36.470
109.411
Carton x year 145.881
29.176
87.529 # of 20" container/ year 73 182.351,75 15 36.470,33 44 109.411,00
# of 40" container/year 50 148.858,57 10 29.771,70 30 89.315,10
We will always use 40” FCL containers as it is more economical.
OPTIMISTIC SCENARIO (5% market penetration)
Unitary Price
Total Price Columna1 Unitary Total
Recomended retail price 1,50 3.282.331,50 Retail Sale Price 1,36 2.983.937,73 VAT deduction (10%) 0,14 446.397,08
Retail Buying price 0,88 1.925.121,11 Retailer margin (55%) 0,48 1.588.648,45
Distributor margin (30%) 0,20 669.595,63
Advertisement costs 0,09 196.490,00
Distribution costs (7,5%) 0,03 58.724,46
Distributor buying CIF price 0,51 1.113.080,13 Custom tariff costs (11,5%) 0,05 110.942,80
Distributor buying FOB price 0,44 964.221,56 Transport costs 0,07 148.858,57
PESSIMISTIC SCENARIO (1% market penetration)
Unitary price Total price Columna1 Unitary Total
Recomended retail price 1,50 656.466,00 Retail Sale Price 1,36 596.787,27 VAT (10%) 0,14 89.279,38
Retail Buying price 0,88 385.024,05 Retailer margin (55%) 0,48 317.729,54
Distributor margin (15%) 0,10 66.959,53
Advertisement costs 0,45 196.490,00
Distribution costs (7,5%) 0,05 23.534,29
Distributor buying CIF price 0,25 111.053,40 Custom tariff costs (11,5%) 0,02 9.409,35
Distributor buying FOB price 0,19 81.281,70 Transport costs 0,07 29.771,70

32
OPTIMAL SCENARIO (3% market penetration) Unitary Total Columna1 Unitary Total2
Recomended retail price 1,50 1.969.398,00 Retail Sale Price 1,36 1.790.361,82 VAT deduction (10%) 0,14 267.838,13
Retail Buying price 0,88 1.155.072,14 Retailer margin (55%) 0,48 953.188,63
Distributor margin (30%) 0,20 401.757,19
Advertisement costs 0,15 196.490,00
Distribution costs (7,5%) 0,03 41.129,36
Distributor buying CIF price 0,50 649.922,67 Custom tariff costs (100%) 0,04 57.847,78 Distributor buying FOB price 0,38 502.759,78 Transport costs 0,07 89.315,10
Exhibits 13: Cash-flow scenarios
Market penetration rate 1% 2% 2,50% 3% 5%
Expected numer of bottles sold20 437644 875288 1094110 1312932 2188221
SET UP COSTS Web-page creation 4.000
Packaging adaptation 24.000
Logo and brand register21 141,73
Product registration in the Health minister (non EU product)22 890,82
TOTAL SET UP COSTS 29.032,55
20 Calculation based on the survey results.
21 Based on Spanish patents office.
22 According to (Agencia Española de Seguridad Alimentaria y Nutrición 2013)

33
YEARLY COSTS MARKETING COSTS
POS tasting events 40.000
Discounts 60.000
Ad creation 4.000
Youtube ads 18.000
Webpage maintenance 500
Magazines 13.990
Listing fee 60.000
OTHER COSTS
Personnel costs 36.000
TOTAL COSTS 232.490
SCENARIO 1C: 5% market penetration 19c FOB price Year 0
Year 1 (1%)
Year 2 (2,5%) Year 3 (5%)
Revenues 0,00 385.126,72 1.444.225,56 1.925.121,11
COGS 0,00 83.152,36 207.880,90 415.761,99
Marketing costs 196.490,00 196.490,00 196.490,00 196.490,00
Distribution costs 0,00 27.611,97 42.874,81 68.312,89
Personnel costs 36.000,00 36.000,00 36.000,00 36.000,00
Import costs 0,00 52.517,28 131.293,20 262.586,52
Set up costs 29.032,55 EBITDA -261.522,55 -10.644,89 829.686,65 945.969,71
Taxes 0,00 -2.661,22 207.421,66 236.492,43
Net earnings -261.522,55 -7.983,67 622.264,99 709.477,28
Cash flows (10%) -261.522,55 -7.257,88 514.268,59 533.040,78
NPV 778.528,94 IRR 93%

34
SCENARIO 1A: 5% market penetration in 3 years 38c FOB price Year 0
Year 1 (1%)
Year 2 (2,5%) Year 3 (5%)
Revenues 0,00 385.126,72 1.444.225,56 1.925.121,11
COGS 0,00 166.304,72 415.761,80 831.523,98
Marketing costs 196.490,00 196.490,00 196.490,00 196.490,00
Distribution costs 0,00 33.520,17 62.158,50 97.853,87
Personnel costs 36.000,00 36.000,00 36.000,00 36.000,00
Import costs 0,00 48.140,84 180.528,15 240.704,31
Set up costs 29.032,55 EBITDA -261.522,55 -95.329,01 553.287,11 522.548,95
Taxes 0,00 0,00 138.321,78 130.637,24
Net earnings -261.522,55 -95.329,01 414.965,34 391.911,71
Cashflows -261.522,55 -86.662,73 342.946,56 294.449,07
NPV 289.210,34 IRR 45%
SCENARIO 1B: 5% market penetration 44c FOB price Year 0 Year 1 (1%) Year 2 (2,5%) Year 3 (5%)
Revenues 0,00 385.126,72 1.444.225,56 1.925.121,11
COGS 0,00 192.563,36 481.408,40 962.817,24
Marketing costs 196.490,00 196.490,00 196.490,00 196.490,00
Distribution costs 0,00 35.817,80 63.389,37 109.342,03
Personnel costs 36.000,00 36.000,00 36.000,00 36.000,00
Import costs 0,00 52.517,28 131.293,20 262.586,52
Set up costs 29.032,55 EBITDA -167.457,45 -128.261,72 535.644,59 357.885,32
Taxes 0,00 0,00 133.911,15 89.471,33
Net earnings -167.457,45 -128.261,72 401.733,44 268.413,99
Cash flows (10%) -167.457,45 -116.601,56 332.011,11 201.663,40
NPV 249.615,50 IRR 52%

35
SCENARIO 2B: 3% market penetration 19c FOB price Year 0
Year 1 (1%) Year 2 (2%) Year 3 (3%)
Revenues 0,00 385.126,72 770.253,44 1.155.380,16
COGS 0,00 83.152,36 166.304,72 249.457,08
Marketing costs 232.490,00 232.490,00 232.490,00 232.490,00
Distribution costs 0,00 33.520,17 49.603,58 65.687,00
Personnel costs 36.000,00 36.000,00 36.000,00 36.000,00
Import costs 0,00 52.517,28 105.034,56 157.551,84
Set up costs 29.032,55 0,00 0,00 0,00
EBITDA -297.522,55 -52.553,09 180.820,58 414.194,24
Taxes 0,00 -13.138,27 45.205,14 103.548,56
Net earnings -297.522,55 -39.414,82 135.615,43 310.645,68
Discount factor (10%) -297.522,55 -35.831,65 112.078,87 233.392,70
NPV 12.117,37 IRR 12%
SCENARIO 2A: 3% market penetration 38c FOB price Year 0 Year 1 (1%)
Year 2 (2%) Year 3 (3%)
Revenues 0,00 385.126,72 770.253,44 1.155.380,16
COGS 0,00 166.304,72 332.609,44 498.914,16
Marketing costs 232.490,00 232.490,00 232.490,00 232.490,00
Distribution costs 0,00 33.520,17 49.603,58 65.687,00
Personnel costs 36.000,00 36.000,00 36.000,00 36.000,00
Import costs 0,00 48.140,84 96.281,68 144.422,52
Set up costs 29.032,55 0,00 0,00 0,00
EBITDA -297.522,55 -131.329,01 23.268,74 177.866,48
Taxes 0,00 0,00 5.817,18 44.466,62
Net earnings -297.522,55 -131.329,01 17.451,55 133.399,86
Discount factor -297.522,55 -119.390,01 14.422,77 100.225,29
NPV -302.264,50 IRR -34%

36
SCENARIO 2B: 3% market penetration 44c FOB price Year 0 Year 1 (1%) Year 2 (2%) Year 3 (3%)
Revenues 0,00 385.126,72 770.253,44 1.155.380,16
COGS 0,00 192.563,36 385.126,72 577.690,08
Marketing costs 232.490,00 232.490,00 232.490,00 232.490,00
Distribution costs 0,00 33.520,17 49.603,58 65.687,00
Personnel costs 36.000,00 36.000,00 36.000,00 36.000,00
Import costs 0,00 52.517,28 105.034,56 157.551,84
Set up costs 29.032,55 0,00 0,00 0,00
EBITDA -297.522,55 -161.964,09 -38.001,42 85.961,24
Taxes 0,00 0,00 -9.500,36 21.490,31
Net earnings -297.522,55 -161.964,09 -28.501,07 64.470,93
Discount factor (10%) -297.522,55 -147.240,08 -23.554,60 48.437,96
NPV -419.879,27 IRR -57%