Introduc)on*to*Stas)cal*Gene)cs:* emphasis*on*Gene)c ... · PDF file05.03.2015 ·...
31
Introduc)on to Sta)s)cal Gene)cs: emphasis on Gene)c Associa)on Studies Lisa J. Strug, PhD Guest Lecturer Biosta)s)cs Laboratory Course (CHL5207/8) March 5, 2015
Transcript of Introduc)on*to*Stas)cal*Gene)cs:* emphasis*on*Gene)c ... · PDF file05.03.2015 ·...
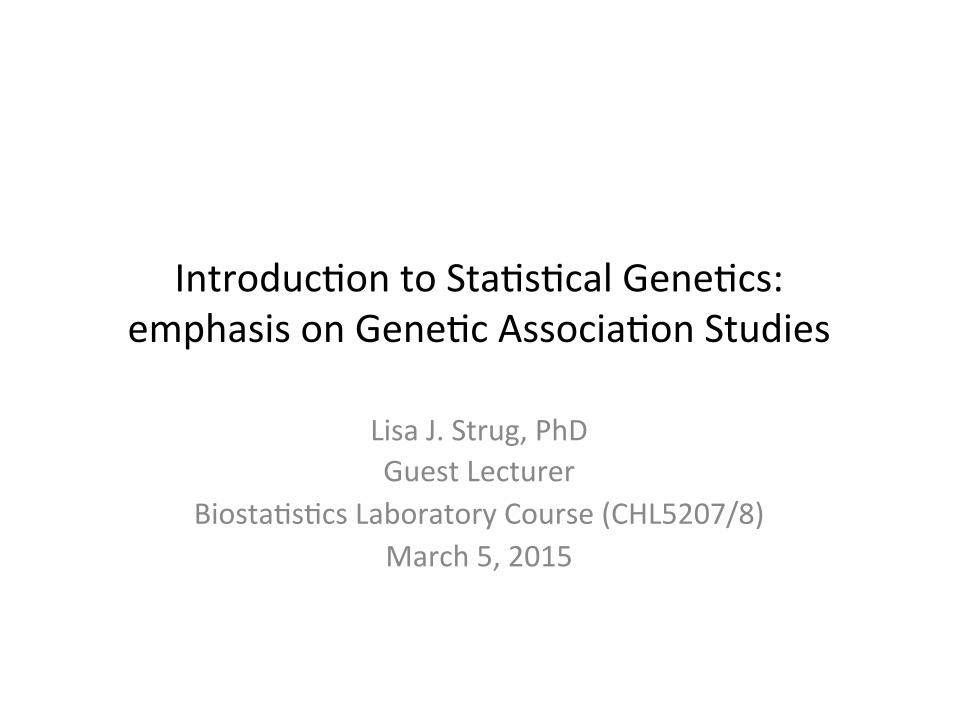
Introduc)on to Sta)s)cal Gene)cs: emphasis on Gene)c Associa)on Studies
Lisa J. Strug, PhD Guest Lecturer
Biosta)s)cs Laboratory Course (CHL5207/8) March 5, 2015

Gene Mapping in the News Study Finds Gene Associated With Prostate Cancer
Study identifies second gene associated with specific congenital heart defects
Unique Study Identifies Gene Associated With Anxiety Phenotypes!
Discovery of a gene associated with a leukemia mostly affecting children
North American Group IDs Loci Influencing Cystic Fibrosis Lung Disease Severity May 23, 2011

A, C, T, G A, C, T, G
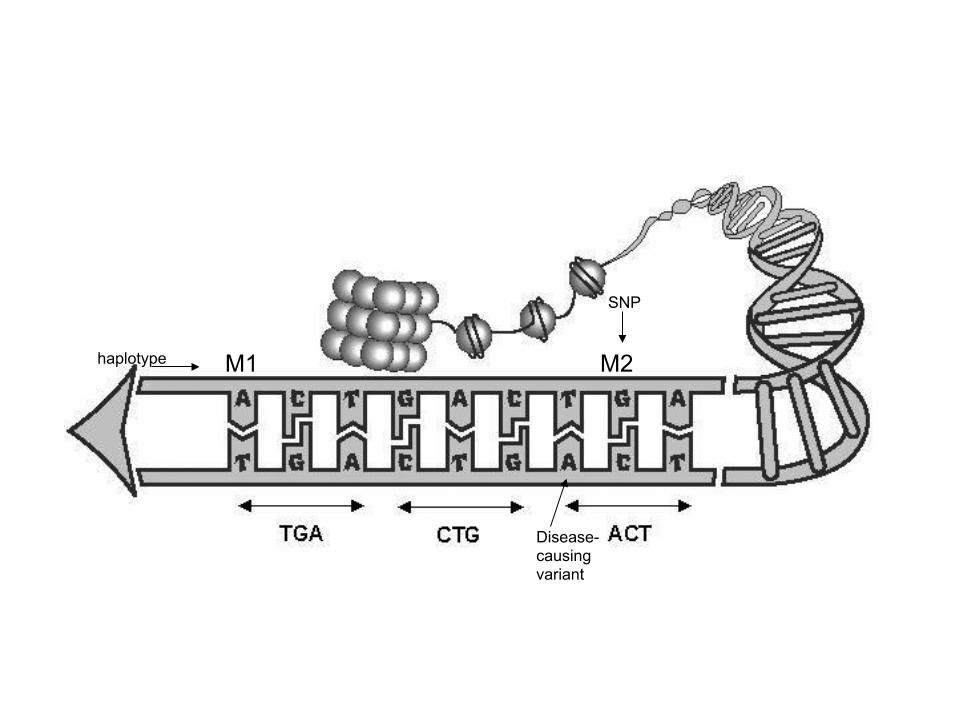
M2 M1 haplotype
SNP
Disease-causing variant

Gene)c Associa)on Studies Aim to detect associa)on between one or more gene)c
polymorphisms and a trait – A trait may be some quan)ta)ve characteris)c, a discrete aPribute or
disease
• In case-‐control studies for gene)c associa)on we ascertain unrelated cases on the basis of a discrete, dichotomous trait, and unrelated controls without the trait who are ascertained from the same popula)on as the cases to avoid poten)al confounders (e.g. ethnicity)

Measures of Associa)on • In epidemiology, associa)on between disease and ae)ological
factors are usually expressed in terms of rela%ve risk measures i.e.
Disease risk/odds in exposed subjects Disease risk/odds in unexposed subjects
• In gene)c epidemiology, rela)ve risks/ORs can be defined for – Alleles – Genotypes – Haplotypes

Mul)plica)ve Model for Risk • Allelic rela)ve risks ϕA ϕa are defined by the mul%plica%ve
model: θi/j =ϕi ϕj
where one allele is taken as reference. • In the diallelic case using a as reference so that ϕa=1:
θA/A =(ϕA)2 , θA/a =(ϕA )(1) where θA/A is the genotypic relative risk
i.e. θA/A =risk for A/A genotype risk for a/a genotype

Hardy-‐Weinberg Equilibrium
• If the rela)ve frequency of alleles i, j are fi, fj , the rela)ve frequency of genotype i/j under H-‐W equilibrium is
2fi fj if i≠j and (fi)2 if i=j • The HWE assump)on implies that each subject’s two
chromosomes are sampled independently from the popula)on – A sample of N independent subjects can be viewed as a sample of 2N
independent chromosomes
• Example: SNP marker with alleles A, a. Allele frequency of A=0.3. What are the three possible genotypes at this locus and their frequencies under HWE?

HWE Example
• Example: SNP marker with alleles A, a. Allele frequency of A is pA=0.3. What are the three possible genotypes at this locus and their frequencies under HWE?
Genotypes: freq(A)=pA , freq(a)=pa =1-‐pA

Allele Coun)ng and the 2x2 table • Assuming the mul)plica)ve risk model, HWE in the
popula)on, and a rare disease, we can count alleles in cases and controls to assess associa)on
• For a diallelic locus:
• Test for associa)on using conven)onal Χ2 test, 1 df • The allelic rela)ve risk (A vs. a) is es)mated by the odds ra)o
Allele Cases Controls
A DA HA
a Da Ha
€
DA /Da
HA /Ha
=DAHa
DaHA

Example: the Pro871Leu SNP in BrCa1
• Assume HWE in the popula)on under study (and hence in the controls) and that the mul)plica)ve risk model holds, then can treat chromosomes as independent
• Therefore the es)mated allelic OR is
• And the mul)plica)ve model implies an es)mated OR for Leu/Leu is
Genotype Cases Controls
Leu/Leu 89 56
Leu/Pro 369 250
Pro/Pro 342 266
Total 800 572
Subjects
Allele Cases Controls
Leu 547 362
Pro 1053 782
Total 1600 1144
Chromosomes
€
ˆ φ LEU =547 × 782
1053× 362=1.122
€
ˆ θ LEU /LEU = ( ˆ φ LEU )2 = (1.122)2 =1.259

Instead of a Mul)plica)ve model of risk:
• Such tests are more reasonable for a func%onal variant • Associa)ons with non-‐causal linked markers tend to give
alterna)ves in which heterozygotes have intermediate risk; so mul)plica)ve models might be preferable
Dominant
Genotype Cases Controls
Leu/Leu 89 56
Pro/* 711 516
Total 800 572
Recessive
Genotype Cases Controls
Leu/* 458 306
Pro/Pro 342 266
Total 800 572
Genotype Cases Controls
Leu/Leu 89 56
Leu/Pro 369 250
Pro/Pro 342 266
Total 800 572

Mul)plica)ve model at the subject level
• Also called the addi%ve model • 1-‐df test where the A/a risk is intermediate between A/A and a/
a risks • Can be fit using logis)c regression with
log odds(case)= α+xβ, where the risk factor x= number of (minor) alleles = 0,1,2
• Log ORA/a = β => ORA/a =eβ= ϕ • Log ORA/A = 2β => ORA/A =e2β= ϕ2
Genotype x Log Odds(case) =α+βx
a/a 0 α
A/a 1 α+β
A/A 2 α+2β

Mul)plica)ve model, cont’d
• In logis)c regression, the score test for β=0 is the Cochran-‐Armitage test for trend in propor)ons – This test is preferable to allele coun)ng since it avoids the need to
assume HW equilibrium

Genotypic Tests: 3x2 Table (2 df)
• Taking the Pro/Pro as a reference group, calculate
• Compare these es)mates to those predicted by the mul)plica)ve model fit to the alleles table
Genotype Cases Controls
Leu/Leu 89 56
Leu/Pro 369 250
Pro/Pro 342 266
Total 800 572
€
O ˆ R Leu / Leu,O ˆ R Leu / Pr o

Reasons for Gene)c Associa)on 1. The locus/polymorphism is a func%onal variant. That is, the
associa)on is causal: Func%onal variant è Disease
2. The locus is in linkage disequilibrium with a func)onal variant; that is the polymorphism has no causal role but is associated with a nearby causal variant
marker locus è Func%onal variant è Disease
3. The associa%on is due to confounding by popula%on stra%fica%on; ie some underlying stra)fica)on or admixture in the popula)on
Popula)on stra)fica)on -‐> can result in spurious associa)on results as a result of a systema)c difference in allele and disease frequencies between sub-‐popula)ons in a popula)on, possible due to ancestry

Direct Associa)on
• Studies of direct associa)on target polymorphisms which are puta)ve causal variants eg. a muta)on leading to an amino acid change
• However, many causal variants will likely be non-‐coding and affect things such as gene regula)on, expression or differen)al splicing – >70% of variants iden)fied as associated in GWAS are intergenic

Indirect Associa)on • The polymorphism is a surrogate for the causal locus, allowing
us to search for causal genes in indirect way
• However, indirect associa)ons are even weaker than direct associa)ons, and typing many surrounding markers are required to detect the associa)on
• Cannot be a defini)ve nega)ve result, in contrast with direct associa)on studies (ie. hard to rule out a gene)
• This approach used for candidate gene studies and for genome-‐wide associa)on studies

Confounded Associa)on
• Associa)on due to confounding by stra)fica)on and admixture within the popula)on
• Can result in spurious findings (posi)ve confounding) or obscure true associa)ons (nega)ve confounding)
• Gene)c epidemiology offers possibili)es to overcome this problem e.g. adjustment for popula)on stra)fica)on using principal component analysis or other methods

Linkage Disequilibrium and Indirect Associa)ons
• mapping genes indirectly depends on the existence of associa)on at the popula)on level (or linkage disequilibrium), between causal variants and nearby markers
• Consider 2 loci – Locus 1 has alleles A, a with frequencies pA and pa, and locus 2 has
alleles B, b with frequencies pB and pb in the popula)on – How many possible haplotypes are there for the 2 loci?

Linkage Disequilibrium (LD)
• Two loci are said to be in LD if their respec)ve alleles do not associate independently
• Suppose that the frequency of our 4 haplotypes pAB , pAb , paB , pab in the popula)on are 0.4, 0.1, 0.2 and 0.3, where pA = 0.8, pB = 0.4 , are A and B in LE?
• If not, which alleles on the two loci occur together on haplotypes more onen than would be expected under LE?

Measures of LD
• One measure of LD for our two biallelic loci is DAB=pAB -‐ pApB
• Similarly, DAb=-‐ DAB and Dab = DAB
• LD is a property of 2 loci, not their alleles • Thus the magnitude of D is important not the sign • The magnitude of D does not depend on the choice of alleles • The range of values that D can take on varies with allele
frequency but
€
max(−pA pB ,−pa pb ) ≤ DAB ≤min(pa pB , pA pb )

Example
• What is the theore)cal range of DAB when pA=1/2 and pB= 1/3?
Reminder:
€
max(−pA pB ,−pa pb ) ≤ DAB ≤min(pa pB , pA pb )

Normalized D or D’
• The possible values of D depend on allele frequencies, making D difficult to interpret
• For repor)ng purposes, the normalized D’ is onen used
• D’ can then be es)mated from the sample frequencies
€
DAB' =
DAB
max(−pA pB ,−pa pb ),DAB < 0
DAB
min(pa pB , pA pb ),DAB > 0
#
$ % %
& % %
'
( % %
) % %

Measuring LD with r2
€
rAB =DAB
pA pa pB pbWhich is the correlation between 2 random variables
• It is usually more common to consider rAB squared
€
rAB2 =
DAB2
pA pa pB pb• r2 has the same value regardless of how the alleles are labeled

D’ and r2
• When D’=1, referred to as Complete LD – In this case there are at most 3 of the 4 possible haplotypes present in the popula)on
– The intui)on here is that the 2 loci are not being separated by a recombina)on in this popula)on
• When r2=1, referred to as Perfect LD – occurs when there are exactly 2 of the 4 possible haplotypes present in the popula)on, and as a result the two loci have the same allele frequencies
• Loci that are in perfect LD are necessarily in complete LD

D’ and r2
• It is possible for D’ to be 1 and for r2 to be small
• r2 =1 implies that the two loci carry the same informa)on whereas D’ is derived from popula)on gene)cs considera)on
• For this and other reasons, it is onen useful to report both D’ and r2

LD and Haplotype Blocks • The genome falls into LD “blocks,” with liPle haplotype diversity
within blocks and liPle disequilibrium between blocks – Mean block size appears to be about 14kb in Caucasians, 8kb in Africans
(but this is variable with blocks up to 200kb in size)
• A consequence of the lack of haplotype diversity in regions of strong LD is that there is considerable redundancy – that is, most polymorphisms and haplotypes in a given block can be
predicted from a smaller set – Johnson et al. (Nature Gene)cs 2001) referred to this smaller set as “haplotype tagging” SNPs
• The concept of haplotype tagging SNPs is used to create genome-‐wide SNP chips to be used for Genome-‐wide associa)on studies (GWAS)

GWAS • >1M haplotype tagging SNPs spanning the genome
• Substan)al quality control of the genotype data is required!
• Test for associa)on between disease/con)nuous trait/etc. and each SNP; >1M tests (more if imputa)on is used)!
• Requires strict significance criteria; onen p< 10^-‐8 to reach genome-‐wide significance for a given SNP test

Sample GWAS
2.09E-12
3.64E-08
Manhattan Plot QQ Plot

Gene Mapping in the News Study Finds Gene Associated With Prostate Cancer
Study identifies second gene associated with specific congenital heart defects
Unique Study Identifies Gene Associated With Anxiety Phenotypes!
Discovery of a gene associated with a leukemia mostly affecting children
North American Group IDs Loci Influencing Cystic Fibrosis Lung Disease Severity May 23, 2011