INTERVIEW SPECIAL RESEARCH WITH PAUL RICHA RDS …...WITH PAUL RICHA RDS. INTERVIEW. SPECIAL...
4
On 12 February 2013 the Democratic People’s Republic of Korea (DPRK) announced that it had conducted its third nuclear test. Based on seismic monitoring data provided to CTBTO Member States by the International Data Centre (IDC), other data, and your own analysis, how confident are you that this was indeed a nuclear test? What do the data tell you and what conclusions can you draw? The data from more than a hundred seismographic stations indicate that this was an explosion, conducted in North Korea at a location very similar to that of a previous explosion ‒ the one on 25 May 2009. I was impressed at the number of stations that recorded signals, as reported by the IDC and also by the United States Geological Survey. It is not possible to tell from seismograms alone that a recorded explosion is nuclear or is a chemical explosion in which all the explosive material is fired at the same time. Such single-fired chemical explosions do occasionally occur ‒ at small size. But the explosions in North Korea have been large. If not nuclear they would have required the simultaneous firing of thousands of tons of chemicals, which would have to have been assembled clandestinely to generate the signals we have recorded. Thus an origin other than nuclear is not plausible. What do the seismic data tell us about the approximate size of the yield? We can tell from comparison with the signals recorded in May 2009 that this latest explosion was about 2.5 to 3 times larger in yield, but this is a relative measure and there is greater uncertainty in estimating an absolute size. In absolute terms, I would expect the yield to lie somewhere in the range from about 5 to 15 kilotons. How do seismic waves generated by an earthquake differ to those caused by an explosion? What was significant with this particular event? Different seismic sources ‒ such as earthquakes, landslides, explosions in the ocean, atmospheric explosions, and underground explosions ‒ all generate a mix of different types of seismic waves. Furthermore, each type of seismic wave can be recorded across a range of frequencies. In practice, from studies of recordings from thousands of seismic events, the mix of different seismic waves is diagnostic of the type of seismic source that generated them. For example, earthquakes and explosions all generate the fastest type of seismic wave, called the primary wave (or, P-wave) because it is the first to arrive; they can all generate a secondary type of wave (or, S-wave); and they can all generate so-called surface waves that arrive last. But the efficiency of generation of these waves is distinctively different between earthquakes and explosions. For example, using data of the quality recorded from earthquakes and explosions, large and small, that have occurred in East Asia since the 1980s (when wide access to high-quality data began), we know that P-waves are most efficiently generated by explosions, and S-waves by earthquakes. Furthermore, these differences are accentuated when we focus on the higher-frequency content of the recorded signals. With surface waves, some features of the signals are seen only for seismic sources that are very shallow ‒ say, less than two or three kilometres, which is the case for almost all explosions but is rare for earthquakes. Other surface-wave features are more commonly seen for earthquakes than explosions. The above is but a short summary of the fact that there is a long list of different features in seismic waves that can be used to discriminate between earthquakes and explosions; and there is also a substantial infrastructure of regional, national, and international agencies that routinely acquire Seismology and CTBT verification Upgrading auxiliary seismic station AS02 at Ushuaia, Argentina. WITH PAUL RICHARDS SPECIAL RESEARCH SCIENTIST, COLUMBIA UNIVERSITY INTERVIEW 22 CTBTO SPECTRUM 20 | MAY 2013
Transcript of INTERVIEW SPECIAL RESEARCH WITH PAUL RICHA RDS …...WITH PAUL RICHA RDS. INTERVIEW. SPECIAL...

On 12 February 2013 the Democratic People’s Republic of Korea (DPRK) announced that it had conducted its third nuclear test. Based on seismic monitoring data provided to CTBTO Member States by the International Data Centre (IDC), other data, and your own analysis, how confident are you that this was indeed a nuclear test? What do the data tell you and what conclusions can you draw?
The data from more than a hundred seismographic stations indicate that this was an explosion, conducted in North Korea at a location very similar to that of a previous explosion ‒ the one on 25 May 2009. I was impressed at the number of stations that recorded signals, as reported by the IDC and also by the United States Geological Survey.
It is not possible to tell from seismograms alone that a recorded explosion is nuclear or is a chemical explosion in which all the explosive material is fired at the same time. Such single-fired chemical explosions do occasionally occur ‒ at small size. But the explosions in North Korea have been large. If not nuclear they would have required the simultaneous firing of thousands of tons of chemicals, which would have to have been assembled clandestinely to generate the signals we have recorded. Thus an origin other than nuclear is not plausible.
What do the seismic data tell us about the approximate size of the yield?
We can tell from comparison with the signals recorded in May 2009 that this latest explosion was about 2.5 to 3 times larger in yield, but this is a relative measure and there is greater uncertainty in estimating an absolute size. In absolute terms, I would expect the yield to lie somewhere in the range from about 5 to 15 kilotons.
How do seismic waves generated by an earthquake differ to those caused by an explosion? What was significant with this particular event?
Different seismic sources ‒ such as earthquakes, landslides, explosions in the ocean, atmospheric explosions, and underground explosions ‒ all generate a mix of different types of seismic waves. Furthermore, each type of seismic wave can be recorded across a range of frequencies. In practice, from studies of recordings from thousands of seismic events, the mix of different seismic waves is diagnostic of the type of seismic source that generated them.
For example, earthquakes and explosions all generate the fastest type of seismic wave, called the primary wave (or, P-wave) because it is the
first to arrive; they can all generate a secondary type of wave (or, S-wave); and they can all generate so-called surface waves that arrive last. But the efficiency of generation of these waves is distinctively different between earthquakes and explosions. For example, using data of the quality recorded from earthquakes and explosions, large and small, that have occurred in East Asia since the 1980s (when wide access to high-quality data began), we know that P-waves are most efficiently generated by explosions, and S-waves by earthquakes. Furthermore,these differences are accentuated whenwe focus on the higher-frequencycontent of the recorded signals. Withsurface waves, some features of thesignals are seen only for seismic sourcesthat are very shallow ‒ say, less thantwo or three kilometres, which is thecase for almost all explosions but is rarefor earthquakes. Other surface-wavefeatures are more commonly seen forearthquakes than explosions.
The above is but a short summary of the fact that there is a long list of different features in seismic waves that can be used to discriminate between earthquakes and explosions; and there is also a substantial infrastructure of regional, national, and international agencies that routinely acquire
Seismology and CTBT verification
Upgrading auxiliary seismic station AS02 at Ushuaia, Argentina.
WITH PAUL RICHARDSSPECIAL RESEARCH SCIENTIST, COLUMBIA UNIVERSITYINTERVIEW
2 2
C T B T O S P E C T R U M 2 0 | M A Y 2 0 1 3

seismograms and analyse them for purposes of characterizing the different types of seismic event.
To a remarkable degree the seismograms generated by the 12 February 2013 event had features that repeated what was observed from North Korea's second underground test except that signals were significantly larger than those recorded previously. This similarity indicates that the third and second tests were conducted in almost the same location.
When complete, the seismic network of the International Monitoring System (IMS) will comprise 170 stations. More than 90% of these stations are already up and running. How effective have IMS stations been in detecting events such as the three nuclear tests announced by the DPRK?
They are very effective, in the sense that signals from key stations had large signals (well above the level of background noise) and were promptly available to analysts. Even if the explosion had been hundreds of times smaller, in my opinion its signals would have been detected and appropriately characterized as coming from an explosion.
The United States Geological Survey (USGS) measured the event in the DPRK on 12 February 2013 as 5.1 in magnitude whereas the CTBTO’s International Data Centre (IDC) measured it as 4.9. Could you explain why there are different magnitude scales?
These two agencies use a different set of stations, and analyse their signals in slightly different ways, so it is not surprising that their measurements result in slightly different magnitude values.
The IDC works with a fixed set of primary and auxiliary seismic stations. As these two networks near completion, the IDC has the
opportunity to provide a magnitude that could become authoritative. The USGS typically can use more stations ‒and the International Seismological Centre (ISC) based in the UK can use even more ‒ but the stations used by the USGS and the ISC change from year to year and even more from decade to decade, which in a sense means that their magnitude scale changes slightly as new stations are added and some are closed (or are operated with new equipment).
In my opinion it would be very worthwhile for the IDC to make the effort to provide magnitude measurements based upon generally-agreed procedures and using a fixed station-set with stations (of the IMS) that are operated according to fixed procedures.
How confident are you that the IMS would detect an explosion with a yield of less than one kiloton and would an explosion smaller than that be of any military significance?
I am confident that the IMS would detect an explosion in North Korea well below one kiloton, because that part of the world is monitored very well indeed. However, even in that region there is some level of yield below which monitoring becomes uncertain. It is the goal of monitoring organizations, to drive that level down so far that militarily significant activities are inhibited. The question you are asking here raises many different issues especially if it is asked without reference to any specific country (such as DPRK). I participated
Figure 2 Sources of information
about the evacuation instruction
Source: National Diet Commission Report.
(2012)
»They [IMS stations] are very effective, in the sense that signals from key stations had large signals (well above the level of background noise) and were promptly available to analysts. Even if the explosion had been hundreds of times smaller, in my opinion its signals would have been detected and appropriately characterized as coming from an explosion.«
2 3
C T B T O S P E C T R U M 2 0 | M A Y 2 0 1 2
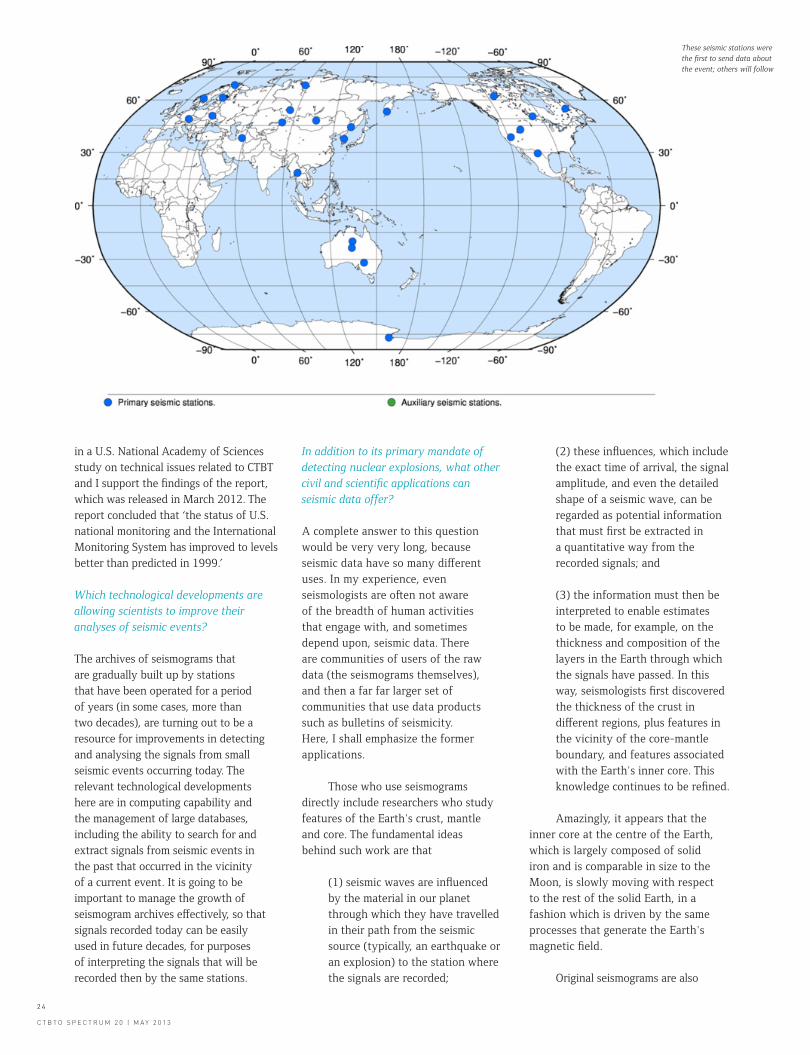
These seismic stations were the first to send data about the event; others will follow
in a U.S. National Academy of Sciences study on technical issues related to CTBT and I support the findings of the report, which was released in March 2012. The report concluded that ‘the status of U.S. national monitoring and the International Monitoring System has improved to levels better than predicted in 1999.’
Which technological developments are allowing scientists to improve their analyses of seismic events?
The archives of seismograms that are gradually built up by stations that have been operated for a period of years (in some cases, more than two decades), are turning out to be a resource for improvements in detecting and analysing the signals from small seismic events occurring today. The relevant technological developments here are in computing capability and the management of large databases, including the ability to search for and extract signals from seismic events in the past that occurred in the vicinity of a current event. It is going to be important to manage the growth of seismogram archives effectively, so that signals recorded today can be easily used in future decades, for purposes of interpreting the signals that will be recorded then by the same stations.
In addition to its primary mandate of detecting nuclear explosions, what other civil and scientific applications can seismic data offer?
A complete answer to this question would be very very long, because seismic data have so many different uses. In my experience, even seismologists are often not aware of the breadth of human activities that engage with, and sometimes depend upon, seismic data. There are communities of users of the raw data (the seismograms themselves), and then a far far larger set of communities that use data products such as bulletins of seismicity. Here, I shall emphasize the former applications.
Those who use seismograms directly include researchers who study features of the Earth's crust, mantle and core. The fundamental ideas behind such work are that
(1) seismic waves are influenced by the material in our planet through which they have travelled in their path from the seismic source (typically, an earthquake or an explosion) to the station where the signals are recorded;
(2) these influences, which include the exact time of arrival, the signal amplitude, and even the detailed shape of a seismic wave, can be regarded as potential information that must first be extracted in a quantitative way from the recorded signals; and (3) the information must then be interpreted to enable estimates to be made, for example, on the thickness and composition of the layers in the Earth through which the signals have passed. In this way, seismologists first discovered the thickness of the crust in different regions, plus features in the vicinity of the core-mantle boundary, and features associated with the Earth's inner core. This knowledge continues to be refined.
Amazingly, it appears that the inner core at the centre of the Earth, which is largely composed of solid iron and is comparable in size to the Moon, is slowly moving with respect to the rest of the solid Earth, in a fashion which is driven by the same processes that generate the Earth's magnetic field.
Original seismograms are also
2 4 C T B T O S P E C T R U M 2 0 | M A Y 2 0 1 3

Screen shot from NASA WorldWind software of NW Caribbean area. On 12 January 2010, a 7.0 magnitude earthquake struck near Port au Prince, Haiti’s capital city, claiming between 230,000 and 300,000 lives and leaving 1.5 million people homeless.
used by scientists who are interested in making estimates of the overall extent of faulting that underlies each large earthquake. Such natural events can be the most devastating phenomena influencing the life and health of millions of people, as we have seen with earthquakes at the magnitude 9 level offshore Sumatra (Indonesia) in December 2004, and offshore Japan in March 2011. Even earthquakes with far less energy can be devastating, as was found in December 2003 in Bam (Iran); in October 2005 in Kashmir; in May 2008 in Sichuan (China); and in January 2010 in Port-au-Prince, Haiti. The study of seismograms from such damaging events enable scientists to learn how much slip occurred between opposite faces on the causative faults whose fracture generated the waves recorded all around the world. And, most importantly, this work enables estimates to be made of the likely time scale for such earthquakes to be repeated.
New programmes are being developed to improve emergency management, in real time, as soon as a large earthquake is detected, with the general goal of providing information as soon as possible to those who might be affected by a soon-to-arrive tsunami, or the arrival of strong
shaking that could damage trains and prevent deliveries of electrical power. Such programmes, delivering vital information to enable preparation, require prompt assessment of strong seismic signals from near their point of origination, and then conveying a characterization of the potentially damaging waves that could damage structures at greater distance.
Users of bulletins of seismicity include thousands of scientists and engineers engaged in fault mapping and in general studies of seismic hazard, for broad regions, as well as for specific locales where there is the need for guidance on the degree of resistance to earthquake ground motions that must be built into new structures, or perhaps to be achieved by retro-fitting old buildings. The general point here, is that hundreds of earthquakes are documented each day around the world; and basic information on where and when they occurred, and how big they could be at different levels of probability, is the starting point for numerous quantitative studies in geology and the physics of earthquake; in the assessment of risk to large structures; and in the design of building codes.
2 5
C T B T O S P E C T R U M 2 0 | M A Y 2 0 1 2
PAUL RICHARDS is a Special Research Scientist at Columbia University, where he was a professor from 1971 to 2008. He co-authored an advanced text in seismology in 1980 (translated into Russian, Chinese, and Japanese), still in print (2nd edition 2002). He has researched methods of explosion and earthquake monitoring since the mid-1980s, has written about 40 professional papers on these subjects, and spent two separate years in U.S. government service (on leave from academia) working on technical issues of nuclear explosion monitoring and test ban negotiations.
BIOGRAPHICAL NOTE