
Interrogating supply-side data Helani Galpaya Katmandu, March, 2015 This work was carried out with...
49
Interrogating supply- side data Helani Galpaya Katmandu, March, 2015 This work was carried out with the aid of a grant from the International Development Research Centre, Canada and UKaid from the Department for International Development, UK.
-
Upload
karen-mcdaniel -
Category
Documents
-
view
214 -
download
1
Transcript of Interrogating supply-side data Helani Galpaya Katmandu, March, 2015 This work was carried out with...

Interrogating supply-side data
Helani GalpayaKatmandu, March, 2015
This work was carried out with the aid of a grant from the International Development Research Centre, Canada and UKaid from the Department for International Development, UK.

Much data; many producers/publishers
OPERATORS/SUPPLIERS- Financial data- Operational data
(equipment, quality)- Complaints- Transaction Generated
Data (Big Data)
REGULATOR/ POLICY MAKER- Network level data
for decision making and Monitoring
- Complaints
ITU/UN/WEF/OTHER INT’L/NTL ORGs- Raw data- Composite indices
(ranking countries)
USERS- Quantitative surveys- Qualitative studies
THIRD PARTY RESEARCH- Specialized
Studies based on data obtained from all stakeholders

CONNECTIVITY

Is connectivity increasing?
2004 2005 2006 2007 2008 -
10,000,000
20,000,000
30,000,000
40,000,000
50,000,000
60,000,000
70,000,000
80,000,000
90,000,000
100,000,000 Pakistan Mobile SIMs: 2004 - 2008
Looks impressive

But PK is in middle of pack when compared to S Asian neighbors
2004 2005 2006 2007 2008 -
50,000,000
100,000,000
150,000,000
200,000,000
250,000,000
300,000,000
350,000,000
Mobile SIMs: 2004 - 2008
Maldives Bangladesh India Pakistan Indonesia Phillipines Sri Lanka Thailand
Benchmarking is a basic, but
useful way to understand if
performance is ‘good’.

6
But telecom data changes, fast: Most recent data is a must-have
SIMs per 100 population

7
Who is actually ahead? Why?
Aided by multiple millions of SIMs deregistered in PK in 2008 & and change of definition of active SIMs in India in 2011

Which indicator benchmark? Different indicators can tell different stories
Total number of mobile subscribers in India and Bangladesh
0
50
100
150
200
250
2002 2003 2004 2005 2006 2007
Year
In m
illi
on
s
India Bangladesh
Mobile subscribers per 100 in India and Bangladesh
0
5
10
15
20
25
2002 2003 2004 2005 2006 2007
Year
Per
100
India Bangladesh
Mobile SIMs per 100 population, India and Bangladesh
Mobiles SIMs: India and Bangladesh

Are the data comparable? E.g., How do you reconcile different financial years? • Many countries Jan – Dec (calendar year)
– E.g., Sri Lanka• But many others differ
– India: Apr – Mar– Pakistan : Jul – June
• So “number of Internet users in per 100 inhabitants in 2013” reported by IN not comparable with PK
• Having quarterly data eliminates problem • Especially important if benchmarks are used for
mainstream regulatory work such as interconnection or retail tariff regulation

10
Prerequisites for comparison• Internationally accepted definitions and procedures
– ITU (2010) Definitions of World Telecommunication/ICT Indicators, Geneva: ITU
• Make sure that the definitions are adhered to– ITU has mobile broadband definition; use is inconsistent
• “Mobile broadband subscribers refer to subscribers to mobile cellular networks with access to data communications (e.g. the Internet) at broadband speeds (here defined as greater than or equal to 256 kbit/s in one or both directions) such as WCDMA, HSDPA, CDMA2000 1xEV-DO, CDMA 2000 1xEV-DV etc, irrespective of the device used to access the Internet (handheld computer, laptop or mobile cellular telephone etc). These services are typically referred to as 3G or 3.5G and include: Wideband CDMA (W-CDMA), an IMT-2000 3G mobile network technology, based on CDMA”

And whose data do you use?
# of internet subscribers (millions), India Difference between…
Year NASSCOM data TRAI DataMinistry of
Statistics & PI
NASSCOM & TRAI
numbers
TRAI & Ministry numbers
1999 0.35 0.23 - -
2000 0.65 0.95 0.943 -46% 1%
2001 1.13 3.04 2.909 -169% 4%
2002 1.763 3.42 3.239 -94% 5%
2003 3.661 3.64 3.5 1% 4%
2004 4.403 4.55 4.05 -3% 11%
2005 6.674 5.55 5.3 17% 5%
2006 6.94 5.556 - 20%
Note: Based on Financial Year – e.g. “2000” refers to April 1999 – Mar 2000Source: NASSCOM Strategic Review 2005; TRAI; Ministry of Statistics and Program Implementation, Govt. of India

Useful Indicators to measure connectivityFIXED• Number of fixed lines • Number of fixed wireline phones• Number of fixed wireless phones• Total fixed access paths per 100 inhabitantsMOBILE• Number of mobile SIM cards• Number of mobile SIM cards – prepaid• Number of mobile SIM cards – postpaid • Total mobile SIMs per 100 inhabitants
BROADBAND• Number of broadband connections per 100
inhabitants
ICT• Number of mobile users• Number of Internet users
IN-COUNTRY ACCESS GROWTH• Backbone map for a country• Mobile coverage map per operator• Base station map per operator
Can the method for estimating be improved?

‘Proportion of individuals using the Internet’
• Base indicator in composite indices such as:– NRI (Network Readiness Index)– KEI (Knowledge Economy Index)– IDI (ICT Development Index)
• Best measurement method recommended by ITU: – demand-side survey on proportion of
individuals using the Internet (from any location) in the last 12 months (HH7)
But only 58% percent of the countries have
conducted demand-side surveys by 2012 - ITU

Various methods can be used to estimate the number of Internet users • Internet Users = multiplier x Internet Subs
(supply side)Where– The multiplier = a number used to reflect that
each subscription is used by more than one individual (e.g. at kiosks)
– Internet subscriptions = Internet subscription of all types (speeds, technologies etc. )
• Wired, wireless etc.

Building on foundations of sand…• Multipliers chosen at discretion of Country administrations
– Perverse incentive to use higher multiplier to show high Internet penetration in country
• Difficulties in counting Internet subscriptions include…– Over-counting (counting all “Internet-capable” SIMs, irrespective
of use)
– Under-counting (being able to only count SIMs that have subscribed to a data package; SIMs with only voice packages may use Internet, but operators cannot count; impossible for pre-paid)
– General difficulty with multiple ownership (one user with fixed and many SIM connections) leading to questionable multipliers

……
……
……
……
Difficult to find rationale for multipliers
Country Fixed Internet Subscriptions
(000s), 2009
Internet Users (000s), 2009, ITU method
ITU multiplier
Russia 88,068 59,700 0.68Mauritius 224 290 1.3Liberia 15 20 1.33Liechtenstein 17 23 1.38Hong Kong, China 3,042 4,300 1.41
Côte d'Ivoire 18 968 53.78Sudan 44 4,200 95.24Iraq 3 325 104.84Uganda 30 3,200 106.67Afghanistan 2 1,000 500
• Huge variance in Multipliers: 0.68 (Russia) to 500 (Afghanistan) in 2009
• “Similar” countries with very different multipliers
• Afghanistan - 2,000 fixed subscriptions; Multiplier=500
• Burundi -5,000 fixed subscriptions; Multiplier=13

Improvement proposed by LIRNEasia • % of Internet users increase with Education and Income
components of Human Development Index (HDI) of a country – Education component - mean of years of schooling for adults and expected
years of schooling for children– Income component- Logarithm of GNI per capita (PPP$). – Health component of HDI is not used, due to lack of evidence that internet
penetration is correlated with life expectancy
• Studied the correlation between Internet penetration rate of countries which conducted demand side surveys and the education and income components of HDI 2011– Data on countries which have conducted demand-side surveys was obtained
from ITU and RIA– Sub index Education_GNI Index, consisting of education and income
components of the HDI index was calculated using ‘DIY HDI: Build Your Own Index’ on UNDP website. Both Education and Income were given equal weight

Strong correlation between Education_GNI Index and Internet penetration
Education_GNI Index 2011
0.20 0.30 0.40 0.50 0.60 0.70 0.80 0.90 1.000.00
10.00
20.00
30.00
40.00
50.00
60.00
70.00
80.00
90.00
100.00f(x) = 1.25733595202509 exp( 4.83909769409254 x )R² = 0.804814983823043
HDI_EdGNI
Prop
ortio
n of
indi
vidu
als
usin
g th
e In
tern
et

Step 1: If survey is available, use it since survey results are first best
• If representative survey from regional organization is available, use their data (e.g. RIA)
• If survey from current year is not available, use previous year’s data with adjustment– Adjust by average growth for country grouping
(e.g., middle income countries etc.)

• Derive model using income and education components of Human Development Index (HDI) vs. Internet penetration rate for countries which have conducted a survey (annually after HDI report has been released)
• Use this model to impute % of Internet Users for countries which have never conducted a survey
• If Internet penetration rate provided by country administrator is within +/- 7 percentage point band around calculated estimate -> use country reported figure
• Else use imputed figure
Step 2: In the absence of survey data use Education_GNI Index to estimate proportion of Internet users

Less than 30% countries show different Internet penetration rates
‘X’ Survey data from RIA but not same as ITU Internet penetration rate
0.00 10.00 20.00 30.00 40.00 50.00 60.00 70.00 80.00 90.00 100.000.00
10.00
20.00
30.00
40.00
50.00
60.00
70.00
80.00
90.00
100.00
Proportion of Internet users according to new method 2011
Prop
ortio
n of
Inte
rnet
use
rs a
ccor
ding
to
ITU
201
1 Antigua & Bar-buda Andorra
KuwaitOman
Barbados
Turkmenistan
GabonLibya
Cuba
Bahamas

PRICE & AFFORDABILITY

•In selecting an operator, consumers are likely to think about ALL costs including Connection charge, monthly rental etc.•ITU ICT price basket methodology takes these issues into account and has created Broadband Baskets consisting of
•Monthly cost of 1 GB use per month with at least 256kbps connection for a period of 24 months (includes Initial Connection Fee/24)•Affordability measured by dividing the cost of the Broadband basket by National average monthly GNI per capita
•RIA (Research ICT Africa) has further developed this methodology and also measure the cost of the following baskets in addition to the ITU basket
•Monthly cost of uncapped use per month with at least 256kbps connection for a period of 24 months.
Broadband Baskets: a realistic method of price comparison

Affordability of Fixed BB is increasing in developing countries, but still higher than developed countries
Source: ITU, Measuring the Information Society 2013, http://www.itu.int/en/ITU-D/Statistics/Documents/publications/mis2013/MIS2013_without_Annex_4.pdf

What about other prices? E.g. BB, wholesale & retail?
With 83 footnotes in the most recent publications we did

QUALITY
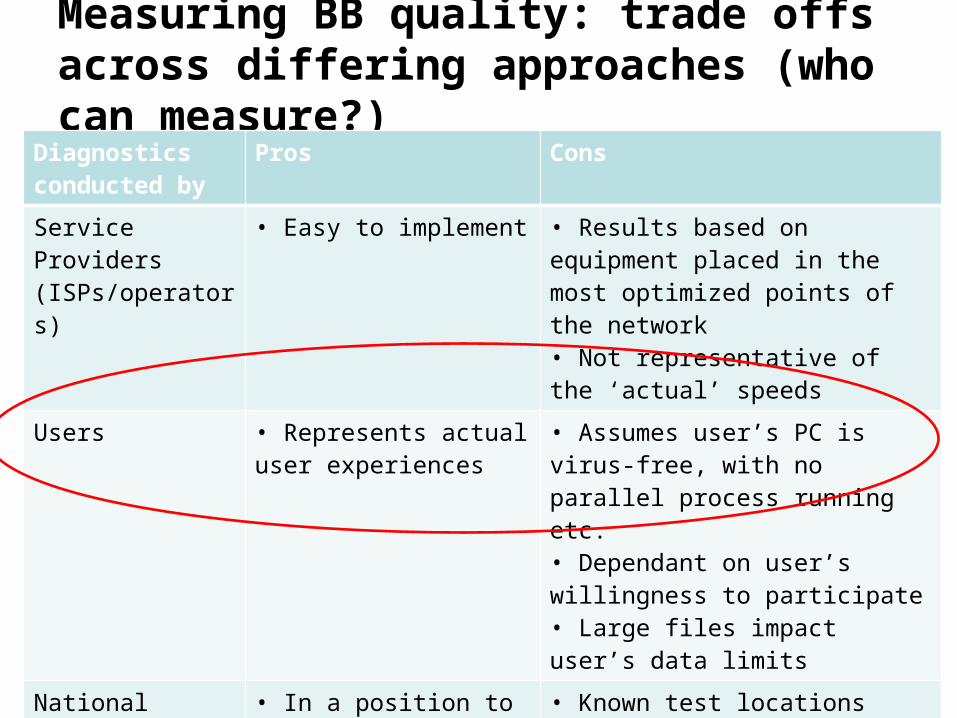
Measuring BB quality: trade offs across differing approaches (who can measure?)
27
Diagnostics conducted by
Pros Cons
Service Providers (ISPs/operators)
• Easy to implement • Results based on equipment placed in the most optimized points of the network• Not representative of the ‘actual’ speeds
Users • Represents actual user experiences
• Assumes user’s PC is virus-free, with no parallel process running etc.• Dependant on user’s willingness to participate• Large files impact user’s data limits
National Regulatory Authorities (NRAs)
• In a position to request operator involvement when necessary
• Known test locations will prompt operators to optimize networks in selected areas

Download speeds: Indonesia performs among the lowest (2014)
0800 H 1100 H 1500 H 1800 H 2000 H 2300 H0
1000
2000
3000
4000
5000
6000
7000
8000
BSNL (1Mbps)-Bangalore,IN BSNL (4Mbps)-Chennai,INBSNL (4Mbps)-Delhi,IN Dhiragu (512kbps)-Male,MVNTC (512kbps)-Kathmadu,NP PTCL (4Mbps)-Karachi,PKSLT (2Mbps)-Colombo,LK Dialog LTE (4Mbps)-Colombo,LKTelkom Speedy Instant (512kbps)-Jakarta,ID Internux LTE (72Mbps)-Jakarta,ID3BB (10Mbps)-Bangkok,TH
Dow
nloa
d (k
bps)

Delivers what was promised (advertised): Indonesia is not bad (2014)
0800 H 1100 H 1500 H 1800 H 2000 H 2300 H0
50
100
150
200
250
300
BSNL (1Mbps)-Bangalore,IN BSNL (4Mbps)-Chennai,IN
BSNL (4Mbps)-Delhi,IN Dhiragu (512kbps)-Male,MV
NTC (512kbps)-Kathmadu,NP PTCL (4Mbps)-Karachi,PK
SLT (2Mbps)-Colombo,LK Dialog LTE (4Mbps)-Colombo,LK
Telkom Speedy Instant (512kbps)-Jakarta,ID Internux LTE (72Mbps)-Jakarta,ID
3BB (10Mbps)-Bangkok,TH
Act
ual v
s A
dver
tised
(%)

Value for Money: Indonesia highest (2014)
0800 H 1100 H 1500 H 1800 H 2000 H 2300 H0
200
400
600
800
1000
1200
1400
BSNL (1Mbps)-Bangalore,IN BSNL (4Mbps)-Chennai,IN
BSNL (4Mbps)-Delhi,IN Dhiragu (512kbps)-Male,MV
NTC (512kbps)-Kathmadu,NP PTCL (4Mbps)-Karachi,PK
SLT (2Mbps)-Colombo,LK Dialog LTE (4Mbps)-Colombo,LK
Telkom Speedy Instant (512kbps)-Jakarta,ID Internux LTE (72Mbps)-Jakarta,ID
3BB (10Mbps)-Bangkok,TH
Kbps
per
USD

Useful Indicators to measure Quality
Voice Quality• Call drop rates• % of connections with good voice clarity• Call success rate
Broadband Quality• Broadband upload/ download speed (kbps/Mbps)• RTT or Round Trip Time (mili-second • Jitter (mili-second)• Packet-Loss (as a %)• Broadband availability (as a %)

Quality is more than download speed
+++ Highly relevant; ++ Very relevant; + Relevant; - Irrelevant
Service Download(kbps)
Upload(kbps)
Latency (Round Trip Time, RTT) (ms)
Jitter(ms)
Packet Loss(%)
Browsing (Text) ++ - ++ - -
Browsing (Media) +++ - ++ + +
Downloading +++ - - - -
Transactions - - ++ + -
Streaming media +++ - ++ ++ ++
VOIP + + +++ +++ +++
Games + + +++ ++ ++
- RTT has implications on client-server interactive systems- Jitter adds to the ‘noise’ of the transmission
- Packet Loss affects streaming media
Source: Gonsalves, T.A & Bharadwaj, A. (2009) 32
With increased use of cloud
resources, this changes. E.g.
upload as important as
download

INDUSTRY-STRUCTURE INDICATORS

Do you know a competitive market when you see one?
• “There was only ONE broadband service provider (Company A) in the country until 2008. Since then, there has been 4 service providers: A, B, C, D”. – Is this a competitive industry?
• What if we saw this? Year A’s share B’s share C’s share D’share
2008 100% - - -
2009 95% 2% 2% 1%
2010 93% 1% 2% 2%
2011 92% .5% 2.5% 2%
2012 93% 0.25% 2.75% 2%

HHI (Hirschman Herfindahl Index) is basic measure of market concentration
• Define Market– Fixed? Mobile? Voice telephony (fixed and mobile)? Internet
Services? – Identify market share of each operator M1, M2, M3….– Subscriber share, revenue share, minute share?
• HHI = (M1)2+ (M2)2, (M3) 2+…+(Mn)2
• US Dept of Justice says…– Greater than1800 concentrated market– Between 1000-1800 moderately concentrated– Less than 1000, concentrated– M&A activity increasing HHI by100+ and HHI >1800 automatic
review (etc.)

But what is the ‘market’? Fixed? Mobile? Voice? BB? Substitutability/elasticity
Bharti (23)23.74%
HFCL (1)0.11%
Shyam (1)0.04%
MTNL (2)1.35%
BPL (1)0.49%
Spice (2)1.61%
Aircel (9)4.06%
Reliance (23)17.54%
Tata (20)9.32%
Vodafone/Hutchison (16)
16.90%
BSNL (21)15.62%
Idea (11)9.19%
BSNL 83%
MTNL
9%
Other Private 8%
India, Mar 31 2008- Mobile HHI = 1593- BB HHI = 3171- Fixed HHI = 7034
India, fixed market shares
India, BB market shares
India, mobile market shares

Market share based on SIMs? Revenue? Minutes?
What if SMP definition was 60% for price regulation?

• Market segmented by wholesale vs. retail– E.g., Ofcom (UK regulator) reports wholesale (BT
dominated, HIGHLY concentrated) vs. retail (less concentrated, many ISPs including BT)
• Other ways

IN UNDERSTANDING THE HEALTH OF THE ICT SECTOR…

Traditionally prominance was for ‘supply side data’• Supply side data = data produced by the
suppliers of services: MNOs, equipment manf.• Reluctance to share, even when demanded by
regulation• Incentives to over- or under-report• Not comparable due to lack of agreement on
definitions– Internet user (good enough for most most people)– ‘daily active internet user (useful to operators)

Demand-side data: great for some measures, not for others. The right mix?
• Understand perceptions, opinions, feelings, satisfaction levels
• UK broadband satisfaction survey• Combined with crowd-sourced testing
• LIRNEasia electricity sector customer satisfaction survey in LK, IN, BD• IN worst actual performance• But highest satisfaction levels

Big Data: bridging the gap between expressed vs. revealed preference• How many minutes does it take, on average,
for a vehicle to get from point A to B? • Can survey ppl reasonable estimate• Can do traffic monitoring estimate also
• But most people have cell phones• CDR or VLR • Analyze the digital trace

In short, when looking at supply-side data, QUESTION EVERYTHING
Question EVERYTHING • Who reported it? What incentives did reporter of
data have? • What was the data collection method? Is it a
reasonable representation? • Does the data in isolation say a story that’s
different from the data that’s compared to others (over time, to other countries, etc.)
Where possible, triangulate (supply+demand)

COMPOSITE INDEXES

Networked Readiness Index

Networked Readiness Index

UN e-Gov survey
Expert assessment of onlinePresense of 193 states+ Data from int’l orgs

A4AI/Web Foundation: The affordability index
• Mix of subjective, perception indicators (survey) + objective data (mostly supply-side)
• No indicators of price or affordability!. • One respondent per country in 2013 now 2

Composite indices …
• Are great for getting attention of nations– Countries want to lead; Donors love them
• May not stand scientific interrogation? – Why is one sub-index weighed 1/3 while another is
weighted 2/3? Etc. • Often suffer from the same issues identified in
supply-side and demand-side data– How many respondents in expert survey? What
incentives? – How old/new and how comparable is objective data?