Internet Initiative Japan Inc . Corporate Overview … · November 2015 . TSE1:3774 NASDAQ:IIJI ....
40
November 2015 TSE1:3774 NASDAQ:IIJI Internet Initiative Japan Inc. Corporate Overview Daiwa Investment Conference Hong Kong 2015
Transcript of Internet Initiative Japan Inc . Corporate Overview … · November 2015 . TSE1:3774 NASDAQ:IIJI ....

November 2015 TSE1:3774 NASDAQ:IIJI
Internet Initiative Japan Inc. Corporate Overview
Daiwa Investment Conference Hong Kong 2015

2
Key Investment Highlights
Pioneer & top IP engineering company in Japan Maintain one of largest IP networks in Japan and
develop various network services by ourselves Target blue-chip & governmental organizations
(over 8,500 excellent Japanese customers as of FY14-end)
Accumulating recurring revenue with cross-selling and continuous business enhancement (network services, cloud, mobile, security, SI, etc.)
Enterprise systems at turning point toward mid-term Internal IT systems migration to cloud Rapidly expanding mobile market Explosion of data traffic
details to follow

3
The first established full-scale ISP in Japan Introduced many prototype Internet-related network services Highly skilled top level IP engineers Pioneer of network technologies in Japan Operates one of the largest Internet backbone networks in Japan Self-develop services and the related back office facilities
Established “IIJ” brand among the Japanese IT market Known for its engineering & network operation skills High customer satisfaction & long term relationship Over 8,500 clients: mainly large enterprises & governmental organizations
At the leading edge of IP R&D Engaged in software development of SDN Founding member of JEAG Co-work with Ministry of Internal Affairs and Communications Participates in world-wide research and organizations …and many more
TOP IP Engineering Company in Japan
3
Established December 1992
Number of Employees* Consolidated: 2,981 (approx. 70% engineers)
Listed Markets NASDAQ (IIJI), TSE1 (3774)
Large Shareholders* NTT (21.6%), Koichi Suzuki (5.6%*), NTT Communications (4.4%) *Jointly owned by Mr. Suzuki’s wholly owned private company
*Figures as of Sep. 2015

4 4
Entrepreneur of Network Technologies Business and Service Development to Initiate the Market
IIJ Group
Dial-up service
Internet VPN
IP Multicast
SMF
Anti-spam Solution
Managed Service
IPv6
Firewall Service
CDN
SEIL
P to P
Large Volume Data
Distribution
Asia Backbone
SLA
IX
ISP in U.S. hi-ho
Consumer ISP
IIJ4U
IIJmio
DC
Wide LAN
IIJ Mobile
iBPS
Systems Operation
Systems Integration
Application Development
IPTV Platform
Cloud Computing “IIJ GIO”
LaIT
DDoS
Home Page Service
Web Hosting Service
The first full-scale ISP in Japan In-housed development At leading edge of IP R&D IP specialists
Web Gateway
M2M
Internet LAN
FX
MVNE
Smart Mobile
Global WAN
Container DC
Cloud Service In US & China &
UK & Singapore
LTE
Overseas SI Projects
SDN/NFV
1992 1996 1997 2006 2007 2008 2010 2012 2013 2014
Consumer Mobile
SACM solution
BigData Solution
AI

5 5
Strategic Shift in Business Model
Merger of corporate ISPs
Heavy price competition
CWC filed for Chapter 7
Rise in needs for Cloud /Outsourcing
Increase in number of ISPs
Total Network Solution Provider
BLOOM Harvesting the flower of
EMERGE Cloud Computing
WAN Business (M&A Sep. 2010)
Revenue (JPY million)
5
Listed on TSE
Birth Earned its enduring
client base
Transition Change in
business model
NASDAQ IPO
Recurring Revenue
One-time Revenue
From “ISP” to “Total Network Solution Provider”
Network Services:
Systems Integration:
Internet connectivity services Outsourcing services
Systems construction
Systems operation and maintenance
WAN services
FY14 revenue JPY123.1billion

6
Business Model: Cross-selling of Network Solutions Systems
Construction
Outsourcing & Systems
Operation
Over 8,500 Client Base
• Dedicated line connectivity IP service (cover over Gbps) IPv6 service
• Broadband connectivity Optical Fiber/ADSL
• Mobile connectivity (IIJ Mobile) LTE/3G
• WAN services Wide area Ethernet/VPN Global WAN
Outsourcing services include: • Security-related services (managed-FW and IPS, DDoS protection, URL filtering, anti-spam etc.) • Data center-related services (housing, facility management and operation) • Server-related services (E-mail services, web hosting, online storage, CDN etc.) • Network-related services (network management and monitoring, VPN, SEIL, SMF etc.) • IIJ GIO Hosting Package Services (15% of 2Q15 Cloud-related revenues)
Systems operation includes: • Operation and maintenance of a system constructed in Systems Construction • IIJ GIO Component Services (85% of 2Q15 Cloud-related revenues)
6
e.g. Large scale EC system,
Disaster recovery system, Security gateway system etc.
Number of Customers
Increase revenues per customer
Revenues by Customer
Internet Connectivity & WAN

7 7
Excellent Blue-chip Client Base
7
High Market Penetration towards Top Tiers
The number of clients among the top 10 companies in each industry.
10 Electronic
appliances Information/Telco Machinery
Securities Retail Wholesale
Construction Insurance Precision equipment
9
9 9 9
8
10 9 7

8 8
Revenue Composition by Clients
Largest customer’s revenue is less than 3% of the total revenue Much room to increase revenue per customer
Revenue Distribution by Industry Revenue Distribution by Clients
Source: IIJ’s FY2014 financial results
Including gaming
companies’ revenues

9 9
Competitive Advantages IIJ can offer NW, Cloud, SI, and MVNO all at once
Systems Integrators Carriers Internet Connectivity Services
Outsourcing Services WAN Services
Network Integration Systems Operation
Private Cloud
Telephone Legacy Network Services
Mainframe Legacy Systems Operation
IIJ… has many highly skilled network engineers corresponds to the Internet market rapidly focuses on enterprises has an established brand among blue-chips has flat organization structure
IIJ… operates its own backbone network develops network services in-housed targets new IT market, not legacy SI
has long and rich experience in server operation has moderate number of employees
Cloud Computing Services
9

10 10
The Way Forward in Mid-Term
10
Environment
Position
Action
Scale Up with Business Investment Human resources enhancement Increasing employees by approx. 10% YoY Keep investing and developing innovative services GIO P2 and IIJ Omnibus Cloud and mobile as key drivers NW business in full bloom with genuine contents delivery Supplemented by M&As Revenues increase indicates
Capture Growing Demand Long term relations with over 8,500 blue-chip clients Best NW engineers operate large-scale networks and develop NW services on own Accumulated business elements of NW, securities, cloud, mobile, SI No legacy asset, No decrease in old SI revenues
Enterprise Systems at Turning Point in Japan Business models change by cloud, M2M, IoT, Big-Data Legacy systems shifting to cloud NW, securities features and SI required 4K/8K broadcasting over IP Devices revolution Collapse of legacy SI business models

11 11
Cloud Business Developments Cloud Market in Japan
Average system life cycle: 5 years Cloud migration expected to further penetrate Systems don’t migrate all at once, especially large internal systems Customization (SI feature) is required when migrating to cloud
Great business opportunity with IoT and BigData
IIJ’s Cloud Services Public cloud infrastructure (virtual servers, storage, etc.) Target large business enterprises’ internal IT systems, traditionally covered by SIers Promote cloud shift of blue-chips by continuously enhancing service line-ups Partnership with approx. 600 companies (Microsoft, VMware, SAP, IBM , etc. ) Engage in new service and solution development (BigData, M2M, etc.)
IIJ’s Competitive Advantage
Gaming companies, IT service
providers as early adopters
Mostly for simple
systems (web, file servers)
Some advanced integrated systems
Many mission critical
systems
N O W
Private Cloud Market Growth
Source: IDC Japan, Sep. 2014, Private Cloud Market
3 times
JPY0.6 trillion
JPY1.8 trillion
Experience, Reputation One of Largest Providers Reliable Operation
Deep Relationships with Blue-chip Customers
Genuine Public Cloud as Private SI + MVNO + NW
Own Services Development
Container Datacenters

12 12
Cloud Business Developments
12
Revenue Growth (unit JPY billion) Customer Base
Business Model Prominent User Cases Continuously invest in service facility such as
servers, storage and datacenter
Benefit from large-scale service facility by
improving utilization Turned positive in 4Q13
3.1
6.2
9.8
Large Game Customers
Corporate Users
12.3
15
MRC over JPY0.5 million MRC over JPY1.0 million
*MRC: Monthly Recurring Charge 1,340 users
280 users
170 users
700
50
90 340
10 40
1,000
190
100
4Q12-end 4Q13-end 4Q14-end 2Q15-end 4% 7% 9% 11%
and many more…
Migrating all of its internal business operation systems to IIJ’s cloud services
Replacing its group communication platform to IIJ’s cloud services
Cloud revenue to corporate
revenue
and many more
“Cloud first” Fully outsource their internal servers, multi-cloud arrange
Replacing its marketing solution platform by IIJ’s hybrid cloud solution
Cloud-related CAPEX: JPY1.7 billion (FY14), JPY3.7 billion (FY13)
Cloud-business gross margin: FY14: approx. JPY 0.5 billion FY15: target approx. JPY0.9 billion

13
MVNO Market in Japan MVNO Penetration in Japan (unit JPY billion)
160 million mobile subscription in total 3 MNOs dominate MVNO in early stage, Consumer services began 2012 MVNO penetration 10% 15% 14% 6% Government promotes MVNO strongly SIM lock free, PM’s comment, more variety of pricing,
2 years contract in dispute, HLR discussion MVNO infra. cost by Docomo decrease dramatically By 23.5% in FY14, 56.6% in FY13, 41.2% in FY12 YoY
IIJ’s MVNO Business Model Consumer
MVNO Business
13
Source: Ministry of Internal Affairs and Communications * March and June end SIM subscription have not been reported
IIJ’s MVNO Infrastructure (leased from Docomo) and many more
MVNO platform service (MVNE business) D
irect
Onl
ine
Sale
s
BigData Cloud SI Security
Sales channel
MVNOs
53 CATV operators
(as of Sep. 2015)
Enterprise M2M / IoT
and many more
MVNO subscription SIM subscription
6.3% 6.1% 4.6% 5.8%
Dec. 2013 Dec. 2014 Mar. 2015 June 2015
9.97 9.52 8.93 6.69
1.38 1.95
MVNOs MNOs
Pre-paid SIM
Post-paid SIM
¥6-7,000 per month full package service
¥1,600 per month upper limit of 3GB

14
MVNO Business Developments
Consumer Market Share
Blue-Chip Client Base SI + Cloud for M2M/IoT Large Scale NW Infra.
Reliable, Redundant Security, GW Solution Services Development
High Satisfaction MVNE Strategy Sales Partnerships
Fast, Reputation NW Utilization Improving Services
1Q14-end416
2Q14-end449
3Q14-end552
4Q14-end673
1Q15-end811
2Q15-end934
FY13 JPY4.71 billion
FY14 JPY7.69 billion
1H15 revenue JPY6.48 billion
Total subscription (thousand) Total revenue (JPY billion)
IIJmio mobile (Consumer)
IIJ Mobile (Enterprise)
IIJmio mobile(Consumer)
IIJ Mobile (Enterprise)
Subscription (unit: thousand) :
Revenue (unit: JPY billion):
IIJ’s Competitive Advantage For corporate
For consumer
Subscription and Revenue

15
Business/Services Developments for Mid Term Growth
Cloud services
▼Start in 2009 ▼Service line-ups enhancement (VMware, SAP, etc.) ▼Continuous front investment ▼Opened Container DC ▼Profit turn positive ▼Games’ usage increase ▼Games’ usage decrease ▼Increase of large-scale proj.
Target enterprises’ deep adoption of Cloud in mid-term, pursue scale merit with SI
Mobile services
▼Start in 2008 ▼Start consumer services ▼Add mobile solutions for corp. ▼Acquiring M2M-related proj. ▼Consumer accelerate ▼Turn positive early stage ▼Growing demand for MVNE
Consumer market explode, Corp. & Consumer traffic to improve network efficiency
SI ▼Low SI demand after Lehman shock ▼Return of IT investment appetite ▼Weak revenue growth
Continuous increase of SI, especially profitable recurring maintenance revenues
Overseas business
▼Began focus on overseas business ▼Deficit at max ▼New subsidiaries and Cloud investment ▼Export Container DCs
Seek new opportunities, Deficit to decrease as its revenue largely increasing
Service/ Solution
▼SDN ▼SAP solution ▼M2M/Bigdata platform services ▼DWH solution ▼Smart-meter platform
Continuous investment for service and solution developments (HEMS, IoT etc.)
Employees ▼Hire over 100 new graduates ▼Increase approx. 10% YoY
Continuous enhancement of human resources
Revenue
Operating Income
FY10 FY11 FY12 FY13 FY14 FY15 Target
82.4 97.3 106.2 114.3 123.1 139.0
Weak SI after Lehman shock
Achieved revenue & operating income growth with enterprise services
Acquisition of IIJ Global Solutions Inc.
Enhance business investment Recurring revenues
decreased by certain large customers
Accelerate business developments Seeing strong revenue
growth Docomo’s mobile costs
Business Situation
Accelerate revenue growth
Expansion of business scale
4.14 6.35 7.75 5.72 5.08 6.5
Unit: JPY billion
▼Operation & maintenance grew by 16.8% YoY

16
Summary of 1H FY2015 Financial Results %: YoY change %: YoY change < 1H15 Results > < FY15 Targets >
Revenues JPY65.33 billion up 14.3% JPY139.0 billion up 13.0% Gross margin JPY11.71 billion up 7.4% JPY25.1 billion up 13.7% Operating income JPY2.56 billion up 6.1% JPY6.5 billion up 28.1% Net Income attributable to IIJ JPY1.65 billion up 14.4% JPY4.0 billion up 20.4%
2Q15 3-month financials Revenue JPY33.87 billion (up 14.3% YoY), 1Q15 up 14.2%, 4Q14 up 11.7%, 3Q14 up 8.2%, 2Q14 up 6.0% YoY Operating income decreased from JPY1.65 billion (2Q14) to JPY1.42 billion mainly because of a temporary positive impact of approx.
JPY0.29 billion we recognized in 2Q14 due to MVNO data communication charge with NTT Docomo (same impact of approx. JPY0.27 billion in 1Q15)
Consumer mobile market expanding, MVNE business transactions growing Subscription (unit: thousand): total 934 (up 123 QoQ), consumer 605 (up 78 QoQ), MVNE 136 (up 32 QoQ) More SIM lock-free devices (iPhone6s etc.) in the market, OTA, headsets-bundle services, enhancement of advertisement etc. MVNE business largely expanding: approx. 80 MVNE partners including CATV operators and a prominent contents business provider M2M demands expanding While large projects tend to require longer negotiation, executing small-to-mid size projects Started providing voice call function via SIM card to corporate customers (Sep. 2015)
Accumulating SI orders along with a return of corporates’ systems investment appetite 1H15 Systems operation and maintenance revenue: up 23.7% YoY, Order received including systems construction: up 17.5% YoY Virtualization platform VMware services continued to grow, new “IIJ GIO Infrastructure P2” services accumulating prospective orders
Aggressively expanding business opportunities in ASEAN region SI and global WAN projects in 1H15, Executing container datacenter export projects for 2H15, Cloud business in Indonesia etc.
Continuously focusing on service development and line-up enhancement Launch of new services “IIJ Omnibus Service” (Sep. 2015) and “IIJ GIO Infrastructure P2” (Nov. 2015) Increasing demands for security services, Continuously enhancing line-up including solution for targeted email attacks
Operating income increased with strong revenue accumulation, absorbed annual operating costs increase, Seek income growth with further enhancement of revenue growth
YoY: compared to the same period in a previous year
(*) (*) as of Sep. 30 2015
QoQ: 2Q15 compared with 1Q15
(*)

17
FY2015 Financial Target (Disclosed on May 15, 2015)
Mobile-related services Target over 1 million subscription by Dec. 2015, Target revenue of approx. JPY13 billion for FY2015 (up JPY5.3 billion YoY). Expect a slight decrease in gross margin ratio due to an increase in unprofitable voice service revenues. Expect Docomo’s mobile connectivity charge per bandwidth to decrease by 15% from the charge fixed in Mar. 2015.
Cloud-related services Target revenue of over JPY15 billion (up JPY2.7 billion YoY) by accumulating enterprise needs. Expect gross margin to increase by over JPY0.4 billion along with revenue growth.
Overseas business Target revenue of over JPY6.5 billion (up JPY1.6 billion YoY). Expect margin to increase by approx. JPY0.4 billion with revenue growth.
Enterprise network services Target revenue (excluding Cloud and mobile related) to increase by approx. JPY1.8 billion, considering an enhanced sales activity and expecting no large revenue decrease in WAN services.
SI Target revenue (excluding Cloud and overseas business related) to increase by approx. JPY3.8 billion with strong economy and accumulation of systems operation and maintenance revenue.
SG&A and R&D expenses Expect to increase by approx. JPY1.6 billion which is almost the same amount increased in FY14, expecting the increase in personnel-related costs and sales commission fee etc.。
Human resources Hired 155 new graduates. Plan to hire 160 second-career personnel (including approx. 140 personnel to replace outsourcing resource). Expect personnel-related cost to increase by approx. JPY3.0 billion.
YoY = FY15 target compared to FY14 results
Unit: JPY billion
(Annual) (Annual)
OperatingIncome 6.5 5.1 +1.4 +28.1%
FY15 Target(Apr. 2015-Mar.2016)
FY14 Actual(Apr. 2014-Mar.2015)
YoY(FY15 Target to FY14
Actual)
TotalRevenues 139.0 123.1 +15.9 +13.0%
Net Incomeattributable to IIJ 4.0 3.3 +0.7 +20.4%
Income beforeIncome Tax
Expense6.4 5.1 +1.3 +24.5%
Cash Dividends perShare JPY 22.00 JPY 22.00 - -
Net Incomeattributable to IIJ
per ShareJPY 87.07 JPY 72.31 + JPY 14.76 +20.4%
+13.7%Gross Margin 25.1 22.1 +3.0

18
(YoY) (+JPY1.25) (+JPY1.25) (+JPY1.25) (+JPY2.5) (+JPY2.5) (+JPY2.5) (+JPY3.25) ( - ) ( - )
FY2006 FY2007 FY2008 FY2009 FY2010 FY2011 FY2012 FY2013 FY2014 FY2015
FY2015 Dividend Forecast IIJ conducted a 1:200 stock split on common stock with an effective date of October 1, 2012. Dividend figures shown below are retroactively adjusted to reflect the stock split.
Interim Year-End
JPY7.50 JPY8.75
JPY10.00 JPY11.25
JPY13.75
JPY16.25
JPY18.75
JPY22.00 JPY22.00 JPY22.00 (forecast)

APPENDIX

20
Overseas Business Developments
20
Business Developments Requests to support build Cloud infrastructure from Asian countries
• Jointly provide Cloud services with a local carrier in Indonesia (Mar. 2015) Export container DCs to Laos and Russia,
Expect transactions to expand in the middle-to-long term • Accumulating similar prospective orders from other emerging countries
Enhance network infrastructure including an expansion of Internet backbone Overseas Cloud business developments
• Enhanced Cloud service lineups for Europe, Providing VMware hypervisor services (Oct. 2014)
• Launched Cloud services in Singapore (June 2014)
Overseas offices Financial Results (Unit: JPY billion)
Deficit
Revenue Main subsidiaries Est. Employees Business
IIJ America Inc. 1996 39 Provide mainly ISP services , Cloud services and SI to the Japanese companies in the U.S.A.
IIJ Europe Limited 2012*1 54*2 Provide mainly SI and Cloud services to the Japanese companies in Europe
IIJ Global Solutions China Inc. 2012 18 Provide mainly SI and Cloud services
in China
IIJ Global Solutions Singapore Pte. Ltd. 2012*1 18
Provide mainly SI and Cloud services to local and Japanese companies in Singapore
Pt. IIJ Global Solutions Indonesia 2015 - Provide Cloud-related services
operation in Indonesia
Game customers’ revenue FY13 FY14
JPY1.38 billion JPY0.50 billion *1 Became our subsidiaries *2 Includes IIJ Europe’s subsidiary of IIJ Deutschland GmbH

21
Financial Results
Business Model
ATM Operation Business Developments
< Trust Networks Inc. > • 79.5% subsidiary • Established in July 2007 • Pursue ATM operation business
Similar to “Seven Bank” model, high profitability • Seven Bank: 21,056 ATMs, revenue JPY106.0 billion, profit ratio 32.5% as of March 31, 2015
Placing ATMs in Pachinko parlors in Japan with dominant position • After long discussion, started to place in Kanto, Kansai, Kyushu and Tokai areas
Receive commission for each withdrawal transaction Strong revenue & income driver in mid-term
• Approx.11,900 Pachinko parlors in Japan as of Dec. 2013 (Metropolitan Police Dept.)
21
Number of placed ATMs* 280 440 625 855 1,059
*Number of placed ATMs are as of May each year except for FY14 which is the number as of Mar. 2015
Operating Income Revenue
Unit: JPY billion

22
MVNO infrastructure cost for NTT Docomo: Data Communication Charge (“DCC”)
• Mobile infrastructure leasing fee from Docomo • Fixed charge by bandwidth • Regulated price by government (MIC & guideline) • Same flat-rate for all MVNOs • Renews every year based on Docomo’s actual cost • Decreased dramatically in recent years • Fixed 1 year after, applied to current and a previous year • DCC payment for FY14 has been deducted 40% from
1Q14 by Docomo’s arrangement • FY14 DCC fixed in March 2015
7.46
4.84
2.85
1.23 0.95 -41.2% -35.1% -56.6% -23.5%
MVNO infrastructure cost & its impact for FY14 financial NTT Docomo’s Monthly DCC per 10Mbps
(JPY million)
FY14 DCC decrease is not so large, against our expectation FY14 DCC gap between estimate & actual impacted FY14 profit by JPY1.26 billion
FY13 usage
FY13 usage
FY14 usage
FY14 usage
MVNO Infrastructure
cost
JPY0.42 billion
Estimate Actual
+ JPY1.26 billion
2010 2011 2012 2013 2014 2015
FY14 DCC (Data Communication Charge):
- Calculated by Docomo’s FY13 actual cost
- Applied to FY13 & FY14 usages
GAP : + JPY 0.20 billion FY14 DCC applied to FY13 usage, reflected in FY14 financial results (Should have in FY13) GAP : + JPY 0.64 billion FY14 DCC applied to FY14 usage, reflected in FY14 financial results GAP : + JPY 0.42 billion FY14 DCC will down in FY15. But, not to record its impact in FY14 financial results (due to accounting reason)

Consolidated Financial Results for 1H FY2015
Announced on November 9, 2015

24 24
Ⅱ- 1. Consolidated Financial Results for 1H FY2015 Unit: JPY billion
% of Revenues % of Revenues % of Revenues % of Revenues
1H15 1H14 1H15 Target FY15 Target(Apr. 2015-Sep. 2015)
(Apr. 2014-Sep. 2014)
(Apr. 2015-Sep. 2015)
(Apr. 2015-Mar. 2016)
82.1% 80.9% 81.9%
53.6 46.3 113.917.9% 19.1% 18.1%
11.7 10.9 25.114.0% 14.8% 13.4%
9.1 8.5 18.63.9% 4.2% 3.8% 4.7%
2.6 2.4 2.5 6.54.1% 4.4% 3.8% 4.6%
2.6 2.5 2.4 6.42.5% 2.5% 2.3% 2.9%
1.7 1.4 1.5 4.0
―
―
―
64.0
ActualagainstTarget
+4.6%
+2.1%
―
―
―
+10.2%Net Incomeattributable to IIJ +14.4%
Income beforeIncome Tax Expense +6.2% +10.3%
Operating Income +6.1%
Gross Margin +7.4%
SG&A/R&D +7.7%
YoYChange in %
Total Cost ofRevenues +15.9%
Total Revenues 65.3 57.2 +14.3% 139.0

25 25
16,799 16,896 17,466 17,844 18,481 19,519
9,45711,411 11,776
15,593
11,07412,652
466378 521
802
946692
829934 911
966
9631,007
1Q14 2Q14 3Q14 4Q14 1Q15 2Q15
Ⅱ- 2. Revenues Unit: JPY million Network Services
ATM Operation Business Equipment Sales
Systems Integration (SI)
Outsourcing Service
Internet Connectivity Services (Enterprise)
WAN Service
Internet Connectivity Services (Consumer) Systems Operation and Maintenance Systems Construction ( ) , YoY = compared to the same period in a previous year
Recurring Revenue* 1H15: JPY54,082 million (up 15.8% YoY) 1H14: JPY46,696 million (up 3.5% YoY) (82.8% of 1H15 revenue)
*Represents the following monthly recurring revenues 1. Internet Connectivity Services(Enterprise/Consumer) 2. Outsourcing Services 3. WAN Services 4. Systems Operation and Maintenance
One-time Revenue * 1H15: JPY9,281 million (up 6.5% YoY) 1H14: JPY8,713 million (up 10.2% YoY) (14.2% of 1H15 revenue)
* Revenue which is recognized when systems or equipment are delivered and accepted by customers 1. Systems Construction 2. Equipment Sales
1H14: 57,172 (+5.1%) 1H15: 65,334 (+14.3%) FY14: 123,050 (+7.7%)
27,552 (+4.2%)
29,620 (+6.0%)
30,674 (+8.2%)
35,204 (+11.7%)
31,464 (+14.2%)
33,870 (+14.3%)

26 26
Ⅱ- 3. Cost of Revenues and Gross Margin Ratio
1H15 Gross Margin Total: JPY11,708 million (up JPY803 million, up 7.4% YoY) Gross margin ratio: 17.9% (down 1.2 points YoY)
Network Services: JPY7,498 million (up JPY171 million, up 2.3% YoY) Gross margin ratio: 19.7% (down 2.0 points YoY) The below table shows the actual network
service gross margin ratio which is calculated by excluding temporary positive impact(*) and recalculating FY2014 mobile interconnectivity cost by applying the final wholesale data communication charge which decreased by 23.5% from a year before:
SI: JPY3,385 million (up JPY456 million, up 15.6% YoY) Gross margin ratio: 14.3% (up 0.2 points YoY)
ATM Operation Business: JPY666 million (up JPY123 million, up 22.7% YoY) Gross margin ratio: 33.8% (up 3.0 points YoY)
Unit: JPY million
YoY = 1H15 compared to 1H14
Network Services
Network Services
Cost of revenues: Gross margin ratio:
ATM Operation Business
Systems Integration(SI)
Equipment Sales Systems Integration(SI)
Total Revenues
1H14: 46,267 1H15: 53,626 FY14: 100,978
22,554 23,713 25,130 29,580 25,805 27,821
1Q14 2Q14 3Q14 4Q14 1Q15 2Q15
20.7 20.3 20.6 19.0 19.0 19.1
Unit:%
IIJ recognized a temporary positive cost impact of approx. JPY0.27 billion in 1Q15 for FY14 mobile interconnectivity usage. The same positive impact of approx. JPY0.29 billion was recognized in 2Q14 for FY13 usage.
(*)

27 27
4,092 4,116 4,080 4,062 4,067 4,289
1,714 1,797 2,242 2,469 3,102 3,495
5,008 5,013 4,955 5,132 5,0955,393
5,985 5,971 6,189 6,181 6,216 6,342
1Q14 2Q14 3Q14 4Q14 1Q15 2Q15
1H14: 33,696 (+0.3%) 1H15: 38,000 (+12.8%)
FY14: 69,006 (+2.6%)
16,799 (+0.1%)
16,896 (+0.4%)
17,466 (+4.6%)
17,844 (+5.1%)
18,481 (+10.0%)
19,519 (+15.5%)
Ⅱ- 4. Network Services (1)Revenues
Outsourcing Services Internet Connectivity Services (Consumer)
WAN Services
Internet Connectivity Services (Enterprise)
Total Contracted Bandwidth (Gbps)
Unit: JPY million
1H15 Internet Connectivity (Enterprise) JPY8,357 million (up JPY149 million, up 1.8% YoY)
• Mobile services revenue continued to increase • Over 1Gbps contracts: as of 2Q15-end: 343 contracts as of 2Q14-end: 305 contracts
• 2Q15 IP services revenue increased from 1Q15
1H15 Internet Connectivity (Consumer) JPY6,597 million (up JPY3,068 million, up 87.9% YoY)
• IIJmio mobile services continued to increase 2Q15-end subscription: 605 thousand
(up 359 thousand YoY, up 78 thousand QoQ) 1H15 revenue: JPY4.57 billion (up 3.07 billion YoY) 2Q15 revenue: JPY2.47 billion (up 0.38 billion QoQ) 2Q15 net addition was slightly weaker than 1Q15
due to seasonality. Expect pace to increase from Oct. along with the sales of iPhone6s and other SIM-lock free devices
1H15 Outsourcing Services JPY10,489 million (up JPY468 million, up 4.7% YoY)
• Demands for security-related services increased, overseas hosting services accumulated revenue
1H15 WAN Services JPY12,558 million (up JPY601 million, up 5.0% YoY) Revenue increased, no major revenue decrease
from large customers
YoY = 1H15 compared to 1H14 QoQ = 2Q15 compared to 1Q15
( ) = compared to the same period in a previous year

28
Ⅱ- 4. Network Services (2)Cost of Revenues Unit: JPY million
( ) Gross margin ratio
Others
Outsourcing-related costs
Personnel-related costs
Network operation-related costs
Circuit-related costs
YoY = 1H15 compared to 1H14
1H14: 26,369 (21.7%) 1H15: 30,501 (19.7%) FY14: 54,932 (20.4%)
13,213 (21.3%)
13,155 (22.1%)
13,762 (21.2%)
14,801 (17.0%)
14,702 (20.4%)
15,799 (19.1%)
1H15 Cost of network services: up JPY4,133 million, up 15.7% YoY Mobile-related costs (recognized in outsourcing-related costs) increased with the increase in mobile subscription and traffic Network operation-related costs increased by JPY702 million YoY mainly due to upgrading our network to 100Gbps compatible
environment and enhancing mobile infrastructure. The costs are expected to increase slightly from 3Q with the launch of new services Circuit-related costs increased by JPY451 million YoY mainly due to an increase in WAN services revenue
Regarding NTT Docomo’s (“Docomo”) mobile interconnectivity cost recognition: • Docomo’s interconnectivity telecommunications service charge, which was calculated by Docomo’s FY13 mobile-related cost, was fixed in Mar. 2015 and it
decreased by 23.5% from a year ago. • The same charge based on Docomo’s FY14 mobile-related cost should be fixed in Mar. 2016. In the meantime, Docomo’s bill for FY15 mobile interconnectivity usage
has been 25% off temporarily from Apr. 2015. During FY2015, IIJ calculates its mobile interconnectivity cost by applying a supposed annual decrease rate of 15%. • In 1Q15, IIJ recognized a temporary positive cost impact of approx. JPY0.27 billion for FY14 mobile interconnectivity usage by applying supposed annual decrease
rate of 15%. The same positive impact of approx. JPY0.29 billion was recognized in 2Q14 for FY13 usage.

29 29
Ⅱ- 5. Systems Integration (SI) (1)Revenues Unit: JPY million
Systems construction revenues 1H15 revenue: down JPY226 million, down 2.9% YoY 1H15 revenues are almost the same level with 1H14. Number and
scale of projects in FY15 are exceeding those of FY14 along with economic recovery. Accumulating order-received
2Q15 order received: up JPY1,419 million, up 25.6% YoY Revenue continued to increase along with economic recovery Large-scale construction projects orders received in 2Q15:
• Upgrading DDoS systems for a major bank • Virtualizing global merchandising platform system for a major
retailer • Back office systems for a major travel agency etc.
2Q15 order backlog includes a large network integration project which we received in 1Q15 (approx. JPY2.1 billion)
1H15 revenue: up JPY3,082 million, up 23.7% YoY Private cloud-related revenue continued to increase (up JPY1,128
million, up 24.2% YoY), Systems construction projects which migrated to systems operation and maintenance phase also continued to increase strongly (up JPY1,954 million, up 23.5% YoY)
2Q15 order received: up JPY1,256 million, up 18.7% YoY 85% of 2Q15 cloud-related revenue is recognized in systems
operation and maintenance revenues (15% in outsourcing)
Order backlog
Systems Construction Revenues Systems Operation and Maintenance Revenues
※Systems construction’s order backlog and order received include equipment sales Order received
Systems operation and maintenance revenues
< Systems Construction >
< Systems Operation and Maintenance >
< Overseas business > 1H15 revenue: approx. JPY2.40 billion, loss: approx. JPY0.42 billion (1H14 revenue: approx. JPY2.20 billion, loss: approx. JPY0.46 billion)
1H14: 13,000 1H15: 16,082 FY14: 27,800
1H14: 7,869 1H15: 7,643 FY14: 20,437
4,377 5,540 6,458 5,860 6,308 6,959
7,803 6,724 9,487 8,900 7,486 7,980
YoY = compared to the same period a previous year

30
Ⅱ- 5. Systems Integration (SI) (2)Cost of Revenues Unit: JPY million
( ) Gross margin ratio
Others
Purchasing costs
Outsourcing-related costs
Personnel-related costs
Network operation-related costs
1H15 Cost of SI: up JPY2,401 million, up 13.4% YoY Number of outsourcing personnel as of 2Q15-end: 979 personnel (up 72 personnel YoY, down 6 personnel QoQ) Outsourcing-related costs increased along with the increase in the number of construction projects and the accumulation of
operation and maintenance projects which were migrated from construction phase Outsourcing-related and personnel-related costs increased due to new services and solutions developments Recognized loss provision of approx. JPY30 million for a project in 2Q15 Network operation-related costs (such as depreciation and amortization costs) are expected to increase from 3Q15 due to the
launch of new services “IIJ GIO Infrastructure P2” (Nov. 2015)
YoY = 1H15 compared to 1H14 QoQ = 2Q15 compared to 1Q15
1H14: 17,940 (14.0%) 1H15: 20,341 (14.3%) FY14: 41,562 (13.8%)
8,322 (12.0%)
9,618 (15.7%)
10,239 (13.0%)
13,382 (14.2%)
9,591 (13.4%)
10,749 (15.0%)

31
Ⅱ- 6. Number of Employees Unit: JPY million
Engineers 71%
Sales 18%
Administration 11%
[Employee Distribution]
Contract worker
Full time worker
YoY = 1H15 compared to 1H14
Personnel related costs & expenses (% of revenue)
1H15 personnel-related costs and expenses: JPY10,563 million (up JPY1,279 million YoY, up 13.8% YoY) Number of employees increased by 264 personnel with RYUKOSHA M&A (Dec. 2014) in 3Q14, personnel-related expenses increased Hired 155 new graduates in Apr. 2015 (129 in Apr. 2014, 136 in Apr. 2013). Planning to hire 128 new graduates in Apr. 2016 Number of employees is within our plan
1Q14 2Q14 3Q14 4Q14 1Q15 2Q15
4,641 (16.8%)
4,643 (15.7%)
4,704 (15.3%)
5,114 (14.5%)
5,266 (16.7%)
5,297 (15.6%)
2,523 2,546 2,818 2,835 2,975 2,981 (Number of employees)
32 32
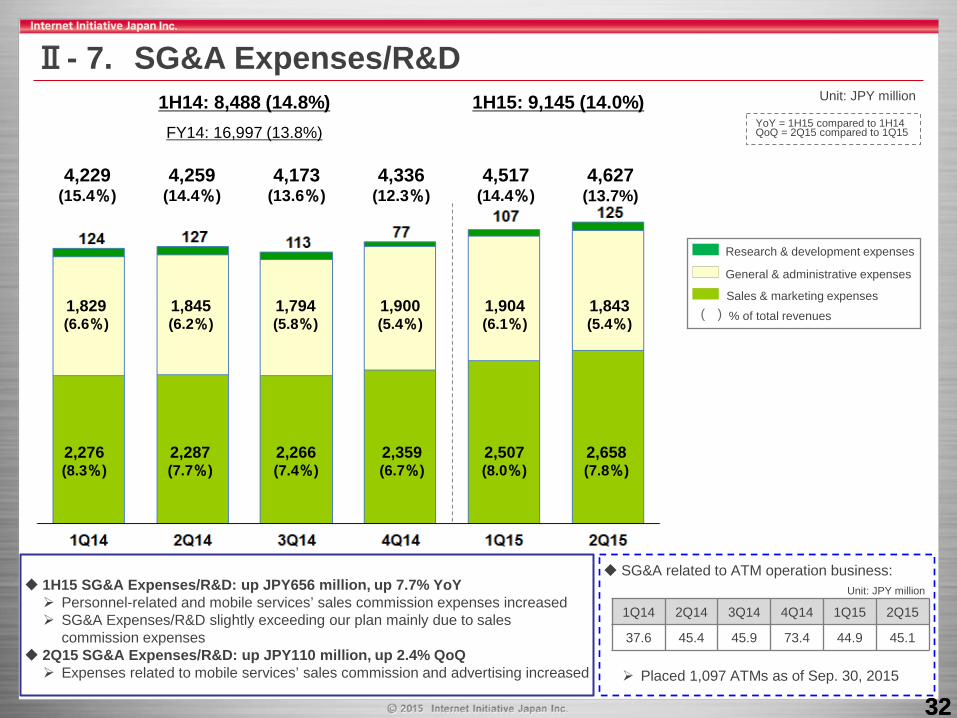
Ⅱ- 7. SG&A Expenses/R&D Unit: JPY million
1,829 (6.6%)
1,845 (6.2%)
1,794 (5.8%)
1,900 (5.4%)
1,904 (6.1%)
1,843 (5.4%)
2,276 (8.3%)
2,287 (7.7%)
2,266 (7.4%)
2,359 (6.7%)
2,507 (8.0%)
2,658 (7.8%)
1H14: 8,488 (14.8%) 1H15: 9,145 (14.0%) FY14: 16,997 (13.8%)
4,229 (15.4%)
4,259 (14.4%)
4,173 (13.6%)
4,336 (12.3%)
4,517 (14.4%)
4,627 (13.7%)
( )
Sales & marketing expenses
General & administrative expenses
Research & development expenses
% of total revenues
SG&A related to ATM operation business:
Placed 1,097 ATMs as of Sep. 30, 2015
1H15 SG&A Expenses/R&D: up JPY656 million, up 7.7% YoY Personnel-related and mobile services’ sales commission expenses increased SG&A Expenses/R&D slightly exceeding our plan mainly due to sales
commission expenses 2Q15 SG&A Expenses/R&D: up JPY110 million, up 2.4% QoQ Expenses related to mobile services’ sales commission and advertising increased
1Q14 2Q14 3Q14 4Q14 1Q15 2Q15
37.6 45.4 45.9 73.4 44.9 45.1
YoY = 1H15 compared to 1H14 QoQ = 2Q15 compared to 1Q15
Unit: JPY million

33 33
Unit: JPY million
Operating Income Net Income Attributable to IIJ Operating Margin Ratio YoY = compared to the same period in a previous year
Ⅱ- 8 Operating Income and Net Income
Operating income: 2Q15: JPY1,422 million
(down JPY226 million, down 13.7% YoY) • Temporary positive cost impact of approx. JPY0.29
billion related Docomo’s mobile interconnectivity cost in 2Q14 (Recognized the same temporary positive impact of approx. JPY0.27 billion in 1Q15)
Income before income tax expenses: 1H15: JPY2,647 million
(up JPY156 million, up 6.2% YoY) • Dividend income: JPY74 million • Distribution from fund investments: JPY115 million • Interest expense: JPY112 million
1Q15 foreign exchange gains were mostly offset by 2Q15 foreign exchange losses
Net income attributable to IIJ: 1H15: JPY1,652 million
(up JPY208 million, up 14.4% YoY) • Mainly due to equity in net income of Internet Multifeed: JPY137 million • Net income attributable to noncontrolling interests
including Trust Networks: JPY92 million
1H14 Operating income: 2,416 1H14 Net income attributable to IIJ: 1,444
1H15 Operating income: 2,563
1H15 Net income attributable to IIJ: 1,652
220 624 523 319 450 472 Current income tax expense
132 98 36 (55) 111 6 Deferred tax expense (benefit)
34 35 46 40 61 76 Equity in net income of
equity method investees
(18) (24) (15) (18) (57) (35) Less: Net income attributable to noncontrolling interests

34 34
Unit: JPY million
Ⅱ- 9. Consolidated Balance Sheets (Summary)
Total IIJ Shareholders’ Equity to Total Assets: 57.5% as of Mar. 31, 2015, 57.3% as of Sep. 30, 2015
Mar. 31, 2015 Sep. 30, 2015 Changes
Cash and Cash Equivalents 21,094 20,098 (995)
Accounts Receivable 22,252 20,067 (2,184)
Inventories and Prepaid Expenses (Current and Noncurrent) 7,835 10,079 +2,243
Investments in Equity Method Investees 2,561 2,657 +97
Other Investments 6,661 6,395 (266)
Property and Equipment 29,370 32,651 +3,281
Goodwill and Other Intangible Assets 10,111 9,918 (193)
Guarantee Deposits 2,800 2,815 +15
Total Assets 108,705 110,806 +2,101Accounts Payable 13,626 14,159 +533
Income Taxes Payable 499 799 +300
Short-term Borrowings 9,250 9,250 -
Capital Lease Obligations (Current and Noncurrent) 7,863 8,467 +604
Total Liabilities 45,862 46,852 +990Common Stock 25,500 25,509 +10
Additional Paid-in Capital 36,014 36,032 +18
Retained earnings (Accumulated deficit) (556) 591 +1,147
Accumulated Other Comprehensive Income 1,939 1,779 (160)
Total IIJ Shareholders' Equity 62,504 63,519 +1,015

35 35
Ⅱ- 10. Consolidated Cash Flows Unit: JPY million
YoY = 1H15 compared to 1H14
< Operating Activities >
< Investing Activities >
< Financing Activities >
1H14: 5,345 1H15: 6,080 FY14: 12,912
1H14: (5,154) 1H15: (4,565) FY14: (8,073)
1H14: (3,568) 1H15: (2,525) FY14: (6,283)
Financing Activities 1H15 Breakdown YoY Change
Principal payments under capital leases (2,020) +63
Dividends paid (505) (0)
Investing Activities 1H15 Breakdown YoY Change
Purchase of property and equipment (5,321) (1,311)
Operating Activities 1H15 Breakdown YoY Change
Net income 1,744 +258
Depreciation and amortization 4,800 +117
Net gain on other non-cash transactions 119 (191)
Fluctuation of operating assets and liabilities (584) +552

36 36
1H14: 4,684 1H15: 4,800 FY14: 9,677
Ⅱ- 11. Other Financial Data (CAPEX etc.) Unit: JPY million
Capital Lease Cash CAPEX
< CAPEX >
< Depreciation and Amortization > < Adjusted EBITDA > 1H14: 7,100 1H15: 7,363 FY14: 14,753
1H14: 5,801 1H15: 7,943 FY14: 11,835
Includes approx. JPY2.0 billion cloud-related investment such as for new cloud services and VW series
37
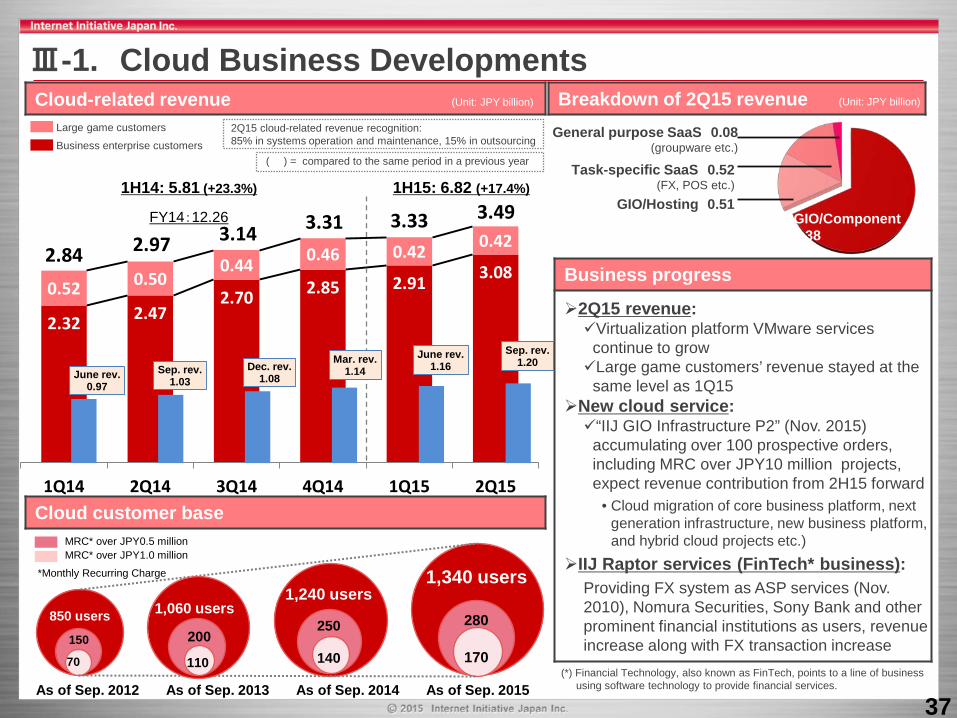
2.32 2.47 2.70 2.85 2.91 3.08
0.52 0.50 0.44 0.46 0.42 0.42
2.84 2.97 3.14 3.31 3.33 3.49
1Q14 2Q14 3Q14 4Q14 1Q15 2Q15
Ⅲ-1. Cloud Business Developments
As of Sep. 2012 As of Sep. 2013 As of Sep. 2014 As of Sep. 2015
Task-specific SaaS 0.52 (FX, POS etc.)
General purpose SaaS 0.08 (groupware etc.)
Cloud-related revenue (Unit: JPY billion)
GIO/Component 2.38
GIO/Hosting 0.51
Large game customers
Business enterprise customers
MRC* over JPY0.5 million MRC* over JPY1.0 million
Breakdown of 2Q15 revenue (Unit: JPY billion)
2Q15 cloud-related revenue recognition: 85% in systems operation and maintenance, 15% in outsourcing
*Monthly Recurring Charge
Cloud customer base
150
850 users
70
1,240 users
250
140
1,340 users
280
170
1,060 users
200
110
Business progress
2Q15 revenue: Virtualization platform VMware services
continue to grow Large game customers’ revenue stayed at the
same level as 1Q15 New cloud service: “IIJ GIO Infrastructure P2” (Nov. 2015)
accumulating over 100 prospective orders, including MRC over JPY10 million projects, expect revenue contribution from 2H15 forward
• Cloud migration of core business platform, next generation infrastructure, new business platform, and hybrid cloud projects etc.)
IIJ Raptor services (FinTech* business): Providing FX system as ASP services (Nov. 2010), Nomura Securities, Sony Bank and other prominent financial institutions as users, revenue increase along with FX transaction increase
(*) Financial Technology, also known as FinTech, points to a line of business using software technology to provide financial services.
June rev.0.97
Sep. rev.1.03
Dec. rev.1.08
Mar. rev.1.14
June rev.1.16
Sep. rev.1.20
1H14: 5.81 (+23.3%) 1H15: 6.82 (+17.4%)
FY14:12.26
( ) = compared to the same period in a previous year

38
1Q14-end416
2Q14-end449
3Q14-end552
4Q14-end673
1Q15-end811
2Q15-end934
MVNO Market in Japan
Ⅲ-2. Mobile Business Developments Total subscription & revenue
IIJmio mobile (Consumer)
IIJ Mobile (Enterprise)
IIJmio mobile(Consumer)
FY13 JPY4.71 billion
FY14 JPY7.69 billion
IIJmio mobile & IIJ Mobile subscription & revenue
1H15 revenue JPY6.48 billion
Total subscription (thousand) Total revenue (JPY billion)
Enterprise
Demands for MVNE continues to be strong: 1H15 revenue: approx. JPY0.77 billion (up 315.0% YoY) 1H15-end subscription: approx. 136 thousand (up 100 thousand YoY) 2Q15-end MVNE partners: approx. 80 (increased by more than 60 partners from 2Q14-end) Each MVNE transaction becoming larger - more CATV operators starting MVNE business
Enhanced M2M-related service line-ups to aggressively capture demand 1H15 revenue: approx. JPY0.26 billion (up 37.6% YoY)
Consumer
2Q15 subs. accumulating, Pace increasing from Oct. with iPhone6s launch Maintaining high user satisfaction with continuous infrastructure expansion Further business development Expansion of headsets-bundle service line-ups (Fujitsu, ASUS, HUAWEI) MNP transaction taken place at over 250 electronic stores nationwide and home Pre-paid SIM card services to foreigners visiting Japan sold at airports,
convenience stores, electronic stores, tourist centers etc.
IIJ Mobile (Enterprise)
Subscription (unit: thousand) :
Revenue (unit: JPY billion):
From 1Q15, IIJ Mobile subscription includes the subscription of “IIIJ Mobile MVNO Platform Services” which is our MVNE service (exclude hi-ho) <MVNE subscription> 1Q14: 35 thousand, 2Q14: 36 thousand, 3Q14: 40 thousand, 4Q14: 67 thousand, 1Q15: 104 thousand, 2Q15: 136 thousand
YoY = 1H15 compared to 1H14 Unit: million subscription MIC’s goal
The above shows MVNO subscription excluding MNO’s MVNOS but including SIM-type, module-type and resale-type. IIJmio mobile services are under SIM-type category. (Source: Ministry of Internal Affairs and Communications (MIC) Oct. 2014 and Sep. 2015)
Market growing, Expect for further expansion
June 2014 June 2015 During 2016

39
Ⅲ-3. FY2015 Financial Target (Remain unchanged) Unit: JPY billion
(Annual) (Annual)-
Net Income attributableto IIJ per Share JPY 87.07 JPY 72.31 + JPY 14.76 +20.4%
Cash Dividendsper Share
JPY 22.00 JPY 22.00 -
+20.4%
Income beforeIncome Tax Expense 6.4 5.1 +1.3 +24.5%
Net Income attributableto IIJ 4.0 3.3 +0.7
+28.1%
Gross Margin 25.1 22.1 +3.0 +13.7%
Operating Income 6.5 5.1 +1.4
FY15 Target(Apr. 2015 - Mar.2016)
FY14 Actual(Apr. 2014 - Mar.2015)
FY15 Target toFY14 Actual
Total Revenues 139.0 123.1 +15.9 +13.0%

40
※ Forward-looking Statements Statements made in this presentation regarding IIJ’s or managements’ intentions, beliefs,
expectations, or predictions for the future are forward-looking statements that are based on IIJ’s and managements’ current expectations, assumptions, estimates and projections about its business and the industry. These forward-looking statements, such as statements regarding revenues, operating and net profitability are subject to various risks, uncertainties and other factors that could cause IIJ’s actual results to differ materially from those contained in any forward-looking statement. These risks, uncertainties and other factors include but not limited to: • a decrease of corporate spending or capital expenditure due to depression in the Japanese economy and/or corporate earnings decreased,
• an inability to achieve anticipated results and cause negative impact on profitability, • a possibility that less of reliability for our services and loss of business chances due to interruption or suspension of our services,
• an excess increase and fluctuation in network rerated cost, mobile-related cost, outsourcing cost, personnel cost etc,
• a possibility to lose business opportunity due to our inadequate resources in personnel and others, • an increase in competition and strong pricing pressure, • the recording of an impairment loss as a result of an impairment test on the non-amortized intangible assets such as goodwill,
• a decline in value and trading value of our holding securities. Please refer to IIJ’s filings on Form 20-F of its annual report and other filings with the United States Securities and Exchange Commission ("SEC") for other risks.
※ Contact Information IIJ Investor Relations Iidabashi Grand Bloom, 2-10-2 Fujimi, Chiyoda-ku, Tokyo, 102-0071, Japan
TEL: 81-3-5205-6500 URL: http://www.iij.ad.jp/en/ir/ E-Mail: [email protected]