Internet Banking in Europe: a comparative analysis
28
Research Institute of Applied Economics 2008 Working Papers 2008/11, 28 pages 1 Internet Banking in Europe: a comparative analysis By Francesca Arnaboldi 1 and Peter Claeys 2 1 Dipartimento di Economia, Università di Milano. Via Festa del Perdono 7, 20122 Milano. E-mail: [email protected]. 2 AQR Research Group - IREA. Department of Econometrics, University of Barcelona. Avda. Diagonal, 690. 08034 Barcelona, Spain. Email: [email protected]. Abstract: A key strategic issue for banks is the implementation of internet banking. The ‘click and mortar’ model that complements classical branch banking with online facilities is competing with pure internet banks. The objective of this paper is to compare the performance of these two models across countries, so as to examine the role of differences in the banking system and technological progress. A fuzzy cluster analysis on the performance of banks in Finland, Spain, Italy and the UK shows that internet banks are hard to distinguish from banks that follow a click and mortar strategy; country borders are more important. We therefore explain bank performance by a group of selected bank features, country-specific economic and IT indicators over the period 1995-2004. We find that the strategy of banking groups to incorporate internet banks reflects some competitive edge that these banks have in their business models. Extensive technological innovation boosts internet banking. . Key words: Banks, Internet, Innovation. . JEL codes: G21, O32. . .
Transcript of Internet Banking in Europe: a comparative analysis
Research Institute of Applied Economics 2008 Working Papers 2008/11, 28 pages
1
Internet Banking in Europe: a comparative analysis
By Francesca Arnaboldi1 and Peter Claeys2
1Dipartimento di Economia, Università di Milano. Via Festa del Perdono 7, 20122 Milano. E-mail: [email protected].
2AQR Research Group - IREA. Department of Econometrics, University of Barcelona. Avda. Diagonal, 690. 08034 Barcelona, Spain. Email: [email protected].
Abstract: A key strategic issue for banks is the implementation of internet banking. The ‘click and mortar’ model that complements classical branch banking with online facilities is competing with pure internet banks. The objective of this paper is to compare the performance of these two models across countries, so as to examine the role of differences in the banking system and technological progress. A fuzzy cluster analysis on the performance of banks in Finland, Spain, Italy and the UK shows that internet banks are hard to distinguish from banks that follow a click and mortar strategy; country borders are more important. We therefore explain bank performance by a group of selected bank features, country-specific economic and IT indicators over the period 1995-2004. We find that the strategy of banking groups to incorporate internet banks reflects some competitive edge that these banks have in their business models. Extensive technological innovation boosts internet banking.
.
Key words: Banks, Internet, Innovation. .
JEL codes: G21, O32. .
.
1. INTRODUCTION
Alternatives to classical branch banking have attracted increasing attention as Internet usage
started to spread. Banks started to use the internet not only as an innovative payment method
and to increase customer convenience, but also as a way to reduce costs and enhance profits.
Fierce competition between banks, both in retail and wholesale, has forced banks to find new
and profitable areas where to expand. But Internet banking seems to represent a viable
strategy also for new entrants in the banking sector. Two main business models may be
identified in the use of banking portals online. Classic banks start to cross-sell bank products
via a website in order to reach new clients and diversify their distribution channels (‘click and
mortar’).1 Nearly half of US banks were using transactional websites at the beginning of
2002. An alternative strategy is the creation of a pure internet bank (IB) without the support of
a network of physical branches. Only a few banks have adopted a pure online business model.
After the initial internet hype faded, some were forced to exit the market via liquidation or
acquisition; others developed a mixed model and opened physical branches. Only a few pure
online banks were able to achieve profits and survive. We observe instead banks integrating
pure online banks in the banking group: a pure IB is part of a banking group but perceived by
clients as an “external”, innovative bank.
The growth pains of online banking raise some questions on the success of either strategy.
What drives the choice among different internet banking models? The adoption of online
banking as a product or process innovation is in first instance driven by bank-specific factors.
Banks have strengths and weaknesses that may influence the choice of the online banking
model. Initial conditions are important determinants in this choice. The managerial
implications are various, yet a “winning” model for IB requires more than a change in
banking strategy. External factors may facilitate the adoption of online banking. General
economic features such as the level of investment in technology (ICT, broadband, internet
access, and so forth), R&D expenses, and the skill of end-users with new technologies may
influence the development of online banking. Some countries may have economic and
technological features favouring IB development. This has interesting implications for 1 “Transactional Websites” have been defined by DeYoung (2005) as websites which allow customer remote access to banking services. The most basic transactional websites allow few operations such as money transfers, payments, and checking account balances. Some websites allow their customers to apply for mortgages and loans and manage clients’ investments.
economic policy. Reform of financial legislation and more generally boosting innovation in
financial markets is known to spur economic growth.
Few studies have focused on the latter topic. Much of the evidence on the development of
online banking focuses on a specific bank market in one country. Likewise, we compare pure
IBs to mixed banks on different cost and performance measures. We use indicators at the
level of the banking groups that own a mixed or pure IB, as data do not allow detailing costs
at the level of business units. Our analysis attempts to isolate those features specifically linked
to internet banking. We endeavour to group pure and mixed IBs banks according to certain
performance criteria and bank characteristics. We then provide panel estimates of bank
performance on the basis of these bank-specific characteristics. Banking group performance
and cost are influenced by many variables.
The contribution of this paper is to compare the performance of banking groups with pure IB
to mixed internet banks across four EU countries (Finland, Italy, Spain and the UK). In
particular, we examine the impact of country-specific features on the development of online
banking. Fragmentation of the EU banking system hinders the creation of pan-European
banking groups. Yet this division allows looking in the consequences of different banking
systems and the level of technological development on innovation in the banking industry.
We relate performance to various country-specific characteristics.
The paper is structured as follows. In section 2, we discuss the few studies that have examined
the performance of pure IBs relative to mixed banks. We argue, in section 3, that differences
in banking structure and macro-micro features of economies are decisive in the performance
of online banks. We provide a descriptive cluster analysis of banking structure and country-
specific characteristics for Finland, Italy, Spain and the UK. In section 4, we analyse the
performance of pure and mixed IBs, and relate these to bank and country- specific
characteristics. We conclude with some policy implications in section 5.
2. DOES INTERNET BANKING ENHANCE BANK PERFORMANCE AND
WHY?
The relevant literature on this topic may be divided into two groups: on the one hand some
authors focus on the internet as an innovative delivery channel representing new challenges to
the financial sector. These studies relate the adoption of internet websites to economic
features, such as PC ownership and usage, technology changes, R&D investments and mostly
use descriptive techniques. The second group of studies examines the consequences on bank
performance of different strategic models of online banking. Pure online banking, the
development of internet websites as a delivery channel, or traditional banking do not have the
same implications.
Referring to the first group, Birch and Young (1997) argue that the internet may be exploited
as a new delivery channel by the financial services industry to completely reorganise the
structure of banks. The use of solely electronic channels (without physical channels) threatens
traditional retail banks as pure internet banks can compete with lower overheads. Moreover,
non-bank competitors may use electronic channels to bypass retail banks completely2.
Jayawardhena and Foley (2000) explore the internet as a new delivery channel arguing that
internet websites may help to overcome the inherent disadvantages of a traditional branch.
The provision and the implementation of internet banking has been slow, probably due to the
limited range of services offered at that time. However the authors point out that the internet
may act as a facilitator in payment systems as it provides a broader range of services at all
times, and thus assists the growth of electronic commerce. Finally, internet has been analysed
as a substitute/complementary channel in delivering certain bank products, like current
accounts. Gondat-Larralde and Nier (2004) investigate the competitive process in the UK
market for personal current accounts between 1996 and 2001. In particular the authors
examined the speed with which the distribution market shares have changed in response to
price differentials by comparing traditional banks to “direct banks” that operate via telephone
and the internet. The results point to the importance of customer switching cost as a key
determinant of the competitive process in this market.
Few studies attempt to assess the performance of internet banks. Nearly all studies refer to the
US banking system. Sullivan (2000) argues that traditional banks are not affected by the
adoption of the internet as a distribution channel. In a comprehensive study, Furst et al.
(2002) develop a statistical model to explain why banks choose to adopt internet banking and
why they differentiate their supply of online products. The authors also investigate the effects
of online banking on profitability. They find that bank profitability is strongly correlated with

internet banking for all US national banks. The first to adopt the new system were large,
profitable banks, located in urban areas and forming part of a holding company. These banks
use internet services as an aggressive business strategy to gain market share rather than for
making profits. Their study shows no relationship between the existence of internet banking
and profitability but this could be due to the disproportion of customer use of internet banking
in their sample.
In a more recent study, DeYoung (2005) analyzes the performance of a dozen pure internet
banks that started up between 1997 and 2001. This paper attempts to identify which features
of the pure online banking model have been effective, why some banks have been able to
deploy this model more successfully than others, and whether the internet-only business
model could be economically sustainable in the long run. The empirical results confirm the
low average level of profits at pure internet banks. Nonetheless the study reveals that typical
internet startups offer better prices than the average traditional banking startups and grow
faster as well. The problem is that the expected reduction in overheads and other expenses
does not materialise and hence reduces profits because of insufficient scale in the operations.
Finally, the evidence shows the existence of some technology-specific scale effects,
suggesting the need for a pure online competitor to grow larger in order to survive. The study
concludes that the internet-only banking model is potentially viable but its market share is
likely to be limited.
To our knowledge, there are few attempts to empirically investigate internet banking
performance in Europe. Hasan et al. (2005) analyse the performance of multi-channel
commercial banks vis à vis traditional banks in Italy. Internet adoption seems to influences
positively bank performance, measured in terms of ROAA and ROAE. Hernando and Nieto
(2006) examine the impact on bank financial performance in the Spanish banking market
when a transactional website was set up. The authors conclude that the adoption of the
internet as a delivery channel gradually reduces overhead expenses. This cost reduction boosts
the performance of banks about one year and a half after the adoption in terms of ROAA, and
after three years in terms of ROAE. In line with DeYoung (2005), this study proves that the
internet had been used more as a complement than as a substitute for physical branches,
suggesting the dominance of a multi-channel banking model.
2 This situation could be seen in embryo form where telephone companies issue prepaid phonecards. In the UK major retail chains have entered the market. E.g. Safeway’s has created its own bank (Safeway’s Bank) which offers debit card services,
3. ONLINE BANKING IN EU COUNTRIES
The development of online banking in European countries reveals some common traits. In
recent years, the dominant industrial strategy in EU countries is for banking groups to own
both pure internet banks and more traditional banks with an internet portal, thus exploiting
both business models. Internet banks that initially offered only online tools have gone over to
a mixed model, using other channels as, for example, telephone banking, or financial
advisors. Stand-alone internet banks are rather rare.3 The large majority of traditional banks
have set up an internet portal to diversify their distribution channel. But in addition, many
banking groups have set up separate internet banks with their own brand that function as
independent entities.
We examine the performance of banking groups that have set up internet banks (pure internet
banks) versus banks that offer a mix of distribution channels (mixed banks). We look into the
development of online banking in four EU countries (Finland, Italy, Spain and the UK). This
enables us to expand the dataset to produce clearer evidence regarding the performance of
online banking. But in addition, it allows us to contrast different banking models. This makes
the results more widely applicable than studies focused on a specific market. These four
countries not only represent a variety of banking structures but also differ in their economic
structure, and in particular in their adoption of new technologies. These external factors
possibly affect the success of internet banking.
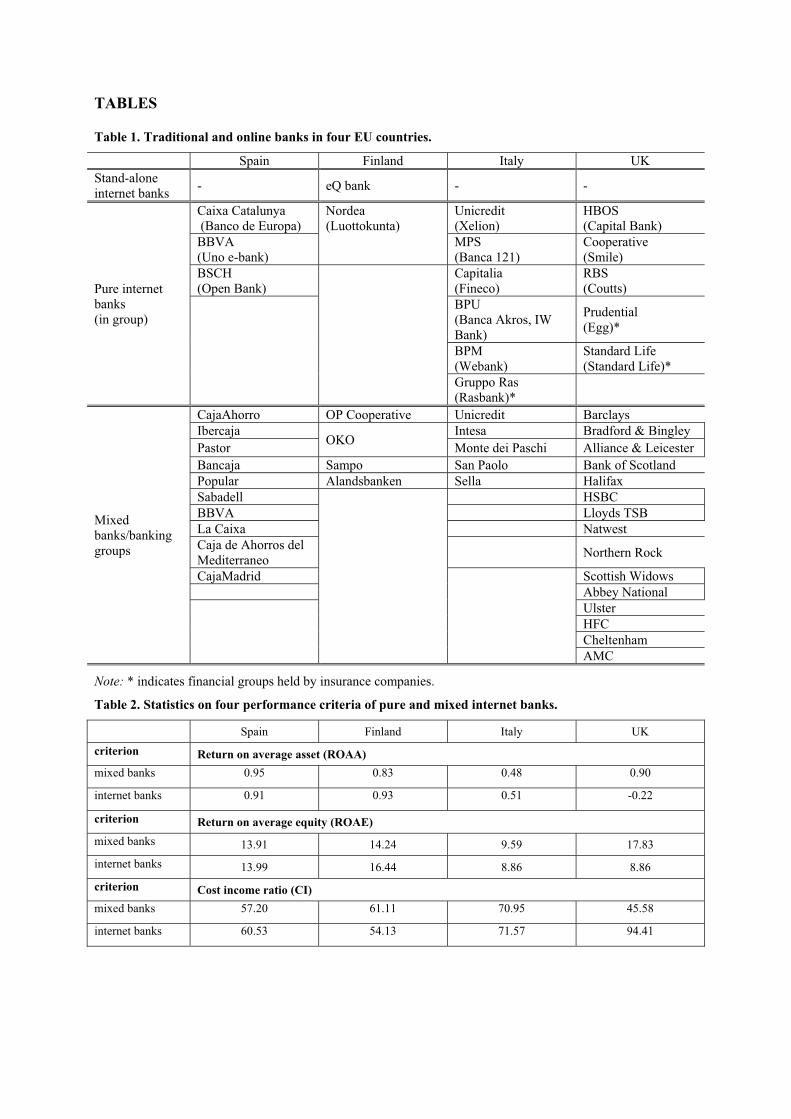
Table 1 shows the banks in Finland, Italy, Spain and the UK we consider in this study. With
the exception of eQ-bank in Finland, there are no stand-alone internet banks. We will not
further consider this bank in the analysis. Several large banks and two financial groups held
by an insurance company have established pure internet banks within their holding. We
consider all internet banks in the four countries. There are relatively more bank groups that
have created separate online banks in Italy and the UK. In Spain, only three internet banks
have been set up whereas in Finland, only the traditional banker Nordea has created a pure
internet service. A similar number of banking groups offer online transactions alongside their
traditional branch services. They are peers in terms of size, products and market mix.
Basically, IBs develop simple, deposit-based products that clients perceive as commodities. consumer loans and grant access through website (Source: corporates’ Annual Reports and Websites). 3 As said in the Introduction, our sample is limited to financial groups with banks or insurance companies as holder.
Usually they offer current and savings accounts, money transfers and payments services (e.g.
bill payment). In Italy trading online has also been offered by some internet banks. Practically
the same services are offered via transactional websites. In summary, the sample of pure and
mixed banks accounts for more than 70% of all banking activities in these countries.
Data on these banks are taken from Bankscope, a Bureau Van Dijk database, which provides
balance sheet information on banks at comparable standards.4 We measure bank profitability
in terms of return on average equity, return on average assets, cost to income ratio and the
overheads/profit before tax ratio. ROAA is the ratio of gross income to average assets and
ROAE is the ratio of gross or net income to average equity. Gross income is usually preferred
to net income to avoid the differences in taxation among countries.5 ROAA is a good overall
indicator for banking performance showing the ability of a bank to generate profits from the
assets at its disposal. Nonetheless, it has some disadvantages. The denominator does not
account for off balance sheet activities. ROAE is an alternative measure of profitability
designed to reflect the return to owners’ investment. Its main disadvantage is that the
denominator may vary across banks, due to the choices made by management as to the mix
between equity and debt capital as well as the total amount of capital held by a firm.6 On the
cost side of bank operations, the cost to income ratio reflects the ability of the bank to
generate revenue from its expenditures.7 The ratio of overheads on profit before tax ratio
gives similar information, but constitutes an improved check on costs.
Table 2 displays the mean performance of banking groups holding internet banks versus
mixed banks in the four countries being analysed. There is no statistically significant
difference between these two types of bank. Both deliver a positive return on assets and
equity. Only the UK internet banks perform substantially worse than the UK mixed banks. In
fact, the return on assets ratio is negative for internet banks, and the return on equity is about
half of that of mixed banks. Spanish and Finnish banks outperform the Italian and UK ones.
Spanish banks deliver a higher return on assets, while Finnish banks perform better with
respect to equity. Italian banks perform badly in comparison to their peers in the EU. Their
average return is about half of that of banks in the other countries. 4 We consider consolidated statements. Hence, internet banks are part of banking groups. Bankscope does not provide information on subsidiaries’ balance sheets. 5 “Average” means that the item is averaged using the arithmetic mean of the value at the end of year t and t-1. See Bankscope Ratio definitions. 6 These choices are basically conditioned by regulation. However, management has some margin to influence the bank structure.
Table 2 shows that cost-income ratios are comparable across all countries. Groups with
internet banks have similar costs relative to the income that their assets generate with the
exception of UK internet banks. The inferior return on assets of UK internet banks is due to
much higher costs. Whereas UK mixed banks manage to have a really low cost income ratio
in comparison to mixed banks in other countries, UK internet banks have a much higher ratio
as compared to their European peers. This indicates problems in their cost structure given the
revenues that the activity of the internet bank generates. The reasons for the difference
between UK and Continental banks could be various. For example, UK banks may pay higher
interest rates to clients in order to expand the deposit base. We will now examine some
structural differences across EU countries.
The four EU countries have a somewhat different financial market structure (Table 3). The
banking sector in Europe has been undergoing a consolidation process since the end of the
1990s and this has led to a decline in the number of credit institutions. This consolidation was
particularly pronounced in Italy and the UK (-6.6 and -8.6% respectively). On the other hand
in Finland, the banking system has remained stable as to the number of banks and branches.
These figures are the consequence of more numerous mergers and acquisitions in Italy and in
the UK. Spanish banks closed only two M&A deals in the same year, while there were none
in Finland (ECB, 2005). The ongoing consolidation of the EU banking sector may have
changed competitive conditions and led to the adoption of new business strategies and to the
use of the internet as an innovative delivery channel.
Despite consolidation, the number of branches in the EU has increased on average, as shown
in Table 3. It may suggest that internet websites, where adopted, have been a complement to
and not a substitute for physical branches. Whereas in Italy and Spain the number of branches
increases, the opposite tendency emerges in the UK (+5.7%, +4.1%, -3.8% respectively). One
may ask if the increase of branches has been followed by an increase in the number of
employees. The answer is mixed: the total number of employees has decreased in Italy and in
Finland, whereas it has increased slightly in Spain and in the UK. Nonetheless, the number of
employees per bank has increased in every country except Finland. Thus the reduction in the
number of banks seems not to be followed by a decrease in the number of branches and in the
number of employees per bank. One explanation could be the difficulty of cost cutting after
M&As in Europe, which may lead to excess capacity. Another view is that competitive
markets have boosted the level of employment. Finally, specialised financial services may 7 According to Bankscope definitions, cost to income is the ratio of overheads to operating income.
need higher qualified and better paid employees. The dense network of banks and ATMs as
well as the high number of employees rather suggest an overcapacity of distribution channels.
The internet could then be redundant in the delivery channel mix.8
Finally if we look at the size of banks in the four countries from 2001 to 2004, the growth rate
of total assets has been higher than the European average (17.5%), almost double in Spain and
Finland (37.6% and 30% respectively), 22.9% and 19.6% in Italy and in the UK. The latter
countries probably had a higher level of bank size on average in 2001, which could explain
their lower growth rate. As for the mix of products, both loans to non financial firms and for
housing purchase have been growing since 2001. In Spain and in Italy the mortgage sector
reveals the highest rate of growth (62.3% and 71.8%). This could be explained by the boom of
the real estate sector, by the particular focus on core activities, especially on retail, as well as
by cyclical developments such as low interest rate in the economic environment. However,
the internet can hardly be used as a substitute delivery channel for physical branches on loan
granting. Frequently websites provide reliable information on loan conditions and may help in
the customer acquiring phase. The final steps still require interaction with telephone and/or
physical branches.
Table 4 gives more insight into market structure and competition in the banking sector.
Finland is characterized by high concentration in the banking sector according to both the
Herfindahl index and the share of the five largest credit institutions in total banking sector
assets (C-5 ratio).9 Italy and the UK show a lower concentration than the European average in
both indicators. In Italy the low market concentration may be attributed to a dual banking
structure, with both commercial and cooperative banks. In the UK it may be due to the
presence of many foreign banks not directly providing retail services to residents.10 A
concentrated market structure does not necessarily have a negative impact on competition
(Martins et al., 1996; Nicoletti et al., 2000). It can be the consequence of economies of scale
and scope: larger players tend to be more efficient and cannot exploit market power. As to
foreign competitors, the UK seems to have the most open banking market with about half of
all banks being non-UK based. In Spain and Italy, the percentage of foreign banks in terms of
number of branches is about 20%, but in Finland about 5% only. Of course, this picture is
slightly distorted as (a) we measure the number of registered banks, and not the assets held by 8 However, it should be noted that less densely populated countries, like Finland, may need more branches to cover the same number of customers or a more complete mix of distribution channels to satisfy clients’ needs. 9 According to US competition authorities a number higher than 1800 indicates a concentrated market. 10 Thus the level of concentration of banking services to residents may be underestimated (ECB, 2005).
these banks; (b) we do not consider the attraction of the City as a financial centre; and (c) we
do not take into account service supply without the establishment of cross border subsidiaries.
The adoption of internet banking depends much on the technological capacity of using online
tools. Not all countries in our sample are at a similar level of technological advancement
(European Commission, 2005). Overall R&D expenditure gives an overall indication on the
level of scientific headway (Table 5). In this respect, Finland stands out above the UK, and
outpaces Italy and Spain by far. A similar order prevails in terms of the number of employees
involved in R&D activities,. The number of employees in R&D activities is relatively lower
in the business and government sector, whereas higher education institutions employ the
major share. In the banking sector, more investments are made on human resources in science
and technology than in most other economic sectors. Financial intermediation can be
considered as a knowledge-intensive sector in that respect.
Expenditure on communication technologies (installation of internet, broadband, etc.) is fairly
evenly spread across countries as are communication costs too. Local calls are only slightly
more expensive in the UK, but this is compensated by much cheaper national calls.
Broadband technologies are more widespread in Finland than in the other countries, however.
The largest difference across the countries derives from investment in information
technology. For both Italy and Spain, this is much lower as a share of GDP than in Finland or
the UK.
Even if the total expenditure on new technologies is fairly uniform, the extent to which new
communication technologies are used is quite different between the Northern and Southern
countries (Table 6). Access to computers, and to the internet, is much lower in Spain and
Italy. Use of the internet does not pose important security problems, such as fraudulent
payments or the abuse of privacy, and virus problems are relatively limited (with the
exception of Spain). Nonetheless, the security of the internet for carrying out transactions is
perceived as problematic in Spain and Finland, and it could possibly affect access to internet
based services. The use of online bank products is more widespread in Finland than in the
UK, and much more than in the Southern countries. Internet banking is predominantly used
for basic deposit-based transactions roughly to the same extent as for buying goods and
services. Specialised bank services are only a fraction of the total transactions carried out
online.
4. A COMPARATIVE ANALYSIS OF INTERNET BANKING
We first describe the characteristics of different banking groups with pure or mixed internet
banks, and analyse the effect of internet on the performance of both types of banks. We then
examine the effect of country-and technology specific characteristics on banking
performance.
4.1. A CLUSTER ANALYSIS
We examine whether there is a pattern in the performance of banks that choose different
online strategies. Using fuzzy cluster analysis, we look into various characteristics of banks -
various sets of performance and other bank specific features - to distinguish different groups
of banks. Fuzzy clustering is a simple descriptive technique to classify observations in groups
with other observations that show the greatest similarity. It is an innovative statistical tool
commonly used in pattern recognition techniques. Applications in economics have focussed
on grouping with similar business cycle movements (Artis and Zhang, 1998). It has been used
in financial literature, by Sörensen and Puigvert (2006) to examine the degree of financial
integration in the euro area banking industry, for example.
Let us assume we have a dataset of n objects, and each object is characterised by some p
variables denoted by Xn,p = {x1 , x2 , ..., xn }, where each xi = {xi1 , ..., xip }. The dissimilarity
for a certain variable p is given by the (Euclidean) distance between two objects.11 The total
distance between different objects on all p characteristics is then given by (1).
��
��p
kkjki xxjid
1
2)(),( (1)
The two observations that are most similar are classified in a first group. By repeating this
procedure on this group and the remaining n-1 objects, each object is eventually assigned to a
particular group according to its closeness to one of the most similar groups. The highest
coefficient indicates the group to which the unit n most likely belongs. The silhouette width
indicates the degree of similarity within a group of observations. A value close to one means
that the objects are well classified in the cluster. A value near zero indicates ambiguity in 11 Each variable is standardised with mean zero and standard deviation one in order to treat them as having equal importance in determining the structure.

deciding which cluster the object might belong to. We select the optimal number of groups as
the one that gives the highest average silhouette width. The normalized Dunn’s partition
coe�cient indicates the existence of a partition in the structure of the panel, varying between
0 (complete fuzziness of the data) and 1 (well-partitioned data). Cluster analysis has some
limitations. It may be difficult to determine (a) the correct number of clusters, and (2) whether
the clusters formed from the data significantly represent different groupings or are random
concentrations of observations within an original distribution (Hair et al., 1998).
The primary goal of the analysis is to identify clusters among banks in the sample and find out
if pure and mixed internet banks belong to two different groups. This would mean the
existence of some common development of internet banks regardless of country or other
bank-specific features. Cross country differences and other relevant variables (mix of
products, type of client, etc.) might play an important role too, and this could mask clear
classification.
We group banks according to each of the four performance criteria (ROAA, ROAE, cost to
income and overhead to profit before tax ratio) discussed in section 3, and some other bank-
specific features. These bank features focus on both revenues and the costs side of the bank
balance. Deposits to total assets ratio (DEP) refers to the amount of deposits and short term
funding (excluding bank to bank deposits). Usually, the wider the deposit base, the higher
revenues are. Pure internet banks should have a higher ratio, since they need to reach a
broader customer base to survive. Non-interest income to net operating revenue (NII) is an
approximation for the amount of revenues generated by “non-traditional banking activity”.
The variable is expected to be significant and positively related to performance. Risk profile is
provided by loan-loss provision to net interest revenue (LOAN), which shows the extent to
which the bank has made provisions to cover credit losses. The higher this ratio, the larger the
amount of expected bad loans on the books, and the higher are the risks for the bank. Pure
internet banks should have a lower ratio than multi-channel banks since they do not usually
provide loans to customers.12
As to cost related variables, pure online banks should have lower labor expenses (LAB)
compared to multi-channel banks. We expect a significantly negative relationship due to the
fact that if expenses increase, profitability decreases on average. A substitution effect may 12 The success of online banking also depends on the characteristics of financial products offered in each market. For example, online banks are not able to provide mortgages as the client-bank relationship remains crucial in this case.
nonetheless be present. If banks employ more highly skilled workers to develop IT services,
labour costs increase even if the number of employees decreases. Non-interest costs (EXP)
are taken as an approximation for IT and marketing expenses. One of the reasons for
implementing web-based services is cost reduction, which should lead to higher performance.
Pure online banks should have lower expenses than multi - channel banks. Nevertheless, costs
could be higher after adopting the internet as a new distribution channel because of higher IT
expenses in the short run. We scale both variables to total bank assets.
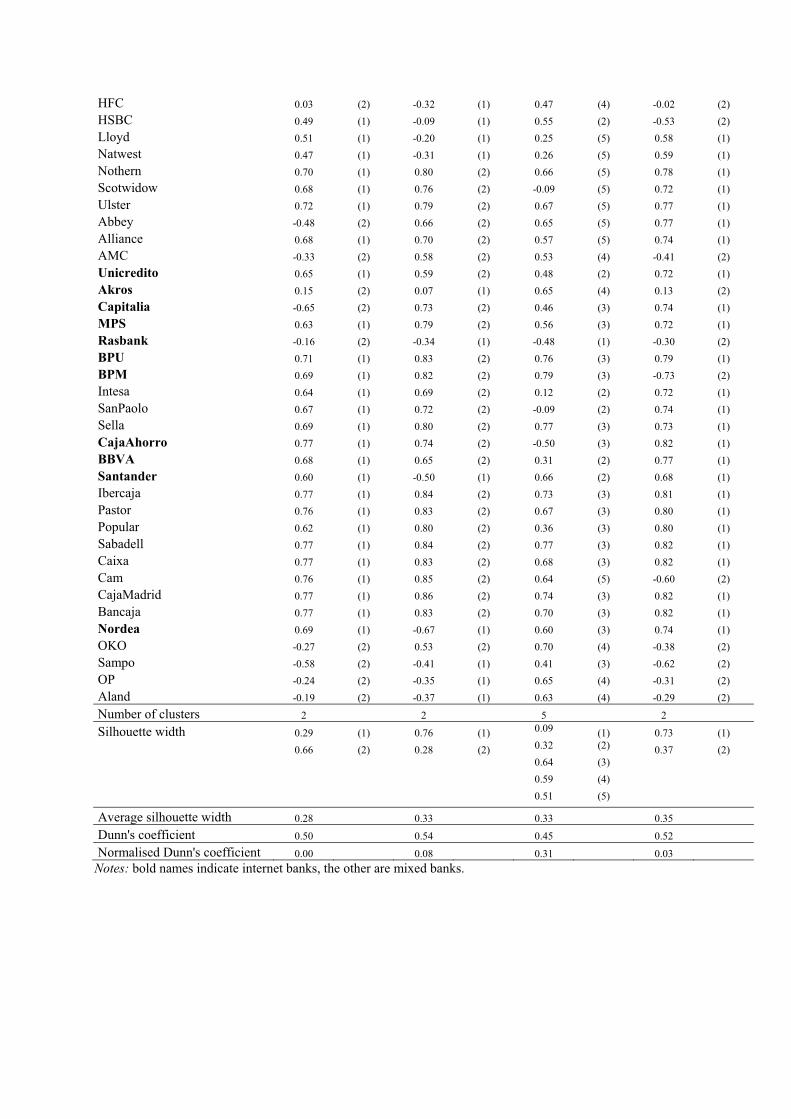
All data are taken from Bankscope; Table 7 summarises the variables we use. We apply the
cluster analysis to the year 2004, for which we have the most complete set of data for the four
different performance criteria and the bank specific criteria. If we consider ROAA, ROAE
and the overheads to profit ratio, we find that the observations can be optimally grouped in
two different clusters (Table 8). These clusters are not clearly associated with a distinction
between internet and mixed bank groups. Most of the banks classified in cluster 2 are indeed
internet banks, but there are a few mixed banks that belong to this group as well. Conversely,
there are also internet banks that belong to the other group. Furthermore, the distinction
between the two groups is not very strong. Banks in group 2 are often on the border of being
in the first group. The silhouette width indicates some banks are misclassified when we use
the ROAA or the overhead/profit ratio. As a consequence, average silhouette width is low.
The ambiguity in the classification is also indicated by the low normalised Dunn coefficient.
These results are slightly modified when we employ the cost income ratio. The data are
optimally divided into five different groups. There seems to be a classification of banks
according to country basis. Nearly all Finnish banks belong to cluster 4; many UK based
banks form part of cluster 5; and most Italian and Spanish banks are located in group 3 (and
often in group 2 too). But these are not exclusive sets. A few individual banks are often
classified in different groups. Internet banks belong to each of these different groups, but are
not specific enough to be identified as a separate group.13 The silhouette width indicates that
each of the groups is quite well defined, and so is the overall classification of the five sets of
banks. Generally speaking the result indicates that some latent country-specific characteristics
are important determinants in bank performance. The distinction between internet and mixed 13 RasBank constitutes a group by itself. RasBank is part of a financial group held by an insurance company thus differing from other banks that belong to financial bank groups. Similar cases are Egg, which is owned by Prudential, and StandardLife. Few data were available for these banks. Nonetheless, in the case of ROAA, Egg belongs to the same cluster as RasBank; in addition, StandardLife belongs to cluster 2 in two out of four variables tested, confirming the particular featuresof these three IBs.
banks seems of secondary importance. Therefore the country specific features we are going to
add should help to better describe a bank’s business models.
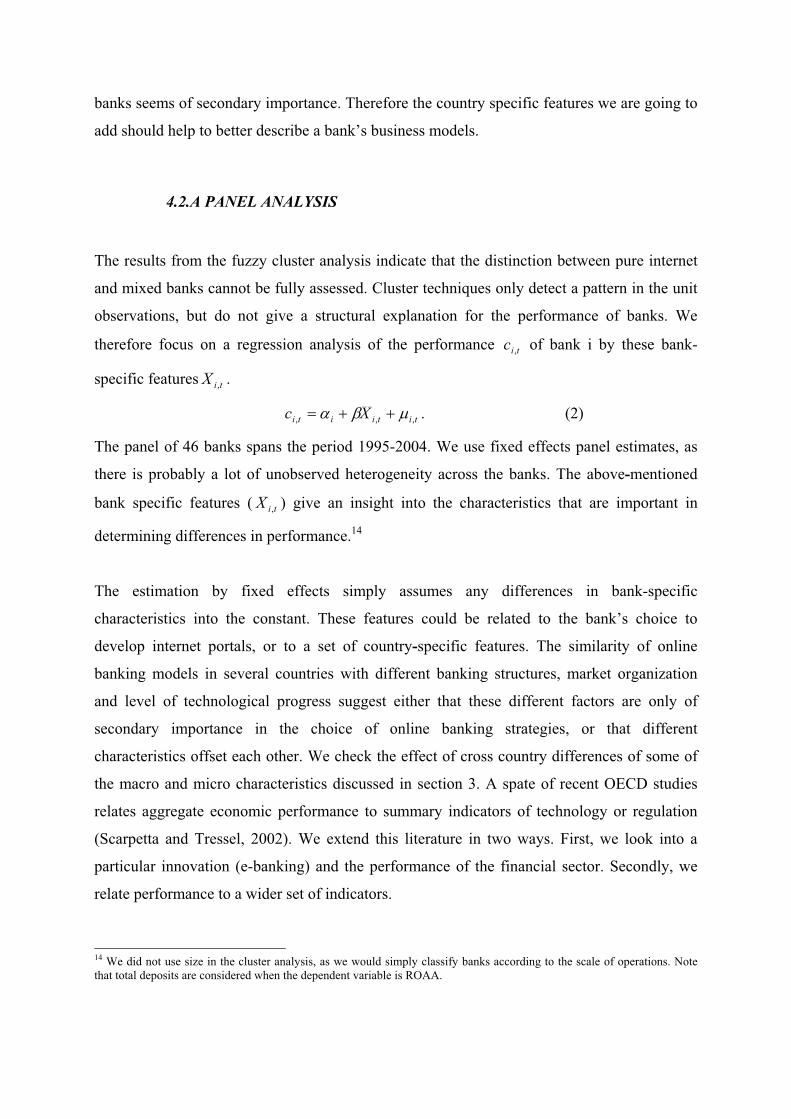
4.2.A PANEL ANALYSIS
The results from the fuzzy cluster analysis indicate that the distinction between pure internet
and mixed banks cannot be fully assessed. Cluster techniques only detect a pattern in the unit
observations, but do not give a structural explanation for the performance of banks. We
therefore focus on a regression analysis of the performance tic , of bank i by these bank-
specific features tiX , .
titiiti Xc ,,, ��� ��� . (2)
The panel of 46 banks spans the period 1995-2004. We use fixed effects panel estimates, as
there is probably a lot of unobserved heterogeneity across the banks. The above-mentioned
bank specific features ( tiX , ) give an insight into the characteristics that are important in
determining differences in performance.14
The estimation by fixed effects simply assumes any differences in bank-specific
characteristics into the constant. These features could be related to the bank’s choice to
develop internet portals, or to a set of country-specific features. The similarity of online
banking models in several countries with different banking structures, market organization
and level of technological progress suggest either that these different factors are only of
secondary importance in the choice of online banking strategies, or that different
characteristics offset each other. We check the effect of cross country differences of some of
the macro and micro characteristics discussed in section 3. A spate of recent OECD studies
relates aggregate economic performance to summary indicators of technology or regulation
(Scarpetta and Tressel, 2002). We extend this literature in two ways. First, we look into a
particular innovation (e-banking) and the performance of the financial sector. Secondly, we
relate performance to a wider set of indicators.
14 We did not use size in the cluster analysis, as we would simply classify banks according to the scale of operations. Note that total deposits are considered when the dependent variable is ROAA.
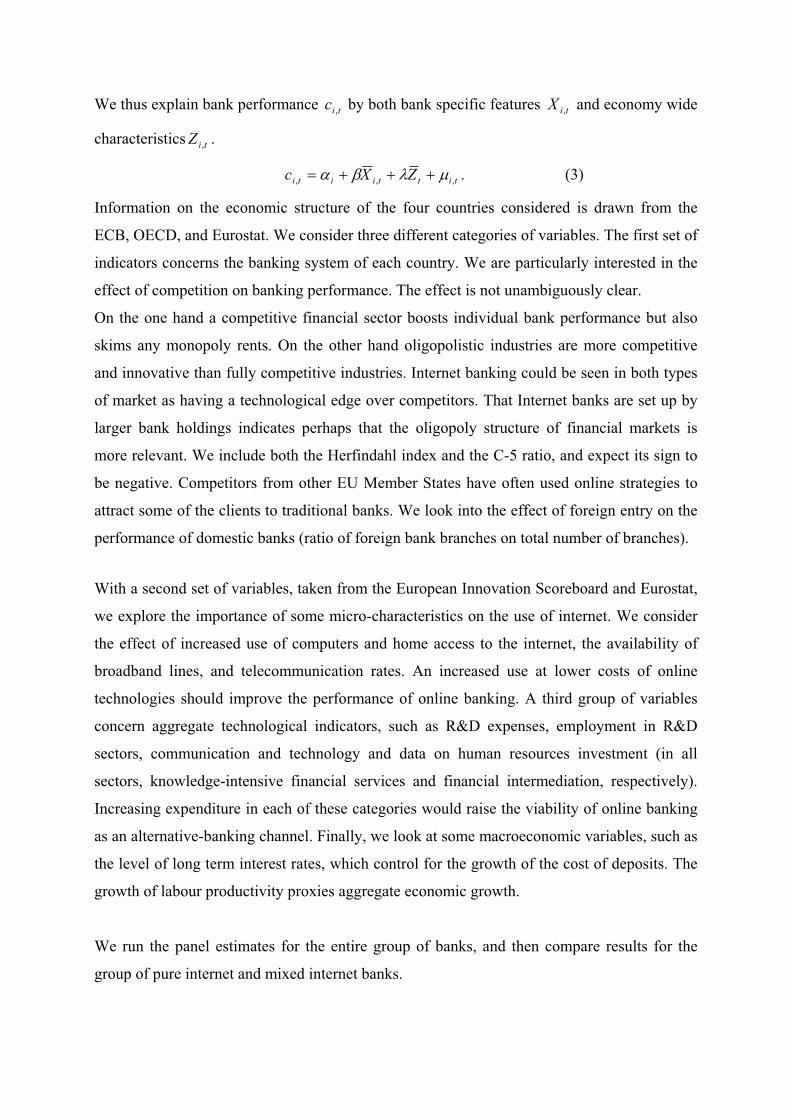
We thus explain bank performance tic , by both bank specific features tiX , and economy wide
characteristics tiZ , .
tittiiti ZXc ,,, ��� ���� . (3)
Information on the economic structure of the four countries considered is drawn from the
ECB, OECD, and Eurostat. We consider three different categories of variables. The first set of
indicators concerns the banking system of each country. We are particularly interested in the
effect of competition on banking performance. The effect is not unambiguously clear.
On the one hand a competitive financial sector boosts individual bank performance but also
skims any monopoly rents. On the other hand oligopolistic industries are more competitive
and innovative than fully competitive industries. Internet banking could be seen in both types
of market as having a technological edge over competitors. That Internet banks are set up by
larger bank holdings indicates perhaps that the oligopoly structure of financial markets is
more relevant. We include both the Herfindahl index and the C-5 ratio, and expect its sign to
be negative. Competitors from other EU Member States have often used online strategies to
attract some of the clients to traditional banks. We look into the effect of foreign entry on the
performance of domestic banks (ratio of foreign bank branches on total number of branches).
With a second set of variables, taken from the European Innovation Scoreboard and Eurostat,
we explore the importance of some micro-characteristics on the use of internet. We consider
the effect of increased use of computers and home access to the internet, the availability of
broadband lines, and telecommunication rates. An increased use at lower costs of online
technologies should improve the performance of online banking. A third group of variables
concern aggregate technological indicators, such as R&D expenses, employment in R&D
sectors, communication and technology and data on human resources investment (in all
sectors, knowledge-intensive financial services and financial intermediation, respectively).
Increasing expenditure in each of these categories would raise the viability of online banking
as an alternative-banking channel. Finally, we look at some macroeconomic variables, such as
the level of long term interest rates, which control for the growth of the cost of deposits. The
growth of labour productivity proxies aggregate economic growth.
We run the panel estimates for the entire group of banks, and then compare results for the
group of pure internet and mixed internet banks.
4.3. RESULTS
Table 9a displays the results of the fixed effects estimates for the entire panel of banks, and
when the return on average assets and equity are taken as dependent variables, for internet and
mixed banks separately. Table 9b does the same for the cost to income ratio and the
overhead/profit ratio. The results on the cost income ratio and the overheads/profit ratio
confirm most results for the performance criteria. As these variables are related to costs, the
coefficients obviously switch signs.
Let us first consider some aspects of the revenue side of banks’ balance sheets. A larger
fraction of deposits – relative to total assets – does not improve the performance of banks. A
separate estimation for the panel of internet banks does not show a positive effect; but neither
does it for the group of mixed banks. We find a similar result if we take the return on equity
as the performance criterion. Banks seem to earn fewer profits on basic intermediation. At the
same time, more deposits do not entail higher costs for the income they generate in mixed
banks. In contrast, internet banks have trouble in keeping under control the costs of additional
clients with deposit accounts. This would be a rather worrying development, as the handling
of deposit accounts constitutes the core activity of internet banks. The main source of
revenues for internet banks is interests generated by deposit-based products. An extension of
the customer base to clients only via deposits seems not a very profitable strategy. As the core
of banking revenues is nowadays generated by other operating income, a pure internet
banking model does not seem feasible in the long run from this point of view.
If an online bank is to prove profitable it would appear necessary for it to address itself
towards more rewarding activities, to support other bank products or reduce fixed costs on
deposit accounts. As anticipated, non-interest income is an important factor in
driving/promoting a bank’s performance. Whether we measure performance in terms of return
on average assets or on equity, there is always a significant positive impact on performance.
Curiously, this effect can be entirely attributed to internet banks. This may seem a bit
counterintuitive as internet banks mainly handle deposit-based products. However, groups
that encompass internet banks probably perform better on average than other groups that use
the web as a mere delivery channel. Possibly banking groups that have set up internet banks
(a) are more advanced in their management, keeping an eye on client needs and being able
rapidly to adapt to them; (b) have at their disposal other resources from activities not related
to intermediation, which makes it possible to invest in internet banking technologies; (c) are

able to acquire new clients via internet bank and exploit synergies with internet banks to
attract more clients that stream into activities with higher value (cross selling of products). As
the effect of non-interest income is to raise the cost to income ratio, these three different
rationales may be relevant.
Higher provisions for loans - relative to total outstanding loans - improve the performance of
banks. This effect is positive and significant for all types of banks, but it is especially so for
mixed banks. Since higher provisions shrink(s) the asset base for additional loans, this would
reduce the performance of bank activities. However, banks issue loans at a decreasing
marginal rate. A rationale for the positive effect of loan provision clauses is that setting aside
a fraction of loans effectively protects banks against granting loans of bad quality and
partially prevents banks from incurring losses. Internet banks do not directly engage in loan
activities, but may contribute to cross sell them. Websites are a powerful and interactive way
to give information on various products (e.g. personal loans, mortgages). Pure online banks
may then direct clients to the bank holding to complete the transaction. Besides, the
information collected online may help banks to reduce credit risk exposure, since current
account movements, money transfers and payments are currently tracked. This information
may be an early warning on clients’ repayment capacity. The effect of loan provisions on
performance for the entire group suggests that the creation of an internet bank seems to be
more likely if there is a large share of intermediation activities. Banking groups with few loan
activities may consider internet banks as a means of reducing costs on standard transactions.
We then consider some cost related variables. A rather surprising finding is the positive sign
on labour costs. Higher expenses on personnel – relative to total assets – would lead to higher
performance and reduce costs. This effect is significant for banking groups with no internet
subsidiary. Hence, internet banking groups seem to perform better in terms of personnel
management than other banks. The latter do not exploit all opportunities to assign staff to
highly specialised activities. Internet banks seem to be more successful in the substitution of
low with highly skilled workers. This interpretation is endorsed by the significantly negative
effect of other operating expenses on performance. The effect of other non-personnel related
costs on performance is much larger for mixed banks than for internet banks. The former may
have higher expenses on IT, marketing, and new products development, start-up costs, but
even a small reduction in these overheads would considerably improve performance.
Finally, if we consider the scale of bank operations we find evidence in favour of economies
of scale. The larger the bank, the better is performance. This effect is slightly more
pronounced for internet banks. An increase of total assets by 1% would increase the return on
assets by 1.16% for internet banks, and 1.13% for mixed banks. Further increasing assets
could be even more rewarding for internet banks in terms of return to equity. The result,
which is consistent with De Young’s (2005) findings on internet bank size, might be
explained by the specific features of online banking. Since its major activity is based on
deposits and their related products, an increase in size would lead to higher revenues.
Regarding costs, once the IT platform is set and the basic system is working, personnel and
other expenses increase less proportionately as the dimension of the bank increases. We do
not find a significant impact of scale on the cost/income ratio, however. This may be due to
the relatively small size of internet banks as compared to the overall banking group. A cost
reduction in the internet bank may not be large enough to affect the balance sheet of the group
as a whole.
The explanatory power of the model for both internet and mixed banks is in line with previous
studies. However, we have presumably omitted some other explanatory factors behind bank
performance in the four EU countries. We can usually reject that the fixed effects of each
model are irrelevant, except if we use the overheads/profit ratio. The fixed effects model is
not entirely satisfactory in some other aspects too. There is still a significant (negative)
correlation between the fixed effects and the explanatory variables left.
These baseline results still hold good if we add various economy-wide characteristics tiZ , . In
order not to burden the evidence with additional tables, we summarize here the effect of these
characteristics on bank performance.15 First, competition in the banking sector affects only
slightly the performance or cost structure of banks. We do not find a significant impact of the
Herfindahl index on return or costs. However, we find that a larger market share of major
banks reduces the profitability of mixed banks. We may read this finding in two different
ways. On the one hand, higher concentration is associated with more competition as it reduces
profits. On the other hand, high concentration may give rise to inadequate incentives to be
cost-efficient, hence reducing profitability too. As we examine both returns and cost income
ratios, we can distinguish these two different models. For mixed banks, more competition 15 Detailed results are available from the authors on request.

does not reduce costs. Hence, mixed banks do not seem completely cost-efficient and there
may be little pressure from competitors. One explanation may be that mixed banks in
concentrated markets probably need to deliver higher quality services over a broader range of
clients at higher costs. In contrast, for internet banks, high market power in the banking sector
reduces the cost to income ratio but does not have an impact on returns. This indicates that
banking groups with pure internet branches are more able to compete and are more cost
effective, as they can expand their services in a more competitive market at lower cost. There
seem to be somewhat diverse effects in different countries. For example, in the case of
Finland there is a high degree of concentration which might account for the high profitability
of banks. On the other hand, concentration is very low in the UK, and yet profitability is
comparatively high. However, the concentration in the UK banking market is peculiar
because of the role of London as a financial centre. Nonetheless, foreign entry, as measured
by the ratio of foreign bank branches on the total number of branches, does not have an
impact at all. Note that we did not consider the effect of entry of foreign pure internet banks
on the domestic market.
Secondly, as to internet-related activities, an increase in the percentage of households with
home access to internet improves the return for all banks, but reduces costs for internet banks
only. Increased internet access enhances the chance of profitable contact to new clients(,) and
thus boosts the scale of the potential market for internet banks. Each new access represents a
possible cost reduction for online banks, since for example, IT and start up costs are
distributed over a larger base of clients. This allows a substitution effect among physical and
internet branches, since some transactions, originally only carried out at the bank, are now
available online at home 24 hours a day. Nonetheless new clients accessing the website may
entail higher personnel expenses for mixed banks.16 The use of personal computers as such
does not increase returns for internet banks, albeit it does for mixed banks. It contributes to
higher costs for internet banks, however. A higher broadband penetration rate has similar
positive effects for all banks, but also decreases costs for all banks. Curiously, higher prices of
local telephone calls increase the returns to banks. More costly national calls reduce the cost-
income ratios of internet banks, however. The high cost of calls and broadband penetration,
which increases internet speed, may lead to a substitution among communication tools.
Broadband allows more functionality at cheaper cost per unit at a higher speed. The next step 16 It may depend on the size of the market and on the number of new clients. Nonetheless, new clients acquired by a mixed bank via website would presumably be targeted by other products, such as loans, mortgages and so on, which require face to face relationship.
could be fast access to online current accounts. Potential clients may start considering
personal computers not simply as a working instrument but also for banking activities.
Other technology-related features at the macro economic level have a clear-cut implication.
Spending on R&D employment in the economy as a whole or in the financial services sector
has positive effects on the return to assets or equity of mixed banks, and reduces their cost-
income ratios. Internet banks do not seem to reap any particular competitive advantages from
R&D spending. The effect seems spread out among all banks, showing a generalized benefit
from these investments. Expenditure on information technology as a share of GDP does not
lead to higher performance in the banking sector. On the contrary, it reduces returns as it
boosts costs. However, outlay on communication technologies pays off for both internet and
mixed banks. Macroeconomic variables have little to no impact. Higher long-term interest
rates decrease the return to assets of internet banks without increasing their cost to income
ratio. The growth of labor productivity has limited impact on the costs of mixed banks.
5. CONCLUSION
We compare the performance of different online banking models over the period 1995-2004
in Finland, Spain, Italy and the UK. Groups with internet banks are not performing worse in
terms of average returns to assets (or equity), and do not seem to run higher operational costs
for the little income they generate. From the fuzzy cluster analysis we found that internet
banks are hard to distinguish from banks that adopt both click and mortar strategies. Country-
specific features appear to be more important in explaining differences across banks. We
therefore explain the performance of banks by a group of selected bank-specific features, but
also add country-specific macroeconomic indicators and information technology related
ratios. We find that the strategy of banking groups to incorporate internet banks reflects some
competitive edge that these banks have in their business models. The management of these
banks is generally more capable of handling personnel and other costs. The strategy of
banking groups to incorporate internet banks reflects some competitive edge in their business
models. Personnel expenses are comparatively low, but the costs for IT are disproportionately
high. Management has become more aware of the possibilities of online banking. The success
of internet banking depends on the structure of clients’ deposits. By focussing mostly on bank
deposits, these banks cannot gain benefits from more rewarding banking activities. Clients
interested in value added products still prefer interaction with a physical branch. Internet
banks need to reach a minimum dimension in order to become profitable. Nonetheless, the
fact that internet banks have been started up with the support of larger bank holdings, shows
that pure internet banks are not as profitable as a simple cost/revenue comparison would
suggest.
The adoption of online banking as a product or process innovation is largely driven by factors
external to the banking industry. The percentage of households with access to internet at
home, a higher broadband penetration rate, and higher outlay on R&D employment are all
factors positively influencing internet bank performance. But this technology effect should
not be overrated: these effects are as important for traditional banks as for internet banks.
Increasing competition does not have an immediate impact on bank performance. Yet, the
creation of internet banks may be a sign of more competitive banking markets, and their
existence will probably increase transparency and product range. Clients oriented to cheap
and quick deposit accounts would probably prefer internet banks. Hence, internet banks may
cause innovation in the banking sector, and serve as learning experience for mixed banks in
terms of technology. In interpreting the data we should keep in mind that internet banks are
not widespread, and make up only a tenth of the overall banking market. We should expect
that the impact of internet banks may not be strong enough to affect the banking system as a
whole. However, internet banks certainly contribute to increase transparency on specific
products, like current accounts, allowing for comparisons among banks that were previously
more difficult.
REFERENCES
Artis, M. and Zhang, W., (1998) “Business cycles, exchange rate regimes and the ERM: is there a European business cycle?”, International Journal of Finance and Economics, vol. 2, pp. 1-16.
Birch D., Young M. (1997) “Financial services and the internet-what does the cyberspace mean for the financial services industry?”, Internet Research: Electronic Networking Applications and Policy, vol.7, n.2, pp. 120-128.
DeYoung R. (2001) “The financial performance of pure play internet banks”, Federal Reserve Bank of Chicago Economic Perspectives 25, n.1, pp. 60-75.
DeYoung R. (2005) “The performance of internet-based business models: evidence from the banking industry”, Journal of Business, vol.78, n.3, pp. 893-947.
DeYoung R. (2006) “The limits of information technology: how much will the banking industry change?”, in “Technology driven efficiencies in financial markets”, Heikkinen P., Korhonen K. (eds), pp. 35-46.
ECB (2004) “Outsourcing in the EU banking sector”, Report on EU Banking Structures, November, pp. 25-32.
ECB (2005) “EU Banking Structures”, October.
European Commission (2005) “Towards a European Research Area. Science, Technology and Innovation. Key Figures 2005”, Directorate General for Research.
Furst K., Lang W.W., Nolle D. E. (2000) “Special studies on technology and banking. Who offers internet banking”, Quarterly Journal, vol.19, n.2, pp. 29-48.
Furst K., Lang W.W., Nolle D. E. (2002) “Internet banking: developments and prospects”, Program on Information Resources Policy, Center for Information Policy Research, Harvard University, April.
Gondat-Larralde C., Nier E. (2004) “The economics of retail banking-an empirical analysis of the UK market for personal current accounts”, Bank of England Quarterly Bulletin, spring, pp. 153-159.
Hasan I., Zazzara C. and Ciciretti R. (2005) “Internet, innovation and performance of banks: Italian experience”, unpublished manuscript.
Hair, J., Anderson R. , Tatham, R., Black W. (1998), “Multivariate Data Analysis”, Fifth Edition, Prentice Hall.
Hernando I., Nieto M. (2006) “Is the internet delivery channel changing banks’ performance? The case of Spanish banks”, Working Paper n.0624, Banco de Espana.
Jayawardhena C., Foley P. (2000) “Changes in the banking sector-the case of internet banking in the UK”, Internet Research: Electronic Networking Applications and Policy, vol.10, n.1, pp. 19-30.
Llewellyn D.T. (2001) “Technology and the new economics of retail financial services”, The Annual Building Societies Association Lecture, Extended version, London, September.
Martins, J. O., Scarpetta, S. and Pilat, D. (1996) “Mark-up ratios in manufacturing industries: Estimates for 14 OECD countries”, OECD Economics Department Working Papers, n. 162.
Nicoletti, G., S. Scarpetta and O. Boylaud (2000) “Summary indicators of product market regulation with an extension to employment protection legislation”, OECD Economics Department Working Papers, n. 226.
Scarpetta S. and Tressel T. (2002) “Productivity and Convergence in a Panel of OECD Industries: Do Regulations and Institutions Matter?”, OECD Economics Department working paper, n. 342.
Sörensen C. and Puigvert, J., (2006) ‘Euro Area banking sector integration using hierarchic al cluster analysis techniques’, ECB working paper, n. 627.
Sullivan R.J. (2000) “How has the adoption of internet banking affected performance and risk at banks? A look at internet banking in the tenth Federal Reserve district”, Federal Reserve Bank of Kansas City Financial Industry Perspectives, December, pp. 1-16.
TABLES
Table 1. Traditional and online banks in four EU countries.
Spain Finland Italy UK Stand-aloneinternet banks - eQ bank - -
Pure internet banks (in group)
Caixa Catalunya (Banco de Europa)
Nordea (Luottokunta)
Unicredit (Xelion)
HBOS (Capital Bank)
BBVA(Uno e-bank)
MPS(Banca 121)
Cooperative (Smile)
BSCH(Open Bank)
Capitalia (Fineco)
RBS(Coutts)
BPU(Banca Akros, IW Bank)
Prudential (Egg)*
BPM(Webank)
Standard Life (Standard Life)*
Gruppo Ras (Rasbank)*
Mixed banks/banking groups
CajaAhorro OP Cooperative Unicredit Barclays Ibercaja
OKO Intesa Bradford & Bingley
Pastor Monte dei Paschi Alliance & Leicester Bancaja Sampo San Paolo Bank of Scotland Popular Alandsbanken Sella Halifax Sabadell HSBC BBVA Lloyds TSB La Caixa Natwest Caja de Ahorros del Mediterraneo Northern Rock
CajaMadrid Scottish Widows Abbey National Ulster HFC Cheltenham AMC
Note: * indicates financial groups held by insurance companies.
Table 2. Statistics on four performance criteria of pure and mixed internet banks.
Spain Finland Italy UK criterion Return on average asset (ROAA) mixed banks 0.95 0.83 0.48 0.90
internet banks 0.91 0.93 0.51 -0.22
criterion Return on average equity (ROAE) mixed banks 13.91 14.24 9.59 17.83 internet banks 13.99 16.44 8.86 8.86 criterion Cost income ratio (CI) mixed banks 57.20 61.11 70.95 45.58
internet banks 60.53 54.13 71.57 94.41
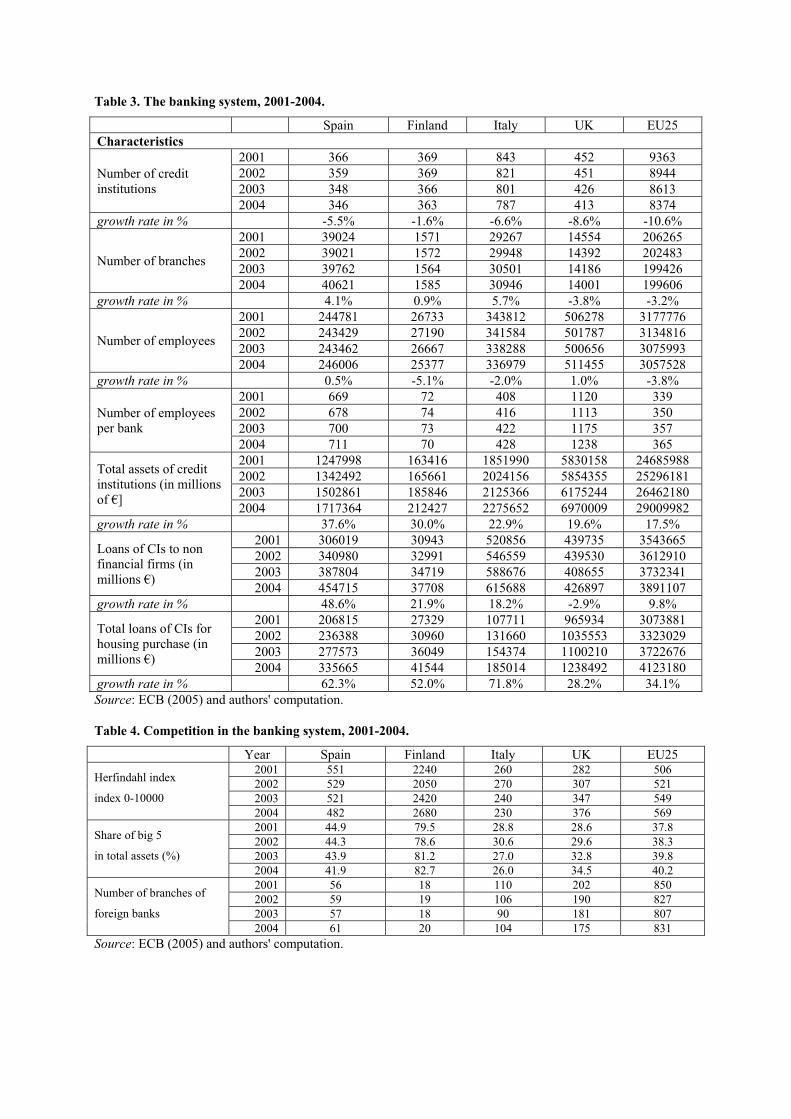
Table 3. The banking system, 2001-2004.
Spain Finland Italy UK EU25 Characteristics
Number of credit institutions
2001 366 369 843 452 9363 2002 359 369 821 451 8944 2003 348 366 801 426 8613 2004 346 363 787 413 8374
growth rate in % -5.5% -1.6% -6.6% -8.6% -10.6%
Number of branches
2001 39024 1571 29267 14554 206265 2002 39021 1572 29948 14392 202483 2003 39762 1564 30501 14186 199426 2004 40621 1585 30946 14001 199606
growth rate in % 4.1% 0.9% 5.7% -3.8% -3.2%
Number of employees
2001 244781 26733 343812 506278 3177776 2002 243429 27190 341584 501787 3134816 2003 243462 26667 338288 500656 3075993 2004 246006 25377 336979 511455 3057528
growth rate in % 0.5% -5.1% -2.0% 1.0% -3.8%
Number of employees per bank
2001 669 72 408 1120 339 2002 678 74 416 1113 350 2003 700 73 422 1175 357 2004 711 70 428 1238 365
Total assets of credit institutions (in millions of €]
2001 1247998 163416 1851990 5830158 24685988 2002 1342492 165661 2024156 5854355 25296181 2003 1502861 185846 2125366 6175244 26462180 2004 1717364 212427 2275652 6970009 29009982
growth rate in % 37.6% 30.0% 22.9% 19.6% 17.5%
Loans of CIs to non financial firms (in millions €)
2001 306019 30943 520856 439735 3543665 2002 340980 32991 546559 439530 3612910 2003 387804 34719 588676 408655 3732341 2004 454715 37708 615688 426897 3891107
growth rate in % 48.6% 21.9% 18.2% -2.9% 9.8%
Total loans of CIs for housing purchase (in millions €)
2001 206815 27329 107711 965934 3073881 2002 236388 30960 131660 1035553 3323029 2003 277573 36049 154374 1100210 3722676 2004 335665 41544 185014 1238492 4123180
growth rate in % 62.3% 52.0% 71.8% 28.2% 34.1% Source: ECB (2005) and authors' computation.
Table 4. Competition in the banking system, 2001-2004.
Year Spain Finland Italy UK EU25
Herfindahl index
index 0-10000
2001 551 2240 260 282 506 2002 529 2050 270 307 521 2003 521 2420 240 347 549 2004 482 2680 230 376 569
Share of big 5
in total assets (%)
2001 44.9 79.5 28.8 28.6 37.8 2002 44.3 78.6 30.6 29.6 38.3 2003 43.9 81.2 27.0 32.8 39.8 2004 41.9 82.7 26.0 34.5 40.2
Number of branches of
foreign banks
2001 56 18 110 202 850 2002 59 19 106 190 827 2003 57 18 90 181 807 2004 61 20 104 175 831
Source: ECB (2005) and authors' computation.
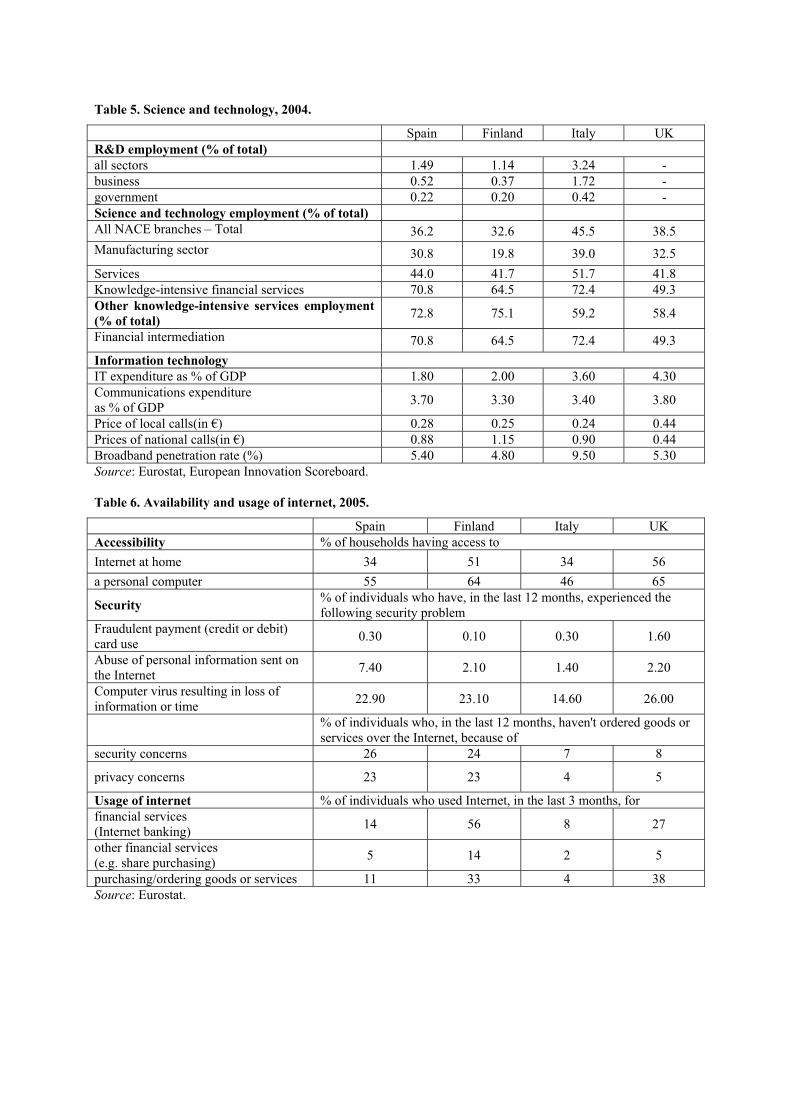
Table 5. Science and technology, 2004.
Spain Finland Italy UK R&D employment (% of total) all sectors 1.49 1.14 3.24 - business 0.52 0.37 1.72 - government 0.22 0.20 0.42 - Science and technology employment (% of total) All NACE branches – Total 36.2 32.6 45.5 38.5 Manufacturing sector 30.8 19.8 39.0 32.5 Services 44.0 41.7 51.7 41.8 Knowledge-intensive financial services 70.8 64.5 72.4 49.3 Other knowledge-intensive services employment (% of total) 72.8 75.1 59.2 58.4
Financial intermediation 70.8 64.5 72.4 49.3 Information technology IT expenditure as % of GDP 1.80 2.00 3.60 4.30 Communications expenditure as % of GDP 3.70 3.30 3.40 3.80
Price of local calls(in €) 0.28 0.25 0.24 0.44 Prices of national calls(in €) 0.88 1.15 0.90 0.44 Broadband penetration rate (%) 5.40 4.80 9.50 5.30 Source: Eurostat, European Innovation Scoreboard.
Table 6. Availability and usage of internet, 2005.
Spain Finland Italy UK Accessibility % of households having access to Internet at home 34 51 34 56 a personal computer 55 64 46 65
Security % of individuals who have, in the last 12 months, experienced the following security problem
Fraudulent payment (credit or debit) card use 0.30 0.10 0.30 1.60
Abuse of personal information sent on the Internet 7.40 2.10 1.40 2.20
Computer virus resulting in loss of information or time 22.90 23.10 14.60 26.00
% of individuals who, in the last 12 months, haven't ordered goods or services over the Internet, because of
security concerns 26 24 7 8
privacy concerns 23 23 4 5
Usage of internet % of individuals who used Internet, in the last 3 months, for financial services (Internet banking) 14 56 8 27
other financial services (e.g. share purchasing) 5 14 2 5
purchasing/ordering goods or services 11 33 4 38 Source: Eurostat.
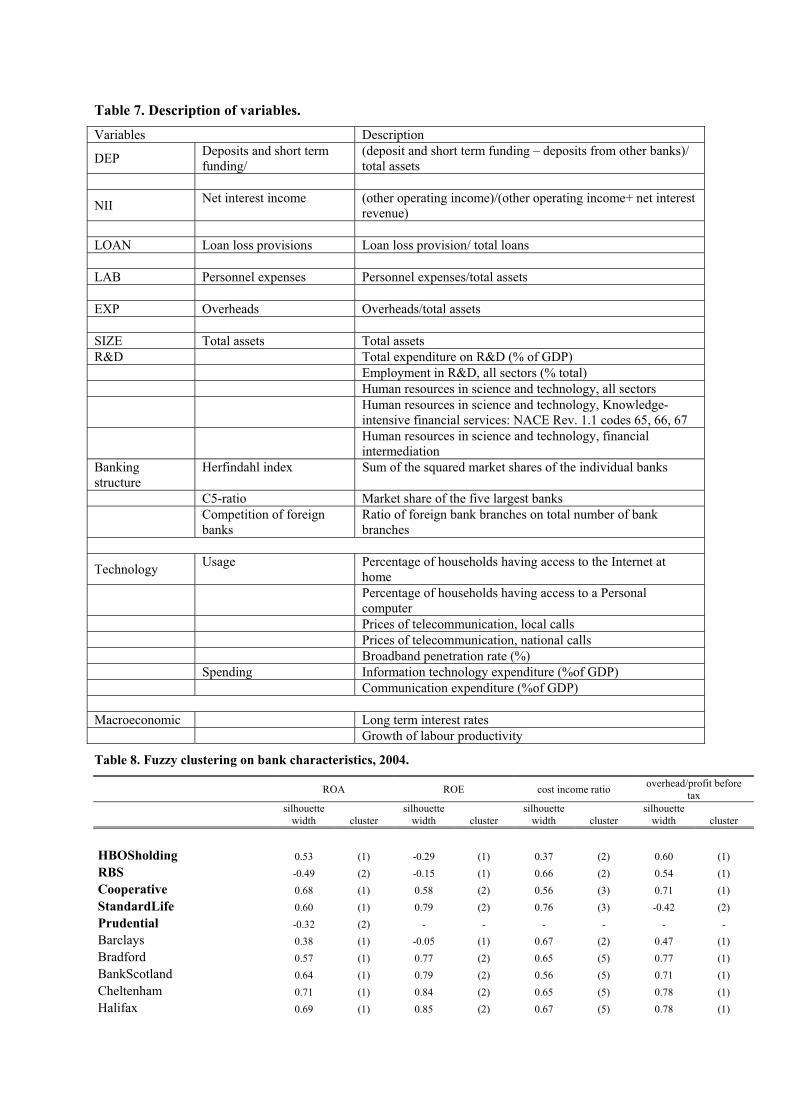
Table 7. Description of variables. Variables Description
DEP Deposits and short term funding/
(deposit and short term funding – deposits from other banks)/ total assets
NII Net interest income (other operating income)/(other operating income+ net interest revenue)
LOAN Loan loss provisions Loan loss provision/ total loans LAB Personnel expenses Personnel expenses/total assets EXP Overheads Overheads/total assets SIZE Total assets Total assets R&D Total expenditure on R&D (% of GDP) Employment in R&D, all sectors (% total) Human resources in science and technology, all sectors
Human resources in science and technology, Knowledge-intensive financial services: NACE Rev. 1.1 codes 65, 66, 67
Human resources in science and technology, financial intermediation
Banking structure
Herfindahl index Sum of the squared market shares of the individual banks
C5-ratio Market share of the five largest banks Competition of foreign banks
Ratio of foreign bank branches on total number of bank branches
Technology Usage Percentage of households having access to the Internet at home
Percentage of households having access to a Personal computer
Prices of telecommunication, local calls Prices of telecommunication, national calls Broadband penetration rate (%) Spending Information technology expenditure (%of GDP) Communication expenditure (%of GDP)
Macroeconomic Long term interest rates Growth of labour productivity
Table 8. Fuzzy clustering on bank characteristics, 2004.
ROA ROE cost income ratio overhead/profit before tax
silhouettewidth cluster
silhouettewidth cluster
silhouettewidth cluster
silhouettewidth cluster
HBOSholding 0.53 (1) -0.29 (1) 0.37 (2) 0.60 (1) RBS -0.49 (2) -0.15 (1) 0.66 (2) 0.54 (1) Cooperative 0.68 (1) 0.58 (2) 0.56 (3) 0.71 (1) StandardLife 0.60 (1) 0.79 (2) 0.76 (3) -0.42 (2) Prudential -0.32 (2) - - - - - - Barclays 0.38 (1) -0.05 (1) 0.67 (2) 0.47 (1) Bradford 0.57 (1) 0.77 (2) 0.65 (5) 0.77 (1) BankScotland 0.64 (1) 0.79 (2) 0.56 (5) 0.71 (1) Cheltenham 0.71 (1) 0.84 (2) 0.65 (5) 0.78 (1) Halifax 0.69 (1) 0.85 (2) 0.67 (5) 0.78 (1)
HFC 0.03 (2) -0.32 (1) 0.47 (4) -0.02 (2) HSBC 0.49 (1) -0.09 (1) 0.55 (2) -0.53 (2) Lloyd 0.51 (1) -0.20 (1) 0.25 (5) 0.58 (1) Natwest 0.47 (1) -0.31 (1) 0.26 (5) 0.59 (1) Nothern 0.70 (1) 0.80 (2) 0.66 (5) 0.78 (1) Scotwidow 0.68 (1) 0.76 (2) -0.09 (5) 0.72 (1) Ulster 0.72 (1) 0.79 (2) 0.67 (5) 0.77 (1) Abbey -0.48 (2) 0.66 (2) 0.65 (5) 0.77 (1) Alliance 0.68 (1) 0.70 (2) 0.57 (5) 0.74 (1) AMC -0.33 (2) 0.58 (2) 0.53 (4) -0.41 (2) Unicredito 0.65 (1) 0.59 (2) 0.48 (2) 0.72 (1) Akros 0.15 (2) 0.07 (1) 0.65 (4) 0.13 (2) Capitalia -0.65 (2) 0.73 (2) 0.46 (3) 0.74 (1) MPS 0.63 (1) 0.79 (2) 0.56 (3) 0.72 (1) Rasbank -0.16 (2) -0.34 (1) -0.48 (1) -0.30 (2) BPU 0.71 (1) 0.83 (2) 0.76 (3) 0.79 (1) BPM 0.69 (1) 0.82 (2) 0.79 (3) -0.73 (2) Intesa 0.64 (1) 0.69 (2) 0.12 (2) 0.72 (1) SanPaolo 0.67 (1) 0.72 (2) -0.09 (2) 0.74 (1) Sella 0.69 (1) 0.80 (2) 0.77 (3) 0.73 (1) CajaAhorro 0.77 (1) 0.74 (2) -0.50 (3) 0.82 (1) BBVA 0.68 (1) 0.65 (2) 0.31 (2) 0.77 (1) Santander 0.60 (1) -0.50 (1) 0.66 (2) 0.68 (1) Ibercaja 0.77 (1) 0.84 (2) 0.73 (3) 0.81 (1) Pastor 0.76 (1) 0.83 (2) 0.67 (3) 0.80 (1) Popular 0.62 (1) 0.80 (2) 0.36 (3) 0.80 (1) Sabadell 0.77 (1) 0.84 (2) 0.77 (3) 0.82 (1) Caixa 0.77 (1) 0.83 (2) 0.68 (3) 0.82 (1) Cam 0.76 (1) 0.85 (2) 0.64 (5) -0.60 (2) CajaMadrid 0.77 (1) 0.86 (2) 0.74 (3) 0.82 (1) Bancaja 0.77 (1) 0.83 (2) 0.70 (3) 0.82 (1) Nordea 0.69 (1) -0.67 (1) 0.60 (3) 0.74 (1) OKO -0.27 (2) 0.53 (2) 0.70 (4) -0.38 (2) Sampo -0.58 (2) -0.41 (1) 0.41 (3) -0.62 (2) OP -0.24 (2) -0.35 (1) 0.65 (4) -0.31 (2) Aland -0.19 (2) -0.37 (1) 0.63 (4) -0.29 (2) Number of clusters 2 2 5 2 Silhouette width 0.29 (1) 0.76 (1) 0.09 (1) 0.73 (1)
0.66 (2) 0.28 (2) 0.32 (2) 0.37 (2) 0.64 (3) 0.59 (4) 0.51 (5)
Average silhouette width 0.28 0.33 0.33 0.35 Dunn's coefficient 0.50 0.54 0.45 0.52 Normalised Dunn's coefficient 0.00 0.08 0.31 0.03
Notes: bold names indicate internet banks, the other are mixed banks.
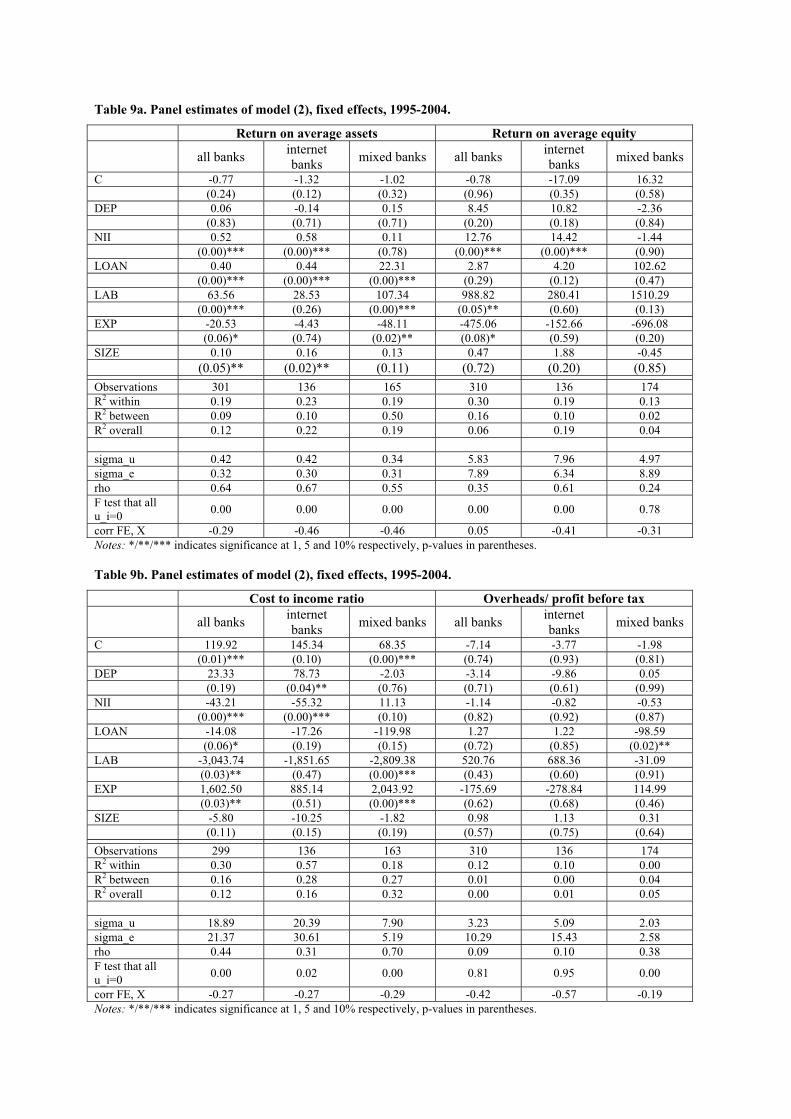
Table 9a. Panel estimates of model (2), fixed effects, 1995-2004.
Return on average assets Return on average equity
all banks internet banks mixed banks all banks internet
banks mixed banks
C -0.77 -1.32 -1.02 -0.78 -17.09 16.32 (0.24) (0.12) (0.32) (0.96) (0.35) (0.58) DEP 0.06 -0.14 0.15 8.45 10.82 -2.36 (0.83) (0.71) (0.71) (0.20) (0.18) (0.84) NII 0.52 0.58 0.11 12.76 14.42 -1.44 (0.00)*** (0.00)*** (0.78) (0.00)*** (0.00)*** (0.90) LOAN 0.40 0.44 22.31 2.87 4.20 102.62 (0.00)*** (0.00)*** (0.00)*** (0.29) (0.12) (0.47) LAB 63.56 28.53 107.34 988.82 280.41 1510.29 (0.00)*** (0.26) (0.00)*** (0.05)** (0.60) (0.13) EXP -20.53 -4.43 -48.11 -475.06 -152.66 -696.08 (0.06)* (0.74) (0.02)** (0.08)* (0.59) (0.20) SIZE 0.10 0.16 0.13 0.47 1.88 -0.45 (0.05)** (0.02)** (0.11) (0.72) (0.20) (0.85) Observations 301 136 165 310 136 174 R2 within 0.19 0.23 0.19 0.30 0.19 0.13 R2 between 0.09 0.10 0.50 0.16 0.10 0.02 R2 overall 0.12 0.22 0.19 0.06 0.19 0.04 sigma_u 0.42 0.42 0.34 5.83 7.96 4.97 sigma_e 0.32 0.30 0.31 7.89 6.34 8.89 rho 0.64 0.67 0.55 0.35 0.61 0.24 F test that all u_i=0 0.00 0.00 0.00 0.00 0.00 0.78
corr FE, X -0.29 -0.46 -0.46 0.05 -0.41 -0.31 Notes: */**/*** indicates significance at 1, 5 and 10% respectively, p-values in parentheses.
Table 9b. Panel estimates of model (2), fixed effects, 1995-2004.
Cost to income ratio Overheads/ profit before tax
all banks internet banks mixed banks all banks internet
banks mixed banks
C 119.92 145.34 68.35 -7.14 -3.77 -1.98 (0.01)*** (0.10) (0.00)*** (0.74) (0.93) (0.81) DEP 23.33 78.73 -2.03 -3.14 -9.86 0.05 (0.19) (0.04)** (0.76) (0.71) (0.61) (0.99) NII -43.21 -55.32 11.13 -1.14 -0.82 -0.53 (0.00)*** (0.00)*** (0.10) (0.82) (0.92) (0.87) LOAN -14.08 -17.26 -119.98 1.27 1.22 -98.59 (0.06)* (0.19) (0.15) (0.72) (0.85) (0.02)** LAB -3,043.74 -1,851.65 -2,809.38 520.76 688.36 -31.09 (0.03)** (0.47) (0.00)*** (0.43) (0.60) (0.91) EXP 1,602.50 885.14 2,043.92 -175.69 -278.84 114.99 (0.03)** (0.51) (0.00)*** (0.62) (0.68) (0.46) SIZE -5.80 -10.25 -1.82 0.98 1.13 0.31 (0.11) (0.15) (0.19) (0.57) (0.75) (0.64) Observations 299 136 163 310 136 174 R2 within 0.30 0.57 0.18 0.12 0.10 0.00 R2 between 0.16 0.28 0.27 0.01 0.00 0.04 R2 overall 0.12 0.16 0.32 0.00 0.01 0.05 sigma_u 18.89 20.39 7.90 3.23 5.09 2.03 sigma_e 21.37 30.61 5.19 10.29 15.43 2.58 rho 0.44 0.31 0.70 0.09 0.10 0.38 F test that all u_i=0 0.00 0.02 0.00 0.81 0.95 0.00
corr FE, X -0.27 -0.27 -0.29 -0.42 -0.57 -0.19 Notes: */**/*** indicates significance at 1, 5 and 10% respectively, p-values in parentheses.