Aggregate Demand, International Trade and Exchange Rates Revised Oct 17, 2006.
Upload
magnus-youngCategory
view
213download
0
International Trade and Exchange Rates
Outline
•Balance of payments (BOP) accounting
•How open is the U.S. economy?
•Description of international trade
•Exchange rates—how are they determined?
•Exchange rates and the price of imported and exported goods.

BOP accounting is the recording of transactions between domestic and foreign economic agents.
Any transaction that results in a receipt of money by domestic agents from abroad is recorded as a credit in the BOP accounts.
Any transaction that entails the payment of money by domestic units to foreigners is recorded as a debit in the BOP accounts.
The current account records foreign transactions involving merchandise and services.
The capital account records foreign transactions involving financial assets and land.
Balance of payments accounting

Current Account (in billions)
1. Merchandise exports +671.0
2. Merchandise imports -919.0
3. Trade balance (1 + 2) -248.0
4. Service exports +503.0
5. Service imports -446.6
6. Goods and services balance (3 + 4 + 5) -191.6
7. Net unilateral transfers -41.9
8. Current account balance (6 + 7) -233.5
Source: Department of Commerce
Capital Account (in billions)
9. Outflow of U.S. capital -297.8
10. Inflow of foreign capital +564.6
11. Capital account balance ( 9 + 10) +266.8
12.Net change in U.S. official assets abroad -33.3
TOTAL (8 + 11 + 12) 0.0
Source: Department of Commerce

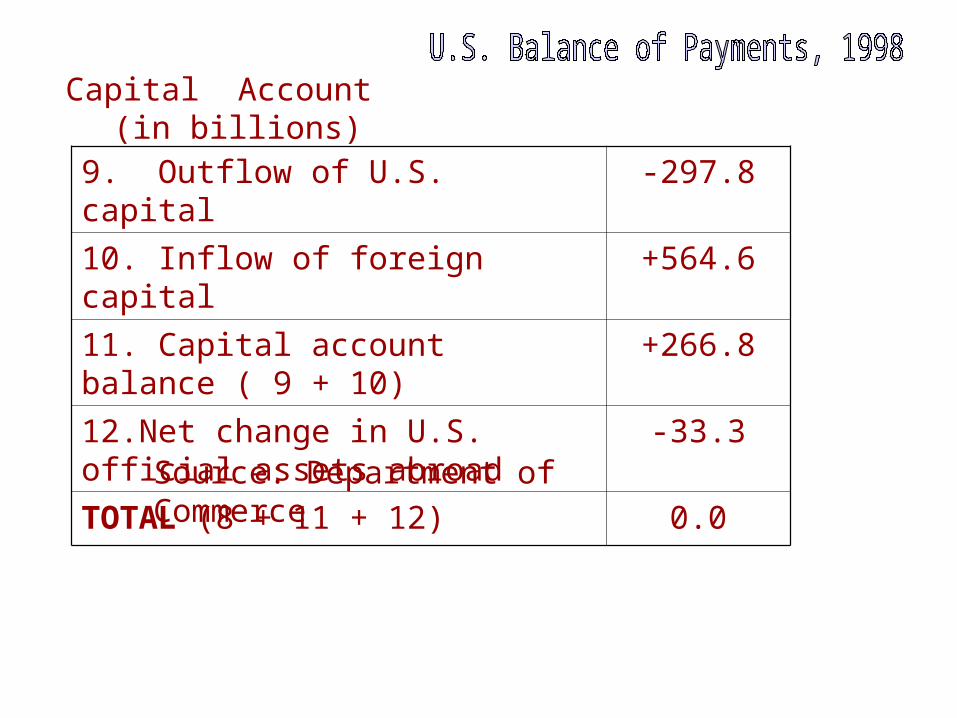
An index of openness
100
GDP
MX
This is a simple
measure of the relative
importance of the foreign
sector
Let
•O denote the index of openness
•X is exports
•M is imports
•GDP is gross domestic product
Thus, we have:
8
12
16
20
24
28
70 75 80 85 90 95 00
Imports + Exports as a Percent of U.S. GDP, 1969-2000
per
cen
t

Imports and Exports of the U.S., April to July, 1999
billions of current dollars
Source: Dismal Scientist (www.dismal.com)
Month
Jul-99Jun-99May-99Apr-99
110
105
100
95
90
85
80
75
70
Exports
Imports
104103
9997
79797878

70
75
80
85
90
95
Sep-97 Oct-97 Nov-97 Dec-97 Jan-98 Feb-98
ExportsImports

The U.S. trade deficitballooned to $271.31billion in 1999—a $107billion increase from 1998.

-120
-100
-80
-60
-40
-20
0
20
70 75 80 85 90 95 00
U.S. Current Account Balance
In billions of current dollars

U.S. Trade in Goods (Exports), 1996
billions of dollars
Source: Economic Report of the President
94.5 / 15.4%
65.0 / 10.6%
253.1 / 41.4%
137.9 / 22.5%
61.5 / 10.0%
Other
Capital goods
Automotive
Industrial supplies
Agricultural prod.

U.S. Trade in Goods (Imports), 1996
billions of dollars
Source: Economic Report of the President
235.80 / 29.4%
128.90 / 16.0%229.00 / 28.5%
136.80 / 17.0%
72.70 / 9.1%Other
AutomotiveCapital goods
Industrial supplies
Petroleum

CountryCurrent Account(billions of U.S.
dollars)Australia -8.1
Britain -38.9
Canada 16.2
France 23.1
Germany 72.8
Japan 122.9
Netherlands 14.2
Sweden 16.8
U.S. -276.7
Source: The Economist
Current Account balance of selected industrialized nations, August 1998 to August 1999

NationExports as percent of
World Total
United States 12.4
Germany 9.6
Japan 7.5
France 5.3
Britain 4.8
Canada 4.2
Italy 4.1
Netherlands 3.6
Hong Kong 3.5
China 3.3
Source: The Economist
Top Exporters in 1999

An exchange rate is the priceof one national currency
expressed in terms of another national currency. For example, the dollar
price of the British pound is $1.71--meaning it takes $1.71 to buy 1 pound

Exchange ratesare determined by
the supply and demand offoreign exchange
DM per $
$’s0
S
D
D’
1.69
1.82
Why do agents want to swap marks for dollars?
•To buy American-made goods.
•To hold stocks in U.S. companies or other dollar-denominated assets.
•To speculate on future exchange rate movements
In this case, the mark depreciates against the dollar

Dollar
Yen D-Mark Franc Euro
France 7.16 .065 3.35 . . .
6.56
Germany 2.13 .019 . . . .298 1.96
Japan 109.23
. . . 51.15 15.25 100.04
U.S. . . . .009 .46 .14 .92
Euro 1.09 .01 .511 .152 . . .
Currency Cross Rates New York Trading, August1, 2000
Source: Wall Street Journal

0.8
0.9
1.0
1.1
1.2
1/04/99 5/24/99 10/11/99 2/28/00 7/17/00
Dollars per Euro
Euro in free fall

Firms and individuals demand marks to buy German- made
goods, to hold mark-denominatedfinancial assets, or to profit from
what they hope will be an increasein the international value of the mark.
$ per DM
DMs
D
S
S’
.59
.55
Dollar appreciates against the mark

Let the dollar price of the mark = $0.59--i.e., it costs 59 cents to purchase 1 mark in the market for foreign exchange.
Let the mark price of a Krups espresso maker = 100 marks
Question: What is the dollar price of the Krups espresso maker?
$ price = (.59)(100) = $59.00

Effect of an appreciating dollar on the price of imported goods
What if the dollar should appreciate, or gain value, against the mark?
Let the dollar price of the mark decrease to $0.55 .
Question: What is the dollar price of the Krups espresso maker?
$ price = (.55)(100) = $55.00

Let the mark price of the dollar = 1.69 marks--i.e., its cost 1.69 marks to buy a dollar in the foreign exchange market.
Let the dollar price of the Microsoft Windows 98 = $189.00
Question: What is the mark price of Windows 98?
Mark price = (1.69)(189.00) = 319.41 marks
Exchange rates and the prices of exported goods and services

Effect of a depreciating mark on the price of Windows 98
Let the mark price of the dollar increase to 1.82 marks.
Question: What is the mark price of Windows 98?
Mark price = (1.82)(189.00) = 343.98 marks