
Introduction to Hydroinformatics - presentation for UNESCO-IHE students (v16)
INTERNATIONAL PERSPECTIVES IN WATER RESOURCES
SCIENCE AND MANAGEMENT:
LIVING WITH FLOODS
Hydroinformatics: Data Mining‘s Role in
Hydrology and a Virtual Tipping Bucket
Framework Motivated from Studies Abroad
Evan Roz
Abstract: The hydrological challenges we face, such as water quantity and quality, and understanding the effects
of human intervention in the ecosystem (land use) have recently been approached with a brand new set of tools than
were previously available. These tools have risen from the data rich, and well networked, environment that is
available globally in many areas. From this environment came rise to the fields of data mining and
hydroinformatics, which use heuristic algorithms to find patterns in datasets for model building and prediction.
Often, these data driven models have an accuracy that could not be achieved with physics based ones.
The University of Iowa‘s 2010 International Perspectives in Water Resource Science and Management: The
Netherlands, UK provided students the opportunity to communicate with international colleagues, and share ideas,
tools, and experiences with experts in the field. Data mining and hydroinformatics was discussed thoroughly in the
course, as well as the need for high resolution radar data for the betterment of hydrological models. This high
resolution radar data could be achieved using data mining techniques, such as a neural network, to train radar
reflectivity measurements for targeting precipitation gauge measurements. The radar data would then substitute
physical tipping bucket rain gauges, and the data driven model act on the data to create ―virtual tipping buckets‖ at
the spatiotemporal resolution of the NEXRAD system.
This paper gives a brief overview of hydroinformatics, some applications of data mining in hydrology, lessons
learned in the IPWRSM course, and the framework and preliminary results of virtual tipping buckets, as well as
future research directions inspired the study abroad.

I. Introduction
As we exist in the information age, a wealth of data is available now that has never been. Tools such as remote
sensing, in situ instrumentation, and online monitoring/internet are accredited for this abundance of data. This
information still requires better interpretation to be fully utilized. Data mining builds models from data uses unique
algorithms to make forecasts with unparalleled accuracy.
Since the early 1990‘s knowledge discovery and data mining (KDD) has become a popular choice for finding
patterns in data. Data mining‘s (DM) grass roots were in economics, but have since branched into countless other
fields, to include social pattern analysis, chemistry, hydrology, medical fields, systems, and has many web-based
applications, such as Netflix selections and Pandora Radio. KDD has been recently applied to areas where physics-
based or deterministic models have once been preferred. The reason for DM‘s success is its ability to find complex
patterns in data sets to very accurately build models with algorithms that can describe highly nonlinear phenomenon.
KDD applications in hydrology have opened a new field called hydroinformatics, which applies data and
communication systems for hydrological issues and research. DM has found success in studies of flood prediction,
water quality, and radar-rainfall estimation.
1.1. Hydroinformatics (Dr. Demitri Solomatine, UNESCO-IHE, Delft)
Demitri Solomatine of UNESCO-IHE, Delft, is an expert in the field of hydroinformatics and was a key speaker in
the IPWRSM course. In his Hydrological Sciences Journal editorial, ―Hydroinformatics: Computational
Intelligence and Technological Developments in Water Science Applications,‖ he provides an insightful overview of
the field.
Professor Mike Abbott is credited with coining the phrase hydro-informatics in his publication titled only by his new
cleared phrase, ―Hydroinformatics‖ in 1991. Hydroinformatics is rooted in computational hydraulics, and was thus
established as a technology for numerical modeling and data collection, processing, and quality checking (Abbott &
Anh, 2004; Abbott et al., 2006). In the past 15 years hydroinformatics has aimed to use data-driven techniques for
modeling and prediction purposes. Most of these techniques were adopted from computational intelligence
(CI)/intelligent systems/machine learning. Neural networks, evolutionary algorithms, and decision trees all were
initiated in this field before they crossed over to hydrology.
Although some of the processes for creating physics-based models are very similar to those required to generate
data-driven ones, hydro-informatics has not been received by the hydrological community without resistance. Data
acquisition occurs in the building of both physics-based and data-driven models, but hydro-informatics has brought

some different terminology from its CI roots. For conceptual model builders, this data is used for calibration. For a
data-driven modeler, it is used for training/validation. Essentially, these two processes are the same.
However, the difficulty in extracting scientific knowledge from a seeming incoherent data-driven model has
although hindered their acceptance into the hydrological world, although there have been well constituted,
successful efforts to unravel the hidden knowledge within data-driven techniques (Wilby et al. 2003; Elshorbagy et
al. 2007).
However, hydro-informatics‘ true purpose may be to aid physics-based models in operation. In fact,
hydroinformatics was not created to breed further understanding into hydrological processes directly, but instead to
take advantage of the vast archived records, streaming real-time data, and well integrated communication systems
that have been recently ubiquitous, and apply these resources for hydrological issues and research. Data driven-
models should therefore be closely associated, and preferably linked, to physics-based ones.
1.2. Data Mining Applications in Hydrology
1.2.1. Discharge Modeling
Demitri Solomatine, an expert in the field of data-driven approaches to modeling and prediction in hydrology and
also one of the speakers in the IP course, has published multiple works documenting the success of these methods.
In his collaborative work with Dibike (2000) he created two NN‘s, a multilayer perceptron (MLP) and a radial basis
function (RBF), trained with concurrent and antecedent rainfall and discharge data to model the current discharge of
the Apure river in Venezuela. Both the NN‘s outperformed a conceptual rainfall-runoff model, with the MLP
slightly outperforming the RBF. Solomatine concludes from his study that the optimal number of antecedent
rainfall/runoff parameters (memory parameters) should be discovered before the final simulation, otherwise known
as feature selection, and also that the RBF was slightly out performed in accuracy by the standard MLP, but the RBF
took less time to execute.
In his study with Bhattacharya (2005) he used NN‘s and modeling trees to predict river discharge from stage height.
The models were trained with discharge and stage height memory parameters to model the current discharge. The
resulting models were much better at predicting the current discharge than the traditional rating curve fitting method.
The authors suggest that these data-driven models are more successful because they better represent the looped-
rating curve, a phenomenon where discharges at a given stage height are higher for rising water levels than for
falling. This phenomenon is partly responsible for the error in the rating curve formula, 𝑄 = 𝛼(ℎ − ℎ0)𝛽 .

1.2.2 Flood Prediction
Damle and Yalcin (2006) utilized time series data mining (TSDM) for flood prediction, but claim their methodology
is generalizable and applicable to other geophysical phenomenon such as earthquakes and heavy rainfall events.
Their proposed TSDM methodology is demonstrated using data from a St. Louis gauging station on the Mississippi
River. The data was discretized about a discharge threshold; those instances of higher discharge than this threshold
were classified as ―flood event‖ and those below the threshold were classified as ―non-flood event.‖ Each element
of the data was clustered. This clustering was done considering the element‘s previous values, or memory
parameters (ie t-1, t-2, t-n where t is the element‘s observation time), as its attributes. A memory parameter is a
previous value of a data point set back by a number of time steps by its memory (t-1, t-2, …, t-n) and this grouping
was set by a user-defined parameter, beta. This data set used included two floods, and the proposed method did not
start to miss a flood until the prediction time increased to 7 days.
1.2.3. Water Quality
Water chemistry systems are highly complex and are difficult for physical models to capture. Recently, data-driven
techniques have been applied with success in water quality. Work by Sahoo et al. (2009) used a NN to predict
stream water temperature which is a dominant factor for determining the distribution of aquatic life in a body of
water, as many of these biological factors are temperature dependent. In this study memory temperature and
discharge memory parameters were used to predict the current stream temperature at a gauging station on four
streams in Nevada. The backwards propagation neural network (BPNN) outperformed the other models it was
tested against, a statistical model (multiple regression analysis) and the chaotic non-linear dynamic algorithms
(CNDA).
Other data-driven studies in water quality modeling include using a fuzzy logic model to predict algal biomass
concentration in the eutrophic lakes (Chen and Mynett (2001)), creating a NN centered decision-making tool for
chlorination control in the final disinfecting phase (Sérodes et al. (2000), and establishing a water quality evaluation
index by way of a self-organizing map NN.
1.2.4. University of Bristol
Work from this university focused specifically on data mining in data mining for improving the accuracy of the
rainfall-runoff model for flood forecasting. The work discussed key issues such as selecting the most appropriate
time interval of the data set for data mining. A case study was performed in four different catchments from
Southwest England, using an auto-regressive moving average (ARMA) for online updating. The study concluded
that a positive pattern existed between the optimal data time interval and the forecast lead time is found to be highly
related to the catchment concentration time. The work used the information cost function (ICF) for calibration and
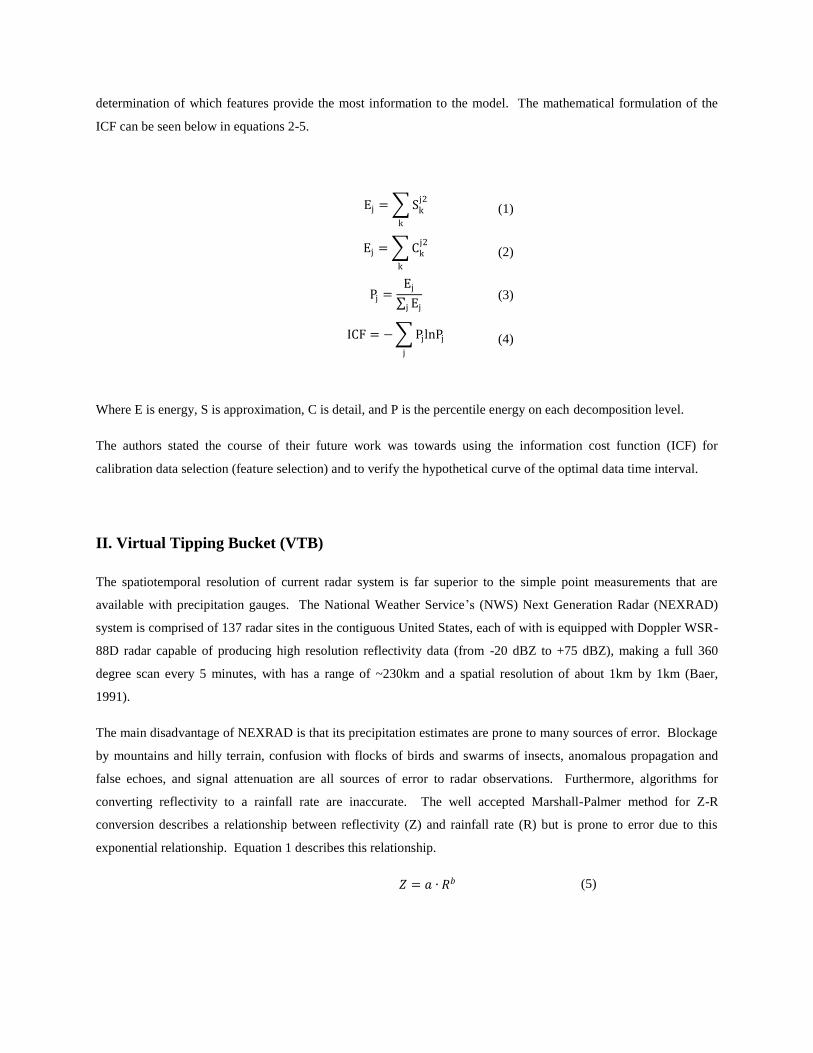
determination of which features provide the most information to the model. The mathematical formulation of the
ICF can be seen below in equations 2-5.
Ej = Skj2
k
(1)
Ej = Ckj2
k
(2)
Pj =
Ej Ejj
(3)
ICF = − PjlnPjj
(4)
Where E is energy, S is approximation, C is detail, and P is the percentile energy on each decomposition level.
The authors stated the course of their future work was towards using the information cost function (ICF) for
calibration data selection (feature selection) and to verify the hypothetical curve of the optimal data time interval.
II. Virtual Tipping Bucket (VTB)
The spatiotemporal resolution of current radar system is far superior to the simple point measurements that are
available with precipitation gauges. The National Weather Service‘s (NWS) Next Generation Radar (NEXRAD)
system is comprised of 137 radar sites in the contiguous United States, each of with is equipped with Doppler WSR-
88D radar capable of producing high resolution reflectivity data (from -20 dBZ to +75 dBZ), making a full 360
degree scan every 5 minutes, with has a range of ~230km and a spatial resolution of about 1km by 1km (Baer,
1991).
The main disadvantage of NEXRAD is that its precipitation estimates are prone to many sources of error. Blockage
by mountains and hilly terrain, confusion with flocks of birds and swarms of insects, anomalous propagation and
false echoes, and signal attenuation are all sources of error to radar observations. Furthermore, algorithms for
converting reflectivity to a rainfall rate are inaccurate. The well accepted Marshall-Palmer method for Z-R
conversion describes a relationship between reflectivity (Z) and rainfall rate (R) but is prone to error due to this
exponential relationship. Equation 1 describes this relationship.
𝑍 = 𝑎 ∙ 𝑅𝑏 (5)

Rain gauges give a real measure of what precipitation fell, but are only single point measurements. Also, their
values may be different from those at another gauge only a few kilometers away, especially during the convective
season where an unstable atmosphere is capable of very high precipitation rates at one location, and no preciptation
at another. If the two systems were merged, the strengths of each could be benefited. This could be done by
training a neural network (NN) with NEXRAD reflectivity data to target precipitation values at tipping buckets
covered by the radar.
2.1. Data Mining Applications in Radar-Rainfall Estimation
There have been few attempts to make this link between radar data and tipping bucket data with data-driven
techniques. A paper by Teschl et al. uses a feed forward neural network (FFNN) and rainfall estimation using radar
reflectivity at four altitudes above two available rain gauges. In this work a feed forward neural network (FFNN) is
trained with reflectivity data for rainfall rate prediction at two rain gauges. Despite the mountainous, Austrian
terrain, good results (mean squared error <1mm/15min) were still achieved, even though the radar was situated 3 km
above the rain gauges. One obstacle to the research was that due to the, the radar gauge sat 3km above the tipping
buckets, making it impossible to detect low level moisture. The algorithm had a mean absolute error (MSE) of less
than 1mm/15 min and outperformed the Z-R conversion
Trafalis et al. used a 5 x 5 grid of radar data at the lowest 5 elevation angles (0.5 deg to 3 deg) above a Norman, OK
rain gauge. This study considered some different parameters such as wind speed and bandwidth to complement
reflectivity, but with unimproved results. The best performing models in the study all had MSE‘s less than
0.1mm/hr.
Liu et al. (built a recursive NN with a radial basis function (RBF) that would continuously update its training data
set with time. The authors chose a 3 x 3 radar grid (1km resolution) at 9 elevations as the input and targeted values
at a tipping bucket. The mean rainfall estimation for the recursive NN was more accurate than the standard NN and
also more accurate than the Z-R conversion method.

III. International Motivation for the VTB
The necessity of high resolution precipitation data was emphasized throughout almost all of the presentations of the
IPSWRSM course, but some focused more specifically on the use of radar data, precipitation gauges, and data-
driven techniques to achieve this goal. Students from the Imperial College in London showed a strong interest in
this topic, and provided a strong motivation for the development of a VTB system.
2.1. Imperial College London (Under Professor Čedo Maksimović)
Dr. Christian Onof and Li-Pen Wang‘s study on urban pluvial flood forecasting requires high-resolution rainfall
forecasting with a longer lead time. The approach would combine using downscaled numerical weather prediction
(NWP) models and radar imagery (nowcasting) with high spatial and temporal resolution. This information will
then be used for the calibration of the ground rain gauge network. The figure below from their presentation is useful
to show the methodology of their project.
Fig. 1. Pluvial flood forecasting data processing methodology schematic
The experimental site for the project is Cran Brook catchment in the London borough of Redbridge, with a drainage
of approximately 910 ha (9.1 km2
which is considerably smaller than the Clear Creek Basin (250 km2)). The
catchment enjoys radar coverage from two separate stations and three real-time tipping bucket rain gauges with
observation frequencies of 1-5min.
One student aims to develop and test advanced tools capable of obtaining accurate and realistic simulations of urban
drainage systems and flood prediction. To do this, improving the analysis of existing rainfall data obtained by rain
gauge networks radar (fine scale resolution) is considered a main objective. Three tipping buckets are utilized and
the study intends on establishing their own Z-R conversion to create quantitative precipitation estimates grids.
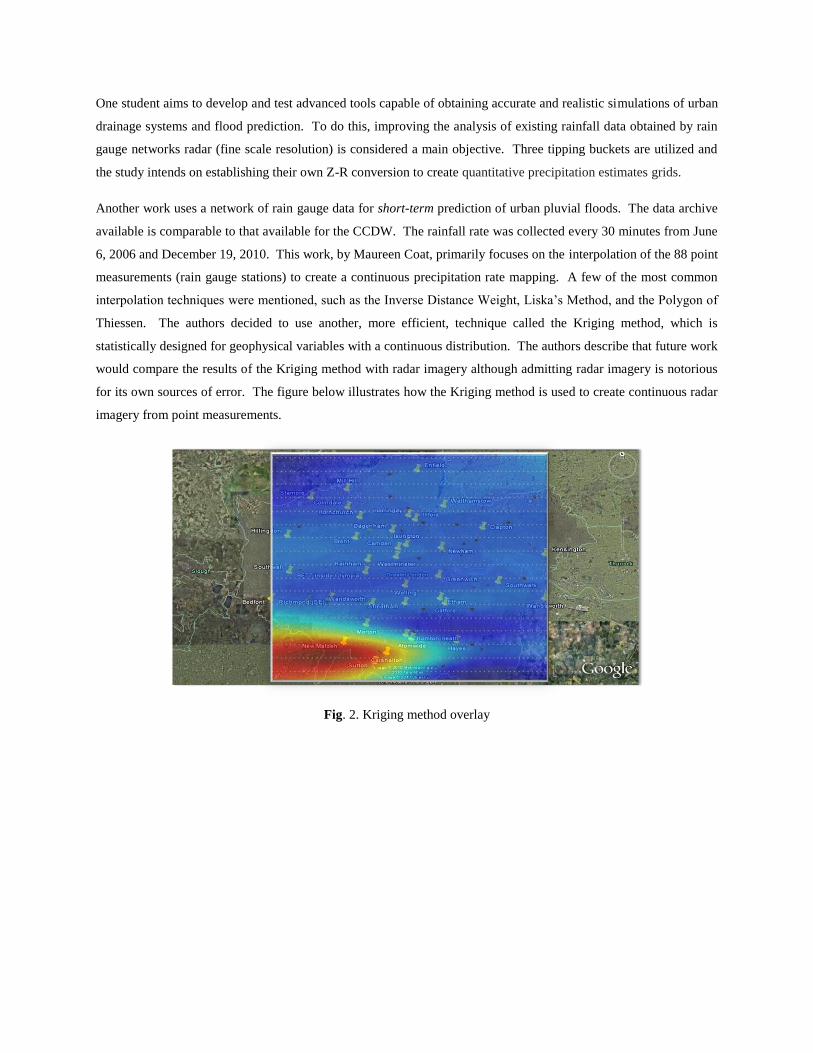
Another work uses a network of rain gauge data for short-term prediction of urban pluvial floods. The data archive
available is comparable to that available for the CCDW. The rainfall rate was collected every 30 minutes from June
6, 2006 and December 19, 2010. This work, by Maureen Coat, primarily focuses on the interpolation of the 88 point
measurements (rain gauge stations) to create a continuous precipitation rate mapping. A few of the most common
interpolation techniques were mentioned, such as the Inverse Distance Weight, Liska‘s Method, and the Polygon of
Thiessen. The authors decided to use another, more efficient, technique called the Kriging method, which is
statistically designed for geophysical variables with a continuous distribution. The authors describe that future work
would compare the results of the Kriging method with radar imagery although admitting radar imagery is notorious
for its own sources of error. The figure below illustrates how the Kriging method is used to create continuous radar
imagery from point measurements.
Fig. 2. Kriging method overlay
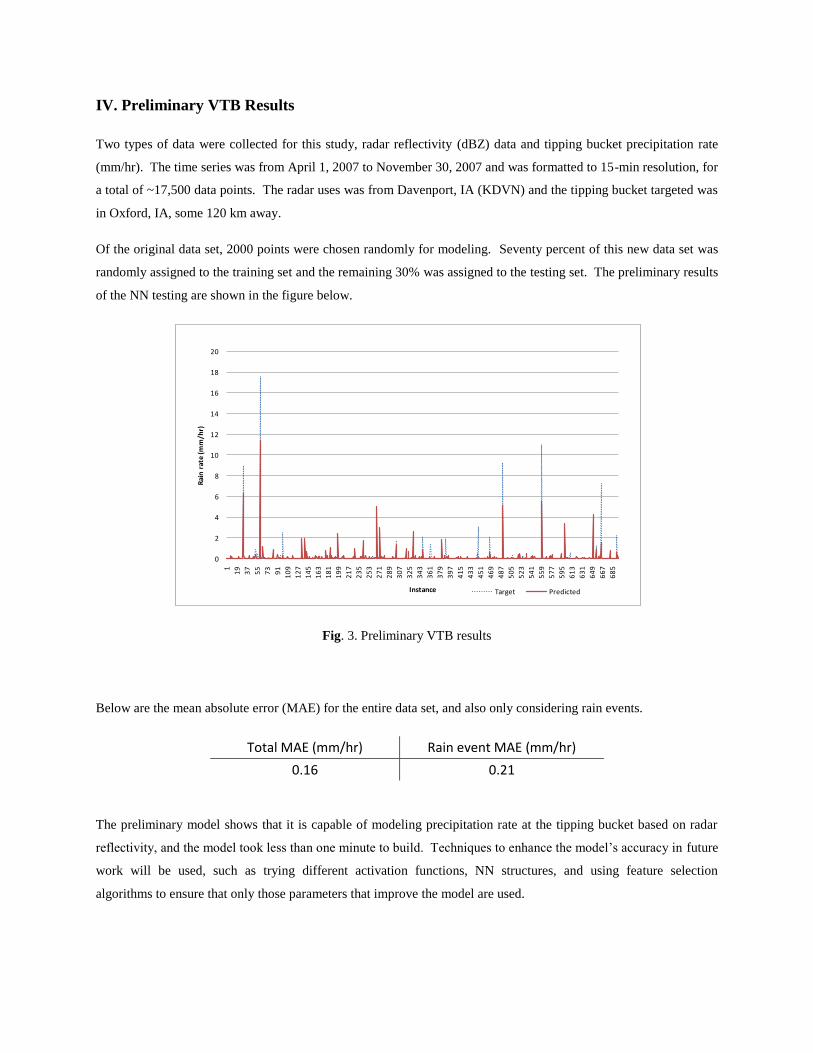
IV. Preliminary VTB Results
Two types of data were collected for this study, radar reflectivity (dBZ) data and tipping bucket precipitation rate
(mm/hr). The time series was from April 1, 2007 to November 30, 2007 and was formatted to 15-min resolution, for
a total of ~17,500 data points. The radar uses was from Davenport, IA (KDVN) and the tipping bucket targeted was
in Oxford, IA, some 120 km away.
Of the original data set, 2000 points were chosen randomly for modeling. Seventy percent of this new data set was
randomly assigned to the training set and the remaining 30% was assigned to the testing set. The preliminary results
of the NN testing are shown in the figure below.
Fig. 3. Preliminary VTB results
Below are the mean absolute error (MAE) for the entire data set, and also only considering rain events.
Total MAE (mm/hr) Rain event MAE (mm/hr)
0.16 0.21
The preliminary model shows that it is capable of modeling precipitation rate at the tipping bucket based on radar
reflectivity, and the model took less than one minute to build. Techniques to enhance the model‘s accuracy in future
work will be used, such as trying different activation functions, NN structures, and using feature selection
algorithms to ensure that only those parameters that improve the model are used.
0
2
4
6
8
10
12
14
16
18
20
1
19
37
55
73
91
10
9
12
7
14
5
16
3
18
1
19
9
21
7
23
5
25
3
27
1
28
9
30
7
32
5
34
3
36
1
37
9
39
7
41
5
43
3
45
1
46
9
48
7
50
5
52
3
54
1
55
9
57
7
59
5
61
3
63
1
64
9
66
7
68
5
Rai
n r
ate
(mm
/hr)
Instance Target Predicted
V. IPWRSM Inspired Future Research Directions
The interaction between universities made on the 2010 IPWRSM course was inductive to new ideas, and the
connections paved the way for some possible collaborative studies between the participating colleges. Some
research topics that were spawned from the intercontinental brainstorming are presented below.
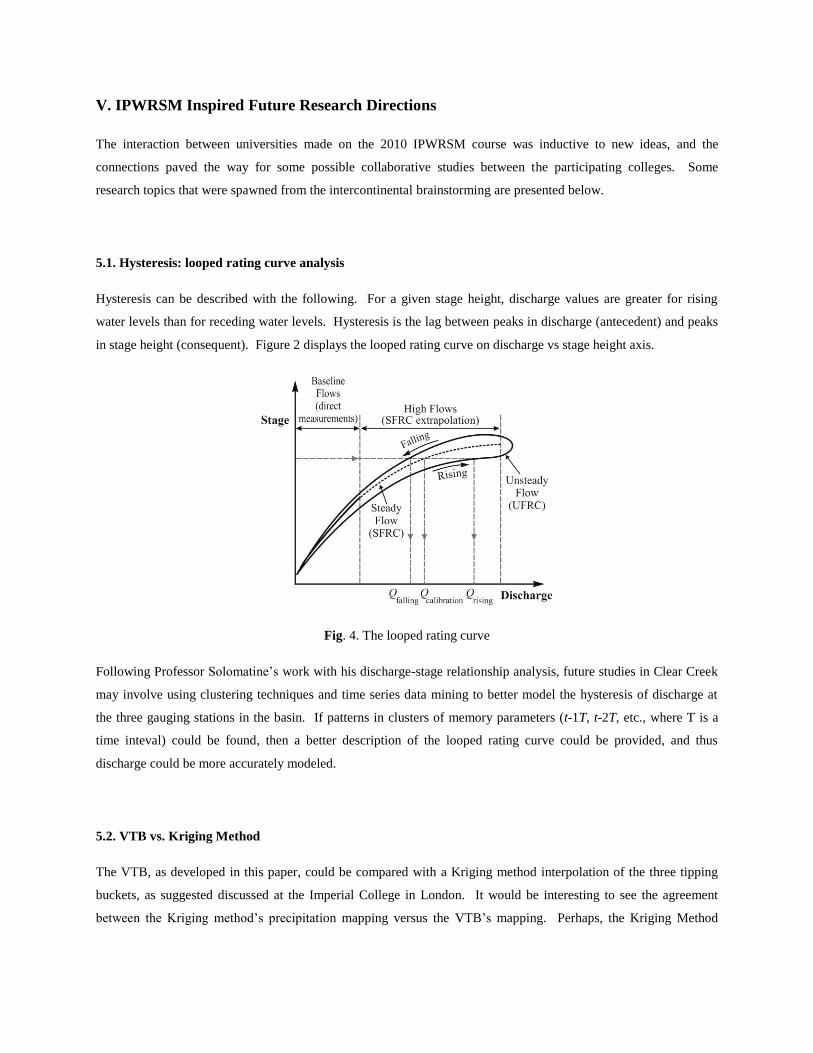
5.1. Hysteresis: looped rating curve analysis
Hysteresis can be described with the following. For a given stage height, discharge values are greater for rising
water levels than for receding water levels. Hysteresis is the lag between peaks in discharge (antecedent) and peaks
in stage height (consequent). Figure 2 displays the looped rating curve on discharge vs stage height axis.
Fig. 4. The looped rating curve
Following Professor Solomatine‘s work with his discharge-stage relationship analysis, future studies in Clear Creek
may involve using clustering techniques and time series data mining to better model the hysteresis of discharge at
the three gauging stations in the basin. If patterns in clusters of memory parameters (t-1T, t-2T, etc., where T is a
time inteval) could be found, then a better description of the looped rating curve could be provided, and thus
discharge could be more accurately modeled.
5.2. VTB vs. Kriging Method
The VTB, as developed in this paper, could be compared with a Kriging method interpolation of the three tipping
buckets, as suggested discussed at the Imperial College in London. It would be interesting to see the agreement
between the Kriging method‘s precipitation mapping versus the VTB‘s mapping. Perhaps, the Kriging Method
could even be used as an additional input parameter for the VTB. In this case the VTB would consider both the
reflectivity and its Kriging method precipitation interpolation value for its prediction.
5.3. VTB-SWAT integration
The ultimate motivation for building a mapping of VTBs is to be implemented in a calibration based model, the
SWAT model. The SWAT model currently uses the data from the three tipping buckets, oriented roughly West-East
spaced out 12km form one another for its hydrological calculations. As discussed earlier, a 1km by 1km VTB
spatial resolution would be a great improvement to the basin, and raise the number of precipitation measurements
from 3, to ~200, and the frequency of measurement would increase from 4/hr to 12/hr. This improvement in detail
to the precipitation data will surely enhance the SWAT models hydrological modeling capability.
VI. Conclusion
The University of Iowa‘s 2010 International Perspectives in Water Resource Science and Management: The
Netherlands, UK was a rare opportunity for engineers to meet to discuss tools, research ideas, and share experiences
at an international level. The transfer of knowledge, information, and personal expertise will prove to be invaluable
to all universities that participated.
In this paper the role of data mining in hydrology, known as the field of hydroinformatics, is discussed as a support
for physics based models. Data mining applications in hydrology are mentioned both from the literature and the
personal research of international colleagues. The motivation for a system of VTBs is supported from the studies of
those at the universities that were visited, and their discussion of the need for high resolution radar data for better
hydrological modeling. Finally, an initial prototype model is developed for the VTB with results disclosed. Future
research directions such as looped rating curve analysis, comparison of the VTB system with the Kriging
precipitation interpolation method, and also the integration of the VTB system with the SWAT model.
VII. References
Abbott, M. B. & Anh, L. H. (2004). ―Appling Mass-Customised Advice-Serving Systems to Water-Related
Problems in ‗First-World‘ Societies.‖ In: Proc. Sixth Int. Conf. on Hydroinformatics (ed. by S.-Y. Liong,
K.-K. Phoon & V. Babovic), 553–559, World Scientific, Singapore.
Baer, V.E. (1991). ―The Transition from the Present Radar Dissemination System to the NEXRAD Information
Dissemination Service (NIDS).‖ American Meteorological Society Bulletin, 72, 1, 29-33.
Bhattacharya, B., and Solomatine, D.P. (2005). ―Neural Networks and M5 Model Trees in Modelling Water Level–
Discharge Relationship.‖ Neurocomputing, 63, 381–396.
Chang, K., Gao, J.L., Yuan, Y.X., and Li, N.N (2008). ―Research on Water Quality Comprehensive Evaluation
Index for Water Supply Network Using SOM.‖ 2008 International Symposium on Information Science and
Engineering.
Chen, Q. and Mynett, A. (2003). ―Integration of Data Mining Techniques and Heuristic Knowledge in Fuzzy Logic
Modelling of Eutrophication in Taihu Lake.‖ Ecological Modelling, 162, 55–67.
Choy K. Y. and Chan C.W. (2003). ―Modelling of river discharges using neural networks derived from support
vector regression.‖ IEEE International Conference on Fuzzy Systems, The University of Hong Kong, Hong
Kong, China.
Damle C. and Yalcin A (2007). ―Flood prediction using time series data mining.‖ Journal of Hydrology, 333, 305–
316.
Dibike, Y. B. and Solomatine, D. P. (2000). ―River Flow Forecasting Using Artificial Neural Networks.‖ Physics
and Chemistry of the Earth (B), 26, 1-7.
Elshorbagy, A., Jutla, A. & Kells, J. (2007). ―Simulation of the Hydrological Processes on Reconstructed
Watersheds Using System Dynamics.‖ Hydrological Sciences Journal, 52(3), 538–562.
Muste, M., Hol, H.C., and Kim, D. ―Streamflow Measurements During Floods Using Video Imaging.‖
http://www.iowafloodcenter.org. Accessed July 15, 2010.
Sahoo, G.B., Schlawdowa, S.G., and Reuter, J.E. (2009). ―Forecasting Stream Water Temperature Using
Regression Analysis, Artificial Neural Network, and Chaotic Non-Linear Dynamic Models.‖ Journal of
Hydrology, 378, 325–342.
See, L., Solomatine, Dimitri , Abrahart, Robert and Toth, Elena(2007) 'Hydroinformatics: Computational
Intelligence and Technological Developments in Water Science Applications—Editorial', Hydrological
Sciences Journal, 52: 3, 391-396.

Sérodes, J. B., Rodriguez, M. J., and Ponton, A. (2000). ―Chlorcast: A Methodology for Developing Decision-
Making Tools for Chlorine Disinfection Control.‖ Environmental Modelling & Software, 16(1), 53–62.
Teschl , R., Randeu, W.L., and Teschl, F. (2007). ―Improving Weather Radar Estimates of Rainfall Using Feed-
Forward Neural Networks.‖ Neural Networks, 20, 519–527.
Trafalis, T.B., Richman, M.B., White, A., and Santosa, B. (2002). ―Data Mining Techniques for Improved WSR-
88D Rainfall Estimation.‖ Computers & Industrial Engineering, 43, 775–786.
Wilby, R. L., Abrahart, R. J. & Dawson, C. W. (2003). ―Detection of Conceptual Model Rainfall–Runoff Processes
Inside an Artificial Neural Network.‖ Hydrological Science Journal, 48(2), 163–181.