‘International Liberalization’–A Gateway to Growth of...
15
ISSN: 2349-5677 Volume 2, Issue 2, July 2015 95 ‘International Liberalization’–A Gateway to Growth of Indian Economy Pallabi Mukherjee Assistant Professor IBMR, IPS Academy Indore, India [email protected] Mob-+919575945247 Kali Charan Modak Assistant Professor IBMR, IPS Academy Indore, India Email- [email protected] Mob-+919981574946 Abstract India being one of the biggest economies in the world has been identified as the land of opportunities by the world before many decades. India a land of rich culture, diverse geography and heritage is very much significant in commerce and growth. India being have to follow protectionism for some time opened her gates to massive world trade after 1991 in the name of liberalization and has recorded a significant growth rate since then. The journey from Hindu growth rate to an impressive double digit has not been a smooth phenomenon. In this paper we have tried to evaluate the policies and trends in the Indian liberalization process and in order to understand this better we need to undergo a scrutiny of the Solow model which is one of the basic theories for liberalization transformation. The major accomplishment is supported by the idea that the increase in investment rate can increase a country’s steady-state of growth position increasing her respective short term growth and the long term growth will direct the Solow residuals which are exogenous factors that accelerate the growth of the economy. This paper also aims in showing the variations in the Indian Economy pre liberalization and post liberalization respectively. There exists a causal impact between inflow
Transcript of ‘International Liberalization’–A Gateway to Growth of...

ISSN: 2349-5677
Volume 2, Issue 2, July 2015
95
‘International Liberalization’–A Gateway to Growth
of Indian Economy
Pallabi Mukherjee
Assistant Professor IBMR,
IPS Academy Indore, India
Mob-+919575945247
Kali Charan Modak
Assistant Professor IBMR,
IPS Academy Indore, India
Email- [email protected]
Mob-+919981574946
Abstract
India being one of the biggest economies in the world has been identified as the land of
opportunities by the world before many decades. India a land of rich culture, diverse
geography and heritage is very much significant in commerce and growth. India being have to
follow protectionism for some time opened her gates to massive world trade after 1991 in the
name of liberalization and has recorded a significant growth rate since then. The journey
from Hindu growth rate to an impressive double digit has not been a smooth phenomenon. In
this paper we have tried to evaluate the policies and trends in the Indian liberalization process
and in order to understand this better we need to undergo a scrutiny of the Solow model which
is one of the basic theories for liberalization transformation. The major accomplishment is
supported by the idea that the increase in investment rate can increase a country’s steady-state
of growth position increasing her respective short term growth and the long term growth will
direct the Solow residuals which are exogenous factors that accelerate the growth of the
economy. This paper also aims in showing the variations in the Indian Economy pre
liberalization and post liberalization respectively. There exists a causal impact between inflow

ISSN: 2349-5677
Volume 2, Issue 2, July 2015
96
of Foreign Direct Investment and Balance of Payment dynamics which is intended to study
here.
Key words- Trade Liberalization, Balance of Payments, Foreign Direct Investment, Economic
Growth.
JEL : F4,F43,O24
I. Introduction
After pursuing a self reliance and protectionist strategy for almost 4 decades, India was
compelled to open her gates to the world for trade. In 1991 wide ranging economic reforms were
initiated which emphasized macroeconomic stabilization keeping in mind the current account
deficit imbalances and exchange rate regimes. After the Second World War, India, with other
developing countries, chose a strategy of import substitution as a means of industrializing. Good
quality research indicates that trade liberalization by developing countries has raised their
aggregate incomes altogether. Indian trade liberalization can very well be identified as
compulsion and forceful but the volume was massive. India experienced a huge structural change
in 1991 when the nation underwent through the LPG policies( Liberalization , privatization and
Globalization ). trade liberalization emerges as one of the most serious policy concerns for
government not only in India but throughout the world. Among the benefits which spring up
from these structural changes, trade liberalization has definitely surcharged the economic growth
of the nation. The current GDP PPP of India is 7.277 trillion (2014 est.) trillion USD and
according to the world fact book the GDP Per capita PPP is 5800 USD ( CIA 2014). In a nation
where household consumption is 57% of GDP ( CIA 2014) , the potential market is very high for
international trade as well as economic growth. We can also see a adverse picture as the
distribution of family income has deteriorated after increase in foreign trade. The world fact
book identifies distribution of family income to be 33.6 (2012) which was 37.8 in (1998) ( Gini
Index).
As we continue to talk about trade it should be identified that the current account balance which
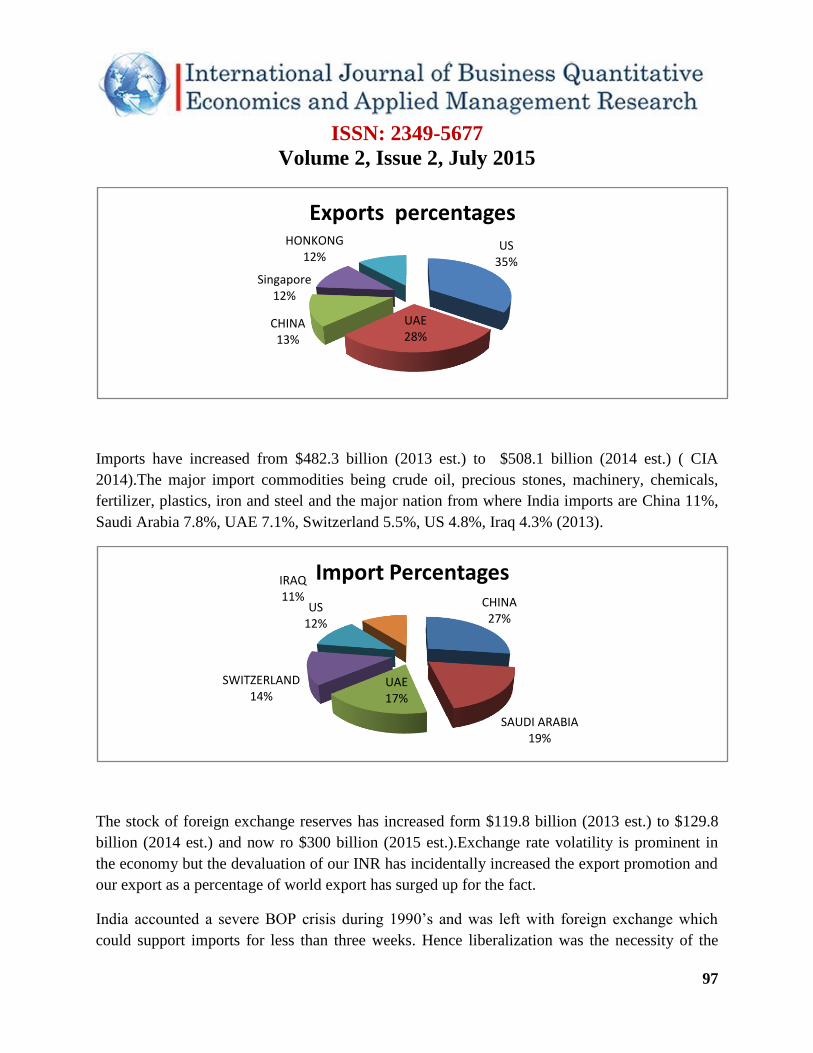
was $-49.23 billion (2013 est.) now has become $-42.99 billion (2014 est.).The exports have
increased from $319.7 billion (2013 est.) to $342.5 billion (2014 est.).
ISSN: 2349-5677
Volume 2, Issue 2, July 2015
97
Imports have increased from $482.3 billion (2013 est.) to $508.1 billion (2014 est.) ( CIA
2014).The major import commodities being crude oil, precious stones, machinery, chemicals,
fertilizer, plastics, iron and steel and the major nation from where India imports are China 11%,
Saudi Arabia 7.8%, UAE 7.1%, Switzerland 5.5%, US 4.8%, Iraq 4.3% (2013).
The stock of foreign exchange reserves has increased form $119.8 billion (2013 est.) to $129.8
billion (2014 est.) and now ro $300 billion (2015 est.).Exchange rate volatility is prominent in
the economy but the devaluation of our INR has incidentally increased the export promotion and
our export as a percentage of world export has surged up for the fact.
India accounted a severe BOP crisis during 1990’s and was left with foreign exchange which
could support imports for less than three weeks. Hence liberalization was the necessity of the
US35%
UAE28%
CHINA13%
Singapore12%
HONKONG12%
Exports percentages
CHINA27%
SAUDI ARABIA19%
UAE17%
SWITZERLAND14%
US12%
IRAQ11%
Import Percentages

ISSN: 2349-5677
Volume 2, Issue 2, July 2015
98
hour and in that context liberalization transformation resembled the steady state growth model of
Solow. Solow residuals resemble trade openness which has accelerated India’s overall output
leading to a faster economic growth. The transformation from underdevelopment to development
needs prosperity which requires economic liberalization to generate output which supports
greater aggregate demand. In spite of having positive evidences we even speak about negative
aspects of trade liberalization. As Rodriguez and Rodrik (2001) point out, “growth and welfare
are not the same thing. Trade policies can have positive effects on welfare without affecting the
rate of economic growth.” There is a lively debate about the same and Slaughter (2001) criticizes
pointing out that “it largely does not address the specific mechanisms through which trade may
affect growth.”In this context both China and Bangladesh could be compared as to see that China
has posed massive growth from trade liberalization but on the same hand Bangladesh has
underwent degradation for the same. Lewer and Van den Berg (2003) argue that there is a
positive relationship between trade volume and growth and that they are fairly consistent on the
size of this relationship. So there is a debate regarding views of different Economists for
identifying the real role play of trade liberalization. Ideally growth and development have
different indicators altogether. It is the key to find the policies tailor made for a nation to fit her
growth and corresponding development altogether.
II. Review of Literature
1. Hammouda,Jallab (2011) examined the relationship between liberalization and growth
alone, but can be enriched by comparing the development experiences of Africa and Asia.
Future thinking should turn towards a search for optimal combinations between liberalization
and control in order to promote growth and strengthen the competitiveness of developing
economies.
2. Chuhdhary et al (2010) studied the relationship between trade liberalization and economic
growth by Granger causality test. Results of this study revealed that in long run relationship
between economic growth human capital and trade liberalization is significant and positive
while in short run labor force also significantly contribute in growth.
3. Panagariya, (2008) studied the difference in share of agriculture in Gross domestic product
of India over a time period of 1951 to 2008.The share of agriculture which was almost 57%
of the GDP had reduced to 21% in 2008.Though the void has been filled by industrial and
service share. This has majorly occurred dare to the trade liberalization policies.

ISSN: 2349-5677
Volume 2, Issue 2, July 2015
99
4. Sarkar (2005) has found no meaningful relationship between the growth rate of real GDP or
per capita real GDP and trade openness. The study has been based on two countries in Asian
region, India and Korea. According to this study, in the first stage of simple trend analysis, it
has been observed that both countries, India and Korea, opened up and consequently shares
of trade in their GDPs rose significantly.
5. Thirlwall and Santos-Paulino (2004) found that the impact of liberalisation differs as to
between highly protected countries and less protected countries. The positive effect of trade
liberalisation on import growth is far greater in the industries that were highly protected
during the period before liberalisation. Their results also showed that the impact of a more
liberalised trade regime, independent of duty reductions, raised import growth by more than
exports.
6. Rodriguez and Rodrik (2001) argue that openness has no significant effect on growth once
institution-related variables are added in the regression analysis. Several studies using tariff
rates as their specific measures of openness have found the relationship between trade policy
and growth to depend on a country’s level of development.
III. Objectives
To evaluate the policies and trends of liberalization process in India with the help of
examination of Solow growth model.
To study the impact of liberalization in Indian economy before 1990 and compare it to
post 1990.
IV. Methodology
This study is descriptive in nature. This paper is divided into two parts, the first part is based on
Solow model and second part gives us a clear picture about the changes in the economy in pre
and post reform period. In the first half we analyze the picture of the Indian Economy using the
Solow model. For fulfilling the research objective we have collected secondary data of India’s
exports, imports and GDP from UNCTAD database (2015).For analyzing the data we have used
paired T test.

ISSN: 2349-5677
Volume 2, Issue 2, July 2015
100
V. Examination of Solow model
Over past decades various economists and scholars have proposed different theories as extremely
crucial and vital to achieving economic development. The world is formulatively divided in to
major three stages of development viz Developed, Underdeveloped and Developing. In this
context great American Economist has also given more sub stages of growth popularly known as
Rostows stages of growth in developmental economics. Categorized according the developed
economies represent the high mass consumption level of growth, where as the developing
economies still drive to maturity and the underdeveloped keep struggling with stages of take off.
However rostow failed to explicitly show how economic growth would occur and the void was
fille dby Harrod- Domar model. He directly correlated increase in economic growth and
development with increase in savings rate which again need external borrowing from
international lending institutions such as the Asian Development Bank, the World Bank and the
International Monetary Fund. Solow growth model diligently follow the theory of market
mechanism where market needs to work very efficiently and is supported by the domestic
government also. This is achieved by liberalization of the economy with fewer taxes, lower
administration controls and free international trade. He was against the logic of too much
government control over the economy which will delay the growth and development. The Solow
model directly emphasized on the capital accumulation process which can be done in various
ways and by turning the exogenous capital into endogenous capital. Nobel prize winner
economist Robert Solow stressed on a country’s investment on capital which was considered to
be one of the important factors to prosper. Accumulation of capital overtime is the core of
growth model which can be expressed mathematically.
𝑂𝑢𝑡𝑝𝑢𝑡𝑡= f( 𝐶𝑎𝑝𝑖𝑡𝑎𝑙𝑡 𝐿𝑎𝑏𝑜𝑢𝑟𝑡) = A 𝐶𝑎𝑝𝑖𝑡𝑎𝑙𝑡1/3
𝐿𝑎𝑏𝑜𝑢𝑟𝑡2/3
This represents the cobb Douglas production function and has constant returns to scale( capital
and labour ).In capital accumulation the major key is to invest some portion of the income into
future for accumulation. So income is the sum of portion of income consumed and invested over
time period t,mathematically expressed as:
𝐶𝑜𝑛𝑠𝑢𝑚𝑝𝑡𝑖𝑜𝑛𝑡+𝐼𝑛𝑣𝑒𝑠𝑡𝑚𝑒𝑛𝑡𝑡= 𝐶𝑜𝑛𝑠𝑢𝑚𝑡𝑖𝑜𝑛𝑡𝑂𝑢𝑡𝑝𝑢𝑡𝑡
This is a resource constraint showing how an economy can use its resources. The invested part is
used by the economy for capital accumulation and mathematically denoting:

ISSN: 2349-5677
Volume 2, Issue 2, July 2015
101
𝑂𝑢𝑡𝑝𝑢𝑡𝑡+1= 𝑂𝑢𝑡𝑝𝑢𝑡𝑡+𝐼𝑛𝑣𝑒𝑠𝑡𝑚𝑒𝑛𝑡𝑡- d𝑂𝑢𝑡𝑝𝑢𝑡𝑡
d𝑂𝑢𝑡𝑝𝑢𝑡𝑡 subtracts the depreciation from the capital in the present year.The change in capita
stock between time period t and t+1.
Is 𝐶𝑎𝑝𝑖𝑡𝑎𝑙𝑡+1= 𝐶𝑎𝑝𝑖𝑡𝑎𝑙𝑡+1- 𝐶𝑎𝑝𝑖𝑡𝑎𝑙𝑡
𝐶𝑎𝑝𝑖𝑡𝑎𝑙𝑡+1= 𝐼𝑛𝑣𝑒𝑠𝑡𝑚𝑒𝑛𝑡𝑡- d 𝐶𝑎𝑝𝑖𝑡𝑎𝑙𝑡
The amend in the capital stock is equal to new investment minus the amount of capital that
depreciates in production. Today’s capital hoard is the outcome of investments undertaken in the
precedent. Considering a constant factor of output and investment
𝐶𝑜𝑛𝑠𝑢𝑚𝑝𝑡𝑖𝑜𝑛𝑡=(1-s) 𝑂𝑢𝑡𝑝𝑢𝑡𝑡
𝐶𝑎𝑝𝑖𝑡𝑎𝑙𝑡+1= s 𝑂𝑢𝑡𝑝𝑢𝑡𝑡- d 𝐶𝑎𝑝𝑖𝑡𝑎𝑙𝑡
Investment in time period t less than the depreciation gives us the net investment.
When the amount of investment exceeds the amount of depreciation then there is an increase in
the stock of capital but after a point the amount of investment becomes equal to the amount of
depreciation in such case the capital stock remains constant at a specific point.
Source (Jones, 2011, p. 105)

ISSN: 2349-5677
Volume 2, Issue 2, July 2015
102
In the first part of the diagram the investment exceeds depreciation so there is a net positive
investment. At point Capital* we can see that both depreciation and investment are in the
equilibrium and hence the change in capital stock is zero( 𝐶𝑎𝑝𝑖𝑡𝑎𝑙𝑡+1= 𝐶𝑎𝑝𝑖𝑡𝑎𝑙𝑡).To recover
from the constant capital stock there is a necessity of an external stock. Point Capital* is known
as Steady state of growth in the Solow model.
The major implication of the steady-state is that there is no long-run growth in the Solow model
where the economy becomes stagnant at a constant level of Output* and a constant level of
capital*. So in the long run the diminishing returns to capital accumulation directly causes
decline in the return from these investments. Hence a country needs to focus on exogenous
factors for long term growth as the factor of only capital accumulation is not only enough.
Exogenous factors are Solow Residuals which a country requires to grow faster and in the long
run.
The International trade is Solow residuals and the external shock which drives an economy
towards faster growth. In this figure where Y and K are output and capital respectively, we see
the new equilibrium or steady state is at point K** where depreciation equals investment. Before
the point the investment is positive. Fast growth of India is a result of international trade where
the out has increased due to increase in net positive investment. Hence the Solow residuals are

ISSN: 2349-5677
Volume 2, Issue 2, July 2015
103
the major reason for the growth of Indian Economy which has been achieved after the
liberalization period.
VI. From Protectionism to Liberalization
The can be done a comparative analysis between the pre and post reform period. An analysis can
be done since Independence period to the present period. The volume of export and import of
India was so low that it did not even constitute to one percent of the total world trade. During the
pre reform period there was protectionism dominance, unlike other south Asian nations India
was not undergoing a fast growth process. But from the latter half of 1980 India made
agricultural revolutions and during the beginning of 1991 India faced a strong BOP crisis which
was extremely crucial and compelled our mighty nation to go on a revolutionized reform policies
and strategies.
Data source:UNCTAD
Exports of goods and services, annual, 1980-2013(US Dollars at current prices and current
exchange rates in millions)
Indian exports have increased in due course of time and has definitely constituted to positive
growth effects ion the Indian Economy.
0
100000
200000
300000
400000
500000
19
80
19
82
19
84
19
86
19
88
19
90
19
92
19
94
19
96
19
98
20
00
20
02
20
04
20
06
20
08
20
10
20
12
Indian exports of goods and services
Indian exports of goods and services
ISSN: 2349-5677
Volume 2, Issue 2, July 2015
104
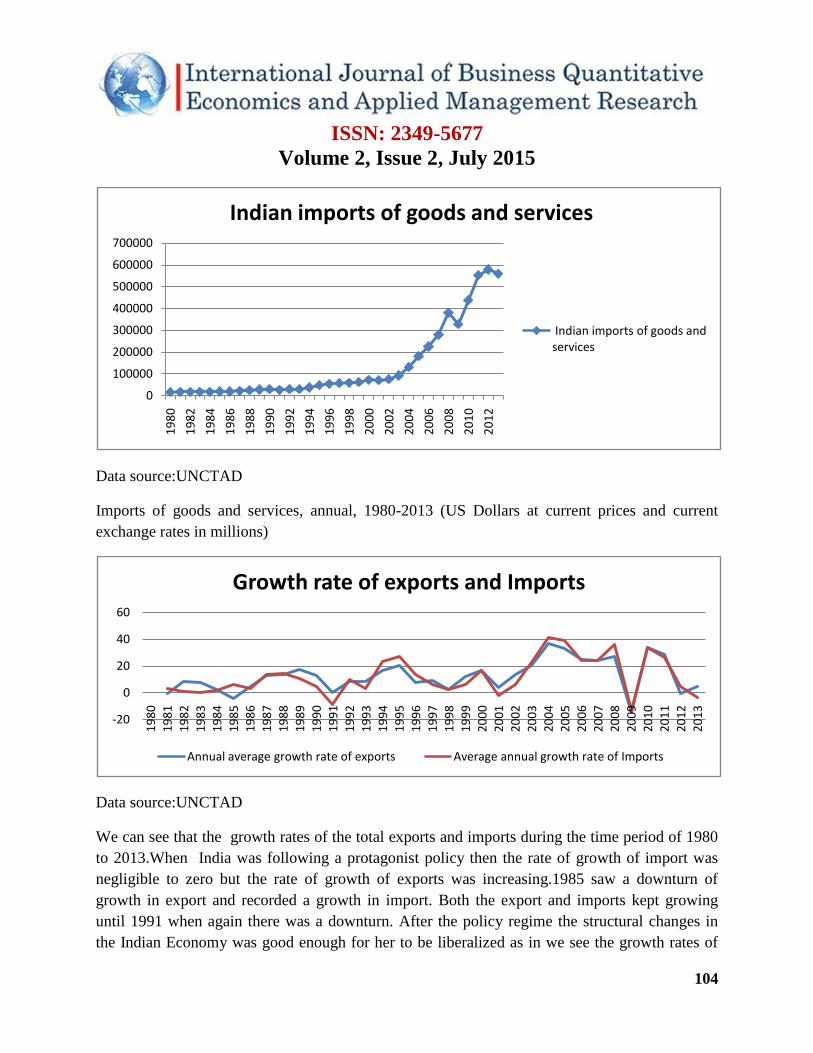
Data source:UNCTAD
Imports of goods and services, annual, 1980-2013 (US Dollars at current prices and current
exchange rates in millions)
Data source:UNCTAD
We can see that the growth rates of the total exports and imports during the time period of 1980
to 2013.When India was following a protagonist policy then the rate of growth of import was
negligible to zero but the rate of growth of exports was increasing.1985 saw a downturn of
growth in export and recorded a growth in import. Both the export and imports kept growing
until 1991 when again there was a downturn. After the policy regime the structural changes in
the Indian Economy was good enough for her to be liberalized as in we see the growth rates of
0
100000
200000
300000
400000
500000
600000
700000
19
80
19
82
19
84
19
86
19
88
19
90
19
92
19
94
19
96
19
98
20
00
20
02
20
04
20
06
20
08
20
10
20
12
Indian imports of goods and services
Indian imports of goods and services
-20
0
20
40
60
19
80
19
81
19
82
19
83
19
84
19
85
19
86
19
87
19
88
19
89
19
90
19
91
19
92
19
93
19
94
19
95
19
96
19
97
19
98
19
99
20
00
20
01
20
02
20
03
20
04
20
05
20
06
20
07
20
08
20
09
20
10
20
11
20
12
20
13
Growth rate of exports and Imports
Annual average growth rate of exports Average annual growth rate of Imports

ISSN: 2349-5677
Volume 2, Issue 2, July 2015
105
both export and import have increased considerably. There was a downturn in both in 2009.After
2013 we can clearly see a decrease in import growth and increase in export growth mainly due to
the change foreign exchange policies.
Data Source:UNCTAD
Balance of payments, Current account net, annual, 1980-2013(US Dollars at current prices and
current exchange rates in millions).From the graph below it can be interpreted that India
underwent a positive current account balance during the years 2001 to 2004.The CAD crisis was
somewhat solved during 1992-93 when the mighty nation became liberalized. Then the CAD
problem tended to solve, as in the years 2011 and 2012 the CAD increased a great deal but it was
solved with the inflow of foreign capital in many forms explicitly the Foreign Direct Investment
which constituted to the decrease in the current account deficit from -91471.2 to -49226 in
2013.Currently the current account deficit is only 1.9% of the gross domestic product.
-100000
-80000
-60000
-40000
-20000
0
20000
India's BOP
India's BOP
ISSN: 2349-5677
Volume 2, Issue 2, July 2015
106
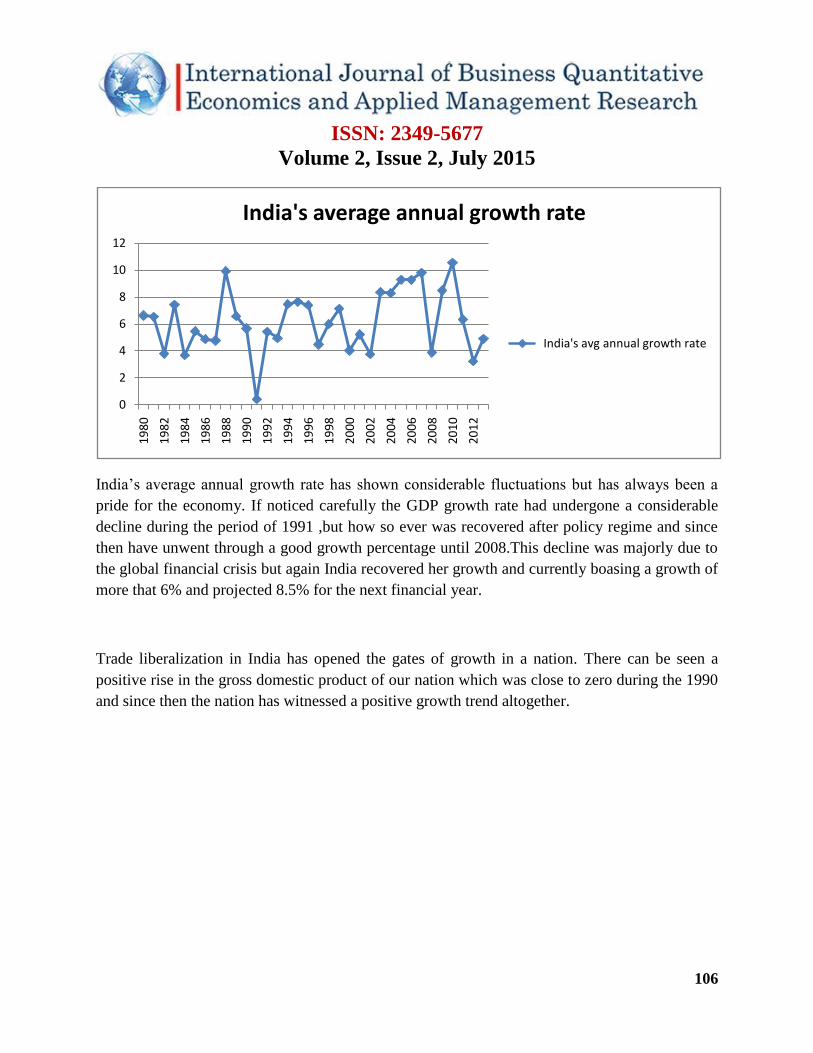
India’s average annual growth rate has shown considerable fluctuations but has always been a
pride for the economy. If noticed carefully the GDP growth rate had undergone a considerable
decline during the period of 1991 ,but how so ever was recovered after policy regime and since
then have unwent through a good growth percentage until 2008.This decline was majorly due to
the global financial crisis but again India recovered her growth and currently boasing a growth of
more that 6% and projected 8.5% for the next financial year.
Trade liberalization in India has opened the gates of growth in a nation. There can be seen a
positive rise in the gross domestic product of our nation which was close to zero during the 1990
and since then the nation has witnessed a positive growth trend altogether.
0
2
4
6
8
10
12
19
80
19
82
19
84
19
86
19
88
19
90
19
92
19
94
19
96
19
98
20
00
20
02
20
04
20
06
20
08
20
10
20
12
India's average annual growth rate
India's avg annual growth rate
ISSN: 2349-5677
Volume 2, Issue 2, July 2015
107
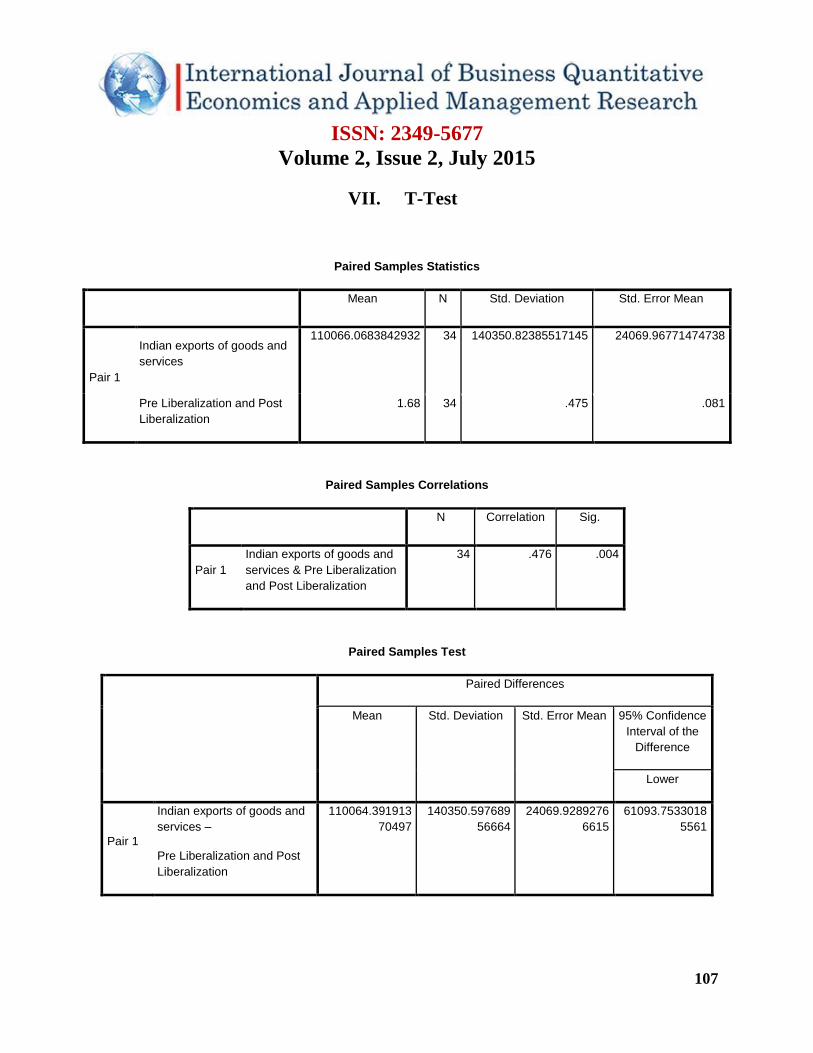
VII. T-Test
Paired Samples Statistics
Mean N Std. Deviation Std. Error Mean
Pair 1
Indian exports of goods and
services
110066.0683842932 34 140350.82385517145 24069.96771474738
Pre Liberalization and Post
Liberalization
1.68 34 .475 .081
Paired Samples Correlations
N Correlation Sig.
Pair 1
Indian exports of goods and
services & Pre Liberalization
and Post Liberalization
34 .476 .004
Paired Samples Test
Paired Differences
Mean Std. Deviation Std. Error Mean 95% Confidence
Interval of the
Difference
Lower
Pair 1
Indian exports of goods and
services –
Pre Liberalization and Post
Liberalization
110064.391913
70497
140350.597689
56664
24069.9289276
6615
61093.7533018
5561

ISSN: 2349-5677
Volume 2, Issue 2, July 2015
108
Paired Samples Test
Paired Differences t df Sig. (2-tailed)
95% Confidence
Interval of the
Difference
Upper
Pair 1
Indian exports of goods and
services –
Pre Liberalization and Post
Liberalization
159035.03052555
432
4.573 33 .000
Interpretation-
T-value is 4.573 and the corresponding p-value .000 is less than 0.05. Therefore we can safely
reject the null hypothesis (H01) and conclude that there is a significant difference between pre
liberalization Exports of goods and services and post liberalization Exports of goods and services
in India.
VIII. Suggestions
It is plausible that trade liberalization may lead to faster growth of imports than exports if the
countries were highly protected in pre-liberalized period. India should now make her mighty land
a manufacturing hub in order to promote more and more exports for an exponential growth trend.
The Foreign Direct Investment policies in India have led to massive capital inflows in the nation
but India should be more careful regarding the policy implications as to not allow any kind of
depreciation impact for the common pavement vendors or the mom and pop shops. In order to
make the FDI policies more sustainable, India should allow foreign investors to earn profit only
if they fulfill the requisite criteria of Indian infrastructural development which includes
abundance of storage facilities, road buildings and transportation facilities. India should drive
herself more towards the export oriented growth strategies which will make her position in the
world more stronger.

ISSN: 2349-5677
Volume 2, Issue 2, July 2015
109
IX. Conclusion
Than other developing countries, India has experienced the fastest economic growth. After India
attained her independence it was utterly difficult for her to undergo growth as the economy was
pretty much exhausted and worn out by the British Raj. India undertook five year plans and
accordingly underwent through strategic growth plans respectively. After the protectionism
policies proving its growth Indian growth rate declined considerably and India could not
maintain a sustained growth rate howsoever and realized that it was important to open her to the
world for trade. If we compare the growth rate before reform and after reform we can definitely
see a significant difference in both. India has achieved her goals and that makes the study of her
economy important for other Asian Nations who are developing. Presently India is growing at a
rate of more than 6% and the Economy is undergoing considerable structural changes like
policies eradicating black money and BRICS member etc. Foreign exchange reserves have been
recorded to be more than 320 billion USD and India is now one of the fastest growing nations in
the world with her impressive growth rate and strong economic strategies.
Reference
Jones, C. I. (2011). Macroeconomics (Second Edition.). W. W. Norton & Company.
Economic Policy Uncertainty and Economic Growth in India,Sanjai Bhagat and Pulak
Ghosh(April 2013).
Ahmed, N. (2000). “Export responses to trade liberalisation in Bangladesh: a
cointegration analysis”, Applied Economics, Vol. 32, pp. 1077-84.
Shreesh Bhattarai & Kishore Kulkarni (Journal of Emerging Knowledge on Emerging
Markets, Vol. 4 [2012], Art. 5)
Friedman, M., 1968, The role of monetary policy, American Economic Review 58.
Panousi, V.
UNCTAD (2015), Handbook of International Trade and Development Statistics.
UNCTAD (2014), Trade and Development Report.
World Bank (1998), “Global Economic Perspectives 1998/99“, Washington DC: World
Bank.