International Journal of ChemTech Research -...
14
Least Cost Design of Simply Supported Beams using Genetically Optimized Artificial Neural Network Karthiga Shenbagamn N* Bannari Amman Institute of Technology, Sathyamangalam, Erode District, TamilNadu, India Abstract : Beam elements are designed and the total cost of each of these has been estimated. The grade of concrete has been varied from M20 to M40 and grade of steel varied from Fe 250 to Fe 550. The singly reinforced beams have been designed for various values of live loads and adopting the ratio of b/D from 0.4 to 0.9. In this paper, it is shown that how the decision variables like b, D, Fck, Fy, Asprov, Mu, Vu etc. and the Main Objective of this project has been finalized Minimizing Beam Element Total Cost (BETC). Material and labor and formwork costs are found out. This paper deals with designing a low cost RCC beam in MATLAB. The results from the software and the results from manual design are compared and finally the optimal design of the beams is explained in detail from the various graphs obtained from both the sources. Key Words : Decision Variables, Objective function, MATLAB, cost, Singly Reinforced beams, Minimization beam. 1.Introduction RCC Beam Designs involves - based upon the Preliminary Sizing and subjected loads, - the calculation Design Forces from Analysis (Mu, Vu etc) (į). Thereupon evaluation of various decision variables such as formwork cross section sizes – b, D, grade of concrete & reinforcement steel material respectively - Fck, Fy respectively, Area of steel - As & its length, position & arrangement of reinforcement for various steel such – Longitudinal and Transverse Steel are made such that resultant strength & serviceability requirements are satisfied. Optimization means making things the best. Thus, structural optimization is the subject of making an assemblage of materials sustains loads in the best way. We want to find the structure that performs this task in the best possible way. However, to make any sense out of that objective we need to specify the term “best.” The specification that comes to mind may be to make the structure as minimizing total cost. 2. Objectives The following objectives are defined to achieve the research goal: Development of computer models to automate the design process of reinforced beams according to IS 456 Code. Development of TAGUCHI models using MINITAB software Development neural network optimization models using MATLAB software. To found the factors which influence the total cost. International Journal of ChemTech Research CODEN (USA): IJCRGG, ISSN: 0974-4290, ISSN(Online):2455-9555 Vol.10 No.11, pp 08-22, 2017
Transcript of International Journal of ChemTech Research -...

Least Cost Design of Simply Supported Beams using Genetically Optimized Artificial Neural Network
Karthiga Shenbagamn N*
Bannari Amman Institute of Technology, Sathyamangalam, Erode District,
TamilNadu, India
Abstract : Beam elements are designed and the total cost of each of these has been estimated.
The grade of concrete has been varied from M20 to M40 and grade of steel varied from Fe 250 to Fe 550. The singly reinforced beams have been designed for various values of live loads
and adopting the ratio of b/D from 0.4 to 0.9. In this paper, it is shown that how the decision
variables like b, D, Fck, Fy, Asprov, Mu, Vu etc. and the Main Objective of this project has been finalized Minimizing Beam Element Total Cost (BETC). Material and labor and
formwork costs are found out. This paper deals with designing a low cost RCC beam in
MATLAB. The results from the software and the results from manual design are compared and finally the optimal design of the beams is explained in detail from the various graphs
obtained from both the sources.
Key Words : Decision Variables, Objective function, MATLAB, cost, Singly Reinforced
beams, Minimization beam.
1.Introduction
RCC Beam Designs involves - based upon the Preliminary Sizing and subjected loads, - the calculation
Design Forces from Analysis (Mu, Vu etc) (į). Thereupon evaluation of various decision variables such as formwork cross section sizes – b, D, grade of concrete & reinforcement steel material respectively - Fck, Fy
respectively, Area of steel - As & its length, position & arrangement of reinforcement for various steel such –
Longitudinal and Transverse Steel are made such that resultant strength & serviceability requirements are
satisfied.
Optimization means making things the best. Thus, structural optimization is the subject of making an
assemblage of materials sustains loads in the best way. We want to find the structure that performs this task in the best possible way. However, to make any sense out of that objective we need to specify the term “best.” The
specification that comes to mind may be to make the structure as minimizing total cost.
2. Objectives
The following objectives are defined to achieve the research goal:
Development of computer models to automate the design process of reinforced beams according to IS 456
Code.
Development of TAGUCHI models using MINITAB software
Development neural network optimization models using MATLAB software.
To found the factors which influence the total cost.
International Journal of ChemTech Research CODEN (USA): IJCRGG, ISSN: 0974-4290, ISSN(Online):2455-9555
Vol.10 No.11, pp 08-22, 2017
Karthiga Shenbagamn N et al /International Journal of ChemTech Research, 2017,10(11): 08-22. 9
To fond the optimal solution.
3. SCOPE
Six hundred R.C beams are designed for moments in the range of 100kN-m to 300 kN-m and b/D in the range of 0.4 to 0.9. bending moment about minor axis in the range of 50kN-m to 350kN-m.The grades of
concrete considered are M20, M25, M30, M35 and M40.The grades of steel adopted – Fe 250, Fe415 and Fe
500.Computer programs have been developed using C language for the design of all the above mentioned structural components and MS -Excel has been made use of it. The estimated costs of each of the designed
structural elements have been determined. Factors which influenced the cost have been determined by using
Minitab software. A set of neural network have been made use of to predict the cost of elements. Results of this
neural network have been compared with the results obtained by hand calculation.
4. Design Optimization Problem Formulation
In this section, the model of the RC beam is described, showing the fixed parameters, the design
variables, the design variables’ bounds, the design constraints and the objective function. A typical simply
supported rectangular RC beam has a span of L m and may be carrying a Moment kN-m. The grades of concrete considered are M20, M25, M30, M35 and M40.The grades of steel adopted – Fe 250, Fe415, Fe 500
and Fe550. It is intended to optimize the design of the beam according to the provisions of the IS-456 Code.
4.2.1 The Fixed Parameters
The fixed parameters for this RC simple beam model are taken as the span of the beam, the cost/m3 of
concrete, the cost/Kg of steel, the modulus of elasticity of concrete, the compressive strength of concrete, the yield strength of reinforcement and the value of the Moments.
4.2.2 Design Variables
The design variables which are considered in this RC beam model are listed below:
Independent Decision Variables
b : Discr. Beam width (mm) (ex-200, 250, 300, 400 ..mmetc)
(bLL< = b < = bUL, i.e b- Lower and Upper Bound Value)
D :Discr. Beam Overall Depth (mm)
(ex-300, 450, 600, 750 ..mmetc) (DLL< = D < = DUL, i.e D- Lower and Upper Bound Value)
Fck : Grade of Concrete (N/mm2).
(ex- Fck 20, 25, 30,35,40.N/mm2 etc) Fy : Grade of Reinforcement Steel (N/mm2).
(ex- Fy 250, 415, 500,550 N/mm2 etc).
Independent Preassigned Design Decision Parameters
Lclr :Clear Length of the beam between support
Mu: Fact.Bending Moment (KN.M). Vu : Factored Shear force (KN)
pAsmax : 4% or Even lesser User Defined (Max. Percentage Steel)
Dependent Preassigned Design Decision Parameters
CC, CS, CF : Unitary Rate of Concrete, Formwork, Reinforcement Steel respectively – with Material supply, Labour, Fixing and placement all inclusive.
Xumax/deff : Neutral Axis ratio as per steel grade.
Q : Limiting Moment of resistance Factor.=0.36* (Xumax /deff)*(1-0.42*Xumax/deff)*Fck pAsmin : 0.85/ Fy *100 (Min. Percentage Steel)

Karthiga Shenbagamn N et al /International Journal of ChemTech Research, 2017,10(11): 08-22. 10
Concrete Cost
Cost of M20 concrete = Rs3892 /m3
Cost of M25 concrete = Rs4015 /m3
Cost of M30 concrete = Rs 4279 /m3
Cost of M35concrete = Rs 4439 /m3
Cost of M40 concrete = Rs4706 /m3
Steel Cost
Cost of Fe250 steel = Rs46 /kg Cost of Fe415 steel = Rs48 /kg
Cost of Fe500 steel = Rs 55 /kg
Cost of Fe550 steel = Rs 57 /kg
Formwork Cost
Cost of Formwork = Rs 350 /m2
Dependent Design Decision Variables
Asmin :pAstmin * b *deff /100 (Min. Area of Steel)
Asmax :pAsmax * b *D /100 (Max. Area of Steel)
Mulim : Q * b * deff2 (Limiting Moment)
Singly reinforced design :
MuMax<= Mulim , Then Tension Steel Area reqd
Astreqd = 0.5 *Fck/Fy*[ 1 – Sqrt (1-4.6*MuMax / (Fck*b*deff2) ) ] *b*deff
Shear Design:
v = Vu / b * deff (Nominal shear Stress) Pt=100Ast/ b*d
c = Depending upon Astprov (Area of Steel Tension provided) and Grade of Concrete Fck.
C > v (hence safe)
Vus = Vu –(c * b *deff)-Transverse Steel Shear resistance Required. Vus_pr = 0.87 *Fy * Asv_pr *deff / Sv_pr
4.2.3design Constraints
A)Bending Strength Related Constraints :
1) MuMax< = MOR_pr
B) Steel Constraints :
2) Astreqd< = Astprov
3) Astprov< = Asmax 4) Asmin< = Astprov
5) deff< = deff_pr
C) Side Face Steel Constraints :
7) AS_SF_reqd< = AS_SF_prov
8) SFRdistprov< = SFRdistmax
D) Upper and Lower Bound Constr. on Beam Sizes:
9) b< = bUL

Karthiga Shenbagamn N et al /International Journal of ChemTech Research, 2017,10(11): 08-22. 11
10) bLL< = b 11) D < = DUL
12) DLL < = D
4.2.4 Objective Function
The chief task of the optimization process is to select the values of variables in a way that satisfies the provisions of the code regarding safety and serviceability within the least cost possible, the function below
defines the total cost of the RC simple beam model in terms of the cost of the concrete and reinforcement and
form work used.
It can be stated as Total Beam Element Cost (BE_TC)
i.e. Total of all cost components (Concrete Reinforcement Steel and Formwork) :
BE_TC = BE_CC + BE_FC + BE_RC
Concrete Cost
BE_CC : BE_CVOL * CC,
CVOL = b * D * Lclr (Concrete Volume)
Formwork Cost
BE_FC : BE_FA* CF
BE_FA = (Formwork Area)
(Formwork Area) =((Leff*b)+(2*b*D)+(2*Leff*D))* CF
Reinforcement Cost
BE_RC :BE_Rwt * CS
BE_Rwt :LRwt + Tr.Rwt (Reinf Weight),
where LRwt and Tr.Rwt Longitudinal and Transverse Reinf Steel Weight.
LRwt :TLRwt + BLRwt + SFLRwt,
Where TLRwt, BLRwt, SFLRwt are Top, Bottom and Side Face Long. Reinf.Steel wt. respectively.
BE_TC =[(b*D*L)-
{(Π/4*d1*d1*Ntr*L)+(Π/4*d2*d2*Ncr*L)+(Π/4*d3*d3*(L/Sv)*Lst)}Cc]+[{(L*b)+(2*b*D)+(2*L*D)}*Cf]+[
{(Π/4*d1*d1*Ntr*L*7850*10^-6)+(Π/4*d2*d2*Ncr*L*7850*10^-6)+(Π/4*d3*d3*(L/Sv)*Lst*7850*10^ 6)}*Cr
4. R.C Member
Six hundred R.C beams are designed for moments in the range of 100kN-m to 300 kN-m and b/D in the
range of 0.4 to 0.9.The grades of concrete considered are M20, M25, M30, M35 and M40.The grades of steel adopted – Fe 250, Fe415,Fe 500 and Fe550 .for example,(only given b/D=0.4)
Karthiga Shenbagamn N et al /International Journal of ChemTech Research, 2017,10(11): 08-22. 12
4.1 Tabulation
SI.NO Fck
N/mm2
Fy
N/mm2
Moment
kN-m
Depth
mm
Breath
mm
Ast
mm2
Asc
mm2
cost for
concrete
cost for
steel
Cost
for
Form
work
Total
cost
1 20 250 100 438 175 1350 202 330 648 95 1073
2 25 250 100 406 163 1454 218 286 670 86 1042
3 30 250 100 382 153 1545 232 263 692 80 1035
4 35 250 100 363 145 1627 244 251 713 76 1040
5 40 250 100 347 139 1701 255 247 734 72 1052
6 20 415 100 449 180 771 116 350 413 98 862
7 25 415 100 417 167 831 125 304 424 89 818
8 30 415 100 392 157 883 132 281 436 83 799
9 35 415 100 373 149 929 139 269 448 78 794
10 40 415 100 356 143 972 146 265 459 74 798
11 20 500 100 455 182 625 94 360 388 99 848
12 25 500 100 422 169 673 101 313 399 91 802
13 30 500 100 397 159 715 107 289 410 84 783
14 35 500 100 377 151 753 113 277 421 79 777
15 40 500 100 361 144 787 118 273 432 73 778
16 20 250 150 501 200 1769 265 432 837 112 1382
17 25 250 150 465 186 1905 286 375 865 102 1342
18 30 250 150 438 175 2025 304 345 893 95 1332
19 35 250 150 416 166 2131 320 329 920 89 1339
20 40 250 150 398 159 2228 334 323 947 84 1355
21 20 415 150 514 206 1011 152 459 535 116 1109
22 25 415 150 477 191 1089 163 399 548 105 1052
23 30 415 150 449 180 1157 174 368 563 98 1028
24 35 415 150 427 171 1218 183 352 578 92 1021
25 40 415 150 408 163 1273 191 347 592 87 1026
26 20 500 150 520 208 819 123 472 499 117 1088
27 25 500 150 483 193 882 132 410 512 107 1029
28 30 500 150 455 182 937 141 378 526 99 1003
29 35 500 150 432 173 986 148 362 540 93 995
30 40 500 150 413 165 1031 155 357 470 88 916
31 20 250 200 552 221 2143 321 524 848 126 1498
32 25 250 200 512 205 2308 346 454 869 115 1438
33 30 250 200 482 193 2453 368 418 891 107 1416
34 35 250 200 458 183 2582 387 399 915 100 1413
35 40 250 200 438 175 2699 405 392 991 95 1477
36 20 415 200 566 226 1224 184 556 550 130 1237
37 25 415 200 525 210 1319 198 483 559 119 1161
38 30 415 200 494 198 1402 210 445 571 110 1126
39 35 415 200 469 188 1475 221 426 583 103 1112
40 40 415 200 449 180 1543 231 420 605 98 1122
41 20 500 200 573 229 992 149 572 523 133 1228
42 25 500 200 532 213 1068 160 497 533 121 1150
43 30 500 200 500 200 1135 170 458 544 112 1115
44 35 500 200 475 190 1195 179 439 557 105 1101
45 40 500 200 455 182 1249 187 433 569 99 1101
46 20 250 250 594 238 2486 373 608 995 139 1742
47 25 250 250 552 221 2678 402 527 1020 126 1673
48 30 250 250 519 208 2846 427 484 1047 117 1649
Karthiga Shenbagamn N et al /International Journal of ChemTech Research, 2017,10(11): 08-22. 13
49 35 250 250 493 197 2996 449 463 1075 110 1647
50 40 250 250 472 189 3132 470 455 1102 104 1661
51 20 415 250 609 244 1421 213 645 641 143 1430
52 25 415 250 566 226 1530 230 561 651 130 1342
53 30 415 250 532 213 1626 244 517 665 121 1302
54 35 415 250 506 202 1712 257 495 679 113 1287
55 40 415 250 484 193 1790 268 487 693 107 1288
56 20 500 250 617 247 1151 173 663 598 146 1407
57 25 500 250 573 229 1240 186 576 608 133 1317
58 30 500 250 539 216 1317 198 532 621 123 1275
59 35 500 250 512 205 1387 208 509 634 115 1259
60 40 500 250 490 196 1450 217 502 648 109 1259
61 20 250 300 631 253 2808 421 686 1124 150 1961
62 25 250 300 586 234 3024 454 595 1152 136 1883
63 30 250 300 552 221 3214 482 547 1183 126 1856
64 35 250 300 524 210 3383 507 522 1214 118 1855
65 40 250 300 501 200 3537 531 513 1245 112 1870
66 20 415 300 648 259 1604 241 729 724 155 1608
67 25 415 300 601 240 1728 259 633 736 141 1509
68 30 415 300 566 226 1836 275 584 750 130 1465
69 35 415 300 537 215 1933 290 559 766 122 1447
70 40 415 300 514 206 2021 303 550 783 116 1449
71 20 500 300 656 262 1299 195 749 675 158 1582
72 25 500 300 609 243 1400 210 651 686 143 1481
73 30 500 300 573 229 1488 223 569 701 133 1402
74 35 500 300 544 218 1566 235 518 716 124 1358
75 40 500 300 520 208 1637 246 494 1464 117 2075
76 20 550 100 458 183 560 84 366 581 100 1046
77 25 550 100 425 170 604 91 318 607 91 1016
78 30 550 100 400 160 641 96 293 631 85 1010
79 35 550 100 380 152 675 101 281 655 80 1016
80 40 550 100 363 145 706 106 277 469 76 822
81 20 550 150 524 210 734 110 479 531 118 1129
82 25 550 150 487 195 791 119 416 548 108 1072
83 30 550 150 458 183 840 126 384 565 100 1049
84 35 550 150 435 174 885 133 368 581 94 1044
85 40 550 150 416 166 925 139 363 430 89 882
86 20 550 200 577 231 889 133 581 477 134 1191
87 25 550 200 536 214 958 144 505 484 122 1111
88 30 550 200 504 202 1018 153 466 494 113 1072
89 35 550 200 479 191 1072 161 446 504 106 1056
90 40 550 200 458 183 1121 168 440 514 100 1054
91 20 550 250 621 249 1032 155 674 554 147 1375
92 25 550 250 577 231 1112 167 585 562 134 1281
93 30 550 250 543 217 1181 177 540 573 124 1237
94 35 550 250 516 206 1244 187 518 585 116 1218
95 40 550 250 493 197 1300 195 510 597 110 1217
96 20 550 300 660 264 1165 175 761 625 159 1545
97 25 550 300 613 245 1255 188 661 635 145 1440
98 30 550 300 577 231 1334 200 610 647 134 1391
99 35 550 300 548 219 1404 211 585 660 125 1370
100 40 550 300 524 210 1468 220 576 674 118 1369
Karthiga Shenbagamn N et al /International Journal of ChemTech Research, 2017,10(11): 08-22. 14
5.2 Cost Influencing Factors For Singly Reinforced Beam
Six hundred R.C singly reinforced beams have been designed for bending moment of 100kN-m to
300kN-m with b/D ratio 0.4 to 0.9. The grades of concrete considered are M20, M25, M30, M35 and M40.The grades of steel adopted are Fe250, Fe415, Fe500 and Fe550.The program have been developed using C language for
the design of all the above mentioned structural components and MS -Excel has been made use of it. The
estimation of cost of each of the designed structural element has been determined by using Excel sheets.
Table5.3. Parameters and their values corresponding to their levels are studied from design for singly
reinforced beam
Parameters Levels
1 2 3 4
A Moment 100 150 200 250
B Fck 20 25 30 35
C Fy 250 415 500 550
D b/D 0.4 0.5 0.6 0.7
The orthogonal array L16 is selected for the design to get the optimum input for obtaining minimum
total cost. In this design the major input parameters are Moment, Fck, Fy and b/D are varied for four levels of
the values are shown in table 5.3. For the input parameters orthogonal array L16as shown on the table 5.3 and
5.4
Table 5.4 Input data arrangement L16 Orthogonal array for singly reinforced beam
SI.no A B C D
1 1 1 1 1
2 1 2 2 2
3 1 3 3 3
4 1 4 4 4
5 2 1 2 3
6 2 2 1 4
7 2 3 4 1
8 2 4 3 2
9 3 1 3 4
10 3 2 4 3
11 3 3 1 2
12 3 4 2 1
13 4 1 4 2
14 4 2 3 1
15 4 3 2 4
16 4 4 1 3
Table 5.5 L16 Orthogonal array for singly reinforced beam
SI.no Moment
kN-m
Fck
N/mm^2
Fy
N/mm^2
b/D
Ratio
1 100 20 250 0.4
2 100 25 415 0.5
3 100 30 500 0.6
4 100 35 550 0.7
5 150 20 415 0.6
6 150 25 250 0.7
7 150 30 550 0.4
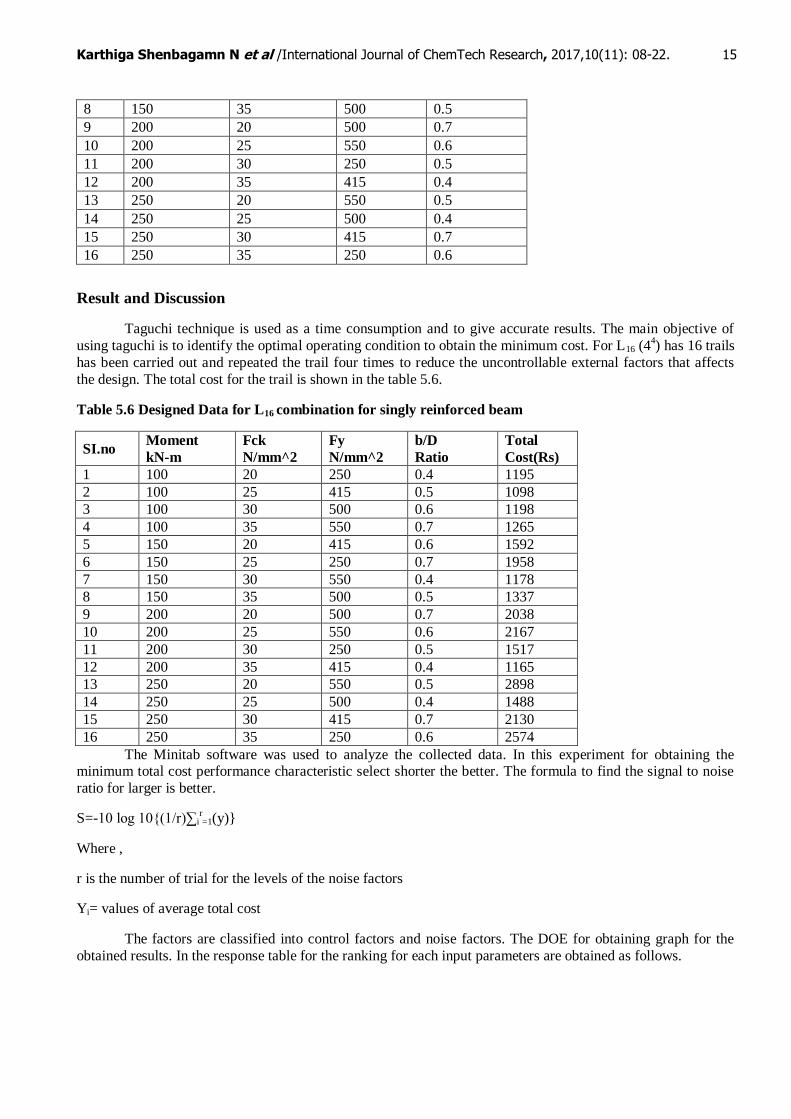
Karthiga Shenbagamn N et al /International Journal of ChemTech Research, 2017,10(11): 08-22. 15
8 150 35 500 0.5
9 200 20 500 0.7
10 200 25 550 0.6
11 200 30 250 0.5
12 200 35 415 0.4
13 250 20 550 0.5
14 250 25 500 0.4
15 250 30 415 0.7
16 250 35 250 0.6
Result and Discussion
Taguchi technique is used as a time consumption and to give accurate results. The main objective of
using taguchi is to identify the optimal operating condition to obtain the minimum cost. For L16 (44) has 16 trails
has been carried out and repeated the trail four times to reduce the uncontrollable external factors that affects
the design. The total cost for the trail is shown in the table 5.6.
Table 5.6 Designed Data for L16 combination for singly reinforced beam
SI.no Moment
kN-m
Fck
N/mm^2
Fy
N/mm^2
b/D
Ratio
Total
Cost(Rs)
1 100 20 250 0.4 1195
2 100 25 415 0.5 1098
3 100 30 500 0.6 1198
4 100 35 550 0.7 1265
5 150 20 415 0.6 1592
6 150 25 250 0.7 1958
7 150 30 550 0.4 1178
8 150 35 500 0.5 1337
9 200 20 500 0.7 2038
10 200 25 550 0.6 2167
11 200 30 250 0.5 1517
12 200 35 415 0.4 1165
13 250 20 550 0.5 2898
14 250 25 500 0.4 1488
15 250 30 415 0.7 2130
16 250 35 250 0.6 2574
The Minitab software was used to analyze the collected data. In this experiment for obtaining the minimum total cost performance characteristic select shorter the better. The formula to find the signal to noise
ratio for larger is better.
S=-10 log 10{(1/r)∑ir=1(y)}
Where ,
r is the number of trial for the levels of the noise factors
Yi= values of average total cost
The factors are classified into control factors and noise factors. The DOE for obtaining graph for the
obtained results. In the response table for the ranking for each input parameters are obtained as follows.

Karthiga Shenbagamn N et al /International Journal of ChemTech Research, 2017,10(11): 08-22. 16
Table 5.7 Response Table for singly reinforced beam
level Moment
kN-m
Fck
N/mm^2
Fy
N/mm^2
b/D
Ratio
1 1189 1931 1811 1257
2 1516 1678 1496 1713
3 1722 1506 1515 1883
4 2273 1585 1877 1848
Delta 1084 425 381 626
Rank 1 3 4 2
250200150100
2400
2100
1800
1500
1200
35302520
550500415250
2400
2100
1800
1500
1200
0.70.60.50.4
Moment kN-m
Co
st V
aria
tio
n in
Rs
Fck N/mm^2
Fy N/mm^2 b/D Ratio
Cost Influence RateData Means
Fig 5.1 Cost influence factors for singly reinforced beam
ANNOVA is a method used to identify the contribution of each input parameter. From the result of ANNOVA operating moment has the large effect on the cost of element. In the weight level made the
confidence level as 92.87%. The moment is the primary significant factor on the cost of element and the
percentage of contribution for moment is 52.23%.
Table 5.8 Result of ANNOVA for L16 design for singly reinforced beam
FACTOR DOF Sum of square Variance Contribution (% )
A 2 2482357 1241179 52.23847911
B 2 408464.8 204232.4 8.856545674
C 2 467086.3 233543.1 10.1276076
D 2 998204.3 499102.1 21.64358499
ERR 7 255897.3 36556.75 7.13378262
TOTAL 15
92.873
Karthiga Shenbagamn N et al /International Journal of ChemTech Research, 2017,10(11): 08-22. 17
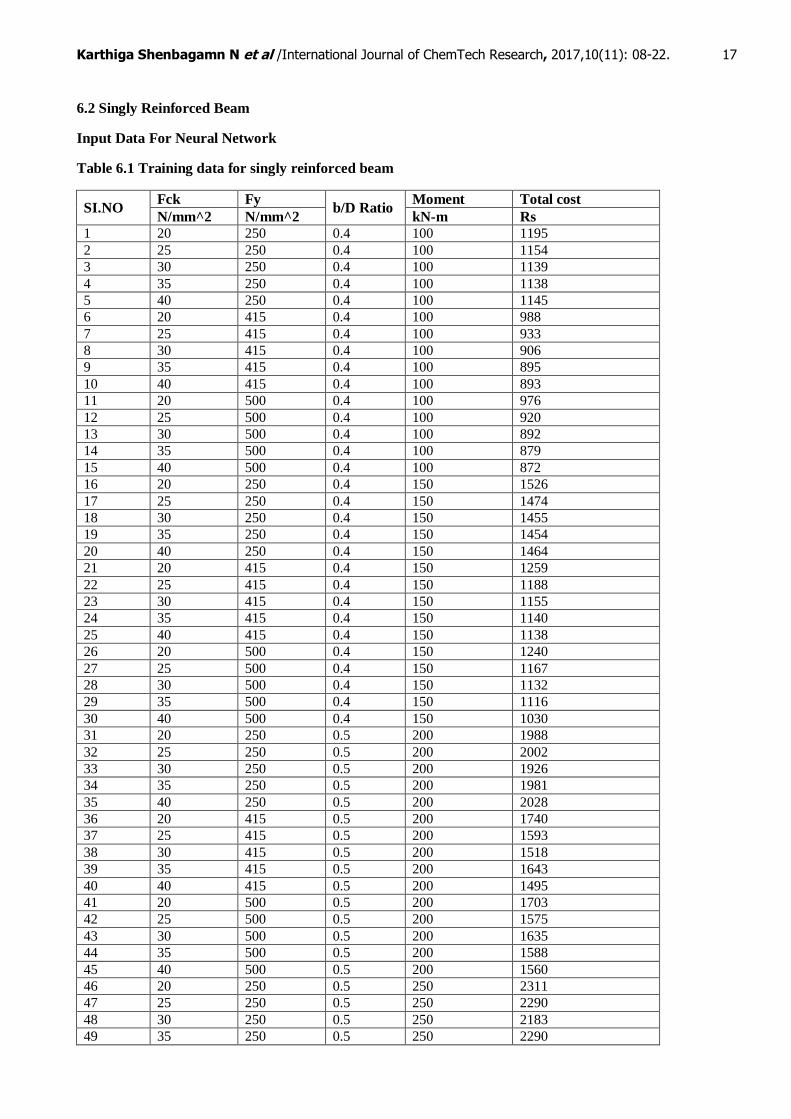
6.2 Singly Reinforced Beam
Input Data For Neural Network
Table 6.1 Training data for singly reinforced beam
SI.NO Fck Fy
b/D Ratio Moment Total cost
N/mm^2 N/mm^2 kN-m Rs 1 20 250 0.4 100 1195
2 25 250 0.4 100 1154
3 30 250 0.4 100 1139
4 35 250 0.4 100 1138
5 40 250 0.4 100 1145
6 20 415 0.4 100 988
7 25 415 0.4 100 933
8 30 415 0.4 100 906
9 35 415 0.4 100 895
10 40 415 0.4 100 893
11 20 500 0.4 100 976
12 25 500 0.4 100 920
13 30 500 0.4 100 892
14 35 500 0.4 100 879
15 40 500 0.4 100 872
16 20 250 0.4 150 1526
17 25 250 0.4 150 1474
18 30 250 0.4 150 1455
19 35 250 0.4 150 1454
20 40 250 0.4 150 1464
21 20 415 0.4 150 1259
22 25 415 0.4 150 1188
23 30 415 0.4 150 1155
24 35 415 0.4 150 1140
25 40 415 0.4 150 1138
26 20 500 0.4 150 1240
27 25 500 0.4 150 1167
28 30 500 0.4 150 1132
29 35 500 0.4 150 1116
30 40 500 0.4 150 1030
31 20 250 0.5 200 1988
32 25 250 0.5 200 2002
33 30 250 0.5 200 1926
34 35 250 0.5 200 1981
35 40 250 0.5 200 2028
36 20 415 0.5 200 1740
37 25 415 0.5 200 1593
38 30 415 0.5 200 1518
39 35 415 0.5 200 1643
40 40 415 0.5 200 1495
41 20 500 0.5 200 1703
42 25 500 0.5 200 1575
43 30 500 0.5 200 1635
44 35 500 0.5 200 1588
45 40 500 0.5 200 1560
46 20 250 0.5 250 2311
47 25 250 0.5 250 2290
48 30 250 0.5 250 2183
49 35 250 0.5 250 2290
Karthiga Shenbagamn N et al /International Journal of ChemTech Research, 2017,10(11): 08-22. 18
50 40 250 0.5 250 2255
51 20 415 0.5 250 1893
52 25 415 0.5 250 1921
53 30 415 0.5 250 1814
54 35 415 0.5 250 1760
55 40 415 0.5 250 1728
56 20 500 0.5 250 1995
57 25 500 0.5 250 1848
58 30 500 0.5 250 1760
59 35 500 0.5 250 1686
60 40 500 0.5 250 1807
61 20 250 0.6 100 1511
62 25 250 0.6 100 1486
63 30 250 0.6 100 1496
64 35 250 0.6 100 1458
65 40 250 0.6 100 1500
66 20 415 0.6 100 1338
67 25 415 0.6 100 1196
68 30 415 0.6 100 1210
69 35 415 0.6 100 1174
70 40 415 0.6 100 1137
71 20 500 0.6 100 1296
72 25 500 0.6 100 1170
73 30 500 0.6 100 1198
74 35 500 0.6 100 1162
75 40 500 0.6 100 1140
76 20 250 0.6 150 1952
77 25 250 0.6 150 1832
78 30 250 0.6 150 1899
79 35 250 0.6 150 1850
80 40 250 0.6 150 1920
81 20 415 0.6 150 1593
82 25 415 0.6 150 1475
83 30 415 0.6 150 1513
84 35 415 0.6 150 1466
85 40 415 0.6 150 1422
86 20 500 0.6 150 1698
87 25 500 0.6 150 1578
88 30 500 0.6 150 1505
89 35 500 0.6 150 1458
90 40 500 0.6 150 1426
91 20 250 0.7 200 2112
92 25 250 0.7 200 2088
93 30 250 0.7 200 2054
94 35 250 0.7 200 2112
95 40 250 0.7 200 2172
96 20 415 0.7 200 1683
97 25 415 0.7 200 1710
98 30 415 0.7 200 1639
99 35 415 0.7 200 1596
100 40 415 0.7 200 1569
101 20 500 0.7 200 1802
102 25 500 0.7 200 1675
103 30 500 0.7 200 1583
104 35 500 0.7 200 1589
105 40 500 0.7 200 1722

Karthiga Shenbagamn N et al /International Journal of ChemTech Research, 2017,10(11): 08-22. 19
106 20 250 0.7 200 2584
107 25 250 0.7 200 2417
108 30 250 0.7 200 2436
109 35 250 0.7 200 2384
110 40 250 0.7 200 2374
111 20 415 0.7 200 2008
112 25 415 0.7 200 1864
113 30 415 0.7 200 1913
114 35 415 0.7 200 1843
115 40 415 0.7 200 1794
116 20 500 0.7 200 1935
117 25 500 0.7 200 1943
118 30 500 0.7 200 1908
119 35 500 0.7 200 1839
120 40 500 0.7 200 1812
121 20 250 0.8 100 1490
122 25 250 0.8 100 1455
123 30 250 0.8 100 1390
124 35 250 0.8 100 1425
125 40 250 0.8 100 1406
126 20 415 0.8 100 1180
127 25 415 0.8 100 1166
128 30 415 0.8 100 1102
129 35 415 0.8 100 1072
130 40 415 0.8 100 1126
131 20 500 0.8 100 1170
132 25 500 0.8 100 1168
133 30 500 0.8 100 1118
134 35 500 0.8 100 1073
135 40 500 0.8 100 1057
136 20 250 0.8 150 1919
137 25 250 0.8 150 1829
138 30 250 0.8 150 1866
139 35 250 0.8 150 1809
140 40 250 0.8 150 1887
141 20 415 0.8 150 1582
142 25 415 0.8 150 1453
143 30 415 0.8 150 1390
144 35 415 0.8 150 1352
145 40 415 0.8 150 1481
146 20 500 0.8 150 1557
147 25 500 0.8 150 1427
148 30 500 0.8 150 1364
149 35 500 0.8 150 1326
150 40 500 0.8 150 1287
Results and Conclusion:
Fig 6.4 Artificial neural network arrangement for singly reinforced beam
Karthiga Shenbagamn N et al /International Journal of ChemTech Research, 2017,10(11): 08-22. 20
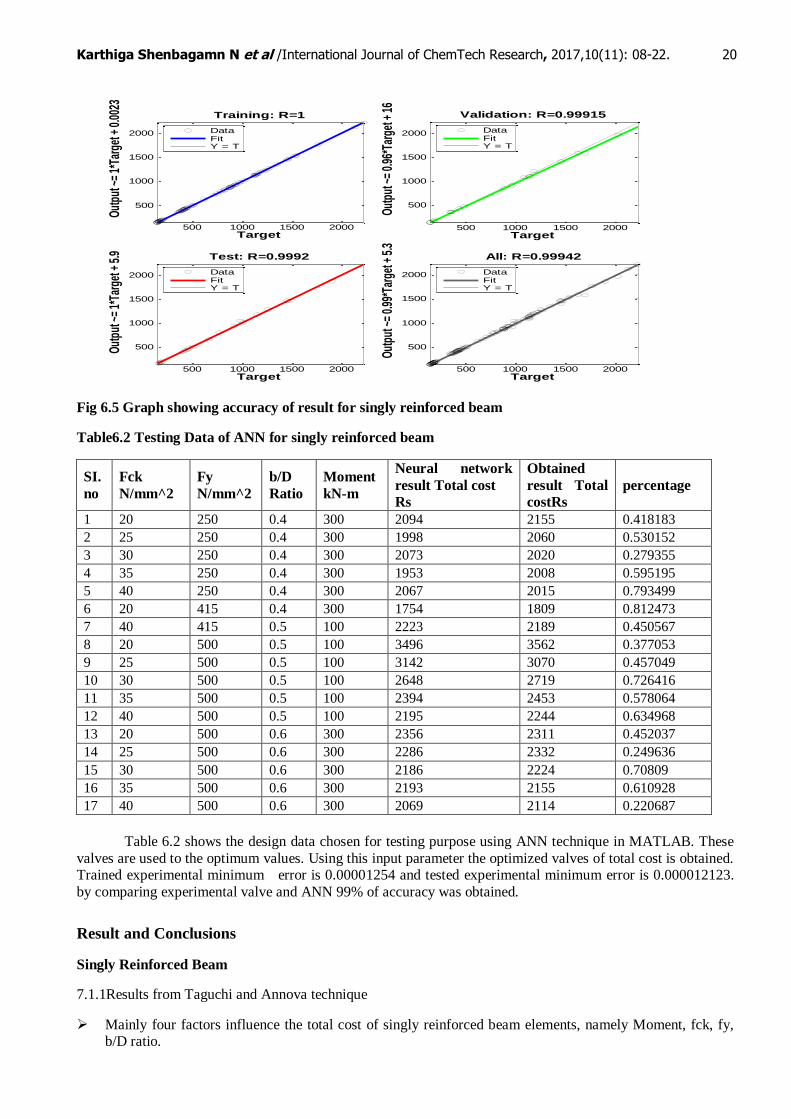
Fig 6.5 Graph showing accuracy of result for singly reinforced beam
Table6.2 Testing Data of ANN for singly reinforced beam
SI.
no
Fck
N/mm^2
Fy
N/mm^2
b/D
Ratio
Moment
kN-m
Neural network
result Total cost
Rs
Obtained
result Total
costRs
percentage
1 20 250 0.4 300 2094 2155 0.418183
2 25 250 0.4 300 1998 2060 0.530152
3 30 250 0.4 300 2073 2020 0.279355
4 35 250 0.4 300 1953 2008 0.595195
5 40 250 0.4 300 2067 2015 0.793499
6 20 415 0.4 300 1754 1809 0.812473
7 40 415 0.5 100 2223 2189 0.450567
8 20 500 0.5 100 3496 3562 0.377053
9 25 500 0.5 100 3142 3070 0.457049
10 30 500 0.5 100 2648 2719 0.726416
11 35 500 0.5 100 2394 2453 0.578064
12 40 500 0.5 100 2195 2244 0.634968
13 20 500 0.6 300 2356 2311 0.452037
14 25 500 0.6 300 2286 2332 0.249636
15 30 500 0.6 300 2186 2224 0.70809
16 35 500 0.6 300 2193 2155 0.610928
17 40 500 0.6 300 2069 2114 0.220687
Table 6.2 shows the design data chosen for testing purpose using ANN technique in MATLAB. These
valves are used to the optimum values. Using this input parameter the optimized valves of total cost is obtained. Trained experimental minimum error is 0.00001254 and tested experimental minimum error is 0.000012123.
by comparing experimental valve and ANN 99% of accuracy was obtained.
Result and Conclusions
Singly Reinforced Beam
7.1.1Results from Taguchi and Annova technique
Mainly four factors influence the total cost of singly reinforced beam elements, namely Moment, fck, fy, b/D ratio.
500 1000 1500 2000
500
1000
1500
2000
Target
Out
put ~
= 1*
Targ
et +
0.0
023
Training: R=1
DataFitY = T
500 1000 1500 2000
500
1000
1500
2000
Target
Out
put ~
= 0.
96*T
arge
t + 1
6
Validation: R=0.99915
DataFitY = T
500 1000 1500 2000
500
1000
1500
2000
Target
Out
put ~
= 1*
Targ
et +
5.9 Test: R=0.9992
DataFitY = T
500 1000 1500 2000
500
1000
1500
2000
TargetO
utpu
t ~=
0.99
*Tar
get +
5.3
All: R=0.99942
DataFitY = T

Karthiga Shenbagamn N et al /International Journal of ChemTech Research, 2017,10(11): 08-22. 21
We got optimal solution for design of singly reinforced beam using M30 grade of concrete and Fe 500
grade of steel and b/D ratio of 0.4 .
In ANNOVA method, it clearly shows that
52% total cost is influenced by moment
21% total cost is influenced by b/D ratio
10% total cost is influenced by fck 8% total cost is influenced by fy.
7.1.2 Results from artificial neural network
The table 6.2 shows the design data chosen for testing purpose using ANN technique in MATLAB. These
valves are used to the optimum values.
Using this input parameter the optimized valves of total cost is obtained. Trained experimental minimum error is 0.000001254
Tested experimental minimum error is 0.000001212
By comparing manual valve and ANN 99% of accuracy was obtained.
References
1. Andres Guerra and Panos D. Kiousis, “Design optimization of reinforced concrete structures”, Computers and Concrete, Vol. 3, No. 5 (2006) 313-334 313.
2. Zubin S. Mehta, “Cost Optimization of Concrete Beam Element - By Direct Exhaustive Search
Method”, Indian Journal of Engineering & Materials Sciences Vol. 13, December 2006, pp. 503-511. 3. Salim T. Yousif ,Ikhlas S. ALsaffar ,Saddam M. Ahmed, “Optimum Design of Singly and Doubly
Reinforced Concrete Rectangular Beam Sections: Artificial Neural Networks” IJCE- vol 6, No3.
4. S. A. Bhalchandra1, P.K.Adsul, “Cost Optimization of Doubly Reinforced Rectangular Beam Section”
International Journal of Modern Engineering Research (IJMER) www.ijmer.com Vol. 2, Issue. 5, Sep.-Oct. 2012 pp-3939-3942 ISSN: 2249-6645.
5. Sara A. Babiker, Fathelrahman. M. Adam, Abdelrahman E. Mohamed, “ DESIGN OPTIMIZATION
OF REINFORCED CONCRETE BEAMS USING ARTIFICIAL NEURAL NETWORK” International Journal of Engineering Inventions ISSN: 2278-7461, www.ijeijournal.com Volume 1, Issue 8
(October2012) PP: 07-13.
*****


![Reply Un-Starred Q.N. 367 · gr %kdool wr %kdq\dul urdg np wr gr *dudq %dvwl wr +dul]dq %dvwl np wr gr 071 urdg wr yloodjh 6rkdu np wr 7rwdo -dzdol 'lylvlrq](https://static.fdocuments.in/doc/165x107/5ea6fe24564be16b902fc191/reply-un-starred-qn-367-gr-kdool-wr-kdqdul-urdg-np-wr-gr-dudq-dvwl-wr-duldq.jpg)