International gateways and the strategic road network
92
International gateways and the strategic road network This report was commissioned by Highways England to inform the emerging Strategic Economic Growth Plan (SEGP) and better understand the relationship between economic growth and the strategic road network. This is a draft report and provides further information to complement the SEGP discussion paper. This report does not inform or relate to planning matters or investment decisions. Queries relating to this report should be sent to [email protected]
Transcript of International gateways and the strategic road network

International gateways
and the strategic road network
This report was commissioned by Highways England to inform the emerging Strategic Economic Growth Plan
(SEGP) and better understand the relationship between economic growth and the strategic road network. This
is a draft report and provides further information to complement the SEGP discussion paper. This report does
not inform or relate to planning matters or investment decisions.
Queries relating to this report should be sent to [email protected]

International gateways and the SRN
2
Notice
This document and its contents have been prepared and are intended solely for Highways England’s information and use in relation to the Strategic Economic Growth Plan commission.
Atkins assumes no responsibility to any other party in respect of or arising out of or in connection with this document and/or its contents.
This report was commissioned by Highways England to inform the emerging Strategic Economic Growth Plan (SEGP) and better understand the relationship between economic growth and the strategic road network. This is a draft report and provides further information to complement the SEGP discussion paper. This report does not inform or relate to planning matters or investment decisions. Queries relating to this report should be sent to [email protected]
This document has 92 pages including the cover.
Document history
Job number: 5146133 Document ref: V1
Revision Purpose description Originated Checked Reviewed Authorised Date
Rev 1.0 Final Report JM KB PR RC 29/11/16
Client signoff
Client Highways England
Project Highways England Strategic Economic Growth Plan
Document title International gateways and the strategic road network
Job no. 5146133
Copy no.
Document reference
V1

International gateways and the SRN
3
Table of contents
Chapter Pages
Introduction 5 1.1. Study Context 5 1.2. Purpose of this Report 5 1.3. Report Structure 6
UK Gateway Activity 7 2.1. Context 7 2.2. Port Context 7 2.3. Airport Context 11 2.4. SRN Impact on the Gateways 13
Gateway Activity and Growth 16 3.1. Port Investment and Expansion Plans 16 3.2. Airport Investment and Expansion Plans 18
Gateway Connectivity Issues 21 4.1. DfT Last Mile Study 21
Conclusions 22 5.1. Ports 22 5.2. Airports 23 5.3. Key Findings 24
Appendix A. Port Case Studies 25 A.1. Grimsby Port & Immingham Port 26 A.2. Port of Tilbury & London Gateway Port 29 A.3. Southampton 33 A.4. Port of Liverpool 36 A.5. Port of Felixstowe 39 A.6. Port of Dover 42 A.7. Port of Bristol 46 A.8. Medway 50 A.9. Tees Port & Port of Hartlepool 53 A.10. Port of Hull & Rivers Hull and Humber Ports 56
Appendix B. Airport Case Studies 59 B.1. Heathrow 59 B.2. Gatwick 64 B.3. Stansted 68 B.4. Manchester 72 B.5. Luton 77 B.6. East Midlands 82 B.7. Birmingham 87

International gateways and the SRN
4
This page is intentionally blank.

International gateways and the SRN
5
Introduction
1.1. Study Context
Supporting and facilitating economic growth is one of the five strategic aims set out in Highways England’s Strategic Business Plan. In recognition of the vital role played by the Strategic Road Network (SRN) in supporting local, regional and national economies, Highways England have committed to work collaboratively with stakeholders and partners to develop a joint Strategic Economic Growth Plan (SEGP). The growth plan will convert the aspirations contained within the Strategic Business Plan into a detailed plan and a set of partnership activities setting out how Highways England will collaborate with external players to support existing economic drivers and facilitate future economic growth.
This document forms part of a suite of 6 evidence reports produced to support the production of the SEGP. These are:
1. Economic growth and the SRN 2. Commercial development and the SRN 3. International gateways and the SRN 4. Socio-economic analysis, future forecasts and the SRN 5. Assessment of growth impacts 6. Economic value of the SRN
The key aims and objectives of the SEGP are through collaboration and engagement to:
Develop a shared understanding of the contribution to the economy made by the SRN;
Present a clear articulation of how Highways England will jointly work with external players to support growth aspirations, covering a period up to 2040 with accompanying short, medium and long-term collaboration plans to facilitate economic growth;
Optimise the economic contribution to be made by the committed highways investments on the SRN (including Road Investment Strategy 1);
Provide an input to the development of future Road Investment Strategies;
Further strengthen the economic capability, as well as the responsiveness of our ways of working to economic priorities;
Provide a platform for further collaboration on transport integration (e.g. SRN, rail and other modes of transport) where this can enhance the movement of goods and people; and
Identify opportunities for connecting Highways England investment with other sources of funding to increase impact and leverage potential.
The SEGP is envisaged to:
Describe the role of the SRN in supporting the economy and providing the conditions for economic growth;
Demonstrate Highways England’s approach to supporting and facilitating growth;
Set out a shared understanding of the key growth locations and growth opportunities around the strategic road network;
Set out the contribution to the economy made by committed highways schemes, in particular the first programme of Road Investment Strategy schemes; and
Clarify the role that Highways England will play in supporting local partners to facilitate strategic housing developments and employment locations in each region.
1.2. Purpose of this Report
In recognition of the key role of the UK’s major gateways in supporting international connectivity and facilitating economic growth, it is critical to ensure that the SRN supports the effectiveness of this critical infrastructure.
This report aims to identify key international gateways of national significance and their relative importance to England’s economy, to help guide where future investment is needed in the SRN to support these facilities. Specifically, the main purpose of this report is five-fold, as follows:

International gateways and the SRN
6
1. Build on the DfT Last Mile study (2016) – which had already developed case studies for 6/7 of the key gateways;
2. Define the key UK gateways; 3. Summarise the scale of activity at each port and airport; 4. Outline traffic issues and the potential constraints to growth; and 5. Present development proposals to strengthen the strategic case.
1.3. Report Structure
Following this introduction, this report is structured as follows:
Section 2 – UK Gateway Activity – this section provides an introduction of the key UK gateways and the scale of the current activity – highlighting the importance of the key gateways;
Section 3 – UK Gateway Growth – this section provides an understanding of planned future growth for each of the key gateways;
Section 4 – Overview of Gateway Connectivity – this section provides an overview of the key issues and constraints that are or could affect economic growth;
Section 5 – Key Findings – this section summarises the key findings from the review.
The report contains two appendices. Appendix A and Appendix B provide detailed case studies setting out information in relation to the key UK ports and airports respectively. Information from the appendices has been used to inform the main report.

International gateways and the SRN
7
UK Gateway Activity
2.1. Context
The capacity and reliability of the strategic road network is critical to the performance and competitiveness of businesses across the logistics sector. Unreliable roads subject to delays constrain growth and economic success. The Department for Transport has identified a need to improve the capacity of the most growth-critical roads. This includes improvements to the longer term capacity, performance and resilience of the UK’s congested road and rail networks, including access to prime logistics development projects and improved connectivity to ports and airports.
Highways England recognise the need for good access to ports and airports and has regularly stated this in its high-level policy documents. Access to major ports and airports was a criterion set out in the 1998 Trunk Roads Review for deciding which routes would form the ‘core’ and ‘non-core’ networks. The former would comprise routes of national importance (some 60% of the existing trunk road network) and the latter would be de-trunked and transferred to local authorities.
2.2. Port Context
The Department for Transport has set out policy targeted at ports growth in the National Policy Statement for Ports (2012). This document sets out that the Government seeks to “encourage sustainable port development to cater for long-term forecast growth in volumes of imports and exports by sea with a competitive and efficient port industry capable of meeting the needs of importers and exporters cost effectively and in a timely manner, thus contributing to long-term economic growth and prosperity”. It is clear from this document that the Government views port development as an engine for economic growth which must be supported by sustainable transport and more efficient transport links with lower external costs.
According to the Oxford Economics Report for Maritime UK (January 2015), the UK ports sector generated in 2013:
95% of UK trade by volume (75% by value)
£9.9bn direct gross value-added to GDP (£19bn total including indirect and induced effects)
139,800 directly employed FTEs (469,900 total including indirect and induced effects)
£2.2bn direct tax revenue to Exchequer (£6.2bn total)
Table 2-1 and Figure 2-1 show the tonnage passing through the ten busiest ports in England in 2014, with
tonnage data shown between 2010 and 2014.
Table 2-1 Port Traffic 2010-2014
Port Tonnage 2010
Tonnage 2011
Tonnage 2012
Tonnage 2013
Tonnage 2014
1 Grimsby & Immingham 54,029,312 57,227,340 60,090,800 62,614,255 59,370,014
2 London 48,062,452 48,796,156 43,741,900 43,205,457 44,489,022
3 Tees and Hartlepool 35,696,985 35,197,505 33,966,900 37,640,558 39,537,027
4 Southampton 39,365,274 37,878,479 38,107,400 35,796,826 36,688,443
5 Liverpool 30,019,803 32,660,282 32,924,000 31,149,403 30,995,861
6 Felixstowe 25,756,440 26,816,677 26,268,500 26,214,090 28,126,858
7 Dover 24,093,076 24,251,423 22,902,200 25,294,752 27,605,158
8 Hull & Rivers Hull and Humber 19,270,713 19,473,214 20,363,700 20,584,016 20,910,977
9 Bristol 7,271,926 8,201,875 10,761,900 10,632,551 11,420,555
10 Medway 13,970,865 16,076,167 12,649,400 8,384,377 8,446,733

International gateways and the SRN
8
Figure 2-1 Port Traffic 2010-2014
0
10,000,000
20,000,000
30,000,000
40,000,000
50,000,000
60,000,000
70,000,000
2010 2011 2012 2013 2014
Ton
nag
e (2
01
4)
Years
Grimsby & Immingham
London
Tees and Hartlepool
Southampton
Liverpool
Felixstowe
Dover
Hull & Rivers Hull and Humber
Bristol
Medway

International gateways and the SRN
9
Figure 2-2 summarises the breakdown of port traffic by cargo type.
Figure 2-2 Port Traffic Breakdown by Cargo Type
International gateways and the SRN
10
The following key facts are noted relating to the port gateways:
Grimsby and Immingham is the busiest port in England, based on tonnage throughput. Approximately 60 million tonnes of cargo pass through the port, per annum. This equates to approximately 12% of UK port traffic. The main cargo category is dry bulk;
Felixstowe is the busiest port for containers, handling 41% of the UK container traffic;
Felixstowe is also the main port for imports into the UK, with Southampton the main port for exports;
Dover is the busiest port for Ro-Ro and passenger traffic, handling 27% and 62% of the UK traffic, respectively; and
Bristol is the fastest growing port in England. Between 2010 and 2014 the tonnage handled at the port increased from 7.3 million tonnes to 11.4 million tonnes, an increase of 57% (4.1 million tonnes) over the period.
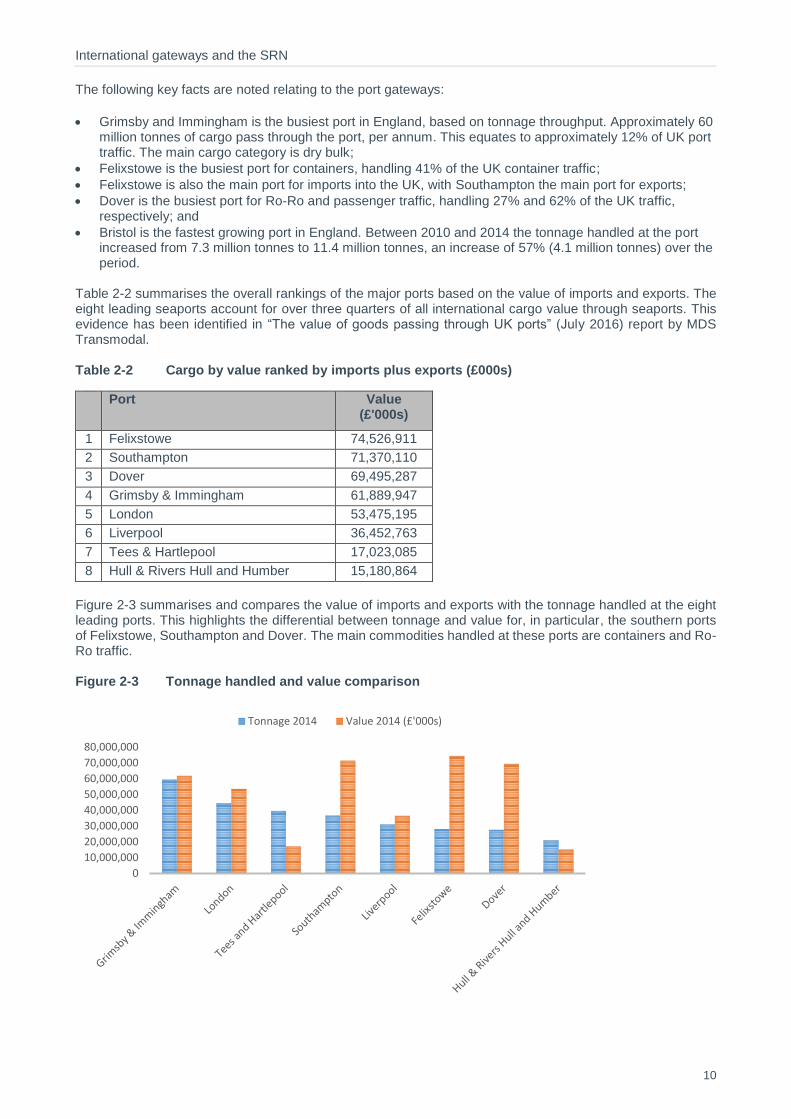
Table 2-2 summarises the overall rankings of the major ports based on the value of imports and exports. The eight leading seaports account for over three quarters of all international cargo value through seaports. This evidence has been identified in “The value of goods passing through UK ports” (July 2016) report by MDS Transmodal. Table 2-2 Cargo by value ranked by imports plus exports (£000s)
Port Value (£'000s)
1 Felixstowe 74,526,911
2 Southampton 71,370,110
3 Dover 69,495,287
4 Grimsby & Immingham 61,889,947
5 London 53,475,195
6 Liverpool 36,452,763
7 Tees & Hartlepool 17,023,085
8 Hull & Rivers Hull and Humber 15,180,864
Figure 2-3 summarises and compares the value of imports and exports with the tonnage handled at the eight leading ports. This highlights the differential between tonnage and value for, in particular, the southern ports of Felixstowe, Southampton and Dover. The main commodities handled at these ports are containers and Ro-Ro traffic. Figure 2-3 Tonnage handled and value comparison
0
10,000,000
20,000,000
30,000,000
40,000,000
50,000,000
60,000,000
70,000,000
80,000,000
Tonnage 2014 Value 2014 (£'000s)

International gateways and the SRN
11
The Channel Tunnel
The Channel Tunnel handled around 1.6 million tonnes (in 2014), playing an important complementary role to the south east ports for trade with the EU. A recent report undertaken by EY (Economic footprint of the Channel Tunnel fixed link, dated October 2016) highlighted that 22% of UK imports and 30% of exports with the EU are through the Channel Tunnel, and this trade is estimated to have a value of £91.4bn. The Channel Tunnel has approximately 43% spare capacity. In 2014 the European Commission predicted a doubling of Channel Tunnel rail freight in the next five years, as a result of Eurotunnel announced reductions to the current level of track access charges imposed on rail freight operators by up to 50 per cent.
2.3. Airport Context
The aviation sector and airports provide a significant benefit to the UK economy. The Oxford Economics report “Economic Benefits from Air Transport in the UK (2011)” estimated that the sector supports 921,000 jobs and contributes £49.6 billion to the economy (3.6% of UK GDP) and £8 billion tax revenues. In addition, millions of people use airports for holidays and to visit friends, therefore supporting the tourism industry which contributes £127 billion in GVA (9% of UK GDP). Effective air connectivity is essential for global connectivity for businesses, the transport of high value freight and for tourism, in particular the UK visitor economy.
The UK’s principal hub airport is Heathrow. The airport handles more passengers annually than any other airport in Europe and accounts for approximately one third of all air passengers using UK airports. Heathrow Airport also supports approximately 76,000 jobs. Airports are therefore also significant employment locations.
The eight busiest airports in England, based on total air transport movements in 2015, are shown in Table 2-3 and Figure 2-4, which summarise the number of air transport movements, passengers and freight handled at each of the main airports.
Heathrow is clearly the UK’s busiest airport with over 470,000 air transport movements, handling approximately 75 million passengers and around 1.5 million tonnes of freight per annum. In total the South East airports handle over 150 million passengers per annum with Manchester handling approaching 25 million passengers per annum and the two Midlands airports approximately 15 million passengers per annum.
For freight, Heathrow, East Midlands and Stansted are the main air freight hubs. These three airports handle 90% of air freight from the eight busiest airports. “The value of goods passing through UK ports” (July 2016) report by MDS Transmodal ranked Heathrow fourth out of all UK gateways in terms of the high proportion of throughput by value (at approximately £64 billion for non-EU trade).
Table 2-3 Airport Activity Summary 2015
Airport Total Air Transport
Movements All Passengers
Freight Total (Tonnage)
Private Vehicle Mode Share
(2014 passengers)
Heathrow 472,131 74,985,748 1,496,551 58%
Gatwick 262,639 40,269,087 73,371 58%
Manchester 164,963 23,136,047 100,021 84%
Stansted 155,913 22,519,178 207,996 49%
Luton 92,005 12,263,505 28,008 71%
Birmingham 90,069 10,187,122 7,164 77%
London City 83,650 4,319,301 23 -
East Midlands 60,754 4,450,862 291,689 92%

International gateways and the SRN
12
Figure 2-4 Key Airports

International gateways and the SRN
13
2.4. SRN Impact on the Gateways
To understand the impact of the SRN on the gateways, it is important to understand two key performance indicators of current efficiency. These are:
Annual average daily traffic flows on the SRN around the gateways – as shown on Figure 2-5 for the dates April 2014 to March 2015.
Annual delay hours on the SRN around the gateways – as shown on Figure 2-6 for the dates April 2014 to March 2015.
Figure 2-5 Traffic Flows on the SRN in relation to the main Gateways

International gateways and the SRN
14
Figure 2-6 Traffic Delay on the SRN in relation to the main Gateways

International gateways and the SRN
15
2.4.1. Traffic flow on SRN to key gateways
Traffic conditions on the SRN in the vicinity of the key ports in England vary from location to location. Traffic flows on links serving the ports range from two way annual average daily traffic flows of approximately 7,900 vehicles on the A14 approach to Felixstowe, to 105,000 vehicles on the A13 serving Tilbury and London Gateway. The A13 between A126 and M25 Junction 30 is in the top 13% busiest SRN links. However, six (Grimsby, Bristol, Hull, Dover, Felixstowe and Immingham) of the ten ports have SRN links that are in the lowest 25% in terms of link flows.
The SRN links in the vicinity of the ports have high proportions of HGVs travelling on them. The proportions of HGVs, on links serving the key ports, range from 10.5% of vehicles on the A1033 in Hull to 47% of vehicles on the A160 serving Grimsby and Immingham. Seven (Immingham, Bristol, Liverpool, Tilbury / London Gateway, Felixstowe, Dover and Southampton) out of the ten ports have SRN links that are in the top 30% in terms of the proportion of HGVs.
These ports are highly dependent on road access, in particular the Roll-on, Roll-off dominated ports such as Dover and Liverpool. The catchment area of the port is a further influence on the potential for other modes of transport, in particular the rail network, to serve ports. The port of Southampton has a high rail mode share with approximately 35% of containers being transported by rail. A constraint to more freight using rail is the limited capacity on the network. The growing demands of passenger rail services will be a continuing future constraint to transferring freight from ports on to the rail network.
There is also the potential for some port-centric developments and with improved integration of land use and transport planning there could be potential to reduce traffic generation from port-related freight and logistics. Port-centric development proposals are summarised in Section 3.
By their nature of being transport hubs, the SRN in the vicinity of the key airports in England is where there are some of the busiest SRN links. This is not solely as a consequence of traffic generation of the airport. Traffic flows on links serving the key airports range from two way annual average daily traffic flows of approximately 21,000 vehicles on the A453 approach to East Midlands Airport to 220,000 vehicles on the M25 between Junctions 14 and 15 in the vicinity of Heathrow. The M25 between Junctions 14 and 15 is the number one busiest link on the SRN network. Figure 2-5 presents the Annual Average Daily Traffic Flow data in relation to each of the main airports.
There is a relatively high mode split by rail for passenger travel to Heathrow, Gatwick and Stansted, and there is an ambition to continue to increase rail travel to Manchester and Birmingham. However, there is a need for effective access to airports from the road network, for both passenger and freight movements. In contrast to the ports, all of these airports are located in very busy parts of the SRN, with high traffic flows and high levels of congestion. It will be important to ensure that the SRN maintains a high level of service to ensure reliable surface access to these airports, for both passenger and freight movements.
2.4.2. Traffic delay on SRN to key gateways
Delay to vehicles travelling on the SRN in the vicinity of the key ports varies from total delay of 4,980 hours on the A14 approach to Felixstowe to 215,680 hours on the A13 (between A126 and M25 Junction 30) serving Tilbury and London Gateway. Three (Tilbury / London Gateway, Tees and Southampton) out of the ten ports have SRN links that are in the top 30% in terms of total delay to vehicles. There are however five (Grimsby, Immingham, Felixstowe, Bristol and Dover) which are in the 25% of SRN links with the lowest level of delay.
Delay to vehicles travelling on the SRN in the vicinity of the key airports ranges from total delay of below 25,000 hours on the A453 approach to East Midlands Airport to almost 1.3 million hours on the M25 between Junctions 14 and 15 in the vicinity of Heathrow. With the exception of the M23 (Gatwick Airport) and A453 (East Midlands Airport) the other airports have links that are in the top 30% of SRN links that experience the greatest delay.

International gateways and the SRN
16
Gateway Activity and Growth
Many of the UK key gateways will be subject to further growth in the future, generating more people and goods, which will rely on the SRN for connectivity to the rest of the UK. This is set out in this section.
3.1. Port Investment and Expansion Plans
There continues to be a wave of investment in UK ports. A summary of some of the investment plans at UK ports is outlined below.
This has included the development of the new London Gateway port 40 km to the east of London. The port will add 3.5 million TEU to the UK’s container port capacity. The first phase opened in 2013. The port is connected to what will be the largest logistics park in Europe and a focus for major port-centric logistics developments. It is forecast that 12,000 new jobs will eventually be created in the port, with an estimated 3,000 new jobs linked to the port's activities.
Liverpool2 is a new deep water container terminal, which will be able to accommodate 95% of the world’s fleet of global container vessel types. Peel Ports hopes that it will empower Liverpool to become the UK’s container gateway and transhipment hub for the North West and Ireland, enabling significantly increased container handling capacity from 750,000 to 2 million TEU by 2030. Liverpool2 is expected to generate around 400 direct jobs and 5,000 indirect and induced jobs.
Growth in containers is in part expected through re-distribution from England’s southern ports. Currently more than 90% of deep sea container volumes enter through the southern ports. However, 50% are delivered to or originate in the northern half of the UK. Work for Peel Ports has estimated that if deep sea containers destined for the north were brought direct to the Port of Liverpool instead of southern ports it would save 200,000 lorry journeys and 150 million road miles per annum.
Green Port Hull is a plan supported by the local LEP to make Hull into a centre for offshore wind energy. The plan will see additional manufacturing opportunities around Hull and additional demand on the Port. The investment is forecast to create around 1,000 direct jobs.
PD Ports are continuing to invest in Tees Port, which has recently included the reconstruction of 305m of the quay to enhance and expand handling facilities at Teesport, enabling the port to accommodate fully laden panamax vessels carrying some 70,000 tonnes of cargo. The port is continuing to handle more traffic with growth of around 10-12% per annum in containers.
Forth Ports has purchased land adjacent to the port previously occupied by the Tilbury power station. The expansion on the site will represent a 25% increase in the port. This £100m investment could create around 200 new jobs at the port. The London Distribution Park is currently nearing completion on a 70 acre site adjacent to the port.
Felixstowe has plans to double port capacity by 2030, including dredging to allow access to more of the port for some of the world’s largest container ships and the construction of a large logistics park to the north of the port, creating around 600 new jobs. In addition, there are plans to build container facilities across the estuary from the main port at Harwich (Harwich Port). This will generate additional container capacity and involve improvement works on ten kilometres of the A120 trunk road, which serves the town and port.
The Port of Dover is investing in the Western Docks development. This development will include new berthing for small boats, but also new logistics and cargo handling facilities, adding to the road capacity requirements of the port.
3.1.1. Proposed Highway Schemes to Support Port Investment Plans
Supporting a number of the above port developments are highway improvement schemes proposed at the following locations that will enhance access to six of the ten busiest ports in England:

International gateways and the SRN
17
1. A5036 Port of Liverpool access: Highways England is developing scheme options through the RIS programme to improve access to Liverpool Port and ease congestion on the A5036. The project is at an early stage and may involve either junction improvements or a relief road (Highways England).
2. A63 Castle Street Improvement – Highways England is currently planning to upgrade a 1.5km stretch of the A63 through Hull, which leads to the Port of Hull. The investment will include a new overpass junction. The scheme’s purpose is expressly stated as improving vehicular access to the Port of Hull. The current planned start date is March 2017 (Highways England).
3. A160/A180 Immingham – Improvements to the junction between the A160 and A180 near Immingham plus a full dual carriageway link from the A180 to the Port of Immingham.
4. M271 / A35 Redbridge roundabout upgrade: junction improvements to provide a dedicated left turn lane for traffic leaving the M271 for Southampton Port and free flow traffic from the Port onto the M271.
5. A20 Access to Dover: Local improvements to improve access to the Port of Dover from the A20, which includes redesigning two junctions to provide free flow journeys for HGVs.
6. M25 Junction 30 (A13): comprehensive expansion of the junction including free-flowing links from the southbound M25 to the eastbound A13. The scheme improves access to ports in the Thames estuary.
7. M2 Junction 5: improvements to a key junction on the M2 that will enhance access to Medway port.
8. A19 Norton to Wynyard: proposals to widen the A19 to three lanes in each direction to improve capacity and improve journey time reliability. The route serves Tees Port as well as Nissan.
9. A14 Cambridge to Huntingdon - A major upgrade to a key section of the SRN. The 21 mile scheme will include a major new bypass of Huntingdon, widening of the existing A1 and A14 and improvements in Huntingdon Town Centre. Currently around a quarter of vehicles on the A14 are HGVs with the planned scheme enhancing access to the port of Felixstowe.
10. A12 Chelmsford to Colchester: Proposals are investigating widening the A12 to increase capacity and improve journey times. The scheme will improve access to the port of Felixstowe.
In addition, Highways England is developing solutions to better manage Operation Stack on the M20 in Kent. This includes HGV parking facilities on the M20 route. Whilst committed to developing solutions, it should be noted that Highways England does not operate HGV parking facilities and does not set the relevant transport and land use policy.
Table 3-1 summarises the status of the current schemes. The planned highway investments will contribute towards realising the port growth plans and the associated economic benefits. The scale of investment planned should support growth plans in some locations. Longer term investment may be further required for the ports of Southampton, Dover, Tilbury and London Gateway, particularly on the M25 and A13, given the other demands on the SRN in this area.

International gateways and the SRN
18
Table 3-1 SRN Highways Schemes supporting Port Growth
Scheme Port served Status
1. A5036 Princess Way - Access to Port of Liverpool
Liverpool Scheme announced in December 2014 and due to start construction by end 2019/20 – subject to approval
2. A63 Castle Street Hull Scheme announced in June 2013 and due to start construction by end 2019/20. The improvement scheme will cost in the range of £135.1 - £201.6 million – subject to approval
3. A160/A180 Immingham
Grimsby and Immingham
Scheme announced in June 2013 and due to open in Autumn 2016. Scheme cost approximately £88 million
4. M271 / A35 Redbridge roundabout upgrade
Southampton Scheme announced in December 2014 and due to start construction by end 2019/20 – subject to approval
5. A20 Access to Dover Dover Construction started February 2016
6. M25 Junction 30 London Gateway/ Tilbury
Scheme already in construction at a cost of approximately £80 million
7. M2 Junction 5: improvements
Medway Construction is proposed to start in 2019
8. A19 Norton to Wynyard
Tees Port £75-128m scheme proposed to start construction in 2020
9. A14 Cambridge to Huntingdon
Felixstowe £1.2-1.8bn scheme due to start construction in 2017
10. A12 Chelmsford to Colchester
Felixstowe £100-250m scheme due to start construction in 2020
The above ten schemes have a direct role in supporting road freight access improvements to the main ports, however it should be noted that other schemes on the wider SRN network will also support the distribution of road freight to and from ports. Future schemes on the wider network should also highlight the potential supporting role in providing access to these key gateways. Atkins’ work for the DfT on the Last Mile Study (2016) further explored these issues (See Section 4).
In addition, the ‘Take a break road users’ views about roadside facilities’ (July 2016) by Transport Focus further highlighted the key concern of inadequate parking capacity for HGVs and the need for investment in more facilities within close proximity to the SRN.
3.2. Airport Investment and Expansion Plans
A summary of airport expansion and investment plans is outlined below:
Heathrow – Heathrow is currently running at 98% of its capacity. In October 2016 the Government endorsed the recommendation of the Airports Commission to expand Heathrow. It is estimated that the opening of a third runway at Heathrow could accrue at least £100 billion to the UK economy, protect the existing 110,000 local jobs and create 123,000 new jobs across the UK.
Gatwick – Following the Government’s decision on expansion at Heathrow, the investment plans at Gatwick Airport are to be reviewed. An additional runway at Gatwick was estimated to create an extra 22,000 jobs by 2050, contributing £1.7 billion per year to the local and regional economy.
Stansted – Manchester Airport Group reported to the Airports Commission that Stansted would be a more cost effective alternative for airport expansion in the south east of England. Plans were submitted proposing a £10 billion spend in order to turn the airport into a four runway hub. If developed as a hub airport Stansted could potentially handle up to 160mppa. Stansted now plans to apply to Government to lift restrictions on passenger numbers from 35million to 42 million passengers and eventually build a second runway. This growth in passengers could lead to between £400m and £500m of investment in Stansted to expand its terminal facilities to accommodate more travellers.
Manchester Airport – The 2015 draft Sustainable Development Plan outlines the approach to expand the airport to accommodate 55 million passengers. The airport expects to see large increases in

International gateways and the SRN
19
employment and has reserved an additional 40 hectares of land to cope with growth. Adjacent to the airport is Airport City, an £800m investment which will include new on-site logistics, manufacturing, office and leisure facilities and will be the first airport city in the UK. The site is one of the largest property developments in the UK. The area has been designated an Enterprise Zone and therefore benefits from reduced business rates. There are also proposals for a HS2 station at Manchester Airport.
Birmingham Airport / UK Central – the airport is at the centre of proposals for UK Central which includes plans for a 140 hectare mixed-use development in the area between the NEC/Birmingham Airport campus and the HS2 interchange. When HS2 is constructed, UK Central will be within a 40-minute journey time of central London by 2026.
East Midlands Airport – The Airport’s strategic plan envisages growing annual passengers from 4 to 10 million by 2030, which will include car park and terminal expansion. The airport also believes that it can grow to handling 1.2 million tonnes of cargo per year.
3.2.1. Proposed Highway schemes to support Airport Growth
A number of highway improvement schemes proposed to support growth at airports. These schemes will enhance access to five of the seven busiest airports in England:
1. A556 Knutsford to Bowdon: replacement of the A556 between the M56 and the M6 with a grade separated dual carriageway, including a bypass around Mere, improving a road that serves as the main southern access to Manchester and the airport.
2. M56 Junctions 6-8 (Manchester Airport to A556): upgrading to Smart Motorway including hard shoulder running. Together with improvements to the A556, M6 Junction 19 and M6 Smart Motorway this forms part of a comprehensive upgrade to Manchester's southern access.
3. M1 Junctions 23A-24 (A453, East Midlands Airport): upgrade to Smart Motorway including hard shoulder running, to link with previously announced Smart Motorway scheme on the M1 Junction 24 to Junction 25.
4. M1 Junctions 24-24A improvement (A453 / A50, East Midlands Airport): Developer-funded upgrade to the M1 to link junctions 24A and 24, with a direct link from the A50 to the southbound M1 for the first time.
5. M1 Junctions 24 (A453, East Midlands Airport) and Junction 25 (A52 between Nottingham and Derby): upgrading to Smart Motorway, including hard shoulder running.
6. M42: Junction 6 (Birmingham Airport): upgrading the junction to allow for better movement of traffic on and off the A45, supporting access to the airport and preparing capacity for the new HS2 station.
7. M4 Heathrow slip road Junction 4 and 4a (access to Heathrow Airport): improved access to Heathrow Airport through improved pinch point signing and signals; underpass for non-motorised users and local environmental mitigation.
8. M4 Junction 3 (Heathrow, Hayes, Harrow & Hounslow) to Junction 12: upgrading to Smart Motorway.
9. M25 Junction 10 (A3) to Junction 16 (M40 interchange): upgrading to Smart Motorway including plans to widen the M25.
10. M23: Junction 8 (M25 interchange) to Junction 10 (Crawley): upgrading to Smart Motorway, improving connections to Gatwick Airport.
Table 3-2 summarises the status of the current schemes. The planned highway investments will contribute towards realising airport growth plans and associated economic benefits. The proposed schemes should contribute to supporting the growth plans at five of the eight airports. However, given the scale of investment planned at some of the airports, longer term investment in the SRN is likely to be required in the vicinity of all of the seven airports dependent on the SRN. This could particularly be the case for the SRN in the vicinity of Heathrow and Manchester airports.

International gateways and the SRN
20
Table 3-2 SRN Highways Schemes supporting Airport Growth
Scheme Airport served Status
1 A556 Knutsford to Bowdon Manchester Scheme already under construction
2 M56 Junctions 6-8 Manchester Scheme announced in June 2013 and due to start construction by end 2019/20 – subject to approval
3 M1 Junctions 23A-24 East Midlands Scheme announced in December 2014 and due to start construction by end 2019/20 – subject to approval
4 M1 Junctions 24-24A improvement:
East Midlands Developer-funded upgrade.
5 M1 Junctions 24-25 East Midlands Schemes announced in June 2013 and due to start construction by end 2019/20 – subject to approval
6 M42 Junction 6 Birmingham Scheme announced in December 2014 and due to start construction by end 2019/20 – subject to approval
7 M4 Heathrow slip road Heathrow Scheme announced in December 2014 and due to start construction by end 2019/20 – subject to approval
8 M4 Junctions 3-12 Heathrow Work planned to start by March 2017
9 M25 Junctions 10-16 Heathrow Scheme under development
10 M23 Junctions 8-10 Gatwick Scheme announced in June 2013 and due to start construction by end 2019/20 – subject to approval

International gateways and the SRN
21
Gateway Connectivity Issues
4.1. DfT Last Mile Study
The Last Mile study undertaken by Atkins for the DfT (2016) identified the following conclusions:
The quality of connectivity (measured in terms of journey time variability on the links providing access from gateways to the Strategic Road network) varies from location to location, with the highest levels of variability at gateways served by surface access links with high levels of mixed trip purposes;
Highways England route performance data highlights that there are network performance issues on routes that provide an important function in connecting to gateways;
Issues with the quality of the ‘last mile’ of connectivity are not uniformly evident at gateways. In some cases, congestion at points on the network more remote from the gateway are as significant as the performance of the network immediately adjacent to the gateway;
Particular issues of congestion and reliability are experienced, as may be expected, at gateways located in the larger urban conurbations, where road space is shared across many competing uses;
For some gateways the resilience of the surface access network (for instance the availability of alternative routes at times of incident) is as important as the quality of the ‘last mile’ network;
Good quality connectivity was cited by stakeholders as of high importance at all gateway locations, irrespective of the profile of gateway users (freight commodity, or trip purpose). Connectivity issues were cited as a constraint to growth at a number of locations, impacting not just in terms of gateway users, but also on staff and on the efficient operation of gateway related activities;
While network operational performance was highlighted as an issue by most stakeholders, this was not generally related by stakeholders to the question of who is responsible for managing the network;
On the other hand a number of stakeholders highlighted issues around the planning process, and complexities and constraints around responsibilities and funding for scheme delivery; and
The types of connectivity problems are diverse and usually relate to the specific characteristics of each gateway. Whilst common themes can be identified, there is no evidence of a single overriding issue calling for a single specific response.
The study confirmed the importance to stakeholders of improved connectivity to support growth, although potential interventions are diverse, reflecting the specific nature of the connectivity challenges at the different gateways.

International gateways and the SRN
22
Conclusions
The UK, as an island nation, is critically dependent on its ports, airports and the Channel Tunnel, and patterns of global trade strongly influence the roles of these gateways in the UK economy. The SRN plays a critical role in connecting these gateways to the wider UK.
5.1. Ports
The UK ports sector handles 95% of UK trade by volume and 75% by value. It generates £9.9 billion in direct GVA and directly supports almost 140,000 jobs (£19 billion GVA and 470,000 jobs including indirect and induced effects)1.
The ten busiest ports in England, based on tonnage handled in 2014, are:
1. Grimsby & Immingham 2. London (including Tilbury and London Gateway) 3. Tees and Hartlepool 4. Southampton 5. Liverpool 6. Felixstowe 7. Dover 8. Hull & Rivers Hull and Humber 9. Bristol 10. Medway
Table 5-1 sets out a summary of the significance of each port and development and investment plans.
Table 5-1 Significance of Ports and Investment Plans
Felixstowe
Ranked 1st for value of imports and exports and 6th for tonnage
Investment led growth through development plans at the port
Investment proposed on the wider SRN, eg A14 and A12
Southampton
Ranked 2nd for value of imports and exports and 4th for tonnage
Demand led growth based on a forecast increase in port traffic
M271 / A35 Redbridge roundabout upgrade to facilitate some growth – subject to approval
Dover
Ranked 3rd for value of imports and exports and 7th for tonnage
Demand led growth based on a forecast increase in port traffic
A20 Access to Dover to facilitate some growth
Grimsby & Immingham
Ranked 4th for value of imports and exports and 1st for tonnage
Demand led growth based on a forecast increase in port traffic
A160/A180 Immingham improvements to facilitate growth
London
Ranked 5th for value of imports and exports and 2nd for tonnage
Significant investment driven growth through further developments at London Gateway and Tilbury ports
M25 Junction 30 (A13) to facilitate some growth
Liverpool
Ranked 6th for value of imports and exports and 5th for tonnage
Significant investment driven growth through Liverpool 2 and wider LCR developments
A5036 Port of Liverpool access to facilitate growth – subject to approval
Tees and Hartlepool
Ranked 7th for value of imports and exports and 3rd for tonnage
Demand led growth based on a forecast increase in port traffic
Potential investment required in the SRN including plans on A19
Hull & Rivers Hull and Humber
Ranked 8th for tonnage and 8th for value of imports and exports
Investment driven growth through development plans at the port
A63 Castle Street access to facilitate growth – subject to approval
1 Oxford Economics Report for Maritime UK, January 2015

International gateways and the SRN
23
5.2. Airports
The aviation sector and airports provide a significant benefit to the UK economy. It has been estimated that the sector supports 920,000 jobs and contributes almost £50 billion to the economy (3.6% of UK GDP) and £8 billion tax revenues2. Effective air connectivity is critical for business in connecting to global destinations and for the transport of high value freight. In addition, millions of people use airports every year for holidays and to visit friends, supporting the visitor economy, which contributes 9% of UK GDP.
The eight busiest airports in England, based on total air transport movements in 2015, are:
1. Heathrow 2. Gatwick 3. Manchester 4. Stansted 5. Luton 6. Birmingham 7. London City 8. East Midlands
Table 5-2 sets out a summary of the significance of each airport and development and investment plans.
Table 5-2 Significance of Airports and Investment Plans
Heathrow
Main airport for passengers and freight in UK
Third runway proposals are forecast to generate significant economic benefits
Smart motorways plans on M4 and M25 plus M4 Heathrow slip road to facilitate some growth – subject to approval
Gatwick Ranked 2nd for passengers and 5th for freight
Third runway could generate high economic benefits
M23 Junctions 8-10 to facilitate some growth – subject to approval
Manchester
Ranked 3rd for passengers and 4th for freight
Investment to increase passenger capacity and Airport City could generate significant economic benefits
A556 Knutsford to Bowdon / M56 Junctions 6-8 to facilitate some growth
Stansted Ranked 4th for passengers and 3rd for freight
Investment planned to accommodate passenger growth
Potential investment required in the SRN
Birmingham
Ranked 6th for passengers and 7th for freight
Investment to increase passenger capacity and UK Central could generate significant economic benefits
M42 Junction 6 to facilitate some growth – subject to approval
East Midlands
Ranked 8th for passengers and 2nd for freight
Passenger growth to double and 4x more freight by 2030, which could generate high economic growth
M1 Junctions 23A-24, M1 Junctions 24-24A and M1 Junctions 24-25 to facilitate some growth – subject to approval
Luton Ranked 5th for passengers and 6th for freight
Passenger led growth demand
Potential investment required in the SRN
London City Ranked 7th for passengers and 8th for freight
Passenger led growth demand
Not directly connected to the SRN but reliant on M25 east
2 Economic Benefits from Air Transport in the UK, Oxford Economics, 2011

International gateways and the SRN
24
5.3. Key Findings
This review highlights the following key findings:
Ports serve manufacturing sectors and are key inter-modal points for the logistics and distribution sector. The ports are all highly dependent on road connectivity for the inward and outward movement of freight. Ports are also significant employment areas.
Overall the ports are well served by the SRN. In some cases this is due to being immediately adjacent to large centres of population, e.g. Liverpool, Hull, Southampton and Bristol. The ports more remote from major cities, such as Immingham and Felixstowe, are also well served.
In the vicinity of some ports, congestion is causing increased travel times and reduced journey time reliability, which is increasing freight costs. This can diminish the competitive advantage of parts of the UK and reduce the effective catchment area of the ports. SRN schemes are under construction and in development to solve existing issues and manage increased port traffic in the future.
Significant private sector investment is taking place in UK ports, including London Gateway, Liverpool, Felixstowe, Hull, Teesport and Dover. The performance of the SRN could constrain these investments. Although there are current programmed investments to improve capacity on access routes to ports, there will be an ongoing requirement to ensure that there are effective operating conditions on the routes to the ports as traffic grows.
Port-centric developments (planned at some of the above locations, in particular London Gateway) and port capacity enhancements (eg Liverpool 2), have the potential to reduce traffic on the SRN. The former by moving the supply chain closer to ports and the latter by imports and exports entering the country closer to their final destination.
Effective air connectivity is essential for global connectivity for businesses, the transport of high value freight and for tourism, in particular the UK visitor economy. Airports are also significant employment locations. Airports are key to fostering economic activity by encouraging international commerce and tourism as well as generating employment. Airports can therefore play a leading role in the economic development of a region, in addition to the nation as a whole.
Whilst more people are accessing airports by public transport there is a need for effective access to airports from the road network, for both passenger and freight movements. Airports are located in very busy parts of the SRN, with high traffic flows and higher levels of congestion. The major airports have wide population catchment areas that are influenced by the journey times to / from the airport. Congestion in the vicinity of an airport and on the wider network can reduce the effective catchment area and therefore the competitiveness of an airport. It will be important to ensure that the SRN maintains a high level of service to ensure reliable surface access to these airports, for both passenger and freight movements.
Significant airport expansion programmes are planned in the South East, Midlands and North, most notably at Heathrow. All the airport expansion proposals are expected to generate significant additional demand on the SRN. This investment could be constrained if the SRN is not able to facilitate the additional travel demand. Although there are current programmed investments to improve capacity on access routes to the airports, there will be an ongoing requirement to ensure that there are effective operating conditions on the SRN in the vicinity of the major airports, as traffic grows.

International gateways and the SRN
25
Appendix A. Port Case Studies
This appendix provides an analysis of key ports across England. Each port is discussed in turn and each section is structured as follows:
1. Overview 2. Access 3. Demand Analysis 4. Future Development 5. Future Schemes 6. Economic Impact 7. Access/ connectivity issues It should be noted that some gateways only include the appropriate sections and thus might not have all seven headings.

International gateways and the SRN
26
A.1. Grimsby Port & Immingham Port
A.1.1. Overview
The Ports of Immingham and Grimsby are owned and operated by Associated British Ports (ABP). The ports handle containers, RoRo (Roll-on/Roll-off), ferries, and specialise in handling forest products and a range of other bulk commodities. Immingham Port and Grimsby Port are located on the southern side of Humber Estuary approximately 12km and 24km downstream.
The Ports provide excellent access to global trade routes as they are located in a prime location, in the deep waters of the River Humber. The Port of Immingham is identified by the UK Government as a key international gateway3 and is a key attractor of international trade in the Yorkshire and Humber region.
As reported in a 2015 Business Research Study by Atkins, approximately 85% of Toyota cars produced in the Midlands are exported to Europe via the Port of Grimsby.
Figure A-1 Overview plans showing the location of Grimsby and Immingham Ports
3 Port of Immingham Masterplan. 2010 – 2030. https://www.nelincs.gov.uk/wp-content/uploads/2016/02/PortOfImminghamMasterplan2010-2030.pdf

International gateways and the SRN
27
A.1.2. Access
The A180 is the main access route for both Immingham and Grimsby Docks, with the A160 providing a dualled spur to Immingham as far as the last roundabout before the port entrance. The road continues as single lane until the port. The A180 provides dual carriageway access to a roundabout roughly 350 metres from the entrance to Grimsby Docks. The A180 connects to the A15 and M180. Immingham port has freight rail connections, with 260 rail freight movements per week from the port.
A.1.3. Operations and Demand Analysis
Note: Values are reported for the combined operation of both Grimsby Port and Immingham Port
All traffic: 59,370,000 tonnes pa (2014)
Foreign/Domestic: 53,418,000/5,952,000
Passengers: 89,000 pa (2014)
Table A-1 Grimsby and Immingham Ports Traffic by Cargo Type, 2013-2014, DfT (in thousands)
Cargo Type 2013 2014 % Change
Liquid bulk 22,369 20,851 -7.28
Dry bulk 23,945 21,320 -12.32
Other general cargo 788 951 17.07 LoLo containers 1,008 1,459 30.93
Roll-on /Roll-off 14,503 14,789 1.93
Total 62,614 59,370 -5.46
Operations as a % of Total UK Major Ports 13% 12% -0.66%
A.1.4. Economic Impact
Immingham Port’s industry makes a major contribution to the UK’s economy. A study published by Oxford Economics in May 2011 estimated that the sector directly employed 112,000 people and in 2009 contributed around £6.9 billion to GDP and around £3 billion in tax revenues4. The Port of Immingham directly employs
4 The Economic Contribution of Ports to the Impact of the UK’s Maritime Services Sector UK Economy, Oxford Economics (May 2011)

International gateways and the SRN
28
around 4,700 people and 15,000 indirectly. Total disposable income arising from port dependent employment is estimated to be £226 million.
A.1.5. Access/Connectivity Issues
The A180 is the main access road for Grimsby and Immingham Docks and extends for approximately 16 miles. The annual average delay on this road was almost 9 seconds per vehicle mile from April 2014 to March 2015. The proportion of HGVs is higher on links to the west with 18.8% HGVs whilst the proportion of HGVs on links to the east was 14.9%.
The A160 provides direct access to Immingham Docks from the A180. The section of the A160 that was selected to analyse traffic data is 2.75km long. The annual average delay was around 25 seconds per vehicle mile. The annual average HGV proportion on this road was almost 70%, which is higher than any other port analysed for this report.
Figure A-2 Annual Average SRN delay around Humber Estuary Ports (April 2014-March 2015)

International gateways and the SRN
29
A.2. Port of Tilbury & London Gateway Port
A.2.1. Overview
Owned by Forth Ports, the Port of Tilbury is London's major port, handling the full range of cargoes with specialist expertise in the handling of paper and forest products, containers and RoRo, grain and bulk commodities and construction and building materials.
The South East area LEP identifies Port of Tilbury as a key component of the area’s current importance as a logistics hub for London. The LEP identifies logistics as a growth area with 1,200 jobs expected to be created as a result of expansion at the port (LEP, 2014).
London Gateway is a development on the north bank of the River Thames in Thurrock, Essex, 30 miles (48 km) east of central London. It comprises a new deep-water port, which is able to handle the biggest container ships in the world, as well as one of Europe’s largest logistics parks.
Figure A-3 Overview plans showing the location of Port of Tilbury and London Gateway Port

International gateways and the SRN
30
A.2.2. Access
In the case of Tilbury, the A1089 provides direct access on a dualled road as far as the entrance to the port in the north of complex. The A1089 connects to the A13 and then the M25 at junction 30. Freightliner operates five daily freight rail services from the port serving Birmingham, Bristol, Coatbridge, Felixstowe, Leeds, Liverpool and Manchester. London Gateway is accessed via the A1014 and then the A13 and has the UK’s largest port rail terminal with hi-cube access to the country’s major rail hubs.
A.2.3. Operations and Demand Analysis
Note: Values are reported for the combined operation of both the Port of Tilbury and London Gateway.
All traffic: 44,489,000 tonnes pa (2014)
Foreign/Domestic: 34,973,000/9,516,000
Inward/Outward: 37,490,000/6,999,000
Table A-2 Port of London (incl Tilbury and London Gateway) Traffic by Cargo Type, 2013-2014, DfT (in thousands)
Cargo Type 2014 2013 % Change
Liquid bulk 12,829 12,573 -2.03
Dry bulk 12,716 11,577 -9.84
Other general cargo 2,029 3,291 38.36
LoLo containers 9,112 8,162 -11.64
Roll-on /Roll-off 7,804 7,603 -2.65
Total 44,489 43,205 -2.97
Operations as a % of Total UK Major Ports 9.05% 8.79% -0.26%
A.2.4. Future Development
The South East LEP Growth Deal and Strategic Economic Plan identifies the south of the region as a hub of freight transport and logistics, with both Tilbury and DP World located in the area. The LEP predicts growth at both ports and in the wider logistics industry, including 1,200 extra jobs at Tilbury (LEP, 2014).

International gateways and the SRN
31
Port Expansion
Forth Ports has purchased land adjacent to the port formally occupied by the Tilbury power station. The expansion on the site will represent a 25% increase in the port’s size (Forth Ports, 2016).
London Distribution Park is currently nearing completion on a 70 acre site on the other side of the A1089 from the port. The site is accessed from the roundabout to the north of the main port entrance.
A.2.5. Future Schemes
RIS Scheme: M25 Junction 30
Comprehensive expansion of the junction between the M25 and A13, including the introduction of free-flowing links for traffic from the southbound M25 to the eastbound A13 (Highways England).
DP World Port
The port is opening in phases and will provide additional port capacity in the area. A third berth opens in the second half of 2016 - enhancing the port's ability and capacity.
A.2.6. Access/Connectivity Issues
The A1089 provides direct access to Port of Tilbury. Alternative routes are not viable due to routes being indirect and using lower class roads. As there is only one access, the highway network lacks resilience.
The key issue regarding highway access to both ports is congestion on the M25. Whilst being in proximity to the M25 offers excellent linkages, the high traffic flows mean that delay and congestion can be common and affect goods travelling to and from the ports. Problems are anticipated to increase over the next few years as growth at the ports start to materialise.
Traffic Conditions in the Vicinity of the Port of Tilbury
The HGV proportion of traffic on the A1089 has an annual average of 17.5%. The highest proportion of HGVs occurs during the AM peak on northbound links of the A1089 with 24.7%.
The average annual delay on this road is 8.5 seconds per vehicle mile with peak delay experienced southbound during weekday daytimes at 9.74 seconds.
The annual average HGV proportion on the link is 16% which is 1.5% lower than the entire A1089. The average delay on this link is 9.4 seconds which is slightly higher than the A1089 average.
The A13 links the A1089 to the M25, and this is therefore also a significant link for the Port of Tilbury. The average HGV proportion is 6.2%, which is relatively low compared to the A1089. The delay experienced on the A13 is, however, higher than that on the A1089 with an annual average of 15.4 seconds and an AM peak average of 30.1 seconds on links to the west leading to the M25.

International gateways and the SRN
32
Figure A-4 Annual Average SRN Delay around London Ports, April 2014 - March 2015

International gateways and the SRN
33
A.3. Southampton
A.3.1. Overview
The Port of Southampton is owned and has been operated by Associated British Ports since 1982. The Port is a natural deep-water harbour and is the UK’s most productive container port. The Port was built to handle the biggest ships in the world and is home to the new 500m deep-water quay SCT5.
Figure A-5 Overview plans of Port of Southampton at a local and a regional scale

International gateways and the SRN
34
A.3.2. Access
The Port is less than two miles from the M27 and has direct rail links to the main railway network for both freight and passenger trains. The Port of Southampton is also served by Southampton Airport and is also close to Gatwick and Heathrow Airports.
The Port is in a strong strategic location, only 100 miles from mainland Europe and close to international shipping lanes.
A.3.3. Operations and Demand Analysis
All traffic: 36,688,000 tonnes pa (2014)
International/Domestic5: 32,219,000/4,466,000 tonnes (2014)
Passengers6: 1.7 million cruise passenger per year, on average
Table A-3 Southampton Port Traffic by Cargo Type, 2013-2014, DfT (in thousands)
Cargo Type 2013 2014 % Change
Liquid bulk 24,083 23,014 -4.64
Dry bulk 1,616 1,993 18.93
Other general cargo 189 40 -376.24
LoLo containers 8,129 9,583 15.17
Roll-on /Roll-off 1,780 2,058 13.52
Total 35,797 36,688 2.43
Operations as a % of Total UK Major Ports 7.46% 7.28% -0.18%
A.3.4. Future Development
Southampton Approach Channel Dredge
The Southampton Approach Channel Dredge (SACD) involves selective deepening and widening of the navigation channel at various locations within Southampton Water and the Solent7. A deepened and widened channel will provide a number of benefits for the Port including:
- Improvement of the tidal access window for deeper draughted vessels;
- Reduction in congestion in the approaches to the Port;
- Increased ability for vessels to pass in the channel;
- Ability to handle larger vessels at the Port; and
- Enhancement of navigational safety.
A.3.5. Economic Impact
Southampton handles one fifth of the UK’s trade with non-EU countries by value and is the UK’s premier international maritime gateway. The Port supports around 15,000 jobs and contributes approximately £1 billion to the UK economy. Furthermore, it is at the heart of the Solent maritime economy, a sector which it is estimated supports 77,000 jobs and is calculated to generate a total GDP of £5.5 billion8.
5 Table PORT0106 Source: https://www.gov.uk/government/statistical-data-sets/port01-uk-ports-and-traffic 6 http://www.southamptonvts.co.uk/Port_Information/ 7 http://www.southamptonvts.co.uk/Port_Information/Development_Projects/Approach_Channel_Dredge/ 8 Solent Waterfront Strategy, South East England Development Agency, Marine South East, Partnership for Urban South Hampshire (2007)

International gateways and the SRN
35
A.3.6. Access/Connectivity Issues
Most of the delay on the approaches approaching the port is along the M27, close to Southampton Airport and at junction 9 of the M3 with the A34. The only section of the SRN that does not experience significant delays is the M3 slip roads at junction 14 where the average delay is under 5 seconds per vehicle per mile.
Figure A-6 Annual Average SRN Delay around Port of Southampton, April 2014 - March 2015

International gateways and the SRN
36
A.4. Port of Liverpool
A.4.1. Overview
The Port of Liverpool is owned by Peel Ports and handles automotive, container, cruise, energy, Forest, Liquid Bulk, Metal, and RoRo shipping. The port is undergoing a major expansion, with a new deep water facility for container shipping.
Figure A-7 Overview plans of Liverpool SUPERPORT at a local and a regional scale

International gateways and the SRN
37
A.4.2. Access
The Port is surrounded by the city of Liverpool with dual carriageways providing highway access from the east by the A5036 and from the north and south by the A565. The A5036 dual carriageway connects directly to the motorway network at the M58 / M57 junction.
It is possible to connect to the motorway network using the A565, although the road is single carriageway to the north and south of the port for short stretches. To the south of the port the M53 can be accessed via the A59 Kingsway Tunnel
As part of the Liverpool2 expansion, there will be a new integrated rail terminal to handle increased demand for container transportation.
A.4.3. Operations and Demand Analysis
All traffic: 30,996,000 tonnes pa (2014)
Foreign/Domestic: 26,380,000/4,616,000
Passengers: 124,000 pa (2014)
Table A-4 Port of Liverpool Traffic by Cargo Type, 2013-2014, DfT (in thousands)
Cargo Type 2013 2014 % Change
Liquid bulk 10,976 10,572 -3.81 Dry bulk 7,991 7,564 -5.66
Other general cargo 902 957 5.74
LoLo containers 4,637 4,852 4.43
Roll-on /Roll-off 6,644 7,051 5.78
Total 31,149 30,996 -0.50
Operations as a % of Total UK Major Ports 6.33% 6.30% -0.03%
A.4.4. Future Development
Liverpool2
Liverpool2 is a new deep water container terminal, which will be able to accommodate 95% of the world’s global container vessel fleet. Peel Ports hopes that it will empower Liverpool to become the UK’s container gateway and transhipment hub for Ireland (Peel Ports).
Economic Impact
The Superport scheme (of which Liverpool2 forms part) predicts a total GVA uplift of £18.2bn and an additional 30,000 jobs by 2030.
A.4.5. Future Schemes
A5036 Port of Liverpool access
Highways England is currently consulting on options to improve highway access to the Port of Liverpool and ease congestion on the A5036. The project is at an early stage and may involve either junction improvements or a relief road.
Liverpool2: Liverpool2 could feature a new rail terminal, with 10 departing freight services per day.
A.4.6. Access/Connectivity Issues
The A5036 is the main link serving the Port of Liverpool. This link is approximately 3 miles long and runs from the northern entrance of the port to the M57. The data for the A5036 selected links have been compared to the annual average traffic data on the M57.

International gateways and the SRN
38
Between April 2014 and March 2015 the traffic on the A5036 had an average proportion of HGVs of 8.3%. The annual average delay on this link is 17 seconds but this is higher during peak periods. AM peak westbound traffic had delays of 29 seconds per vehicle and PM peak eastbound traffic has delays of 28 seconds per vehicle.
The M57 is a 15.5km orbital road which links the M62 to the M58. The proportion of HGVs on this road is lower than that on the A5036 with a 6.4% annual average. The delay on this link is significantly lower than that on the A5036 with only 3.5 seconds average delay per vehicle mile. The highest delays on the SRN are on the M62 in the Warrington area.
Figure A-8 Annual Average SRN Delay around Port of Liverpool, April 2014 - March 2015

International gateways and the SRN
39
A.5. Port of Felixstowe
A.5.1. Overview
The Port of Felixstowe is the largest container port in the UK. It is a major centre for goods entering the “golden triangle” area of the Midlands which hosts much of the country’s major distribution centres.
Figure A-9 Overview plans of Port of Felixstowe at a local and a regional scale
A.5.2. Access
The A14 dual carriageway provides direct access to Port of Felixstowe.

International gateways and the SRN
40
Felixstowe has extensive rail connections, with 62 daily arrivals and departures operated by three firms, DB Schenker Rail (UK) Ltd, Freightliner Ltd and GB RailFreight. There are direct connections to 16 destinations within the UK.
A.5.3. Operations and Demand Analysis
All traffic: 28,127,000 tonnes pa (2014)
Foreign/Domestic: 27,292,000/835,000
Passengers: 9,000 pa (2014)
Table A-5 Port of Felixstowe Traffic by Cargo Type, 2013-2014, DfT (in thousands)
Cargo Type 2013 2014 % Change
Liquid bulk 60 56 -6.79
Dry bulk 0 0 0.00
Other general cargo 5 4 -16.93
LoLo containers 23,469 25,102 6.51 Roll-on /Roll-off 2,680 2,964 9.59
Total 26,214 28,127 6.80
Operations as a % of Total UK Major Ports 5.33% 5.72% 0.39%
A.5.4. Future Development
Port Expansion
Hutchinson Ports plans to expand the port, including dredging to allow access to more of the port for some of the world’s largest container ships and the construction of a large logistics park to the North of the port.
Hutchinson has plans to build container facilities across the estuary from the main port at Harwich9. This will generate additional container capacity and involve improvement works on ten kilometres of the A120 trunk road, which services the town and port.
A.5.5. Future Schemes
RIS Scheme: A14 Cambridge to Huntingdon and A12 widening
The A14 proposals include a major new bypass of Huntingdon, widening of the existing A1 and A14 and improvements in Huntingdon town centre. Currently around a quarter of vehicles on the A14 are HGVs with the planned scheme enhancing access to the Port of Felixstowe.
The A12 is a major trunk road from London to Suffolk. Highways England plans to widen the section between Chelmsford and the A120, which should improve port accessibility to and from the South East10.
A.5.6. Access/Connectivity Issues
The Port of Felixstowe is relatively remote from the motorway network, but the A14 provides a dual carriageway link to the port entrance. The A14 is the strategic road that connects the Port of Felixstowe to surrounding areas and the wider SRN and runs for approximately 150km to the Midlands, starting at the Port of Felixstowe.
As there is only this one highway link, network resilience can be poor when incidents occur. The port is especially vulnerable to any issue with the Orwell Bridge at Ipswich. Proposals in the past for an Ipswich northern bypass would have added resilience, but have not progressed. The Orwell Bridge is approaching capacity and is in high demand due to there being no alternative routes for traffic through Ipswich.
9 Port, H. (n.d.). Retrieved from Harwich Port: http://www.harwich.co.uk/common/publications/documents/Bathside.pdf 10 UK Government. (2014). Retrieved from https://www.gov.uk/government/news/major-roads-investment-in-the-east-of-england
International gateways and the SRN
41
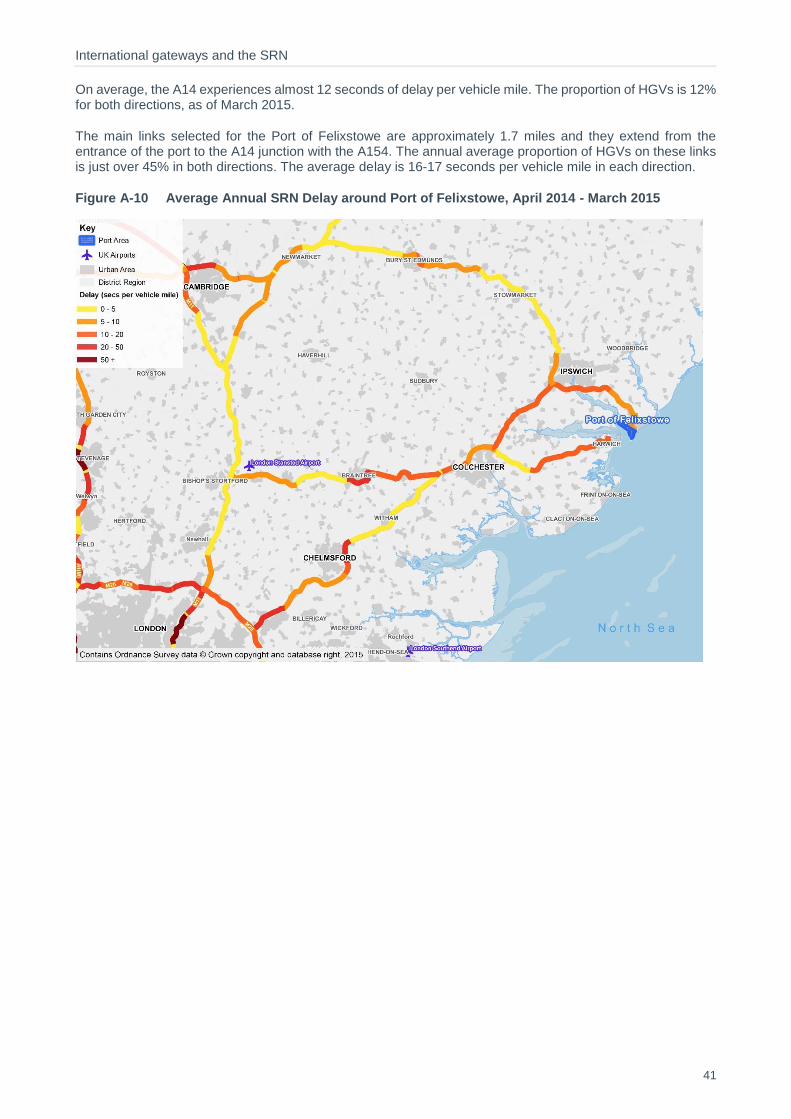
On average, the A14 experiences almost 12 seconds of delay per vehicle mile. The proportion of HGVs is 12% for both directions, as of March 2015.
The main links selected for the Port of Felixstowe are approximately 1.7 miles and they extend from the entrance of the port to the A14 junction with the A154. The annual average proportion of HGVs on these links is just over 45% in both directions. The average delay is 16-17 seconds per vehicle mile in each direction.
Figure A-10 Average Annual SRN Delay around Port of Felixstowe, April 2014 - March 2015

International gateways and the SRN
42
A.6. Port of Dover
A.6.1. Overview The Port of Dover is located at the eastern end of Dover. The Port of Dover is a major Roll-on Roll-off port connecting the UK to mainland Europe and is owned by Dover Harbour. The Port also functions as a passenger ferry terminal for ferries to France.
The South East LEP has committed to investment to allow for port expansion at Dover, including new cargo handling facilities as well as supporting junction improvements on the A20 to cope with growth at the port11.
Figure A-11 Overview plans of Port of Dover at a local and a regional scale
11 LEP, S. E. (2014). South East LEP Growth Deal. Retrieved from South East LEP: http://www.southeastlep.com/images/uploads/resources/SECTION_2_South_East_LEP_-_Growth_Deal_and_Strategic_Economic_Plan_WEB-2(1).pdf

International gateways and the SRN
43
A.6.2. Access
The Port is served by the A20 dual carriageway and the A2 trunk road. Both roads serve port entrances directly at roundabout junctions. The A20 continues towards the west where it becomes the M20 at Folkestone, connecting to the rest of the UK motorway network via the M25.
The section of the A2 connecting to the port has a 2+1 configuration, with two lanes northbound and one lane southbound. The road alternates between single and dual carriage way until it joins the motorway network at the M2.
A.6.3. Operations and Demand Analysis
All traffic: 27,605,000 tonnes pa (2014)
Foreign/Domestic: 27,605,000/nil
Passenger Traffic (cruise): 95,000 pa
Passenger Traffic (ferry): 13,286,000 pa
Table A-6 Dover Port Traffic by Cargo Type, 2013-2014, DfT (in thousands)
Cargo Type 2013 2014 % Change
Liquid bulk 0 0 0.0
Dry bulk 82 15 -81.70 Other general cargo 341 303 -12.68
LoLo containers 0 0 0.00
Roll-on /Roll-off 24,871 27,287 8.85
Total 25,295 27,605 8.37
Operations as a % of Total UK Major Ports 5.14% 5.61% 0.47%
A.6.4. Future Development
Port Expansion
The Port of Dover is investing in the Western Docks development (Dover Port). This development will include new berthing for small boats, but also new logistics and cargo handling facilities – adding to the road capacity requirements of the port.

International gateways and the SRN
44
A.6.5. Future Schemes
A20 Junction improvements
In order to facilitate port redevelopment, junction improvements are being carried out on the A20. Two roundabouts will be replaced with smart traffic lights in order to improve the flow of traffic. The scheme is being delivered through a partnership between Dover District Council and the Port of Dover12. The work is due to be completed by December 2016.
A.6.6. Access/Connectivity Issues
The port is heavily focused on RoRo operations, which can lead to severe traffic problems in times of disruption
to ferry crossings from the port. Kent police have introduced Operation Stack on the M20, which has knock on
negative impacts on the whole area and can affect vehicles using the Port of Dover.
Various lorry parking proposals have been made to replace Operation Stack, which would ease the congestion problems during port disruption. The current £250m proposal for lorry parking is some 23km from the port (Kent Business, 2016).
Alternative suggestions to the lorry park have included widening, through dualling the remaining single carriageway parts of the A2 (maintained by Highways England as far as the junction with the M2) to offer an alternative route, although there are no current plans identified by Highways England.
Traffic Conditions in the Vicinity of the Port of Dover The SRN traffic delay data highlights that the main approach routes to the Port of Dover do not experience significant delay. The main sections of the SRN, within the area, that experience high delay are the eastern side of the M25.
12 Council, D. D. (2016, April). Retrieved from Dover District Council: http://www.dover.gov.uk/Transport,-Streets--Parking/Transport--Streets/A20-junction-improvements.aspx

International gateways and the SRN
45
Figure A-12 Annual Average SRN Delay around Port of Dover, April 2014 - March 2015

International gateways and the SRN
46
A.7. Port of Bristol
A.7.1. Overview
Bristol is the only deep sea port in the UK with direct motorway and rail access from the port to all points of the compass. Located in South West England, the Port has easy access to South Wales and major cities as it is directly served by the SRN.
The Port of Bristol became a private asset in 1991 when it was acquired by The Bristol Port Company from the Council. Since then, over £495 million has been invested to improve facilities at the port13.
The Port of Bristol comprises two parts: Avonmouth – north of the River Avon, where the Avon enters the River Severn – and Royal Portbury Dock (RPD), south of the Avon. The entire dock estate is 2,419 acres, of which the useable area for port operations is 1,084 acres14. Approximately 37 million people, over 63% of the national population live within 250 kilometres of the Port. The large business and consumer market that falls within this radius includes the urban centres of the Midlands and London.
Figure A-13 Overview plans of Port of Bristol at a local and at a regional scale
13 Bristol Port Website: https://www.bristolport.co.uk/about-us/bristol-port-company-today 14 Bristol Economic Assessment.2004. http://www.swcouncils.gov.uk/media/SWRA/RSS%20Documents/Technical%20Documents/02.08_Bristol_Port_Economic_Assessment_Full.pdf

International gateways and the SRN
47
A.7.2. Access
The Port of Bristol has direct access to major roads including the M5, M49 and M4, which link the port to London, Birmingham and South Wales. The Port is also connected to the national rail network at Avonmouth and Royal Portbury Docks.
A.7.3. Operations and Demand Analysis
All traffic (freight only): 11,421,000 tonnes pa (2014)
Foreign/Domestic: 9,436,000/1,984,000 tonnes pa (2014)
Table A-7 Bristol Port Traffic by Cargo Type, 2013-2014, DfT (in thousands)
Cargo Type 2013 2014 % Change
Liquid bulk 2,400 2,370 -1.24
Dry bulk 6,724 7,266 7.46
Other general cargo 187 170 -10.04
LoLo containers 741 893 17.01
Roll-on /Roll-off 581 723 19.52
Total 10,633 11,421 6.90
Operations as a % of Total UK Major Ports 2.16% 2.32% 0.16%
A.7.4. Future Development
Deep Sea Container Terminal
The Bristol Deep Sea Container Terminal (DSCT) will bring the largest container vessels closer to UK markets by building three 400m berths with a depth of 18m.

International gateways and the SRN
48
Economic Benefits15
Bristol Port has an important role in redevelopment of the South West’s largest industrial centre and can reinforce that role through growth of new port facilities, as recognised in regional and local economic planning strategies.
Already a major employer with over 10,000 jobs directly or indirectly reliant on port-based businesses, the expansion will generate almost 1,800 new jobs - 1,500 by direct employment and the rest by economic multiplier effects. Some 360 new full time equivalent jobs are expected during the construction phase.
Studies by Bristol Port estimate that the proposed terminal will generate over £114m per year in the local economy through employment and multiplier linkages.
A.7.5. Future Schemes
South Bristol Link
The South Bristol Link is currently under construction and will connect South Bristol to the A38 (which itself connects to Bristol Airport) and A370 at Long Ashton. The A370 then connects to the A4 Portway through the Cumberland Basin and the M5 motorway at Avonmouth. This will significantly improve road connections from the M5 at Avonmouth to South Bristol.
A.7.6. Economic Impact
The Port of Bristol directly employs 575 people and there are also over 10,000 jobs in the South West that indirectly depend on the Port. The Port is located in a key location in the UK as there are around 40 million people living within a 250km radius. It also contributes more than £1 billion to UK GDP.
A.7.7. Access/Connectivity Issues
Four links were selected for examining access to the port, two in each direction on the M5 and A4 which have a total length of 2.89 km. The M5 links have a two-way annual average daily flow of 13,800 whilst the flow on the A4 links is lower at 8,880. On average, the A4 links have an annual average proportion of HGVS of 41.9%; the M5 links have just over half of this with 22.7%.
The M5 links are part of the SRN and directly serve the Port of Bristol as they are linked to the A4. The map below presents the annual average delay experienced on the SRN around the Port. The annual average delay on the M5 links is 8.2 seconds per vehicle mile. The annual average delay on the A4 links is 10.9 seconds per vehicle mile as an average of both directions, increasing to 13.2 seconds per vehicle mile during weekdays.
15 Bristol Port Website: https://www.bristolport.co.uk/trades/containers/deep-sea-container-terminal

International gateways and the SRN
49
Figure A-14 Average Annual SRN Delay around Port of Bristol, April 2014 - March 2015

International gateways and the SRN
50
A.8. Medway
A.8.1. Overview
Medway Ports include the Port of Sheerness and Chatham Docks which are both operated by Peel Ports. The Port of Sheerness became part of the Peel Ports Group in September 2005.
The Port of Sheerness is located at the head of the River Medway at the confluence with the River Thames in the Thames estuary. The Port handles in the region of between 1.5 and 2.0 million tonnes of cargo a year16. The Port of Sheerness has several key sectors, including trade cars, forest products, steel, containers and bulk cargoes17.
Figure A-15 Overview plans of Port of Sheerness and Chatham Docks
16Sheerness Port Masterplan – A 20 year Strategy for Growth: http://peelports.com/wp-content/uploads/2014/09/Sheerness-Master-plan-V6.pdf 17 Sheerness Port Masterplan – A 20 year Strategy for Growth: http://peelports.com/wp-content/uploads/2014/09/Sheerness-Master-plan-V6.pdf

International gateways and the SRN
51
A.8.2. Access
Port of Sheerness is located on the Isle of Sheppey, just off the A249 which provides a direct link to the motorway network by the M2. The A249 is the only main road that can be used to access this port.
Chatham Docks are located further west than Port of Sheerness, along the River Medway. The Docks are not directly joined to the SRN, however they are served by the A289 to the North West and the A231 in the south.
A.8.3. Operations and Demand Analysis
All traffic: 8,447,000 tonnes pa (2014)
Foreign/Domestic: 6,556,000/1,891,000 tonnes pa (2014)
Table A-8 Medway Port Traffic by Cargo Type, 2013-2014, DfT (in thousands)
Cargo Type 2013 2014 % Change
Liquid bulk 2,389 2,110 -13.23
Dry bulk 2,135 3,071 30.47 Other general cargo 1,486 1,521 2.33
LoLo containers 1,729 1,051 -64.55
Roll-on /Roll-off 645 693 7.00
Total 8,384 8,447 0.74
Operations as a % of Total UK Major Ports 1.70% 1.72% 0.01%
A.8.4. Future Development
Chatham Waters
This potential 26 acre development site will be located on a former naval dockyard along the Medway Estuary and within only 40 minutes of Central London. In 2013 Peel Ports Ltd were granted planning approval for the regeneration of this site. The first phase of this project has been completed which comprises new infrastructure to support the opening of a large superstore and a Technical College. The new development site is projected to create over 3,000 jobs as Peel Ports have a 10 year strategy in which over £1 billion will be invested in Chatham Waters over this period.

International gateways and the SRN
52
A.8.5. Future Schemes
Sheerness – Liverpool Rail Link
This was first introduced in the 20 year Masterplan Document for Peel Ports Ltd. The rail freight link would extend between Peel’s Northwest and Southeast ports.
A.8.6. Economic Impact
A socio economic study, Port of Sheerness Economic Impact Assessment, was undertaken by Atkins in July 2014. The study found that there are approximately 660 full time equivalent jobs that are directly reliant on the Port of Sheerness. It is estimated that the current total direct, indirect and induced turnover generated by the Port of Sheerness is approximately £183 million. The GVA directly generated by the Port of Sheerness is estimated to be approximately £41.4 million. The GVA generated directly and indirectly by the Port at a regional level is estimated to be £82.7 million.
A.8.7. Access/Connectivity Issues
The closest SRN links are just over 7km from Chatham Docks. The Port of Sheerness is linked to the A249 which is part of the SRN. The average delay experienced on the A249 link accessing Port of Sheerness is 11.5 seconds per vehicle mile.
The A249, running from Iwade to Queenborough and then to Sheerness, has a relative speed of 80-90% which suggests that traffic moves relatively smoothly on this road. The speed of traffic then decreases to under 50% of the speed limit on the road link where the A249 joins the M2. The A249 southbound link approaching M2 junction 5 has an annual average delay of over 30 seconds per vehicle mile.
The section of the M2 near Chatham Docks, between M2 junctions 1 and 3, experiences the lowest delay band of under 5 seconds per vehicle mile. However this rapidly increases as the M2 joins the A2, especially for westbound traffic towards Central London. The main sections of the SRN, within the area, that experience high delay are the eastern side of the M25, in the vicinity of the Thames crossings.
Figure A-16 Annual Average SRN Delay around Medway Ports, April 2014 - March 2015

International gateways and the SRN
53
A.9. Tees Port & Port of Hartlepool
A.9.1. Overview
Teesport and the Port of Hartlepool are both owned by PD Ports and are located within three miles of each other. The Port of Hartlepool is located in the North East of England with lock-free access to the North Sea. In recent years, the port has undergone large scale regeneration.
Teesport is located less than a mile from the mouth of River Tees and also has lock-free access to the North Sea. The Port handles about 5,000 vessels each year and around 40 million tonnes of cargo.
Figure A-17 Overview plans of Teesport and Port of Hartlepool at a local and regional scale

International gateways and the SRN
54
A.9.2. Access
The Port of Hartlepool has two primary routes, the A179 and the A689, both linked to the A19 dual carriageway, which is the main north-south route connecting the largest urban areas in the North East. The Port also has direct rail freight access. Both Durham Tees Valley and Newcastle International Airports are located within a short distance.
A.9.3. Operations and Demand Analysis
All traffic: 39,537,000 tonnes pa (2014)
Foreign/Domestic: 31,638,000/7,899,000 tonnes pa (2014)
Table A-9 Tees Port & Hartlepool Traffic by Cargo Type, 2013-2014, DfT (in thousands)
Cargo Type 2013 2014 % Change
Liquid bulk 19,179 20,886 8.17
Dry bulk 11,586 11,712 1.08
Other general cargo 3,365 3,258 -3.28
LoLo containers 1,772 2,029 12.65
Roll-on /Roll-off 1,738 1,652 -5.18
Total 37,641 39,537 4.80
Operations as a % of Total UK Major Ports 7.65% 8.04% 0.38%
A.9.4. Future Development
£35 million Quay Reconstruction
This project was completed in May 2016 and comprises the widening of a 550m wide deep water quay. The investment has created the capability to accommodate two fully-laden 235m long panamax vessels simultaneously in water 14.5m deep. The design of the quay will allow for easy widening in the future depending on customers’ demands.
A.9.5. Access/Connectivity Issues
Twelve SRN links were selected to represent road access to Teesport as this is directly linked to the SRN by the A1053 which then joins to the A174, along the A174 until its junction with the A19. The A174 links joining the A19 have the highest annual daily traffic flows. The westbound link experiences the highest annual average delay of 42 seconds per vehicle mile, 57.9 seconds during weekday daytime and over 82.7 seconds during the AM peak.

International gateways and the SRN
55
Figure A-18 Annual Average SRN Delay around Teesport and Port of Hartlepool, April 2014 – March 2015

International gateways and the SRN
56
A.10. Port of Hull & Rivers Hull and Humber Ports
A.10.1. Overview
Hull Port handles containers and RoRo traffic and specialises in handling forest products and a range of other bulk commodities.
Figure A-19 Overview plans of port of Hull at a local and a regional scale
A.10.2. Access
Hull port can be directly accessed by the A63 dual carriageway, the dual carriageway continues west from the Southcoates roundabout as the A1033, which can be used to access Eastern sections of the port. The A63 continues west as a dual carriageway until it meets the motorway network at the M62. The motorway network

International gateways and the SRN
57
can also be accessed to the south using the Humber Bridge / A15 dual carriageway which connects to the M180.
A.10.3. Operations and Demand Analysis
All traffic Hull: 10,925,000 tonnes pa (2014)
Foreign/Domestic Hull: 10,782,000/142,000
Passengers Hull: 929,000 pa (2014)
Table A-10 Hull Port and Rivers Hull & Humber Traffic by Cargo Type, 2013-2014, DfT (in thousands)
Cargo Type 2013 2014 % Change
Liquid bulk 10,486 10,923 4.00
Dry bulk 4,126 4,128 0.06
Other general cargo 1,594 1,746 8.70
LoLo containers 1,605 1,426 -12.50
Roll-on /Roll-off 2,773 2,687 -3.20
Total 20,584 20,911 1.56 Operations as a % of Total UK Major Ports 4.2% 4.3% 0.07%
A.10.4. Future Development
Green Port Hull
Green Port Hull is a plan supported by the local LEP to make Hull into a centre for offshore wind energy. The plan will see additional manufacturing opportunities around Hull and additional demand on the Port.
The plan includes the creation of Enterprise Zones around Hull and a total programme investment of £500 million (Green Port Hull).
Economic Impact
The Green Port Hull scheme is expected to increase the GVA contribution of the port by £300m per annum and the up-skilling of 1,900 local employees.
A.10.5. Future Schemes
A63 Castle Street Improvement
Highways England is currently planning to upgrade a 1.5km stretch of the A63 through Hull, which leads to the Port of Hull. The investment will include a new overpass junction. The scheme’s purpose is expressly stated as improving vehicular access to the Port of Hull. The current planned start date is March 2017.
A.10.6. Access/Connectivity Issues
There is typically congestion at peak times on the A63 through Hull towards the port, especially the section
between the A1165 roundabout junction and the Southcoats roundabout.
Port of Hull is served by the A1033 which is part of the SRN. The A1033 extends from the east of Hull past the port and then merges with the A63 at the Castle Street junction. The A63 and the A1033 were used to analyse the traffic composition and congestion on this 22km long road. The average annual delay on western links of the two roads is 19.6 seconds and 13.8 on eastern links. The statistics indicate that links moving traffic away from the port have severe congestion issues, with over 35.9 seconds delay per vehicle mile, when compared to links to the Port.
The proportion of HGVs varies between directions. Links to the east have an annual average HGV proportion of 4.6% and links to the west have a higher average of 7.8%.
The links that serve the port are along the A1033 from the Port to its junctions with the A63. The average annual proportion of HGVs on these links is around 3.4% which is lower than average on the A63. The average

International gateways and the SRN
58
annual delay on the selected links was slightly over 11 seconds which is again lower than the average on the A63.
Figure A-20 Annual Average SRN Delay around Port of Hull & Rivers Hull and Humber Ports, April 2014 - March 2015

International gateways and the SRN
59
Appendix B. Airport Case Studies
This appendix provides an analysis of key airports across England. Each airport is discussed in turn and each section is structured as follows:
1. Overview 2. Access 3. Demand Analysis 4. Future Development 5. Future Schemes 6. Economic Impact 7. Access/ connectivity issues It should be noted that some gateways only include the appropriate sections and thus might not have all seven headings.
B.1. Heathrow
B.1.1. Overview
Heathrow Airport is directly connected to the SRN by the M25 and M4 and has direct rail links to Central London via the Heathrow Express.
Heathrow Airport is managed and owned by Heathrow Airport Holdings Limited, formerly British Airports Authority. The airport extends for 1,227 hectares and has two runways. The daily average air transport movements in 2015 were 1,293.
Heathrow is home to 80 airlines which serve 185 destinations across 84 countries. The top three most popular destinations are New York, Dubai and Dublin.
Figure B-1 Overview Plans of Heathrow Airport at a local and a regional scale

International gateways and the SRN
60
B.1.2. Access
Heathrow Airport is an integrated transport hub which brings together several forms of transport including road, rail, and air transport.
The airport is well connected to the strategic road network as it has direct access to the M25 and M4, which are linked to the UK’s core motorways. Its direct access to major and local roads allows for frequent bus coach services to operate and more than 500,000 bus and coach movements in and out of Heathrow occur every year.
The airport is also served by National Express coaches which access all four terminals (Terminal 1 closed in 2015). The airport is also very well connected with national rail lines via Heathrow Express which takes only 15 minutes from central London.
Heathrow is also home to the Heathrow pod, which is a personal rapid transit system that operates through the 3.8km stretch of a dedicated guideway between Terminal 5 and the Terminal 5 Business Car Park.
B.1.3. Demand Analysis
Table B-1 Summary of Activity at Heathrow Airport, 2015
2015 Activity Summary Heathrow Total Operations as % of all UK airports
Air Transport Movements 472,131 21
Terminal Passengers 74,953,981 29
Transit Passengers 31,767 14
Freight (tonnes) 1,496,551 65
Mail (tonnes) 94,975 45

International gateways and the SRN
61
Table B-2 International and Domestic Freight, 2015 Summary Statistics
Internal and Domestic Freight 2015
Heathrow Heathrow operations as % of UK Total
EU Passenger 57,334 92
EU Cargo 38,473 11
Other International Passenger 1,358,788 88
Other International Cargo 40,185 16
Domestic Passenger 1,708 25
Domestic Cargo 63 0.1
Figure B-2 Passenger Mode Share to Heathrow Airport, 2014 CAA
Table B-3 Passenger Mode Share by Region to Heathrow Airport, 2014 CAA Passenger Survey
Region Private % Public % Other % Total Pax 000s
East Midlands 68.8 30.7 0.4 1,254
East of England 71.9 28.1 0 3,782
North East 35.7 64.3 0 69
North West 46.7 53.2 0.1 340
Scotland 17 83 0 109
South East 57.2 42.5 0.3 35,737
South West 60.5 39 0.5 3,161
Wales 49.7 48.9 1.4 829
West Midlands 68.3 31.5 0.2 1,153
Yorkshire And Humber 38.2 61.8 0 552 Total 58.6 41.0 0.3 46,986
Table B-4 Journey Purpose Percentage, 2014
Airport International business International leisure Domestic business Domestic leisure
Heathrow UK Foreign UK Foreign UK Foreign UK Foreign
9.8% 16.7% 25.2% 41.1% 2.5% 0.6% 2.9% 1.3%
58.6%
41.0%
0.3%
Private
Public
Other

International gateways and the SRN
62
B.1.4. Future Development
Crossrail Extension – Elizabeth Line
Crossrail Limited is building a new railway for London and the South East, running from Reading and Heathrow in the west, through 42km of new tunnels under London to Shenfield and Abbey Wood in the east. The project is building 10 new stations and upgrading 30 more, while integrating new and existing infrastructure. The £14.8 billion Crossrail project is currently Europe’s largest infrastructure project.
The new railway, which will be known as the Elizabeth line when services begin in 2018, will be fully integrated with London’s existing transport network and will be operated by Transport for London. New state-of-the-art trains will carry an estimated 200 million passengers per year. The new service will speed up journey times, increase central London’s rail capacity by 10% and bring an extra 1.5 million people to within 45 minutes of central London.
The following economic benefits have been highlighted as a result of this development:
£42bn benefit to the UK economy;
Better links between the capital’s major commercial and business districts - Heathrow, the West End, the City and Canary Wharf; and
55,000 full time jobs and 75,000 business opportunities during the construction of the new railway.
Heathrow Expansion – Third Runway
Heathrow is currently running at 98% of its capacity whilst airports in neighbouring European countries have spare capacity which allows them to add flights which connect to strategic growth markets such as China, India, Mexico and Brazil. In October 2016 the Government endorsed the recommendation of the Airports Commission to expand Heathrow. The opening of a third runway is estimated to generate at least £100 billion to the UK and protect the existing 110,000 local jobs as well as create 123,000 new jobs across the UK.
Costs are estimated at £15.6bn, of which £11.1bn is airport infrastructure, £0.9bn is surface access, and £3.6bn is community compensation and environmental mitigation. The £15.6bn would be privately funded. Government support for other surface access improvements would be required and this is currently estimated at £1.2bn.
The shift to the global economy in the next 40 years towards Asia, North America and Latin America will put Heathrow under pressure if its capacity is not increased as the current facilities will not be able to meet the demands of future growth, and a third runway is therefore important to address this need.
B.1.5. Future Schemes
Improving rail connectivity:
Network Rail continues to develop plans for a new Western Rail Access to Heathrow, and HS2 Ltd is developing Phases 1 and 2 of the new high speed rail line. There is also growing stakeholder support for the development of a Southern Rail Access to Heathrow, including a commitment in the National Infrastructure Plan to set up a new study to investigate this project.
B.1.6. Economic impact
The aviation and related activity at Heathrow Airport currently supports around 120,000 jobs and contributes £6.2 billion to the economy. At a UK level, it is estimated that Heathrow supports around 190,000 full-time equivalent (FTE) jobs across the UK and £9.7 billion in economic output (GVA). These jobs arise from activity on the Heathrow site, in the supply chain and as a result of the multiplier effects from consumption spending.
B.1.7. Access/connectivity issues
The selected links for Heathrow are on the A3113 between M25 junction 14 and A3044 and on the M4 between M4 junction 4A and junction 4.
On average, the traffic flow in both directions reaches just over 16,000 with an annual average proportion of 5% HGVs on the A3044. The annual average delay for both directions is 11.8 seconds with 14 seconds per vehicle mile on the western link.

International gateways and the SRN
63
The annual average flow on the M4 links is around 29,500 with a proportion of HGVs of 1.5%. The delay for these links is, on average, 9.7 seconds per vehicle mile.
There were severe delays experienced on the M4 of over 50 seconds per vehicle mile between Heathrow and centre of London.
Figure B-3 Annual Average Delay on the SRN serving Heathrow Airport, April 2014 to March 2015

International gateways and the SRN
64
B.2. Gatwick
B.2.1. Overview
Gatwick Airport is the world’s most efficient single runway airport and is the UK’s second largest airport18. Around 45 global airlines operate at Gatwick including British Airways, EasyJet, Emirates and Virgin. It is also the best connected point-to-point airport in Europe and serves 46 of the top 50 EU business destinations. The airport is owned by a group of international investment funds of which Global Infrastructure Partners (GIP) is the largest shareholder. The Airport is a major economic driver19 for the South East region as it generates around 21,000 on-airport jobs and a further 10,000 jobs through related activities. Gatwick Airport is located north of Crawley parallel to the M23, 28 miles south of London. Figure B-4 Overview plans of Gatwick Airport at a local and a regional scale
18 http://www.mediacentre.gatwickairport.com/~/media/Files/G/Gatwick-Airport-Media/documents/Gatwick%20factsheet.pdf 19 http://www.mediacentre.gatwickairport.com/press-releases/2015/15-11-17-gatwick-hits-40-million-passengers-a-year-for-first-time.aspx

International gateways and the SRN
65
B.2.2. Access
The airport is linked directly to the M23 at junction 9 and to the A23 London-Brighton Road. It is also only a ten minute drive to the M25 which is connected to the national UK road and motorway network. The airport is well integrated within the national railway network, only 30 minutes away from London Victoria train station via the non-stop Gatwick Express service which is incorporated into the Oyster contactless payment network.
B.2.3. Demand Analysis
Table B-5 2015 Activity Summary at Gatwick Airport
2015 Activity Summary Gatwick Total Operations as % of All UK Airports
Air Transport Movements 262,639 12
Terminal Passengers 40,260,068 16
Transit Passengers 9,019 5
Freight (tonnes) 73,371 3
Mail (tonnes) 5,522 2
Table B-6 International and Domestic Freight Statistics at Gatwick Airport, Jan 2015 to Dec 2015
Internal and Domestic Freight 2015
Gatwick Gatwick operations as % of UK total
EU Passenger 1,924 3
EU Cargo 44 0.1
Other International Passenger 71,000 5
Other International Cargo 47 0.1
Domestic Passenger 356 6 Domestic Cargo - 0

International gateways and the SRN
66
Figure B-5 Overall Mode Share to/from Gatwick Airport
Table B-7 Passenger mode share travelling to the airport by region, 2014 Passenger Survey
Planning Region Private (%) Public (%) Other (%) Total Passengers (000s)
East Midlands 68.5 31.5 0 646
East of England 79.1 20.9 0 3,015
North East 31.1 68.9 0 76
North West 47.3 52.7 0 169
Scotland 39 61 0 68
South East 54.8 44.9 0.3 27,891
South West 74.5 25.5 0 1,841
Wales 61.7 38.3 0 479
West Midlands 66.1 33.9 0 507
Yorkshire/Humberside 51.4 48.6 0 297
Total 58.3 41.5 0.2 34,989
Table B-8 Journey Purpose Percentage, 2014
Airport International Business International Leisure Domestic Business Domestic Leisure
Gatwick UK Foreign UK Foreign UK Foreign UK Foreign
5.1% 5.6% 58.3% 21.3% 2.9% 0.3% 5.8% 0.6%
B.2.4. Future Development
Additional Runway
Following the Government’s decision on expansion at Heathrow it is now unclear if the investment plans at Gatwick airport will progress. An additional runway at Gatwick was estimated to create an extra 22,000 jobs by 2050, contributing £1.7 billion per year to the local and regional economy.
The local authority have also identified land nearby which could provide an additional 115,000 dwellings with an annual development rate of 5,500 dwellings per year.

International gateways and the SRN
67
A second runway at Gatwick was expected to have further catalytic impacts on the local economy by attracting new business to the Coast to Capital Local Enterprise Partnership (LEP) area (consisting of Brighton and Hove, London Borough of Croydon, Gatwick Diamond, Lewes and West Sussex) as well as Central and south London, generating clusters of air-travel intensive and high productivity businesses.
B.2.5. Access/connectivity issues
The delay experienced on southern SRN links approaching the airport is, on average 16 seconds, on the A23 between junction 11 of the M23 and A272.
The map also includes the location of other UK airports including Heathrow. The A23 link that serves the access point has a delay of 10 seconds per vehicle mile which is relatively small compared to the 40 seconds per vehicle mile experienced on the M25 northbound between junctions 14 and 15.
Figure B-6 Average Annual SRN Delay around Gatwick Airport, April 2014 - March 2015

International gateways and the SRN
68
B.3. Stansted
B.3.1. Overview
Stansted Airport is located east of the M11, north east of Central London. Stansted Airport is the fourth busiest in the UK, with one passenger terminal and one runway and is owned by the Manchester Airport Group. Stansted has grown primarily as a low-cost airline destination. The Airport is Ryanair’s largest hub.
Nearby Hertfordshire LEP is supporting expansion at the airport to allow for long-haul routes, giving business in the East of England more travel options without having to travel across London.
Figure B-7 Overview plans of Stansted Airport at a local and a regional context

International gateways and the SRN
69
B.3.2. Access
The airport is directly linked, via a grade separated junction, to the A120 dual carriageway and to the M11. The Airport A120 junction is roughly 1km from the A120 / M11 junction. The M11 provides motorway travel north as far as Cambridge and South to London and the M25. The A120 provides dual carriageway access to the rest of Essex.
The airport is connected to the national rail network via a spur from the London to Cambridge line. The Stansted express departs every 15 minutes at peak times from London Liverpool Street Station. The train also calls at Tottenham Hale with connections to the LU Victoria Line.
National Express, CityLink and Airport Bus Express operate coach services between London and the Airport. There are also national express services to Cambridge, Oxford, Nottingham, Thetford, Birmingham, Brighton, Heathrow and Gatwick.
B.3.3. Demand Analysis
Table B-9 Summary of Activity at Stansted Airport, 2015
2015 Activity Summary Stansted Total Operations as % of all UK airports
Air Transport Movements 155,913 7
Terminal Passengers 22,513,443 9
Transit Passengers 5,735 3
Freight (tonnes) 207,996 9 Mail (tonnes) 19,115 9
Table B-10 International and Domestic Freight, 2015
Internal and Domestic Freight 2015
Stansted Stansted operations as % of UK Total
EU Passenger 17 0.01
EU Cargo 65,372 19
Other International Passenger 771 0.1
Other International Cargo 140,834 56
Domestic Passenger 2 0.0001
Domestic Cargo 1,001 1

International gateways and the SRN
70
Figure B-8 Overall Mode Share for Stansted Airport, 2014 Passenger Survey
Table B-11 Mode share by region, 2014 Passenger Survey
Region Private % Public % Other % Total Pax 000
East Midlands 76.3 23.2 0.5 615
East of England 76.3 22.9 0.7 5,681
North East 62.3 36.9 0.9 44
North West 45.5 53.3 1.2 120
Scotland 20.3 77.1 2.5 39
South East 33.2 64.3 2.5 11,624
South West 55.6 42.7 1.7 354
Wales 30.9 67.1 2 93
West Midlands 53.3 45.6 1.1 310
Yorkshire And Humber 53.2 45.2 1.6 216
Total 48.5 49.6 1.8 19,096
Table B-12 Journey Purpose Percentage, 2014
Airport International business International leisure Domestic business Domestic leisure
Stansted UK Foreign UK Foreign UK Foreign UK Foreign
6.3% 6.5% 47.2% 34.3% 2.3% 0.1% 2.9% 0.4%
B.3.4. Future Development
Airport Capacity
Manchester Airport Group reported to the Airports Commission that Stansted would be a more cost effective alternative for airport expansion in the south east of England. Plans were submitted proposing a £10bn spend in order to turn the airport in to a four runway hub. If developed as a hub airport Stansted could potentially handle up to 160mppa. Stansted now plans to apply to Government to lift restrictions on passenger numbers from 35 million to 42 million passengers and eventually build a second runway. This growth in passengers

International gateways and the SRN
71
could lead to between £400m and £500m of investment in Stansted to expand its terminal facilities to accommodate more travellers.
Growth The South East LEP recognises Stansted as a key component of growth in the regions, and forecasts continued employment growth at Enterprise Zones near the airport.
B.3.5. Future Schemes
M11 Junction 8 improvement
The Greater Cambridge Greater Peterborough Enterprise Partnership has earmarked £1 million to upgrade the M11 junction 8 at the airport. The upgrade works will increase capacity at the junction (source: Herts and Essex Observer, 2015).
B.3.6. Economic Impact
Stansted is the largest single-site employer in the East of England, with 10,000 staff employed on the site. Stansted generates around £770 million in GVA annually
B.3.7. Access/Connectivity Issues
The links selected for Stansted Airport are just under 1 mile length and extend from junction 8 of the M11 to A130 on the A120. The average annual delay for the links is 3.9 seconds per vehicle mile. The highest delay occurs during the AM peak with 6.8 seconds on eastbound links and 5 seconds westbound.
The A120 is mostly congested around Braintree and Colchester. The average delay experienced on this road is 8.9 seconds with increased delays eastbound. The highest delay experienced on the A120 occurs during the PM peak on eastbound links where the PTI is 1.7. The average proportion of HGVs is 5.5% in both directions. The annual average proportion of HGVs on the links is just over 4%.
Figure B-9 Annual Average SRN Delay around Stansted Airport, April 2014 - March 2015

International gateways and the SRN
72
B.4. Manchester
B.4.1. Overview
Manchester Airport is the third busiest in the UK, with three passenger terminals, a freight terminal and two runways and is operated by the Manchester Airport Group. Manchester Airport is directly connected to the SRN by M56 and is located south of Manchester City Centre.
The Manchester Enterprise Zone is an area around the airport that benefits from reduced business rates. The Manchester LEP is overseeing a £400m investment in the “Airport City” project, which will create a large area of office space, logistics parks and manufacturing facilities in the area to the north of the airport (Airport City).
Figure B-10 Overview plans of Manchester Airport at a local and a regional scale

International gateways and the SRN
73
B.4.2. Access
The airport can be directly accessed via a short motorway spur from the M56. The M56 continues east from the airport towards Manchester and west towards Liverpool and the M6. There is also a dual carriageway heading southwest from the airport entrance, however this road narrows to single carriageway less than 600 metres from the airport entrance.
The airport is connected by national rail services (with 20 minute travel times to central Manchester) as well as by Metrolink, which provides a connection to Manchester’s suburban tram network.
Coach services are provided by National Express, which operates an extensive network from the airport. There are local buses from the airport serving Manchester and its suburbs.
B.4.3. Demand Analysis
Table B-13 Summary of Activity at Manchester Airport, 2015 CAA Figures
2015 Activity Summary Manchester Total Operations as % of all UK airports
Air Transport Movements 164,963 7
Terminal Passengers 23,094,593 9
Transit Passengers 41,454 18 Freight (tonnes) 100,021 4
Mail (tonnes) 3,765 2

International gateways and the SRN
74
Table B-14 International and Domestic Freight, 2015 CAA Figures
Internal and Domestic Freight 2015 Manchester Manchester operations as % of UK Total
EU Passenger 2,305 4
EU Cargo 6,384 2
Other International Passenger 87,789 6
Other International Cargo 2,678 1
Domestic Passenger 70 1
Domestic Cargo 794 1
Figure B-11 Overall Mode Share Accessing Manchester Airport
Table B-15 Mode Share by Region to Manchester Airport, 2014 Passenger Survey Report
Region Private % Public % Other % Total Pax 000
East Midlands 84.3 15.7 0 797
East of England 63.7 36.3 0 31
North East 64.3 35.7 0 461
North West 86.9 12.7 0.4 12,773
Scotland 64.5 35.5 0 364
South East 59.2 40.8 0 70
South West 85.0 15 0 69
Wales 92.4 7.6 0 849
West Midlands 91.6 8.4 0 1,250
Yorkshire And Humber 73.4 26.6 0 4,274
Total 83.5 16.2 0.2 20,938
Table B-16 Journey Purpose Percentage, 2014
Airport International business International leisure Domestic business Domestic leisure
Manchester
UK Foreign UK Foreign UK Foreign UK Foreign
7.9% 4.9% 63.5% 12.3% 4.5% 0.6% 5.5% 0.9%

International gateways and the SRN
75
B.4.4. Future Development
Airport City
Greater Manchester LEP is backing the Manchester Airport City expansion, which represents a £800 million investment in the airport. It will include new on-site logistics, manufacturing, office and leisure facilities and will be the first airport city in the UK. It has been designated an Enterprise Zone by the government and therefore benefits from reduced business rates.
Growth
According to the Airport’s Master Plan 2030, it expects passenger numbers to increase by 4 – 6% per annum to 50m by 2030. The airport expects to see large increases in employment and has reserved an additional 40 hectares of land to cope with growth (Manchester Airport, 2015)
B.4.5. Future Schemes
A6 to Manchester Airport Relief Road
Work has begun on a new dual carriageway link from the A6 at Hazel Grove to the M56 at Manchester Airport (using the A555 dual carriageway). This will provide a new east – west route, linking the airport to towns south of Greater Manchester (SEMMMS Relief Road).
B.4.6. Economic Impact
The Airport City project is expected to contribute 10,000 jobs to the local economy and a £350m of additional GVA per annum (Manchester Airport, 2015).
B.4.7. Access/Connectivity Issues
The links selected to represent the access routes to the airport entrance are between junction 3 and 7 on the M56. The average annual delay experienced on these links varies depending on the direction of travel, with 7.4 seconds delay southbound and 15.2 seconds northbound. On average, traffic travelling north east on these links experience a much greater delay than the opposite direction with over 54 seconds per vehicle mile delay during the evening peak hours. The most delay for traffic travelling south west is also experienced during the peak at 18.8 seconds.
The PTI for the M56 is 2.4 northbound and 1.6 southbound with an average HGV composition of 4.3%. The proportion of HGVs is similar on the links to that on the M56 with the proportion decreasing in the evening peak to 2.8% from around 4% during the morning peak.

International gateways and the SRN
76
Figure B-12 Annual Average SRN Delay around Manchester Airport, April 2014 - March 2015

International gateways and the SRN
77
B.5. Luton
B.5.1. Overview
Luton Airport is the fifth busiest passenger airport in the UK. Transport movements at Luton facilitate over 90 destinations including Europe, Africa and the Middle East.
Scheduled airlines currently operating from London Luton include EasyJet, Ryanair, Wizz Air, Monarch Scheduled, Aer Arann, Flybe, El Al and Blue Air, whilst Thomson and Monarch operate charter services20.
Figure B-13 Overall plans of Luton Airport at a local and a regional scale
20 Luton Airport Surface Access Strategy, 2012 – 2017 - http://www.london-luton.co.uk/CMSPages/GetFile.aspx?guid=d3c9a61c-7715-4729-8cae-b4c76c035449

International gateways and the SRN
78
B.5.2. Access
Luton Airport is well connected to all modes of transport including a well-developed coach network and direct links to the UK’s main railways via Luton Airport Parkway train station. Since 2013, the Airport has been served directly by the Luton – Dunstable Guided Busway.
London Luton Airport is well connected to the strategic highway network. The M1 is only two miles to the west, connected via the A505 East Luton Corridor. To the east, the A505 provides connections to the A1 (M), M11 and East Anglia.
B.5.3. Demand Analysis
Table B-17 Summary of Activity at Luton Airport, 2015 CAA
2015 Activity Summary Luton Total Operations as % of all UK airports
Air Transport Movements 92,005 4
Terminal Passengers 12,262,581 5
Transit Passengers 924 0.4
Freight (tonnes) 28,008 1
Mail (tonnes) - -
Table B-18 International and Domestic Freight, 2015 CAA
Internal and Domestic Freight 2015
Luton Luton operations as % of UK Total
EU Passenger 182 0.3
EU Cargo 23,483 7
Other International Passenger 842 0.1
Other International Cargo 2,608 1 Domestic Passenger - -
Domestic Cargo 892 1

International gateways and the SRN
79
Figure B-14 Overall Passenger Mode Share, 2014 Passenger Survey
Table B-19 Passenger Mode Share by Region, 2014 Passenger Survey
Planning Region Private (%) Public (%) Other (%) Total Pax (000s)
East Midlands 82.1 17.9 0.1 842
East of England 87.5 11.8 0.7 3,083
North East 76 24 0 18
North West 60.6 39.4 0 74
Scotland 62.4 37.6 0 27
South East 59.4 40.4 0.1 5,250
South West 61.8 38.2 0 269
Wales 67 33 0 53
West Midlands 76 24 0 449
Yorkshire And Humber 74.4 25.6 0 121
Total 70.8 28.8 0.3 10,186
Table B-20 Passenger Journey Percentage, 2014
Airport International Business
International Leisure Domestic Business Domestic Leisure
Luton UK Foreign UK Foreign UK Foreign UK Foreign
7.8% 5% 60% 18.2% 3.6% 0.1% 4.8% 0.5%
B.5.4. Future Development
Thameslink Programme
£6bn investment in improving rail access to Luton Airport Parkway train station which will be completed in a number of stages before reaching its estimated completion data in 2018.
Completion of the programme in 2018 will allow all peak-period Bedford-Brighton services to call at London Bridge. This will improve the connections between Luton Airport Parkway and the developing area around London Bridge station.
B.5.5. Future Schemes
Further measures to reduce congestion on the local highway network include the M1 Junction 10A improvements and the A5 to M1 Link Road.

International gateways and the SRN
80
B.5.6. Economic Impact
In 2013, the economic activity created by London Luton Airport contributed some £1.3 billion to UK GDP. For every pound London Luton Airport contributes to GDP itself, it creates another £2 elsewhere in the UK economy21. In 2013 this impact comprised:
£425 million in direct impact (equivalent to 10% of the local Luton Borough economy);
£338 million in indirect impact within the supply chain of the airport; and
£506 million in induced impact as employees of the airport and its supply chain spent their wages.
The airport is estimated to have sustained 27,000 jobs in 2013, comprising:
9,400 direct jobs (10 per cent of all employment in Luton Borough);
7,700 indirect jobs within the supply chain of the airport;
10,000 induced jobs as employees of the airport and its supply chain spent their wages.
B.5.7. Access/Connectivity Issues
The link from the SRN to Luton Airport is on the M1 between junction 10 and junction 10A which is just under 1km long. The annual average traffic flow for both directions is 25,600 with over 2,000 vehicles recorded on average on the southbound link during the PM peak.
Whilst the southbound link appears to be carrying more vehicles during the PM peak, the northbound link experiences much greater delays during the PM peak of over 148 seconds per vehicle mile. The AM peak delay on the same link is even greater at 196 seconds per vehicle mile.
The southbound link on the M1 has an annual average delay of 34 seconds per vehicle mile which is lower than the AM peak delay which reaches over 42 seconds per vehicle mile.
The proportion of HGVs is only available for the northbound link which has an annual average proportion of HGVs of 2.5%.
21 The Economic Impact of London Luton Airport, 2015 - http://www.london-luton.co.uk/CMSPages/GetFile.aspx?guid=1c3d6dc1-f197-4860-86d6-749abfbf45f6

International gateways and the SRN
81
Figure B-15 Annual Average SRN Delay around Luton Airport, April 2014 - March 2015

International gateways and the SRN
82
B.6. East Midlands
B.6.1. Overview
Owned by Manchester Airport Group, East Midlands Airport is only the 11th busiest airport by passenger volumes in the UK in 2014. However, it is the second busiest freight airport in the UK. The airport currently has one runway.
The D2N2 LEP is in favour of setting up the UK’s first “free trade zone” around East Midlands Airport as part of devolution negotiations. The Zone would allow for tax breaks for companies engaging in Foreign Direct Investment and companies intending to radically expand their operations to encompass international trade (D2N2 LEP). Particular targets for the zone would be tier one automotive and aerospace suppliers. It would therefore be necessary to link UKTI inward investment and trade activity to the zone. It would be sited on a bespoke delineated location(s) with good connection to road, rail and the airport.
Figure B-16 Overview plans of East Midlands Airport at a local and a regional scale

International gateways and the SRN
83
B.6.2. Access
The airport is connected to the M1, which runs close to its eastern border, via the A453 Ashby single carriageway road. The A453 also provides access to the A42 and A50 dual carriageways serving the southwest and northwest respectively.
The airport is not directly connected to the rail network. The airport can be accessed from the mainline railway at East Midlands Parkway station via a (6 seater) shuttle bus. The shuttle bus runs hourly and takes 20 minutes to get to the airport.
There are local buses running to the airport from Nottingham, Leicester and Derby as well as National Express coaches.
B.6.3. Demand Analysis
Table B-21 Summary of Activity at East Midlands Airport
2015 Activity Summary East Midlands Total operations as % of all UK airports
Air Transport Movements 60,754 3
Terminal Passengers 4,446,219 2
Transit Passengers 4,643 2 Freight(tonnes) 291,689 13
Mail (tonnes) 29,928 14
Table B-22 International and Domestic Freight Statistics - 2015 CAA Annual Report
Internal and Domestic Freight East Midlands East Midlands Operations as % of
UK Total
EU Passenger 3 0.005
EU Cargo 190,778 55
Other International Passenger 0.3 0.00002
Other International Cargo 56,813 22
Domestic Passenger 5 0.1
Domestic Cargo 44,089 45

International gateways and the SRN
84
Figure B-17 Overall Mode Share accessing East Midlands Airport
Table B-23 Mode Share by Region to East Midlands Airport, 2014 CAA Passenger Survey
Region Private % Public % Other % Total Pax 000s
East Midlands 90.4 9.4 0.2 2,736
East of England 100 0 0 58
North East 89.1 10.9 0 14
North West 97.9 2.1 0 32
Scotland 100 0 0 7
South East 80.9 17.6 1.5 43
South West 97.6 2.4 0 31
Wales 98.4 1.6 0 13
West Midlands 97.1 2.5 0.4 769
Yorkshire And Humber 94.2 5.2 0.6 671
Total 92.3 7.4 0.3 4,374
Table B-24 Journey Purpose Percentage, 2014
Airport International business International leisure Domestic business Domestic leisure
East Midlands
UK Foreign UK Foreign UK Foreign UK Foreign
1.6% 1.0% 79.1% 9.3% 4.1% 0.1% 4.7% 0.2%
B.6.4. Future Development
LEP Ambitions
The D2N2 LEP supports the East Midlands Airport “Free Trade Zone” which would see tax incentives for importing and exporting businesses around East Midlands Airport.
Expansion
The Airport’s strategic plan envisages growing annual passengers from 4 to 10 million by 2030, which will include car park and terminal expansion. The airport also believes it can grow to handling 1.2 million tonnes of cargo per year (East Midlands Airport).

International gateways and the SRN
85
B.6.5. Future Schemes
M1 Smart Motorway
Highways England is currently in the process of upgrading stretches of the M1 to Smart Motorway standard. The scheme aims to reduce congestion through increased lane capacity, increase motorist information for better incident management, and to make journeys on the road more reliable (Highways England, 2013).
Free Trade Zone
The proposed East Midlands Airport Free Trade zone has the potential to add additional freight requirements in the area.
B.6.6. Economic Impact
East Midlands Airport makes a significant contribution to the regional economy, particularly to Nottingham, Leicester and Derby and to the district of North West Leicestershire. These economic benefits are in the form of passenger and cargo connectivity, economic activity and in direct and indirect employment. East Midlands Airport is estimated to generate £239 million of GVA each year (2011)22.
B.6.7. Access/Connectivity Issues
The airport is not directly connected to the rail network, and therefore depends on road transport for access.
Google maps shows that there can be traffic issues at the junction between the A453 and the airport entrance at peak times. Additionally, there can be issues at the M1 junction for the airport at peak times.
The average annual delay on SRN links that connect the Airport to city centres and major roads have an average delay of 7.8 seconds per vehicle mile. This is higher than the delay experienced on the A42 in both directions which is only 2.4 seconds. The map below shows that most delay is experienced around nearby urban areas such as Nottingham and Leicester. The highest delay was recorded on M1 northbound with an annual average of 12.2 seconds per vehicle mile.
The annual average proportion of HGVs on the SRN links to East Midlands Airport is 5.8%. Despite having a small amount of delay on the A42, the traffic composition is on average almost 12% HGVs.
22 Airport, E. M. (n.d.). Retrieved from East Midlands Airport: http://www.eastmidlandsairport.com/about-us/development-plan/ England, H. (2013). Retrieved from Highways England: http://www.highways.gov.uk/roads/road-projects/m1-junctions-39-42/ LEP, d. (n.d.). Retrieved from d2n2 LEP: http://www.d2n2lep.org/write/Devolution_Prospectus.pdf

International gateways and the SRN
86
Figure B-18 Annual Average SRN Delay around East Midlands Airport, April 2014 - March 2015

International gateways and the SRN
87
B.7. Birmingham
Birmingham International Airport is located in the Metropolitan Borough of Solihull, adjacent to the National Exhibition Centre (NEC) and 8 miles south east of Birmingham’s city centre.
Figure B-19 Overview plans of Birmingham Airport at a local and a regional scale
B.7.1. Overview
The Airport was opened in 1939, but its role as a modern international airport began in 1984, when new passenger terminal facilities were opened. Since 1984, the Airport has benefited from a high quality of passenger terminal facilities and excellent surface access by road and public transport to deliver strong growth over the last twenty years. The Airport is now the seventh largest airport in the UK, with nearly 10 million

International gateways and the SRN
88
passengers in 201423. The Midlands is one of the major regions of the UK, with a catchment area of some 8 million people living within one hour travel time of Birmingham International Airport.
B.7.2. Access
The airport is directly served by the M42 and the West Coast Rail Main Line at Birmingham International Station. The airport is also connected by and air-rail link that transports passengers to and from the station in 90 seconds. Frequent bus services also connect the airport and surrounding areas for passengers and employees.
B.7.3. Demand Analysis
Table B-25 Summary of Activity at Birmingham Airport, 2015 CAA Annual Report
2015 Activity Summary Birmingham Total operations as of all UK airports
Air Transport Movements 90,069 4 Terminal Passengers 10,180,059 4
Transit Passengers 7,063 3
Freight (tonnes) 7,164 0.3
Mail (tonnes) 113 0.1
Grand Total 10,284,467 4
Table B-26 International and Domestic Freight at Birmingham Airport, 2015 CAA Annual Report
Internal and Domestic Freight Birmingham Birmingham Operations as % of UK Total
EU Passenger 202 0.3
EU Cargo - -
Other International Passenger 6,923 0.5
Other International Cargo - -
Domestic Passenger 39 0.6
Domestic Cargo - -
23 2007 Birmingham Airport Masterplan, https://www.birminghamairport.co.uk/media/2938/2007-airport-masterplancompressed.pdf

International gateways and the SRN
89
Figure B-20 Overall Passenger Mode Share to/from Birmingham Airport
Table B-27 Mode Share by Region, Birmingham Airport
Region Private % Public % Other % Total Pax 000s
East Midlands 85.6 14.4 0 1,502
East of England 72.5 27.4 0.1 93
North East 59.2 40.8 0 12
North West 59.9 40.1 0 70
Scotland 46.8 53.2 0 8
South East 58.5 41.5 0.1 437
South West 83.3 16.2 0.4 461
Wales 65.3 31.9 2.8 306
West Midlands 75.8 23 1.2 5,929
Yorkshire And Humber 77.3 22.7 0 157
Total 76.5 22.7 0.9 8,975
Table B-28 Journey Purpose Percentage, 2014
Airport International business International leisure Domestic business Domestic leisure
Birmingham UK Foreign UK Foreign UK Foreign UK Foreign
7% 7% 56% 16% 6% 0% 7% 1%
B.7.4. Future Development
HS2
HS2 is forecast to bring substantial economic benefit to the area through jobs, investment and output growth. The new line will provide a step change in the competitiveness of Greater Birmingham and Solihull. It is anticipated that around 8,600 jobs will be created as a direct result of HS2 at the proposed station sites and
International gateways and the SRN
90
maintenance depot. There is the potential for up to 22,000 new jobs in the West Midlands if delivered in conjunction with a range of regional and local rail enhancements and feeder services, whilst it will act as a catalyst for developing engineering skills and wider employment opportunities. It is estimated that HS2 could raise the GVA for the West Midlands by up to £1.5 billion per annum once it is complete. International connectivity is vital to attracting and retaining inward investment. The HS2 station at the Airport will act as a major integrated transport hub, linking to the motorway network, London Heathrow, London Euston station, London Crossrail, HS1 and Eurostar.
B.7.5. Future Schemes
UK Central (formally known as the M42 Economic Gateway)
Located in Solihull, UK Central is the West Midlands’ principal international gateway and strongest performing economy, supporting an estimated 100,000 jobs region-wide and contributing £5.1 billion to regional GDP (source: http://centreofenterprise.com/m42-economic-gateway/).
B.7.6. Economic Impact
Currently, there are some 7,500 jobs supported on-site (with further jobs off-site) and the Airport is estimated to contribute some £272 million to the regional economy.
Birmingham International Airport’s share of the Midlands’ regional market is currently estimated to be 36%. By satisfying an increasing proportion of this demand in the region where it arises, this is forecast to grow to 57% by 203024.
B.7.7. Access/Connectivity Issues
The selected links for Birmingham Airport are from junction 5 to 7 on the M42. The length of the selected links is a total of 5.5 miles and these were picked in order to provide an accurate portrayal of traffic conditions when approaching the airport. The Planning Time Index (PTI) is the 3rd highest compared to the rest of the selected airports with an average of 1.9 in both directions.
The annual average delay is 12.3 seconds per vehicle mile in both directions with 12.6 on southbound links. The highest average delay is during the peak period where this reaches 29.8 seconds on southbound links.
Compared to the rest of the selected airports, the links for Birmingham Airport have the highest proportion of HGVs with an annual average of 10.5%.
The annual average delay on the M42 is around 9 seconds which is lower than the selected links to the airport. The average proportion of HGVs on this road is also lower than that on the links with an annual average of 9.4%.
24 2007 Birmingham Airport Masterplan, https://www.birminghamairport.co.uk/media/2938/2007-airport-masterplancompressed.pdf

International gateways and the SRN
91
Figure B-21 Annual Average SRN Delay around Birmingham Airport, April 2014 - March 2015

© Crown copyright (2016). You may re-use this information (not including logos) free of charge in any format or medium, under the terms of the Open Government
Licence. To view this licence: visit www.nationalarchives.gov.uk/doc/open-government-licence/ write to the Information Policy Team, The National Archives, Kew,
London TW9 4DU, or email [email protected]. This document is also available on our website at www.gov.uk/highways If you have any enquiries about
this publication email [email protected] or call 0300 123 5000*. Please quote the Highways England publications code PR143/16. *Calls to 03 numbers cost
no more than a national rate call to an 01 or 02 number and must count towards any inclusive minutes in the same way as 01 and 02 calls. These rules apply to calls from
any type of line including mobile, BT, other fixed line or payphone. Calls may be recorded or monitored. Registered office: Bridge House, 1 Walnut Tree Close,
Guildford GU1 4LZ
Highways England Company Limited registered in England and Wales number 09346363
Atkins contact
Richard Coburn Atkins Euston Tower 286 Euston Road London NW1 3AT Email: [email protected] Tel: +44 (0)20 7121 2374 Tel: +44 (0)7803 609059