International Biodeterioration and Biodegradation
18
PRIFYSGOL BANGOR / BANGOR UNIVERSITY A rapid screening method to determine the susceptibility of bio-based construction and insulation products to mould growth Stefanowski, Bronia; Curling, Simon; Ormondroyd, Graham International Biodeterioration and Biodegradation DOI: 10.1016/j.ibiod.2016.10.025 Published: 01/01/2017 Peer reviewed version Cyswllt i'r cyhoeddiad / Link to publication Dyfyniad o'r fersiwn a gyhoeddwyd / Citation for published version (APA): Stefanowski, B., Curling, S., & Ormondroyd, G. (2017). A rapid screening method to determine the susceptibility of bio-based construction and insulation products to mould growth. International Biodeterioration and Biodegradation, 124-132. [116]. https://doi.org/10.1016/j.ibiod.2016.10.025 Hawliau Cyffredinol / General rights Copyright and moral rights for the publications made accessible in the public portal are retained by the authors and/or other copyright owners and it is a condition of accessing publications that users recognise and abide by the legal requirements associated with these rights. • Users may download and print one copy of any publication from the public portal for the purpose of private study or research. • You may not further distribute the material or use it for any profit-making activity or commercial gain • You may freely distribute the URL identifying the publication in the public portal ? Take down policy If you believe that this document breaches copyright please contact us providing details, and we will remove access to the work immediately and investigate your claim. 16. Mar. 2022
Transcript of International Biodeterioration and Biodegradation

PR
IFY
SG
OL
BA
NG
OR
/ B
AN
GO
R U
NIV
ER
SIT
Y
A rapid screening method to determine the susceptibility of bio-basedconstruction and insulation products to mould growthStefanowski, Bronia; Curling, Simon; Ormondroyd, Graham
International Biodeterioration and Biodegradation
DOI:10.1016/j.ibiod.2016.10.025
Published: 01/01/2017
Peer reviewed version
Cyswllt i'r cyhoeddiad / Link to publication
Dyfyniad o'r fersiwn a gyhoeddwyd / Citation for published version (APA):Stefanowski, B., Curling, S., & Ormondroyd, G. (2017). A rapid screening method to determinethe susceptibility of bio-based construction and insulation products to mould growth. InternationalBiodeterioration and Biodegradation, 124-132. [116]. https://doi.org/10.1016/j.ibiod.2016.10.025
Hawliau Cyffredinol / General rightsCopyright and moral rights for the publications made accessible in the public portal are retained by the authors and/orother copyright owners and it is a condition of accessing publications that users recognise and abide by the legalrequirements associated with these rights.
• Users may download and print one copy of any publication from the public portal for the purpose of privatestudy or research. • You may not further distribute the material or use it for any profit-making activity or commercial gain • You may freely distribute the URL identifying the publication in the public portal ?
Take down policyIf you believe that this document breaches copyright please contact us providing details, and we will remove access tothe work immediately and investigate your claim.
16. Mar. 2022
1
A RAPID SCREENING METHOD TO DETERMINE THE SUSCEPTIBILITY OF 1
BIO-BASED CONSTRUCTION AND INSULATION PRODUCTS TO MOULD 2 GROWTH 3
4
B.K Stefanowskia, S.F Curlingb, G.A. Ormondroydc,d 5 aBioComposites Centre, Bangor University, Bangor, Gwynedd, LL57 2UW, United 6
Kingdom [email protected] 7 bBioComposites Centre, Bangor University, Bangor, Gwynedd, LL57 2UW, United 8
Kingdom [email protected] 9 cBioComposites Centre, Bangor University, Bangor, Gwynedd, LL57 2UW, United 10
Kingdom 11 dDepartment of Architecture and Civil Engineering, University of Bath, Bath, UK 12
[email protected] 13 14
Corresponding author email [email protected] 15
16
ABSTRACT 17 Mathematical models have been developed to evaluate materials’ durability and 18 susceptibility to biodeterioration by moulds, however models are material and mould 19 species specific. Ultimately the best way to determine a materials’ susceptibility is to 20
expose the material to microorganisms. This study attempted to develop a quick, 21 reliable screening method to evaluate a number of different materials for their 22
susceptibility to moulds at optimal and limiting conditions. This test method was 23 based on modified versions of ASTM 4445-91 and BSEN 846. The water absorption 24 coefficient and Dynamic Vapour Sorption tests were also conducted to determine 25
any correlation between the materials hygric properties and mould growth. The 26 materials used to validate the novel screening method were: MDF, laminated MDF, 27 Chipboard, Laminated chipboard, Wool, Hemp, Wood fibre insulation and pine. It 28
was found chipboard was the most susceptible to mould growth and wool the least 29 when in direct and indirect contact with agar. Primary colonisers (A. niger) easily 30
colonised the materials, regardless of the environmental conditions, whereas 31 secondary (A. alternate) and tertiary (T, virens) colonisers were absent on materials 32
under limiting conditions. 33 34
Key Words: Mold, construction materials, insulation, susceptibility, moisture 35 36 1. INTRODUCTION 37
During the service life of buildings, bio based construction materials could be at risk 38 of biodeterioration such as that caused as a result of the biotic processes of 39
microorganisms. In the environment saprophytic organisms such as mould and 40 decay fungi are the main agents responsible for the decomposition and recycling of 41 organic matter. However, in the built environment they are associated with physical 42
and aesthetic damage and human health problems such as allergic and toxic 43 reactions (Airaksinen et al., 2004; Cooley et al., 1998; Jarvis and Miller, 2004; 44 Mensah-Attipoe et al., 2015; Nielsen, 2003). Modern building practices have, in 45 some cases, exaggerated this problem with increased insulation hindering 46
ventilation, resulting in increased areas of condensation and subsequent mould 47 growth (Schmidt, 2006). Moulds will readily colonise lignocellulosic materials but can 48 also attack synthetic floor coverings, airplane fuels, oils, glues, paints and textiles 49 (Pasanen et al., 1992; Schmidt, 2006). This ability to attack a wide variety of 50

2
materials is enabled by the variety of physiological responses demonstrated by 51
mould fungi in regards to temperature, water activity, relative humidity and pH 52 (Schmidt, 2006). 53
Hygroscopic (water sorption) properties are an inherent characteristic of materials 54 that influence both the application and microbiological resistance (Airaksinen et al., 55 2004; Xie et al., 2010). Natural fibres are hygroscopic because their cell walls 56 contain high amounts of water sorption sites (hydroxyl groups) and can expand to 57 accommodate the water (Xie et al., 2010). Moulds have been shown to appear in 58
succession on a material as the moisture content of the material fluctuates, 59 according to their minimum moisture demands of the mould, (Pasanen et al., 1992). 60 Therefore, although the need for determining a materials’ vulnerability to mould 61 growth is obvious, it is clear that not all materials have equal susceptibility 62 (Johansson et al., 2012; Mensah-Attipoe et al., 2015), which adds complexity when 63
considering composite materials. Isopleths have been used to describe relationships 64 between temperature, moisture and fungal growth on nutrient media and although 65
isopleths can be very useful, they are, however, only suitable for predicting growth of 66 known fungi on one material at a time and are time intensive (Johansson et al., 67 2013b). There have been a number of mathematical models developed and reported 68 in recent years that can be used to evaluate durability and susceptibility of wood and 69
wood-based materials to biological deterioration (Ojanen et al., 2007; Viitanen et al., 70 2010). Basic models are used to indicate mould germination conditions, such as the 71
isopleth technique, but these do not account for fluctuations in environmental 72 conditions. More advance models such as the VTT model and the bio-hygrothermal 73 model (Sadovský et al., 2013) can be used but these have also shown significant 74
variations in results due to simplifications and assumptions (Sadovský et al., 2013). 75 There are, however, further disadvantages to using some models to predict 76
microbiological growth, in that most are based on laboratory data, where optimum 77 conditions are used, and are therefore often not comparable to construction 78 materials, which are comprised of less nutrient rich materials (Clarke et al., 1999). 79
Very rarely do they take into account species dominance (Gu and Gu, 2005). One 80 key characteristic in predicting the susceptibility of materials requires a knowledge of 81
the organisms’ minimum water requirements, that are specific to the individual mould 82
species (Nielsen et al., 2004). Models also do not consider the materials ability to 83 absorb moisture, in contact or as vapour. It is possible that errors occur, due to a 84 delay in a change in the surface conditions at different relative humidities, when 85 compared to adjacent conditions. 86 These models may therefore not be the most applicable way of determining a 87
materials’ susceptibility to mould growth. As stated above, these models are often 88 developed using the moulds optimal growing conditions and therefore, if materials 89 are destined for use outside of these environmental ranges, such as furniture in a 90 bathroom or kitchen, the level of biological attack may be based on false 91 assumptions. Moulds can still colonise materials and grow in sub optimal conditions 92
and it has been shown that even at low humidities, where substantive growth may be 93 retarded or prevented, spores and mycotoxins can still be released (Abbott, 2002; 94
Nielsen et al., 2004). This can be detrimental to both the material, as it may enable 95 degradation by other fungal species and in the case of mycotoxins, to human health. 96 It is highly important to understand how a mould responds to a different substrates 97 and materials susceptibility to microbial attack. Any misunderstanding or poorly 98 informed decisions can have damaging consequences to product industry, economy 99 and human health (Gu, 2016; Gu and Gu, 2005; Mensah-Attipoe et al., 2015). 100
3
Ultimately the best way to determine a materials’ susceptibility to moulds is to 101
physically test the subject material. The aim of this study was the development of a 102 rapid screening method for evaluating the susceptibility of different materials to 103
mould growth under varying conditions and methods of inoculation. The hygric 104 properties of the materials tested were also determined in order to evaluate 105 correlations between mould growth and the materials’ hygric properties. 106 107 2. MATERIALS AND METHODS 108
The method described below, is a further development of the study conducted by 109 Stefanowski et al (2015) which was derived from BS EN ISO 846: 1997 Plastics – 110
Evaluation of the action of microorganisms and ASTM D 4445-91 1991 Standard 111 Method for Testing Fungicides for Controlling Sapstain and Mould on Unseasoned 112 Lumber (Laboratory Method). 113
114 2.1 Materials 115
The materials tested include three commercial grade construction medium density 116 fibre board (MDF), laminated MDF, chipboard and laminated chipboard and three 117 commercial insulation materials sheep’s wool, hemp and wood fibre insulation with 118 solid pine wood (Pinus sylvestris) used as a control. The construction panel 119
specimens were prepared to give an upper surface area of 30 mm2 with the 120 thickness being that of the test material. As the insulation materials were 50 to 121
60mm thick, a subsample of 5mm thickness was removed from the top surface of 122 the material for use as the test specimen. 123 124
2.2 Preconditioning 125
All specimens were conditioned in conditions of 23 ±1 °C and 60 ±3 % RH and once 126
constant mass was reached the specimens were weighed. The specimens to be 127 inoculated with moulds were sterilised with ethanol and water 70:30 (BSI 1997). 128 129
2.3 Hygric 130
The sorption dynamics of natural fibres are complex partly due to fibre internal 131 structure and partly due to continuous nano-structural changes, associated with 132 dynamic behaviour of cell walls (Xie et al., 2010). Two methods were used to 133
determine the material’s sorption properties; Dynamic Vapour Sorption (DVS) and 134 water absorption coefficient (BSI 2002). Pine (Pinus sylvestris) was excluded from 135
the hygric tests. 136 137 2.3.1 Water absorption coefficient 138
This was conducted following the standard BS EN ISO 15148 : 2002, Hygro-thermal 139 Performance of Building Materials and Products – Determination of water absorption 140
coefficient by partial immersion. 141 142
2.3.2 Dynamic Vapour Sorption (DVS) 143 DVS is designed to accurately measure weight changes of a sample (less than 144 10mg), as it absorbs and desorbs moisture at differing relative humidities and 145 temperatures. The sample was suspended in a microbalance within a sealed 146 thermostatically controlled chamber, where a constant flow of dry nitrogen gas was 147
passed over the sample at a flow rate of 200 cm³s-1 and a temperature of 21 ± 0.2 °C 148
(Popescu et al., 2013). The inert gas carried a controlled quantity of water, 149 maintaining a set RH. The schedule for the DVS was set to start at 0% RH and then 150
4
increase in 5% steps up to 95% for the adsorption phase and the reverse for the 151
desorption phase (Popescu et al., 2013). The DVS maintained a given RH until the 152 weight change of the sample was less than 0.002 % min-1. Mass change data were 153
acquired every 20 s. Sorption and desorption isotherms were produced for each 154 material by plotting mass change against relative humidity (RH). 155 156 2.4 Mould tests 157 158
2.4.1 Moulds 159 The mould species chosen for this experiment are based on standards used, 160 however they are also consistently found in indoor environments (Cooley et al., 161 1998). The mould species were acquired from Fungal Biodiversity Centre, Institute of 162 the Royal Netherlands Academy of Arts and Science (KNAW). The species selected 163 were: Aspergillus versicolor (Vuill) CBS 117286, Cladosporium sphaerospermum 164 (Penz) CBS 122.63, Chaetomium globosum (Kunze ex Fr.) CBS 107.14, Penicillium 165
rubens (Biourge) CBS 401.92, Alternaria alternata ((Fr.) Keissl) CBS 120829, 166
Paecilomyces variotti (Bainier) CBS 108945, Trichoderma virens (J.H. Mill, Giddens 167 & A.A. Foster) CBS 100946 and Aureobasidium pullulans (var.pullulans) CBS 168
101160. 169
On the basis of the minimal requirement of available water for fungal growth on 170 material surfaces, indoor fungi and moulds can be divided into primary (<0.80 aw), 171
secondary (0.80 – 0.09 aw) and tertiary colonisers (>0.90 aw) (WHO, 2009). Using 172 this definition the aforementioned moulds are divided into the appropriate colonisers. 173 Primary colonisers; Aspergillus versicolor (Górny, 2004), Paecilomyces variotti 174
(Górny, 2004) and Penicillium rubens (WHO, 2009). Secondary colonisers; 175 Cladosporium sphaerospermum (Górny, 2004) and Alternaria alternata (Klarić et al., 176 2007). Tertiary colonisers; Chaetomium globosum (Klarić et al., 2007) and 177
Trichoderma virens (Górny, 2004). 178 179
2.4.2 Preparation of spores 180 A mixed spore suspension, containing all of the selected mould species, was 181
produced following the method described in BS EN 846 Plastics – Evaluation of the 182
action of microorganisms 1997 183 184 2.4.3 Inoculation and exposure 185 The three mould tests were conducted using sterile 600ml vessels with aluminium 186 lids. 187
For direct/indirect contact test, a mineral salt solution agar was used (BSI, 1997), 188
which was autoclaved at 121°C for 15 minutes, cooled and 60ml was poured into 189
each vessel. 190
To expose samples and moulds to a limited RH, a saturated salt solution was used, 191 mixed with sterilised deionised water, generating a 60% RH within the vessels at 20 192
±2 °C. Sterilised supports were added to each vessel to hold the sample in the 193
centre of vessel. Figure 1 shows a diagram of how the samples were positioned in 194 each of the tests. Two of the 6 replicate samples of each material were placed in one 195 vessel. 196 Specimens were introduced to the vessel one at a time and placed according to test 197 specifications. Samples for the relative humidity experiment were securely sealed to 198 ensure no moisture loss or gain. Each sample for all three experiments was 199

5
inoculated with 1ml of the mould spore solution. The vessels and sample were then 200
stored in a dark chamber at 20 ±2 °C at 70 ±3 % RH for three weeks. 201
Each mould underwent a viability test on sterilised 4% malt agar plates (40g malt 202 extract and agar 20g in 1000ml) apart from, for Chaetomium and Trichoderma 203
moulds, where a 4% oatmeal agar culture was used. 1ml of the spore solution was 204
pipetted onto the agar and spread using a sterile glass rod. The agar plates were 205
then sealed with a wax film and incubated at 20 ±2 °C at 70 ±3 % RH. 206
207 2.3.4. Assessment 208 After exposure to mould, the samples were removed from the vessel and visually 209 evaluated for mould growth (Table 1). Where possible, primary, secondary and 210 tertiary colonisers were identified and recorded. A rating of 1 (present) or 0 (absent) 211
was given to the presence or absence of primary, secondary and tertiary colonisers. 212 The occurrence of the colonisers was given as percentage across the replicates. 213 214
3. RESULTS AND DISCUSSION 215 216 3.1 Wide Range of Moisture Properties 217
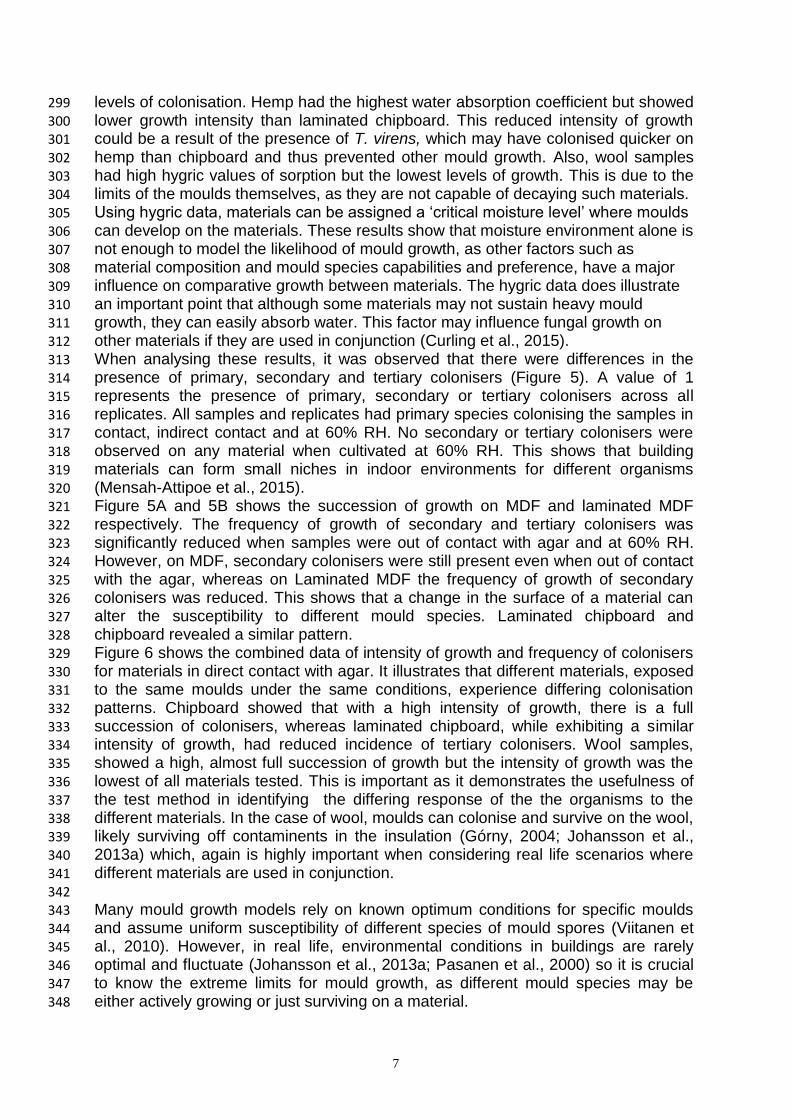
The principle of the water sorption coefficient test was to measure the water 218 absorption by partial immersion in water, by measuring the change in mass over 219 time. Table 2 shows the results for water absorption coefficient. For this test, water 220
absorption relies on capillary action (uptake) and in natural fibres this can cause the 221 swelling of the material. As wood fibres can expand to accommodate additional 222
water (Xie et al., 2010), for wood-based construction materials, the results should 223 therefore be taken as indicative only. 224 Figure 2 shows the mass change over time. Chipboard had almost become 225
saturated by the end of the 24 hour period, as the rate of water uptake decreased. In 226 comparison, MDF and laminated MDF showed a slower, steady rate of water 227
absorption. This could be due to a combination of variables between materials such 228
as particle and resin distribution and the density difference between MDF and 229
chipboard, 700 kg m-3 and 600 kg m-3 respectively. The laminated chipboard showed 230 a slower rate of absorption due to its less permeable melamine coating. Wool and 231
hemp materials became saturated within the first hour as these materials have a low 232 density of 22.64 kg m-3 and 43.72 kg m-3 and therefore can hold less water 233 proportionally within matrix before becoming saturated. Wood fibre insulation has a 234 density of 205.03 kg m-3, therefore absorption was slower but the sample still 235
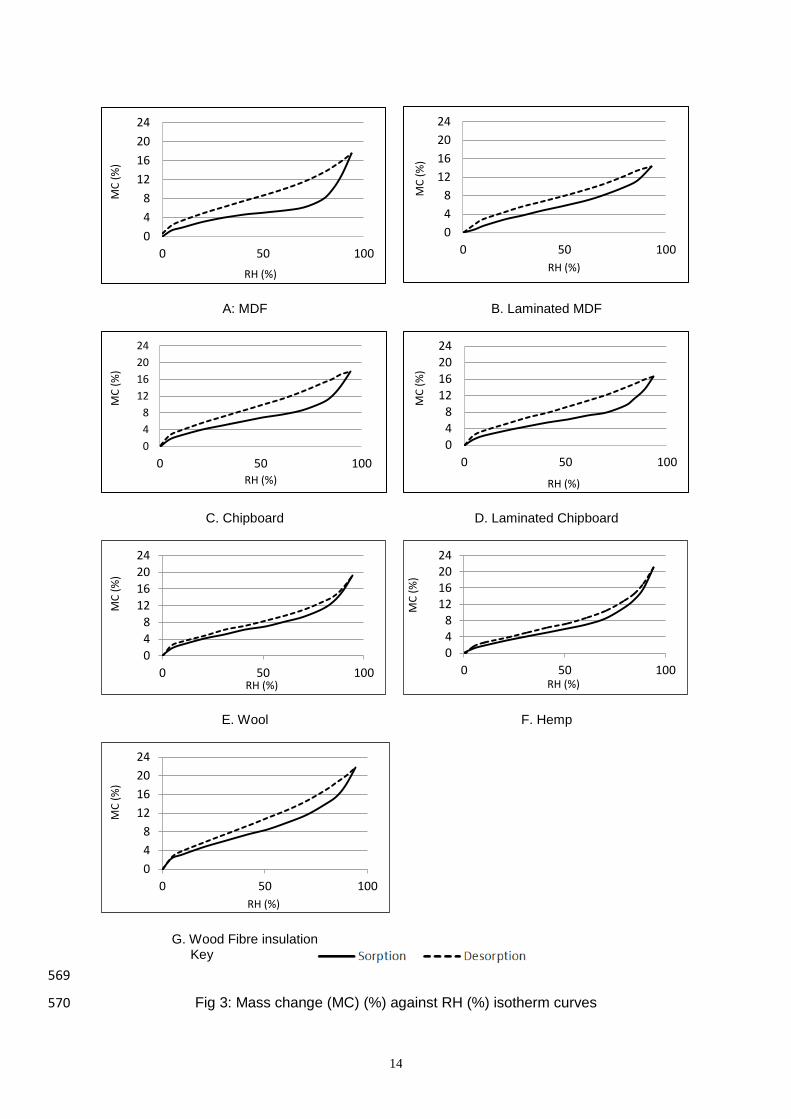
became saturated within 5 hours. The test for all three insulation materials, ceased 236 after four hours, as water was absorbed through to the top surface of the sample. 237 238 The data (figure 3) derived from the DVS shows that all the materials exhibited 239 varying levels of hysteresis (the difference in EMC (equilibrium moisture content) 240
dependent on sorption or desorption) with them all exhibiting IUPAC type 2 sorption 241
and desorption isotherms (Hill et al., 2009). The construction materials all exhibited 242
significant hysteresis effect, though in contrast hemp and wool showed only a small 243 hysteresis effect. This could be related to the materials densities and higher lignin 244 content of the wood-based materials (Hill et al., 2009). 245 Table 2 show the maximum moisture content (EMC) of the material when exposed to 246 humidity of 95%. Hemp absorbed the most moisture at 95% RH with 20% of dry 247 weight and laminated MDF the least at 14.18%. Laminated materials have lower 248

6
EMC values than un-laminated materials due to the presence of the less permeable 249
melamine coating. 250 251
3.2 Material Specific Mould Ecology 252 Observations were made at the end of a three week period to evaluate the mould 253 coverage over the sample (%). Note was taken of the presence of primary, 254 secondary and tertiary species, to give an indication of colonising mould succession 255 and competition. The mineral salt agar was present to act as a moisture source and 256
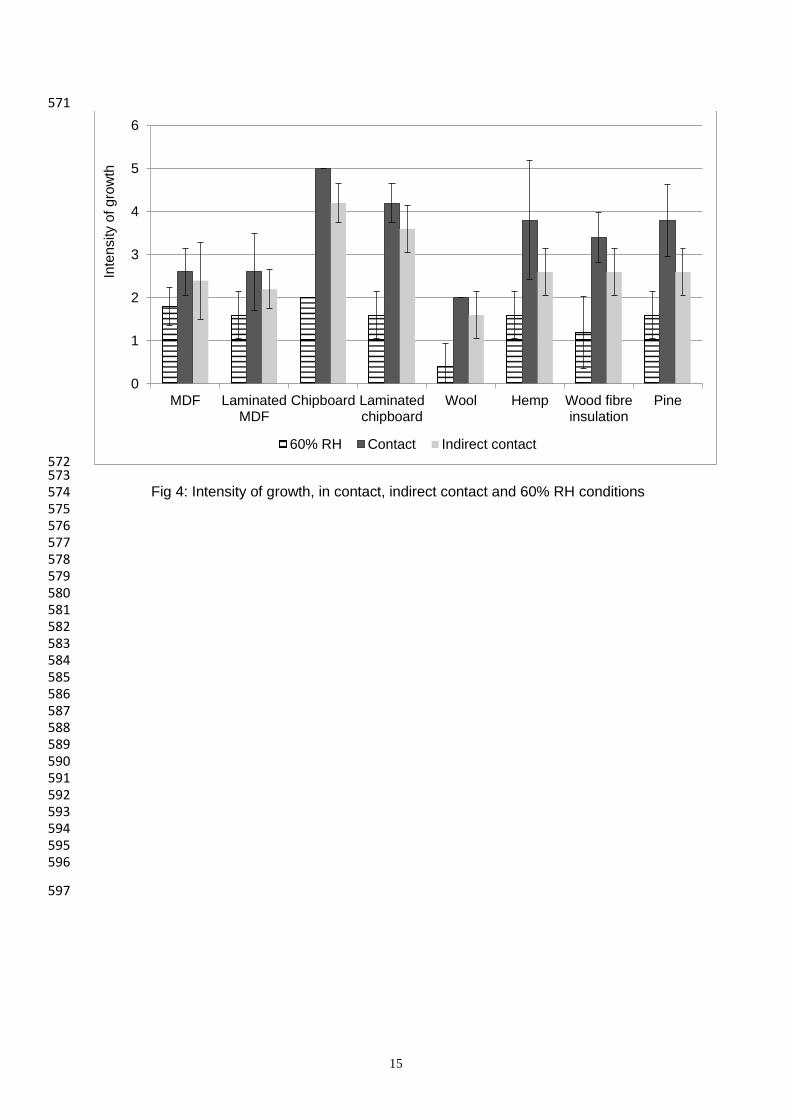
would not act as a carbon source for growth; therefore the mould fungi had to use 257 carbon derived from the samples i.e. utilisation of the sample material (Gu, 2016). 258 Although moulds had successfully grown in all vessels there were differences 259 dependent on the material and exposure method. 260 For contact samples, the chipboard had the highest intensity of growth, (5 rating). 261
Laminated chipboard, hemp and pine had the second highest, (4 rating). Figure 5 262 shows that in the vessels containing chipboard and dense wood fibre, all moulds 263
were present, as primary, secondary and tertiary colonisers were observed. This 264 corresponds to previous work where the greater availability of free water in the 265 structure of the chipboard (Górny, 2004) enhanced its susceptibility to moulds. The 266 data derived from the DVS studies also shows that the chipboard and dense wood 267
fibre had higher moisture contents than the other materials at similar relative 268 humidity levels. However, greater intensity of growth was observed on chipboard, 269
showing a greater susceptibility to moulds than the other materials tested which may 270 be due to availability of nutrients and a preference of the moulds. 271 In contrast the least intensity of growth was observed on MDF and wool – with MDF 272
exhibiting lower nutrient availability than chipboard, because it is processed wood 273 fibre (Johansson et al., 2013a). This shows that moulds attack materials suited to 274
their chemical and physical capabilities and material composition (Gu, 2003). 275 For indirect contact, chipboard (both un-laminated and laminated) had the most 276 intense growth, with a rating of 5 and 4 respectively. All materials showed a reduced 277
intensity of growth when not in direct contact with the agar, expect wood fibre 278 insulation and laminated chipboard (Table 3). This may be indicative that the 279
sample’s hygric properties enhance mould growth through the sorption of moisture 280
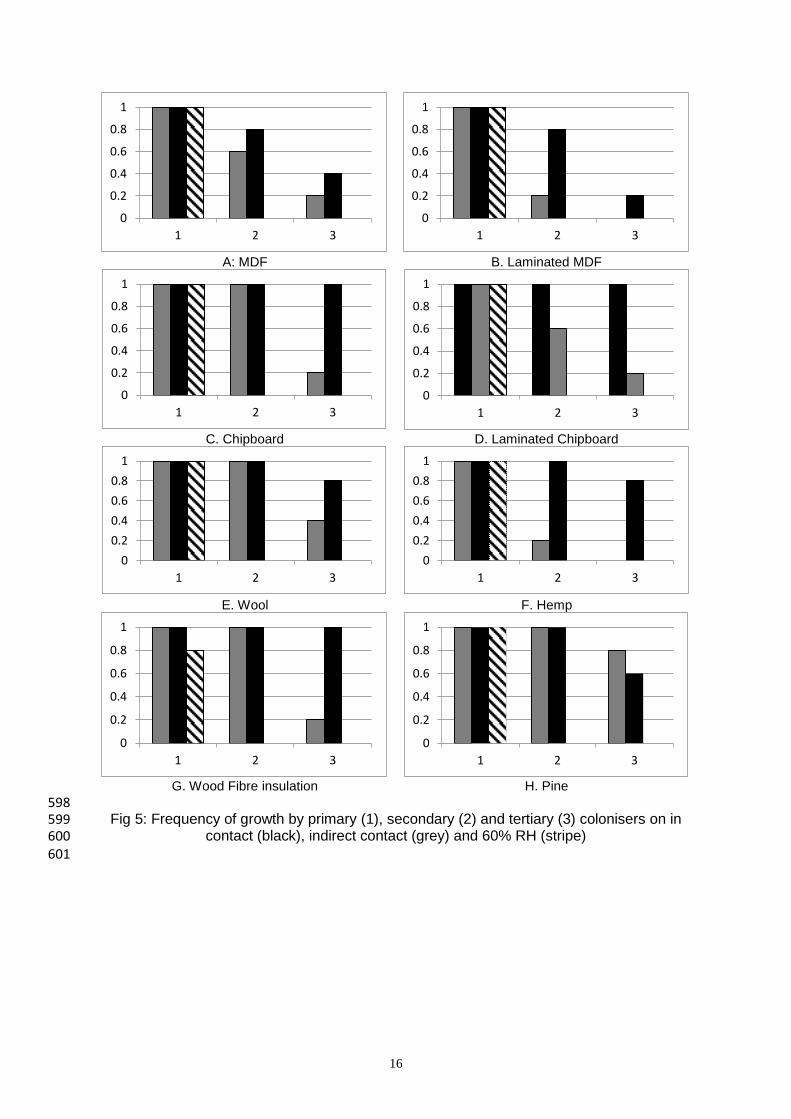
from the agar. However, the presence of primary, secondary and tertiary colonising 281 moulds are similar in both set of samples. 282 From figure 5 it can be observed that primary, secondary and tertiary colonisers 283 were present in all vessels on all samples. It should be noted that where tertiary 284 colonisers occurred >80% of replicates, Trichoderma virens and Chaetomium 285
globosum were the prevalent moulds. Trichoderma sp. where present, had excellent 286
growth, which in other studies has been attributed to its production of antifungal 287 products (Šegvić Klarić et al., 2007) that enable it to outcompete other fungal 288 species (Ghisalberti and Sivasithamparam, 1991; Wiest et al., 2002). 289 Figure 4 graphically shows the difference in mould growth between contact and 290
indirect contact samples. All growth on all materials in contact with agar had a higher 291 intensity of mould growth compared to indirect contact samples, although not 292
statistically different, except for chipboard. This shows the influence of the presence 293 of the moisture in the agar on a sample’s MC and subsequently, mould growth. 294 However, materials with higher water absorption coefficient and MC values, did not 295 necessarily have the highest intensity of growth. 296 There were no clear correlations between water absorption and mould growth as 297 those materials with high levels of water sorption did not always show the highest 298
7
levels of colonisation. Hemp had the highest water absorption coefficient but showed 299
lower growth intensity than laminated chipboard. This reduced intensity of growth 300 could be a result of the presence of T. virens, which may have colonised quicker on 301
hemp than chipboard and thus prevented other mould growth. Also, wool samples 302 had high hygric values of sorption but the lowest levels of growth. This is due to the 303 limits of the moulds themselves, as they are not capable of decaying such materials. 304 Using hygric data, materials can be assigned a ‘critical moisture level’ where moulds 305 can develop on the materials. These results show that moisture environment alone is 306
not enough to model the likelihood of mould growth, as other factors such as 307 material composition and mould species capabilities and preference, have a major 308 influence on comparative growth between materials. The hygric data does illustrate 309 an important point that although some materials may not sustain heavy mould 310 growth, they can easily absorb water. This factor may influence fungal growth on 311
other materials if they are used in conjunction (Curling et al., 2015). 312 When analysing these results, it was observed that there were differences in the 313
presence of primary, secondary and tertiary colonisers (Figure 5). A value of 1 314 represents the presence of primary, secondary or tertiary colonisers across all 315 replicates. All samples and replicates had primary species colonising the samples in 316 contact, indirect contact and at 60% RH. No secondary or tertiary colonisers were 317
observed on any material when cultivated at 60% RH. This shows that building 318 materials can form small niches in indoor environments for different organisms 319
(Mensah-Attipoe et al., 2015). 320 Figure 5A and 5B shows the succession of growth on MDF and laminated MDF 321 respectively. The frequency of growth of secondary and tertiary colonisers was 322
significantly reduced when samples were out of contact with agar and at 60% RH. 323 However, on MDF, secondary colonisers were still present even when out of contact 324
with the agar, whereas on Laminated MDF the frequency of growth of secondary 325 colonisers was reduced. This shows that a change in the surface of a material can 326 alter the susceptibility to different mould species. Laminated chipboard and 327
chipboard revealed a similar pattern. 328 Figure 6 shows the combined data of intensity of growth and frequency of colonisers 329
for materials in direct contact with agar. It illustrates that different materials, exposed 330
to the same moulds under the same conditions, experience differing colonisation 331 patterns. Chipboard showed that with a high intensity of growth, there is a full 332 succession of colonisers, whereas laminated chipboard, while exhibiting a similar 333 intensity of growth, had reduced incidence of tertiary colonisers. Wool samples, 334 showed a high, almost full succession of growth but the intensity of growth was the 335
lowest of all materials tested. This is important as it demonstrates the usefulness of 336 the test method in identifying the differing response of the the organisms to the 337 different materials. In the case of wool, moulds can colonise and survive on the wool, 338 likely surviving off contaminents in the insulation (Górny, 2004; Johansson et al., 339 2013a) which, again is highly important when considering real life scenarios where 340
different materials are used in conjunction. 341 342
Many mould growth models rely on known optimum conditions for specific moulds 343 and assume uniform susceptibility of different species of mould spores (Viitanen et 344 al., 2010). However, in real life, environmental conditions in buildings are rarely 345 optimal and fluctuate (Johansson et al., 2013a; Pasanen et al., 2000) so it is crucial 346 to know the extreme limits for mould growth, as different mould species may be 347 either actively growing or just surviving on a material. 348
8
From the DVS isotherms, it can be observed that different materials absorb vapour 349
at different rates at different RH. It is considered that the limit value of relative 350 humidity is between 70-90% for fungal growth on building materials (Pasanen et al., 351
2000). However, as mould species have differing limiting conditions, a study was 352 made to determine the effects on colonisation, growth and competition at a lower 353 limit of 60% RH. This showed that only primary colonising moulds were observed 354 growing on construction materials at 60% RH (Figure 5). 355 Table 3 shows the differences in intensity of growth at 60% on different materials. 356
The highest moisture content observed was that of chipboard, at just under 10% MC 357 and this is generally considered too low for mould growth, although in this study 358 mould growth was obvious on all samples. This could be a result from the initial 359 equilibration period, following inoculation, where water availability was slightly 360 higher. After which time the mould growth rate reduced but primary colonisers were 361
largely established. It was observed that the most intense growth was on the wood-362 based materials, with chipboard showing the greatest growth (2 rating). This is highly 363 important as there is evidence that Penicillium species are strong indoor 364
contaminants and contribute significantly to SBS (Abbott, 2002; Cooley et al., 1998). 365 No secondary or tertiary growth was observed in any vessels. This is due to the MC 366 requirements of the mould species, as only xerophyllic moulds (dry loving) such as 367 Aspergillus and Penicillium species were observed, which require <0.80 aw (Pasanen 368
et al., 2000a). The same was observed by Pasanen et al., 2000 were xerophyllic 369
moulds have great prevalence at low water activity. Secondary and tertiary 370 colonisers are more hydrophyllic moulds and require higher levels of moisture to 371 successfully grow and colonise a material. 372
Figure 6 graphically depicts the differences between intensity of growth of mould on 373 sample materials in contact and indirect contact, at optimal conditions and at 60% 374
RH. It highlights the differences between growth at optimal and less than optimal 375 conditions, which is important to understand these relationships as moulds can still 376 produce metabolites and mycotoxins at low RH and temperatures (Nielsen et al., 377
2004). Statistically there is a difference between intensity of growth between test 378 conditions on materials tested, except for MDF and laminated MDF. This indicates 379
that MDF may have a lower MC requirement to support mould growth. 380
The results also show that moulds will grow on all materials even at limiting 381 conditions, albeit with reduced growth. This suggests that testing specific material 382 characteristics on a small scale may not be representative of the full product, due to 383 bulk effects, especially when considering composite materials. 384 385
3.3 Fast and Versatile Method 386 This rapid screening method took only 3 weeks to obtain data on a materials’ 387 susceptibility to mould growth. However, consideration must be given to time as an 388 influencing factor for mould growth (Vereecken and Roels, 2012). If a mould species 389 is known to have a slow growth rate, extra time should be provided. It has an 390
advantage over BS EN 846 in that it can be used for a range of materials and not 391 just plastics. The method uses the principle from ASTM D 4445 to use a support, 392
which can be used to evaluate the vulnerability of the material as a “carrier” of 393 moulds. This may be important when considering wall constructs. As with wool for 394 example, although all moulds were present, the intensity of growth on the wool itself 395 was minimal in both situations but the mould growth on wool implies it will not act as 396 barrier for more vulnerable materials such as MDF. This can result in the spread of 397 moulds and may increase the materials and adjacent materials vulnerability to 398

9
degradation fungi. Testing materials at lower RH can show which, if any species can 399
survive and continue to utilise the material. This is especially important when 400 considering drying materials, particularly after water damage (A.-L. Pasanen et al., 401
2000). 402 Although in this study a mixed spore suspension of commonly used test strains was 403 used, the method is equally adaptable for use with specific single mould types or a 404 mix of test or naturally isolated fungal strains. The method is also adaptable for study 405 of any construction or insulation material and the test environmental conditions can 406
be altered to simulate particular environmental conditions a material is intended for. 407 Using the 600 ml vessel over thinner agar plates, enables the testing of whole 408 thickness samples rather than thinner sample. This is highly beneficial especially 409 when testing composite materials. At full thickness, the sample is more 410 representative of the product and the interactions with moisture and subsequent 411
mould growth are more comparable with the product in service. It is also beneficial 412 as it tests any bulk effects of the product. 413
414 4. Conclusion 415 Identification of susceptible materials and mould growth patterns is highly important, 416 especially when considering toxic moulds. This study developed a rapid screening 417
method to enable the determination of the susceptibility of different materials to 418 different mould species. The method provides data enabling identification of more 419
vulnerable materials, materials that may have synergistic with other materials, 420 material responses to varying moisture environments and consequential mould 421 growth dynamics under varying environmental conditions: data which is unlikely to 422
be obtained by modelling alone. 423 424
5. ACKNOWLEDGEMENTS 425 This project has received funding from the European Union’s Seventh Framework 426 Programme for research technological development and demonstration under grant 427
agreement no 609234. 428 429
6. REFERENCES 430
ASTM D 4445-91 : 1991, Standard Method for Testing Fungicides for Controlling 431 Sapstain and Mould on Unseasoned Lumber (Laboratory Method) ASTM 432 International, West Conshohocken, PA, 1991 433
BSI (1997) EN ISO 846 : 1997, Plastics – Evaluation of the action of 434 microorganisms, Second edition 1997. British Standards Institute 435
BSI (2002) BS EN ISO 15148 : 2002, Hygro-thermal Performance of Building 436 Materials and Products – Determination of water absorption coefficient by 437 partial immersion. British Standards Institute 438
Abbott, S.P., 2002. Mycotoxins and Indoor Molds. Indoor Environ. Connect. 3. 439 Airaksinen, M., Kurnitski, J., Pasanen, P., Seppänen, O., 2004. Fungal spore 440
transport through a building structure. Indoor Air 14, 92–104. 441 doi:10.1046/j.1600-0668.2003.00215.x 442
Clarke, J.A., Johnstone, C.M., Kelly, N.J., McLean, R.C., anderson, J.A., Rowan, 443 N.J., Smith, J.E., 1999. A technique for the prediction of the conditions leading 444 to mould growth in buildings. Build. Environ. 34, 515–521. doi:10.1016/S0360-445 1323(98)00023-7 446

10
Cooley, J.D., Wong, W.C., Jumper, C.A., Straus, D.C., 1998. Correlation between the 447
prevalence of certain fungi and sick building syndrome. Occup. Environ. Med. 448 55, 579–584. doi:10.1136/oem.55.9.579 449
Curling, S., F., Stefanowski, B.K., Mansour, E., Ormondroyd, G.A., 2015. Applicability 450 of wood durability testing methods to bio-based building materials, in: IRG 451 Annual Meeting (ISSN 2000-8953). International Research Groupd on Wood 452 Protection (IRG 46), Vina del Mar, Chile. 453
Ghisalberti, E.L., Sivasithamparam, K., 1991. Antifungal antibiotics produced by 454
Trichoderma spp. Soil Biol. Biochem. 23, 1011–1020. doi:10.1016/0038-455 0717(91)90036-J 456
Górny, R.L., 2004. Filamentous Microorganisms and Their Fragments in Indoor Are – 457 A Review. Ann. Agric. Environ. Med. 11, 185–197. 458
Gu, J.-D., 2016. Biodegradation Testing: So Many Tests, but Very Little New 459
Innovation. Appl. Environ. Biotechnol. 1. doi:10.18063/AEB.2016.01.007 460 Gu, J.-D., 2003. Microbiological deterioration and degradation of synthetic polymeric 461
materials: recent research advances. Int. Biodeterior. Biodegrad. 52, 69–91. 462 doi:10.1016/S0964-8305(02)00177-4 463
Gu, J.-G., Gu, J.-D., 2005. Methods Currently Used in Testing Microbiological 464 Degradation and Deterioration of a Wide Range of Polymeric Materials with 465
Various Degree of Degradability: A Review. J. Polym. Environ. 13, 65–74. 466 doi:10.1007/s10924-004-1230-7 467
Hill, C.A.S., Norton, A., Newman, G., 2009. The water vapor sorption behavior of 468 natural fibers. J. Appl. Polym. Sci. 112, 1524–1537. doi:10.1002/app.29725 469
Jarvis, B.B., Miller, J.D., 2004. Mycotoxins as harmful indoor air contaminants. Appl. 470
Microbiol. Biotechnol. 66, 367–372. doi:10.1007/s00253-004-1753-9 471 Johansson, P., Bok, G., Ekstrand-Tobin, A., 2013a. The effect of cyclic moisture and 472
temperature on mould growth on wood compared to steady state conditions. 473 Build. Environ. 65, 178–184. doi:10.1016/j.buildenv.2013.04.004 474
Johansson, P., Ekstrand-Tobin, A., Svensson, T., Bok, G., 2012. Laboratory study to 475
determine the critical moisture level for mould growth on building materials. 476 Int. Biodeterior. Biodegrad. 73, 23–32. doi:10.1016/j.ibiod.2012.05.014 477
Johansson, P., Svensson, T., Ekstrand-Tobin, A., 2013b. Validation of critical 478
moisture conditions for mould growth on building materials. Build. Environ. 62, 479 201–209. doi:10.1016/j.buildenv.2013.01.012 480
Mensah-Attipoe, J., Reponen, T., Salmela, A., Veijalainen, A.-M., Pasanen, P., 2015. 481 Susceptibility of green and conventional building materials to microbial growth. 482 Indoor Air 25, 273–284. doi:10.1111/ina.12140 483
Nielsen, K., Fog, 2003. Mycotoxin production by indoor molds. Fungal Genet. Biol. 484 39, 103–117. doi:10.1016/S1087-1845(03)00026-4 485
Nielsen, K.F., Holm, G., Uttrup, L.P., Nielsen, P.A., 2004. Mould growth on building 486 materials under low water activities. Influence of humidity and temperature on 487 fungal growth and secondary metabolism. Int. Biodeterior. Biodegrad. 54, 488
325–336. doi:10.1016/j.ibiod.2004.05.002 489 Ojanen, T., Viitanen, H., Peuhkuri, R., 2007. Modelling of Mould Growth in Building 490
Envelopes – Existing models, discussion on improvement aspects, sensibility 491 analysis. [WWW Document]. URL 492 http://www.kuleuven.be/bwf/projects/annex41/protected/data/VTT%20Oct%20493 2007%20Paper%20A41-T4-Fin-07-1.pdf (accessed 8.12.16). 494

11
Pasanen, A.-L., Juutinen, T., Jantunen, M.J., Kalliokoski, P., 1992. Occurrence and 495
moisture requirements of microbial growth in building materials. Int. 496 Biodeterior. Biodegrad. 30, 273–283. doi:10.1016/0964-8305(92)90033-K 497
Pasanen, A.-L., Kasanen, J.-P., Rautiala, S., Ikäheimo, M., Rantamäki, J., 498 Kääriäinen, H., Kalliokoski, P., 2000. Fungal growth and survival in building 499 materials under fluctuating moisture and temperature conditions. Int. 500 Biodeterior. Biodegrad. 46, 117–127. doi:10.1016/S0964-8305(00)00093-7 501
Pasanen, A.L., Rautiala, S., Kasanen, J.P., Raunio, P., Rantamäki, J., Kalliokoski, P., 502
2000. The Relationship between Measured Moisture Conditions and Fungal 503 Concentrations in Water-Damaged Building Materials. Indoor Air 10, 111–120. 504 doi:10.1034/j.1600-0668.2000.010002111.x 505
Popescu, C.-M., Hill, C.A.S., Curling, S., Ormondroyd, G., Xie, Y., 2013. The water 506 vapour sorption behaviour of acetylated birch wood: how acetylation affects 507
the sorption isotherm and accessible hydroxyl content. J. Mater. Sci. 49, 508 2362–2371. doi:10.1007/s10853-013-7937-x 509
Sadovský, Z., Koronthályová, O., Matiašovský, P., Mikulová, K., 2013. Probabilistic 510 modelling of mould growth in buildings. J. Build. Phys. 1744259113496370. 511 doi:10.1177/1744259113496370 512
Schmidt, O., 2006. Wood and Tree Fungi: Biology, Damage, Protection, and Use. 513
Springer Science & Business Media. 514 Šegvić Klarić, M., Kosalec, I., Mastelić, J., Piecková, E., Pepeljnak, S., 2007. 515
Antifungal activity of thyme (Thymus vulgaris L.) essential oil and thymol 516 against moulds from damp dwellings. Lett. Appl. Microbiol. 44, 36–42. 517 doi:10.1111/j.1472-765X.2006.02032.x 518
Vereecken, E., Roels, S., 2012. Review of mould prediction models and their 519 influence on mould risk evaluation. Build. Environ. 51, 296–310. 520
doi:10.1016/j.buildenv.2011.11.003 521 Viitanen, H., Vinha, J., Salminen, K., Ojanen, T., Peuhkuri, R., Paajanen, L., 522
Lähdesmäki, K., 2010. Moisture and Bio-deterioration Risk of Building 523
Materials and Structures. J. Build. Phys. 33, 201–224. 524 doi:10.1177/1744259109343511 525
Wiest, A., Grzegorski, D., Xu, B.-W., Goulard, C., Rebuffat, S., Ebbole, D.J., Bodo, 526
B., Kenerley, C., 2002. Identification of Peptaibols from Trichoderma virens 527 and Cloning of a Peptaibol Synthetase. J. Biol. Chem. 277, 20862–20868. 528
Xie, Y., Hill, C.A.S., Jalaludin, Z., Curling, S.F., Anandjiwala, R.D., Norton, A.J., 529 Newman, G., 2010. The dynamic water vapour sorption behaviour of natural 530 fibres and kinetic analysis using the parallel exponential kinetics model. J. 531
Mater. Sci. 46, 479–489. doi:10.1007/s10853-010-4935-0 532 533 534 535 536
537 538
539 540 541 542 543 544
12
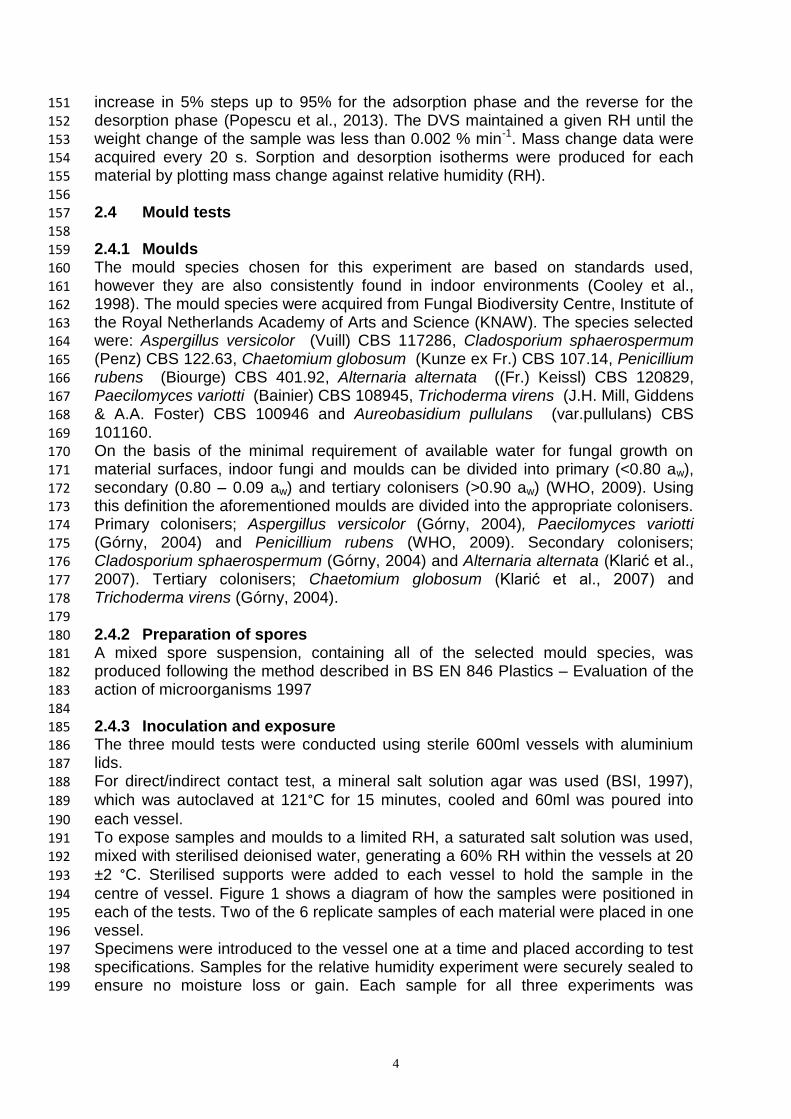
Table 1: Visual assessment of mould growth (BSI, 1997) 545
Intensity of growth
Evaluation
0 No growth apparent under the microscope
1 No visible growth to the naked eye but visible under a microscope
2 Visible growth, up to 25% coverage
3 Visible growth up to 50% coverage
4 Visible growth up to 75% coverage
5 Heavy growth, covering more than 75% of sample surface
546
547 Table 2: Water absorption coefficient and EMC of test materials at 95% and 60% RH 548
Material Water absorption
coefficient (Kg/(m2 hr-1) EMC at 95%
RH (%) EMC at 60%
RH (%)
MDF 3.25 17.46 7.92
Laminated MDF 3.38 14.18 7.55
Chipboard 4.65 18.01 9.39
Laminated chipboard 4.25 16.58 9.28
Hemp 5.28 20.92 4.02
Wood fibre insulation 2.50 21.77 4.21
Wool 4.50 19.17 11.78
549 550 551
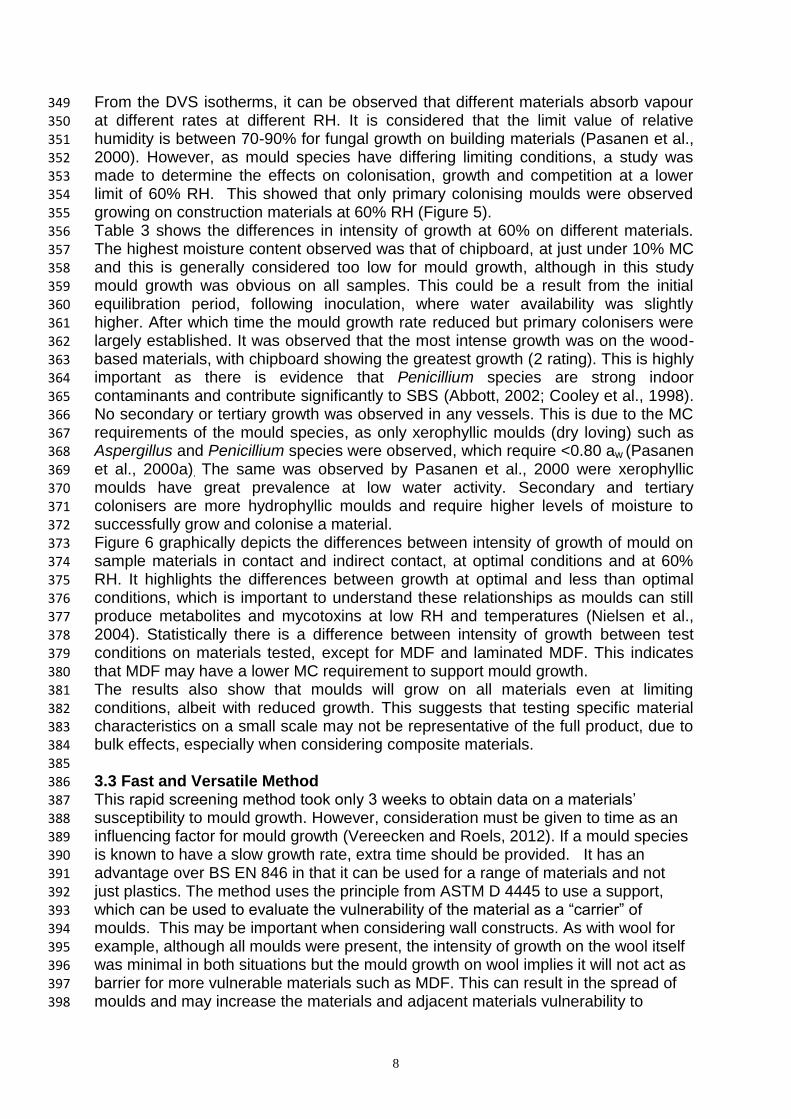
Table 3: Intensity of mould growth on sample in contact and indirect contact with 552 agar and suboptimal conditions at 60% RH 553
Material Intensity of growth
Contact Indirect contact 60% RH
MDF 3 2 1.8
Laminated MDF 3 2 1.6
Chipboard 5 4 2
Laminated chipboard 4 4 1.6
Wool 2 1 0.4
Hemp 4 3 1.6
Wood fibre insulation 3 3 1.2
Pine 4 3 1.6
554
555 556 557 558

13
559
Fig 1: A; Sample in direct contact with agar, B; Sample indirect contact and C; Sample raised 560 to the centre of the vessel RH test 561
562 563 564 565
566
Fig 2: Water absorption of construction (a) and insulation (b) materials 567
568
0
2
4
6
8
10
12
0 5 10 15 20 25
Ma
ss c
ha
ng
e (
Kg
m2 -
1)
Time (hours)
MDF L-MDF Chipboard L-CB
0
10
20
30
40
50
60
0 0.5 1 1.5 2 2.5 3 3.5 4 4.5
Ma
ss c
ha
ng
e (
Kg
m2 -
1)
Time (hours)
Hemp Wool Wood fibre insulation
14
A: MDF B. Laminated MDF
C. Chipboard D. Laminated Chipboard
E. Wool F. Hemp
G. Wood Fibre insulation Key
569
Fig 3: Mass change (MC) (%) against RH (%) isotherm curves 570
0
4
8
12
16
20
24
0 50 100
MC
(%
)
RH (%)
0
4
8
12
16
20
24
0 50 100
MC
(%
)
RH (%)
048
12162024
0 50 100
MC
(%
)
RH (%)
0
4
8
12
16
20
24
0 50 100
MC
(%
)
RH (%)
048
12162024
0 50 100
MC
(%
)
RH (%)
0
4
8
12
16
20
24
0 50 100
MC
(%
)
RH (%)
0
4
8
12
16
20
24
0 50 100
MC
(%
)
RH (%)
15
571
572 573
Fig 4: Intensity of growth, in contact, indirect contact and 60% RH conditions 574 575 576 577 578 579 580 581 582 583 584 585 586 587 588 589 590 591 592 593 594 595 596
597
0
1
2
3
4
5
6
MDF LaminatedMDF
Chipboard Laminatedchipboard
Wool Hemp Wood fibreinsulation
Pine
Inte
nsity o
f g
row
th
60% RH Contact Indirect contact
16
A: MDF B. Laminated MDF
C. Chipboard D. Laminated Chipboard
E. Wool F. Hemp
G. Wood Fibre insulation H. Pine
598 Fig 5: Frequency of growth by primary (1), secondary (2) and tertiary (3) colonisers on in 599
contact (black), indirect contact (grey) and 60% RH (stripe) 600 601
0
0.2
0.4
0.6
0.8
1
1 2 3
0
0.2
0.4
0.6
0.8
1
1 2 3
0
0.2
0.4
0.6
0.8
1
1 2 3
0
0.2
0.4
0.6
0.8
1
1 2 3
0
0.2
0.4
0.6
0.8
1
1 2 3
0
0.2
0.4
0.6
0.8
1
1 2 3
0
0.2
0.4
0.6
0.8
1
1 2 3
0
0.2
0.4
0.6
0.8
1
1 2 3

17
602 603
Fig 6: Intensity of growth and frequency of primary, secondary and tertiary colonisers on in 604 contact samples 605
606
0
1
2
3
4
5
6
0
1
2
3
MDF LaminatedMDF
Chipboard Laminatedchipboard
Wool Hemp Wood fibreinsulation
Pine
Inte
nsity
of
Gro
wth
Fre
quency o
f C
olo
nis
ers
Primary Secondary tertiary Intensity of growth