Interim Results to 30 November 2010
12
VICTORIA OIL AND GAS PLC (‘VOG’ or the ‘Company’) INTERIM FINANCIAL REPORT FOR THE SIX MONTHS TO 30 NOVEMBER 2010 CHAIRMAN’S STATEMENT Dear Shareholder, It is my pleasure to provide an update of your Company since the release of the 2010 Annual Results. Following the AGM on the 30 November, VOG completed the fundraising of £10.8m in new equity to reinforce our capital base. This capital underpins our transformation to a producing and cash generating company at our flagship Logbaba Gas field in Cameroon. Award of the Exploitation Decree for the Logbaba Gas Field, to be signed by the President of Cameroon, His Excellency Paul Biya, is imminent. We must remember that this is a very high profile project in Cameroon and the first Exploitation Decree of its type to be issued. Once the decree has been issued, we expect to deliver first gas sales within five months. Logbaba has aroused much interest in Cameroon. Over the last three months, Rodeo Development Limited, our subsidiary company in Cameroon has participated in many fact-finding meetings and discussions with Government, the Office of the President and industrial customers. In addition, we have had many community meetings and consultations with local chiefs and civic leaders. We are respecting these procedures and the response has been universally positive. While these discussions have been underway, we have advanced the project on every front: • All design and engineering is complete. • All equipment has been procured and transported to site. • Expro Worldwide B.V, who has been awarded the contract for the leased process gas separation and cleaning facilities, has shipped their equipment into Cameroon and this is ready to be constructed and commissioned. • Contracts for civil works at the Logbaba site and trenching and installation of the pipeline have been tendered and evaluated and we are ready to award these contracts upon receipt of the Decree. • As for other permits, the Company has obtained a Certificate of Environmental Conformance from the Ministry of Environment and Natural Affairs. We have secured a Letter of Approval for the right to work in public roads from the Douala City Council, Public Works Department. In addition, the Company has negotiated Transit Agreements with two state companies, Magzi Industrial Estate and Camrail, (the state railway company,) upon whose land part of the pipeline will be installed and we expect these to be signed shortly. Finally, the Demolition and Construction Permits for civils works at the Logbaba Site have been reviewed and are ready to be granted from the Douala City Council, Department of Construction and Urban Environment. We remain on course to have a very successful year at Logbaba. The delay in getting the Exploitation Decree is minor in the overall context of this project and the future remains very exciting for us all.
-
Upload
victoria-oil-and-gas-plc -
Category
Documents
-
view
255 -
download
3
Transcript of Interim Results to 30 November 2010

VICTORIA OIL AND GAS PLC (‘VOG’ or the ‘Company’)
INTERIM FINANCIAL REPORT FOR THE SIX MONTHS TO 30 NOVEMBER 2010
CHAIRMAN’S STATEMENT
Dear Shareholder,
It is my pleasure to provide an update of your Company since the release of the 2010 Annual
Results. Following the AGM on the 30 November, VOG completed the fundraising of £10.8m in
new equity to reinforce our capital base. This capital underpins our transformation to a producing
and cash generating company at our flagship Logbaba Gas field in Cameroon.
Award of the Exploitation Decree for the Logbaba Gas Field, to be signed by the President of
Cameroon, His Excellency Paul Biya, is imminent. We must remember that this is a very high
profile project in Cameroon and the first Exploitation Decree of its type to be issued. Once the
decree has been issued, we expect to deliver first gas sales within five months.
Logbaba has aroused much interest in Cameroon. Over the last three months, Rodeo Development
Limited, our subsidiary company in Cameroon has participated in many fact-finding meetings and
discussions with Government, the Office of the President and industrial customers. In addition, we
have had many community meetings and consultations with local chiefs and civic leaders. We are
respecting these procedures and the response has been universally positive.
While these discussions have been underway, we have advanced the project on every front:
• All design and engineering is complete.
• All equipment has been procured and transported to site.
• Expro Worldwide B.V, who has been awarded the contract for the leased process gas
separation and cleaning facilities, has shipped their equipment into Cameroon and this is
ready to be constructed and commissioned.
• Contracts for civil works at the Logbaba site and trenching and installation of the pipeline
have been tendered and evaluated and we are ready to award these contracts upon receipt of
the Decree.
• As for other permits, the Company has obtained a Certificate of Environmental
Conformance from the Ministry of Environment and Natural Affairs. We have secured a
Letter of Approval for the right to work in public roads from the Douala City Council,
Public Works Department. In addition, the Company has negotiated Transit Agreements
with two state companies, Magzi Industrial Estate and Camrail, (the state railway
company,) upon whose land part of the pipeline will be installed and we expect these to be
signed shortly. Finally, the Demolition and Construction Permits for civils works at the
Logbaba Site have been reviewed and are ready to be granted from the Douala City
Council, Department of Construction and Urban Environment.
We remain on course to have a very successful year at Logbaba. The delay in getting the
Exploitation Decree is minor in the overall context of this project and the future remains very
exciting for us all.
2
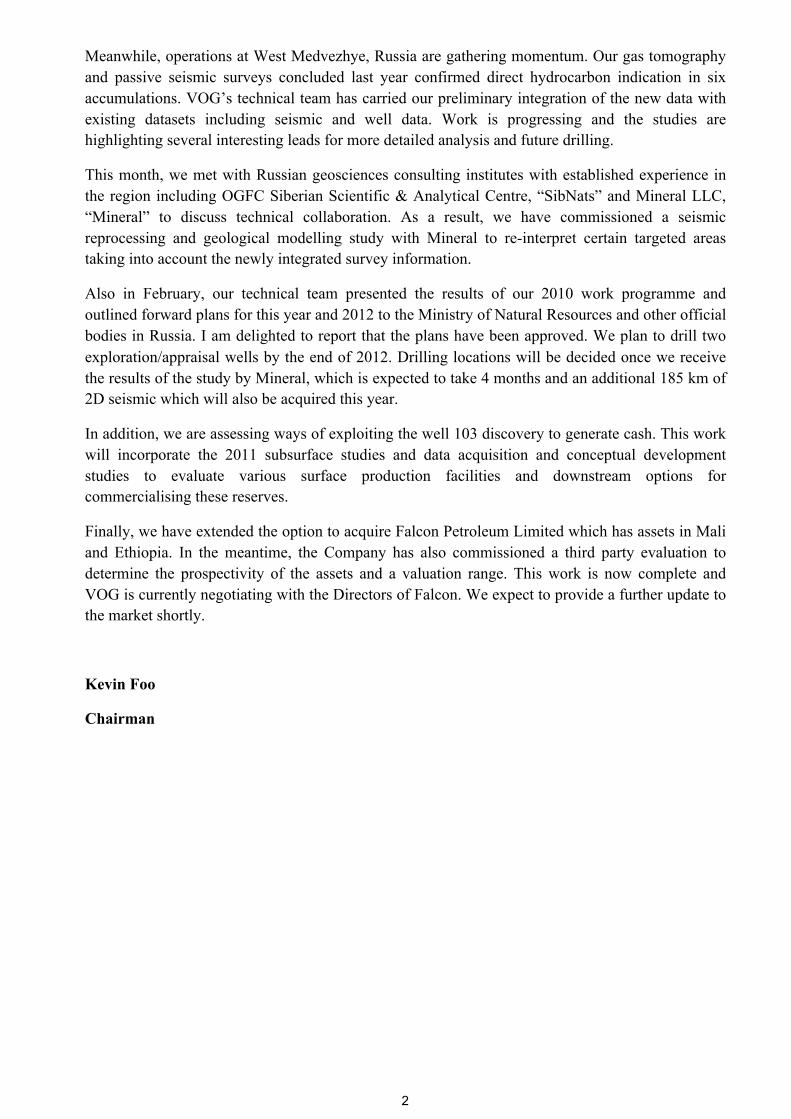
Meanwhile, operations at West Medvezhye, Russia are gathering momentum. Our gas tomography
and passive seismic surveys concluded last year confirmed direct hydrocarbon indication in six
accumulations. VOG’s technical team has carried our preliminary integration of the new data with
existing datasets including seismic and well data. Work is progressing and the studies are
highlighting several interesting leads for more detailed analysis and future drilling.
This month, we met with Russian geosciences consulting institutes with established experience in
the region including OGFC Siberian Scientific & Analytical Centre, “SibNats” and Mineral LLC,
“Mineral” to discuss technical collaboration. As a result, we have commissioned a seismic
reprocessing and geological modelling study with Mineral to re-interpret certain targeted areas
taking into account the newly integrated survey information.
Also in February, our technical team presented the results of our 2010 work programme and
outlined forward plans for this year and 2012 to the Ministry of Natural Resources and other official
bodies in Russia. I am delighted to report that the plans have been approved. We plan to drill two
exploration/appraisal wells by the end of 2012. Drilling locations will be decided once we receive
the results of the study by Mineral, which is expected to take 4 months and an additional 185 km of
2D seismic which will also be acquired this year.
In addition, we are assessing ways of exploiting the well 103 discovery to generate cash. This work
will incorporate the 2011 subsurface studies and data acquisition and conceptual development
studies to evaluate various surface production facilities and downstream options for
commercialising these reserves.
Finally, we have extended the option to acquire Falcon Petroleum Limited which has assets in Mali
and Ethiopia. In the meantime, the Company has also commissioned a third party evaluation to
determine the prospectivity of the assets and a valuation range. This work is now complete and
VOG is currently negotiating with the Directors of Falcon. We expect to provide a further update to
the market shortly.
Kevin Foo
Chairman
3
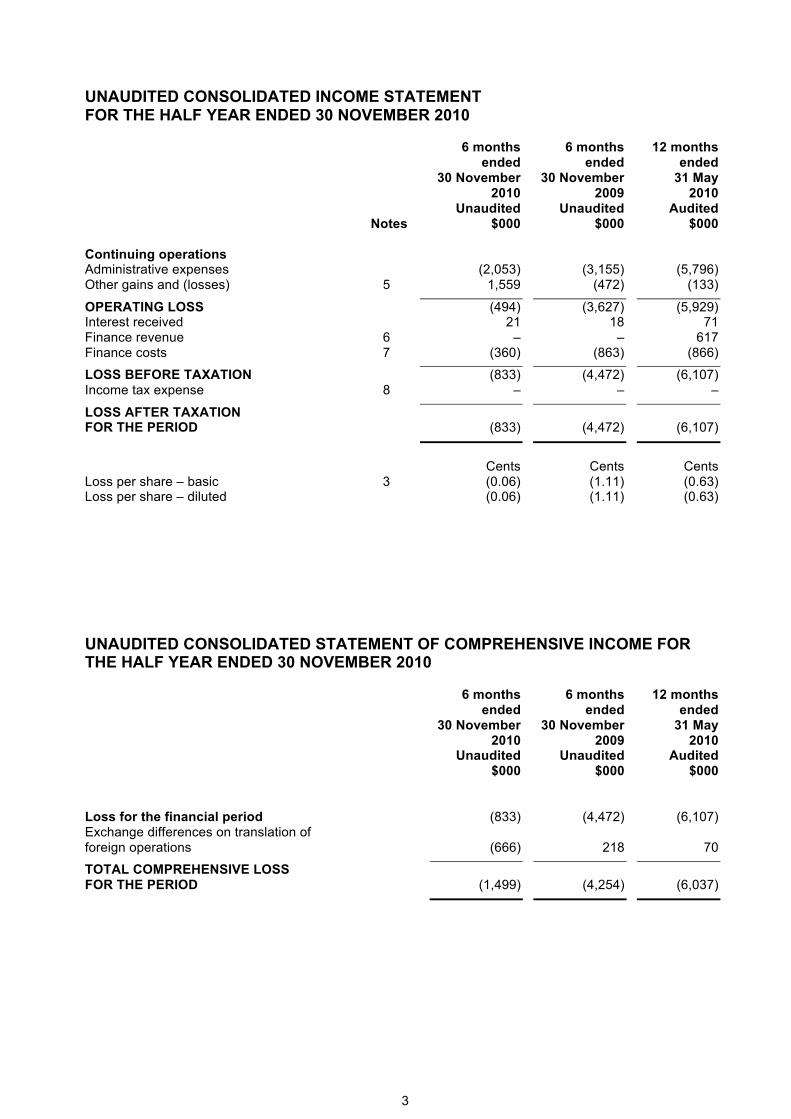
UNAUDITED CONSOLIDATED INCOME STATEMENT FOR THE HALF YEAR ENDED 30 NOVEMBER 2010
6 months ended
30 November 2010
6 months ended
30 November 2009
12 months ended
31 May 2010
Unaudited Unaudited Audited Notes $000 $000 $000
Continuing operations Administrative expenses (2,053) (3,155) (5,796) Other gains and (losses) 5 1,559 (472) (133)
OPERATING LOSS (494) (3,627) (5,929) Interest received 21 18 71 Finance revenue 6 – – 617 Finance costs 7 (360) (863) (866)
LOSS BEFORE TAXATION (833) (4,472) (6,107) Income tax expense 8 – – –
LOSS AFTER TAXATION FOR THE PERIOD (833) (4,472) (6,107)
Cents
Cents
Cents
Loss per share – basic 3 (0.06) (1.11) (0.63) Loss per share – diluted (0.06) (1.11) (0.63)
UNAUDITED CONSOLIDATED STATEMENT OF COMPREHENSIVE INCOME FOR THE HALF YEAR ENDED 30 NOVEMBER 2010
6 months ended
30 November 2010
6 months ended
30 November 2009
12 months ended
31 May 2010
Unaudited Unaudited Audited $000 $000 $000
Loss for the financial period (833) (4,472) (6,107) Exchange differences on translation of foreign operations (666) 218 70
TOTAL COMPREHENSIVE LOSS FOR THE PERIOD (1,499) (4,254) (6,037)
4
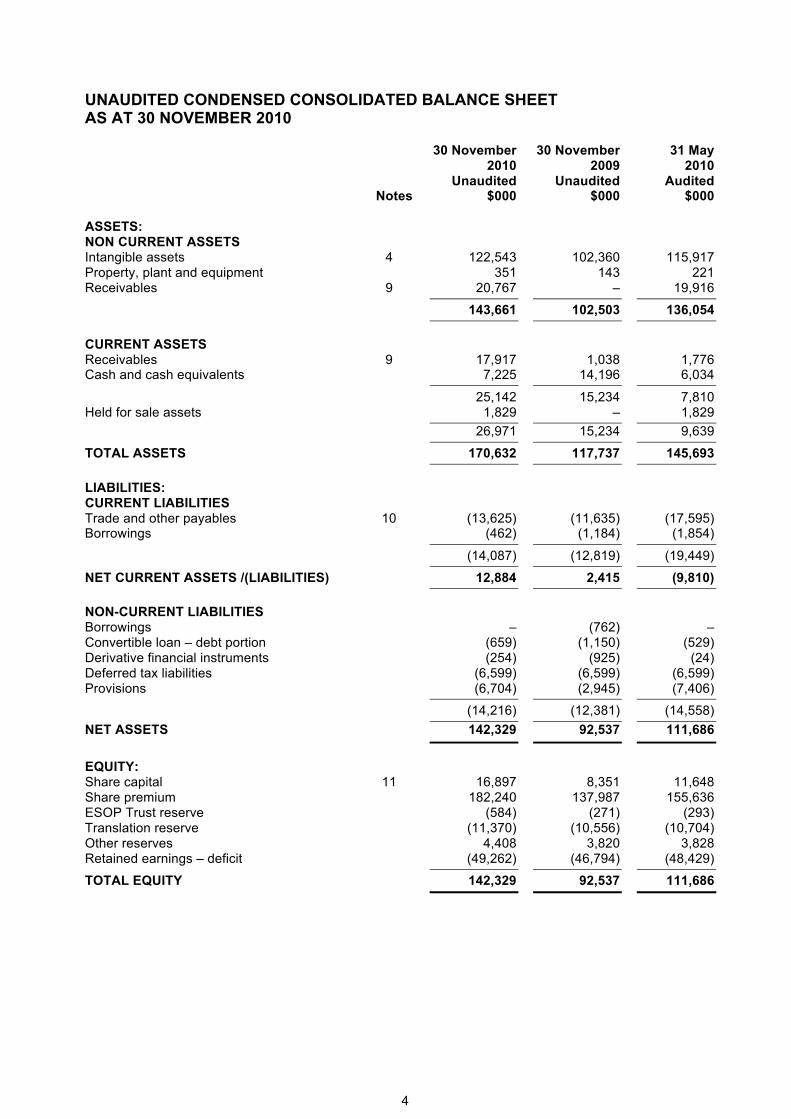
UNAUDITED CONDENSED CONSOLIDATED BALANCE SHEET AS AT 30 NOVEMBER 2010
30 November
2010 30 November
2009 31 May
2010 Unaudited Unaudited Audited Notes $000 $000 $000
ASSETS: NON CURRENT ASSETS Intangible assets 4 122,543 102,360 115,917 Property, plant and equipment 351 143 221 Receivables 9 20,767 – 19,916
143,661 102,503 136,054
CURRENT ASSETS Receivables 9 17,917 1,038 1,776 Cash and cash equivalents 7,225 14,196 6,034
25,142 15,234 7,810 Held for sale assets 1,829 – 1,829
26,971 15,234 9,639
TOTAL ASSETS 170,632 117,737 145,693
LIABILITIES: CURRENT LIABILITIES Trade and other payables 10 (13,625) (11,635) (17,595) Borrowings (462) (1,184) (1,854)
(14,087) (12,819) (19,449)
NET CURRENT ASSETS /(LIABILITIES) 12,884 2,415 (9,810)
NON-CURRENT LIABILITIES Borrowings – (762) – Convertible loan – debt portion (659) (1,150) (529) Derivative financial instruments (254) (925) (24) Deferred tax liabilities (6,599) (6,599) (6,599) Provisions (6,704) (2,945) (7,406)
(14,216) (12,381) (14,558)
NET ASSETS 142,329 92,537 111,686
EQUITY: Share capital 11 16,897 8,351 11,648 Share premium 182,240 137,987 155,636 ESOP Trust reserve (584) (271) (293) Translation reserve (11,370) (10,556) (10,704) Other reserves 4,408 3,820 3,828 Retained earnings – deficit (49,262) (46,794) (48,429)
TOTAL EQUITY 142,329 92,537 111,686

5
UNAUDITED CONSOLIDATED STATEMENT OF CHANGES IN EQUITY FOR THE HALF YEAR ENDED 30 NOVEMBER 2010
Share capital
Share premium
ESOP Trust
reserve
Retained earnings /
(deficit) Translation
reserve Other
reserve Total
$000 $000 $000 $000 $000 $000 $000
At 31 May 2009 4,289 114,620 (124) (42,322) (10,774) 2,882 68,571 Shares issued 4,062 25,416 (147) – – – 29,331 Total comprehensive loss for the period – – – (4,472) 218 – (4,254) Share issue costs – (1,111) – – – – (1,111) Recognition of share based Payments – (938) – – – 938 –
At 30 November 2009 8,351 137,987 (271) (46,794) (10,556) 3,820 92,537 Shares issued 3,297 19,514 (22) – – (655) 22,134 Total comprehensive loss for the period – – – (1,635) (148) – (1,783) Share issue costs – (1,202) – – – – (1,202) Recognition of share based Payments – (663) – – – 663 –
At 31 May 2010 11,648 155,636 (293) (48,429) (10,704) 3,828 111,686 Shares issued 5,249 28,028 (370) – – – 32,907 Total comprehensive loss for the period – – – (833) (666) – (1,499) Share issue costs – (844) – – – – (844) Recognition of share based Payments – (580) – – – 580 – Credit for value of shares vested by ESOP – – 79 – – – 79
At 30 November 2010 16,897 182,240 (584) (49,262) (11,370) 4,408 142,329
6
b
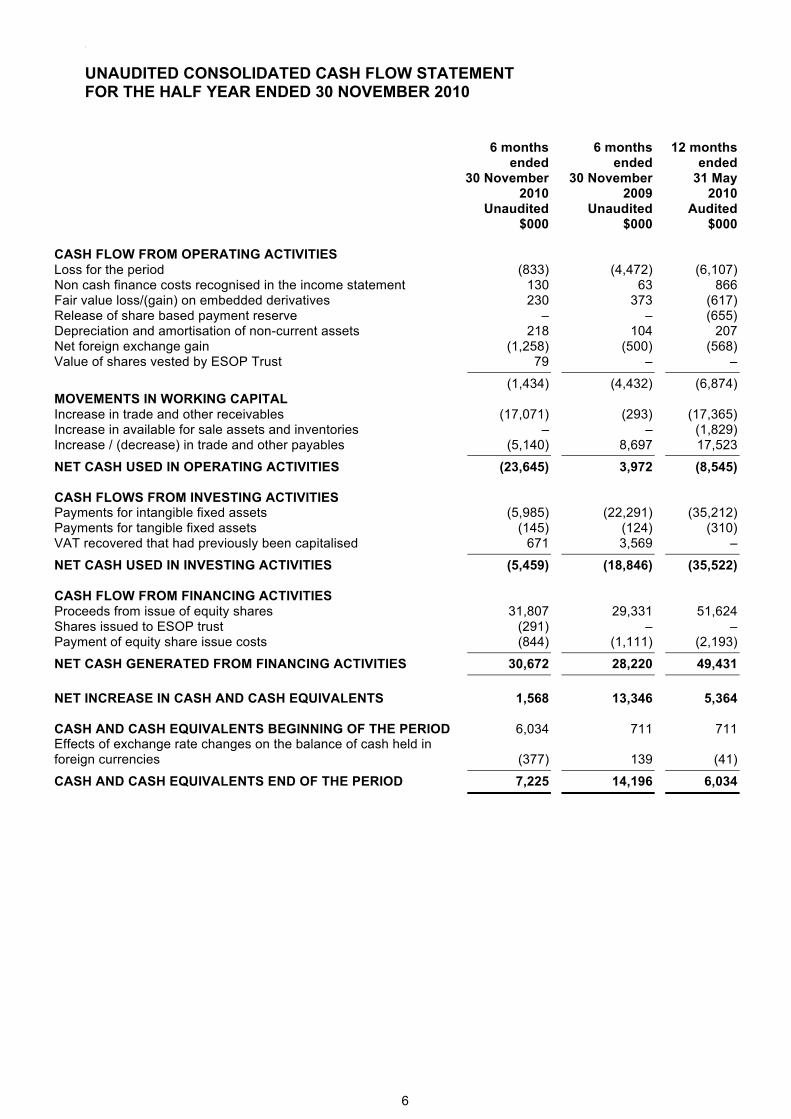
UNAUDITED CONSOLIDATED CASH FLOW STATEMENT FOR THE HALF YEAR ENDED 30 NOVEMBER 2010
6 months ended
30 November 2010
6 months ended
30 November 2009
12 months ended
31 May 2010
Unaudited Unaudited Audited $000 $000 $000
CASH FLOW FROM OPERATING ACTIVITIES Loss for the period (833) (4,472) (6,107) Non cash finance costs recognised in the income statement 130 63 866 Fair value loss/(gain) on embedded derivatives 230 373 (617) Release of share based payment reserve – – (655) Depreciation and amortisation of non-current assets 218 104 207 Net foreign exchange gain (1,258) (500) (568) Value of shares vested by ESOP Trust 79 – –
(1,434) (4,432) (6,874) MOVEMENTS IN WORKING CAPITAL Increase in trade and other receivables (17,071) (293) (17,365) Increase in available for sale assets and inventories – – (1,829) Increase / (decrease) in trade and other payables (5,140) 8,697 17,523
NET CASH USED IN OPERATING ACTIVITIES (23,645) 3,972 (8,545) CASH FLOWS FROM INVESTING ACTIVITIES Payments for intangible fixed assets (5,985) (22,291) (35,212) Payments for tangible fixed assets (145) (124) (310) VAT recovered that had previously been capitalised 671 3,569 –
NET CASH USED IN INVESTING ACTIVITIES (5,459) (18,846) (35,522) CASH FLOW FROM FINANCING ACTIVITIES Proceeds from issue of equity shares 31,807 29,331 51,624 Shares issued to ESOP trust (291) – – Payment of equity share issue costs (844) (1,111) (2,193)
NET CASH GENERATED FROM FINANCING ACTIVITIES 30,672 28,220 49,431
NET INCREASE IN CASH AND CASH EQUIVALENTS 1,568 13,346 5,364 CASH AND CASH EQUIVALENTS BEGINNING OF THE PERIOD 6,034 711 711 Effects of exchange rate changes on the balance of cash held in foreign currencies (377) 139 (41)
CASH AND CASH EQUIVALENTS END OF THE PERIOD 7,225 14,196 6,034
7
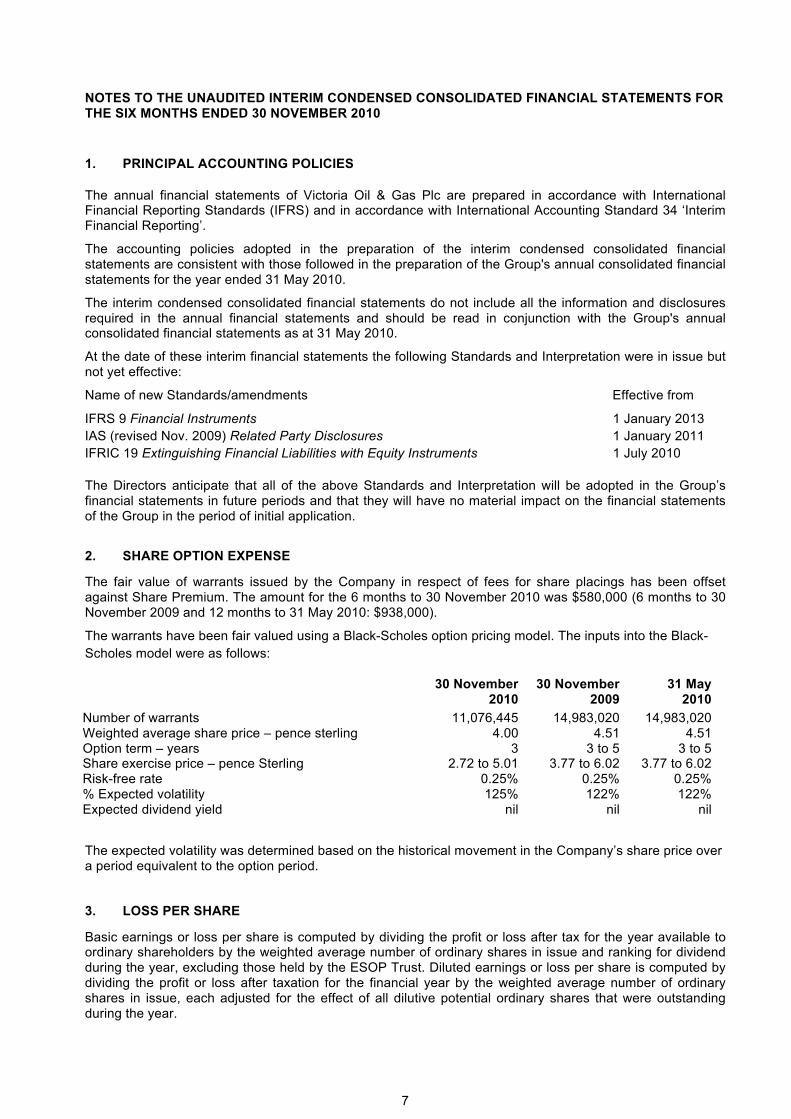
NOTES TO THE UNAUDITED INTERIM CONDENSED CONSOLIDATED FINANCIAL STATEMENTS FOR THE SIX MONTHS ENDED 30 NOVEMBER 2010
1. PRINCIPAL ACCOUNTING POLICIES
The annual financial statements of Victoria Oil & Gas Plc are prepared in accordance with International Financial Reporting Standards (IFRS) and in accordance with International Accounting Standard 34 ‘Interim Financial Reporting’.
The accounting policies adopted in the preparation of the interim condensed consolidated financial statements are consistent with those followed in the preparation of the Group's annual consolidated financial statements for the year ended 31 May 2010.
The interim condensed consolidated financial statements do not include all the information and disclosures required in the annual financial statements and should be read in conjunction with the Group's annual consolidated financial statements as at 31 May 2010.
At the date of these interim financial statements the following Standards and Interpretation were in issue but not yet effective:
Name of new Standards/amendments Effective from
IFRS 9 Financial Instruments 1 January 2013
IAS (revised Nov. 2009) Related Party Disclosures 1 January 2011
IFRIC 19 Extinguishing Financial Liabilities with Equity Instruments 1 July 2010
The Directors anticipate that all of the above Standards and Interpretation will be adopted in the Group’s financial statements in future periods and that they will have no material impact on the financial statements of the Group in the period of initial application.
2. SHARE OPTION EXPENSE
The fair value of warrants issued by the Company in respect of fees for share placings has been offset against Share Premium. The amount for the 6 months to 30 November 2010 was $580,000 (6 months to 30 November 2009 and 12 months to 31 May 2010: $938,000).
The warrants have been fair valued using a Black-Scholes option pricing model. The inputs into the Black-
Scholes model were as follows:
30 November 2010
30 November 2009
31 May 2010
Number of warrants 11,076,445 14,983,020 14,983,020 Weighted average share price – pence sterling 4.00 4.51 4.51 Option term – years 3 3 to 5 3 to 5 Share exercise price – pence Sterling 2.72 to 5.01 3.77 to 6.02 3.77 to 6.02 Risk-free rate 0.25% 0.25% 0.25% % Expected volatility 125% 122% 122% Expected dividend yield nil nil nil
The expected volatility was determined based on the historical movement in the Company’s share price over a period equivalent to the option period.
3. LOSS PER SHARE
Basic earnings or loss per share is computed by dividing the profit or loss after tax for the year available to ordinary shareholders by the weighted average number of ordinary shares in issue and ranking for dividend during the year, excluding those held by the ESOP Trust. Diluted earnings or loss per share is computed by dividing the profit or loss after taxation for the financial year by the weighted average number of ordinary shares in issue, each adjusted for the effect of all dilutive potential ordinary shares that were outstanding during the year.
8
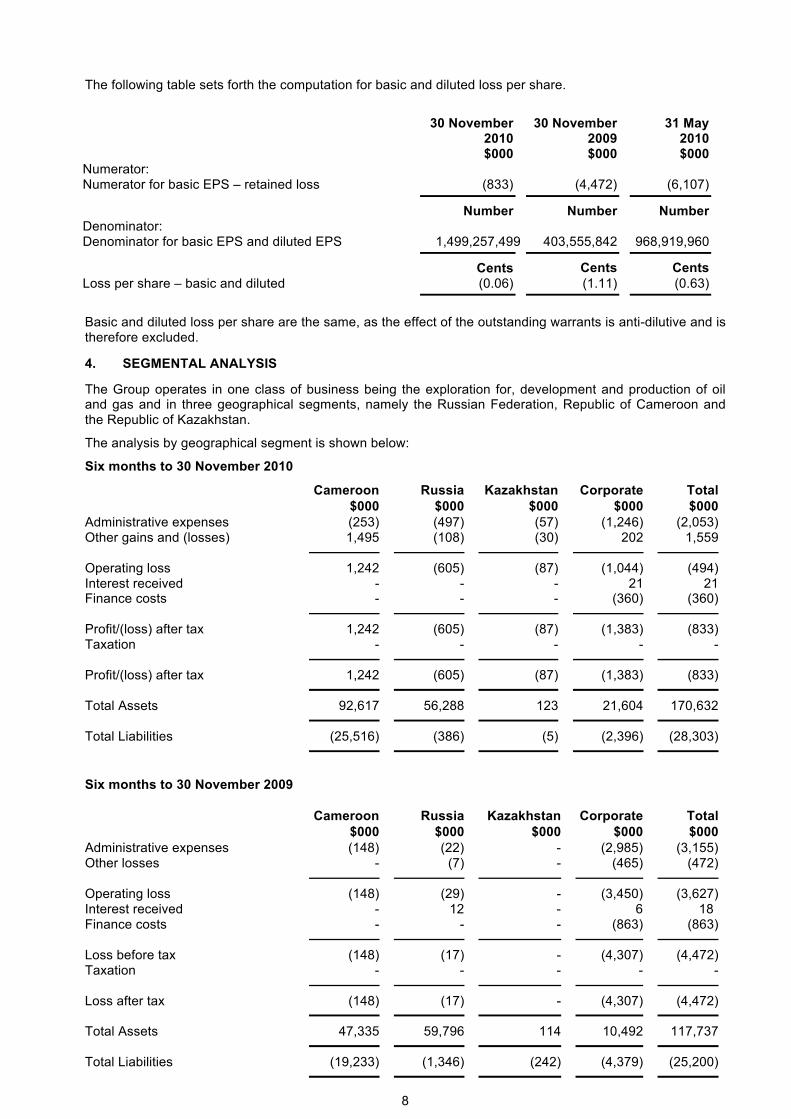
The following table sets forth the computation for basic and diluted loss per share.
30 November 30 November 31 May 2010 2009 2010 $000 $000 $000 Numerator: Numerator for basic EPS – retained loss (833) (4,472) (6,107)
Number Number Number Denominator: Denominator for basic EPS and diluted EPS 1,499,257,499 403,555,842 968,919,960
Cents Cents Cents Loss per share – basic and diluted (0.06) (1.11) (0.63)
Basic and diluted loss per share are the same, as the effect of the outstanding warrants is anti-dilutive and is therefore excluded.
4. SEGMENTAL ANALYSIS
The Group operates in one class of business being the exploration for, development and production of oil and gas and in three geographical segments, namely the Russian Federation, Republic of Cameroon and the Republic of Kazakhstan.
The analysis by geographical segment is shown below:
Six months to 30 November 2010
Cameroon Russia Kazakhstan Corporate Total $000 $000 $000 $000 $000
Administrative expenses (253) (497) (57) (1,246) (2,053) Other gains and (losses) 1,495 (108) (30) 202 1,559
Operating loss 1,242 (605) (87) (1,044) (494) Interest received - - - 21 21 Finance costs - - - (360) (360)
Profit/(loss) after tax 1,242 (605) (87) (1,383) (833) Taxation - - - - -
Profit/(loss) after tax 1,242 (605) (87) (1,383) (833)
Total Assets 92,617 56,288 123 21,604 170,632
Total Liabilities (25,516) (386) (5) (2,396) (28,303)
Six months to 30 November 2009
Cameroon Russia Kazakhstan Corporate Total $000 $000 $000 $000 $000
Administrative expenses (148) (22) - (2,985) (3,155) Other losses - (7) - (465) (472)
Operating loss (148) (29) - (3,450) (3,627) Interest received - 12 - 6 18 Finance costs - - - (863) (863)
Loss before tax (148) (17) - (4,307) (4,472) Taxation - - - - -
Loss after tax (148) (17) - (4,307) (4,472)
Total Assets 47,335 59,796 114 10,492 117,737
Total Liabilities (19,233) (1,346) (242) (4,379) (25,200)

9
Segmental Analysis (continued):
Twelve months to 31 May 2010
Cameroon Russia Kazakhstan Corporate Total $000 $000 $000 $000 $000 Administrative expenses (236) (450) – (5,110) (5,796) Other gains and (losses) 203 262 – (598) (133)
Operating loss (33) (188) – (5,708) (5,929) Interest received – 52 – 19 71 Finance revenue – – – 617 617 Finance costs – – – (866) (866)
Loss before tax (33) (136) – (5,938) (6,107) Taxation – – – – –
Loss after tax (33) (136) – (5,938) (6,107)
Total Assets 81,547 57,805 124 6,217 145,693
Total Liabilities (15,440) (1,507) – (17,060) (34,007)
EXPLORATION AND EVALUATION ASSETS
The movement on exploration and evaluation assets, which relate to oil and gas interests, during the period was:
Six months to 30 November 2010
Opening balance
$000
Exchange
$000 Additions
$000 Disposals
$000 Depreciation
$000
Closing Balance
$000
Cameroon 58,305 1,820 6,588 – – 66,713
Russia 57,612 (884) 361 (1,089) (170) 55,830
November 30 2010 115,917 936 6,949 (1,089) (170) 122,543
Six months to 30 November 2009
Opening balance
$000
Exchange
$000 Additions
$000 Disposals
$000 Depreciation
$000
Closing Balance
$000
Cameroon 24,475 – 21,554 – – 46,029
Russia 58,675 573 737 (3,569) (85) 56,331
November 30 2009 83,150 573 22,291 (3,569) (85) 102,360
Twelve months to 31 May 2010
Opening balance
$000
Exchange
$000 Additions
$000 Disposals
$000 Depreciation
$000
Closing Balance
$000
Cameroon 24,475 – 33,830 – – 58,305
Russia 58,675 553 2,178 (3,591) (203) 57,612
May 31 2010 83,150 553 36,008 (3,591) (203) 115,917

10
Oil and gas interests at 30 November 2010 represent exploration and related expenditure on the Group’s licences & permits in the geographical areas noted above. The realisation of these intangible assets by the Group is dependent on the discovery and successful development of economic reserves and the ability of the Group to raise sufficient funds to develop these interests. Should the development of economic reserves prove unsuccessful, the carrying value in the statement of financial position will be written-off.
The Directors have considered whether facts or circumstances exist that indicate that exploration and evaluation assets are impaired and considered that no impairment loss is required to be recognised as at 30 November 2010. Exploration and evaluation assets have been assessed for impairment having regard to the likelihood of further expenditures and ongoing appraisal for each geographical area.
5. OTHER GAINS AND (LOSSES)
30 November
2010 30 November
2009 31 May
2010 Unaudited Unaudited Audited $000 $000 $000
Foreign exchange gains and (losses) 1,559 (472) (133)
6. FINANCE REVENUE
30 November
2010 30 November
2009 31 May
2010 Unaudited Unaudited Audited $000 $000 $000
Fair value gain on embedded derivatives – – 617
7. FINANCE COSTS
30 November
2010 30 November
2009 31 May
2010 Unaudited Unaudited Audited $000 $000 $000
Convertible loan interest (130) (427) (759) Fair value loss on embedded derivatives (230) (373) – Unwinding of discount on decommissioning costs – (63) (107)
(360) (863) (866)
Interest payable relating to the convertible loans includes both the stated and effective interest charge.
8. INCOME TAX EXPENSE
30 November
2010 30 November
2009 31 May
2010 Unaudited Unaudited Audited $000 $000 $000
Income tax expense – – –
At the balance sheet date, the Group has unused tax losses of $38.0m (30 November 2009: $35.0m; 31 May 2010:$37.7m) available for offset against future profit. No deferred tax asset has been recognised in either year due to the unpredictability of future profit streams. Accordingly, at the year end, deferred tax assets amounting to $10.7m (30 November 2009: $9.3m; 31 May 2010: $10.6m) have not been recognised.

11
9. RECEIVABLES
30 November
2010 30 November
2009 31 May
2010 Unaudited Unaudited Audited $000 $000 $000
Other receivables at 30 November 2010 includes $14,706,000 due from subscribers for new ordinary shares in the Company issued in a placing on 15 November 2010 and $3,000,000 relating to RSM Production Corporation’s 40% carried interest in the Logbaba gas development. The amount recoverable from RSM Production Corporation will be recovered from their share of initial net cash flows and is therefore dependent of the successful construction and commissioning of facilities and sales to customers.
30 November
2010 30 November
2009 31 May
2010 Unaudited Unaudited Audited $000 $000 $000
Other receivables due in more than one year relates to RSM Production Corporation’s 40% carried interest in the Logbaba gas development as described above.
10. TRADE AND OTHER PAYABLES
30 November
2010 30 November
2009 31 May
2010 Unaudited Unaudited Audited $000 $000 $000
11. SHARE CAPITAL
Share capital as at 30 November 2010 amounted to $16.9 million. During the six months to 30 November 2010, the Group issued 676,263,527 shares for cash or in settlement of amounts due to creditors, increasing the number of shares in issue from 1,427,794,447 to 2,104,057,974.
Amounts due within one year: VAT recoverable 113 137 278Prepayments 91 31 254Other receivables 17,713 870 1,244
17,917 1,038 1,776
Amounts due in more than one year:
Other receivables 20,767 _ 19,916
Amounts due within one year: Trade creditors 12,403 10,199 15,907Taxes and social security costs 1,083 10 754Accruals and deferred income 139 242 211Other creditors – 1,184 723
13,625 11,635 17,595
12
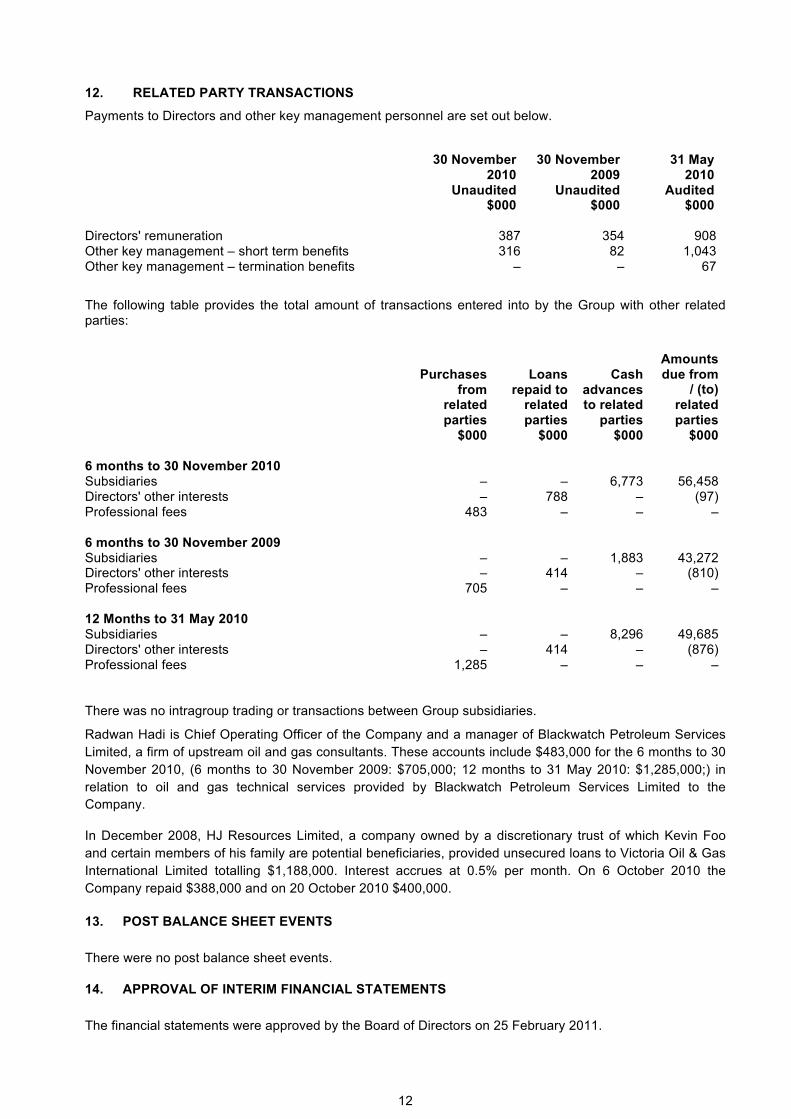
12. RELATED PARTY TRANSACTIONS
Payments to Directors and other key management personnel are set out below.
30 November
2010 30 November
2009 31 May
2010 Unaudited Unaudited Audited $000 $000 $000
Directors' remuneration 387 354 908 Other key management – short term benefits 316 82 1,043 Other key management – termination benefits – – 67
The following table provides the total amount of transactions entered into by the Group with other related parties:
Purchases from
related parties
Loans repaid to
related parties
Cash advances to related
parties
Amounts due from
/ (to) related parties
$000 $000 $000 $000
6 months to 30 November 2010 Subsidiaries – – 6,773 56,458 Directors' other interests – 788 – (97) Professional fees 483 – – – 6 months to 30 November 2009 Subsidiaries – – 1,883 43,272 Directors' other interests – 414 – (810) Professional fees 705 – – – 12 Months to 31 May 2010 Subsidiaries – – 8,296 49,685 Directors' other interests – 414 – (876) Professional fees 1,285 – – – There was no intragroup trading or transactions between Group subsidiaries.
Radwan Hadi is Chief Operating Officer of the Company and a manager of Blackwatch Petroleum Services
Limited, a firm of upstream oil and gas consultants. These accounts include $483,000 for the 6 months to 30
November 2010, (6 months to 30 November 2009: $705,000; 12 months to 31 May 2010: $1,285,000;) in
relation to oil and gas technical services provided by Blackwatch Petroleum Services Limited to the
Company.
In December 2008, HJ Resources Limited, a company owned by a discretionary trust of which Kevin Foo
and certain members of his family are potential beneficiaries, provided unsecured loans to Victoria Oil & Gas
International Limited totalling $1,188,000. Interest accrues at 0.5% per month. On 6 October 2010 the
Company repaid $388,000 and on 20 October 2010 $400,000.
13. POST BALANCE SHEET EVENTS
There were no post balance sheet events.
14. APPROVAL OF INTERIM FINANCIAL STATEMENTS
The financial statements were approved by the Board of Directors on 25 February 2011.