Interim Report Third Quarter and First Nine Months of 2008 · 4 Group Management Report Allianz...
102
Allianz Group Interim Report Third Quarter and First Nine Months of 2008 INSURANCE | ASSET MANAGEMENT | BANKING
Transcript of Interim Report Third Quarter and First Nine Months of 2008 · 4 Group Management Report Allianz...

Allianz Group
Interim Report Third Quarter and First Nine Months of 2008
I N S U R A N C E | A S S E T M A N A G E M E N T | B A N K I N G
Condensed Consolidated Interim Financial Statementsfor the Third Quarter and the First Nine Months of 2008
4546
Detailed Indexcondensed consolidated Interim Financial Statements
51 notes to the condensed consolidated Interim Financial Statements
Basic Allianz share information
Share type registered share with restricted transfer
Denomination no-par-value shareStock exchanges All German stock exchanges, London,
Paris, Zurich, Milan, new YorkSecurity codes WKn 840 400
ISIn DE 000 840 400 5Bloomberg ALV GYreuters ALVG.DE
Investor RelationsWe endeavor to keep our shareholders up-to-date on all company developments. Our Investor Relations Team is pleased to answer any questions you may have.
Allianz SEInvestor RelationsKoeniginstrasse 2880802 Muenchen Germany
Fax: + 49 89 3800 3899E-Mail: [email protected]: www.allianz.com/investor-relations
For telephone enquiries, our “Allianz Investor Line” is available: + 49 1802 2554269 + 49 1802 ALLIANZ
ContentGroup Management Report
02 Executive Summary and Outlook12 Property-casualty Insurance Operations 18 Life/Health Insurance Operations24 Banking Operations27 Asset Management Operations31333642
corporate ActivitiesDiscontinued Operations of Dresdner Bank Balance Sheet reviewOther Information
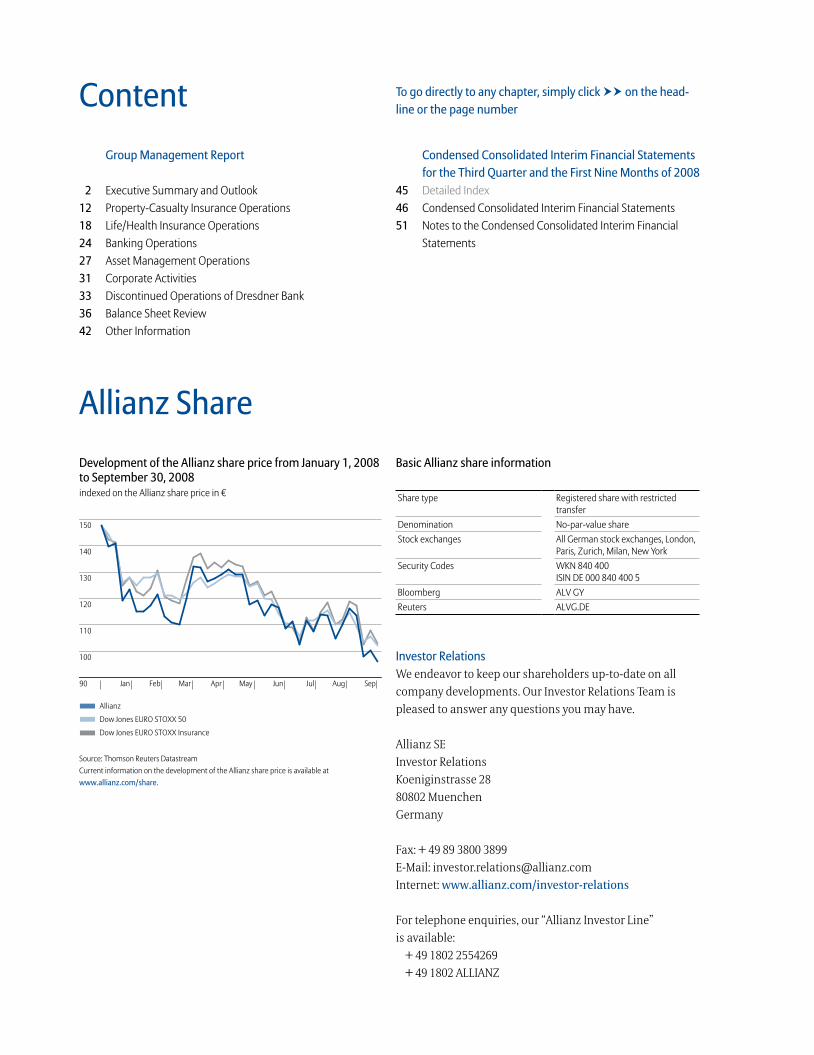
Allianz ShareDevelopment of the Allianz share price from January 1, 2008 to September 30, 2008indexed on the Allianz share price in €
150
140
130
120
110
100
90
Allianz
Dow Jones EURO STOXX 50
Dow Jones EURO STOXX Insurance
Jan Feb Mar Apr May Jun Jul Aug Sep
Source: Thomson reuters Datastream current information on the development of the Allianz share price is available at www.allianz.com/share.
To go directly to any chapter, simply click on the head - line or the page number

1
Three months ended September 30, Nine months ended September 30,
2008 2007
Change from pre-vious year 2008 2007
Change from previ-
ous year
INCOME STATEMENTTotal revenues 1) € mn 21,080 21,915 (3.8) % 69,525 72,074 (3.5) %Operating profit 2) € mn 1,556 2,563 (39.3) % 6,477 7,715 (16.0) %Net income from continuing operations 3) € mn 545 2,049 (73.4) % 4,150 6,064 (31.6) %Net income (loss) from discontinued operations, net of income taxes and minority interests in earnings 3) € mn (2,568) (128) n.m. (3,483) 1,237 n.m.Net income (loss) 3) € mn (2,023) 1,921 n.m. 667 7,301 (90.9) %
SEGMENTS (Continuing Operations)Property-CasualtyGross premiums written € mn 10,816 10,674 1.3 % 34,368 34,767 (1.1) %Operating profit 2) € mn 1,249 1,487 (16.0) % 4,411 4,648 (5.1) %Net income € mn 791 1,708 (53.7) % 3,670 4,268 (14.0) %Combined ratio % 96.2 94.1 2.1 pts 94.9 94.6 0.3 pts
Life/HealthStatutory premiums € mn 9,415 10,268 (8.3) % 32,471 34,352 (5.5) %Operating profit 2) € mn 218 873 (75.0) % 1,510 2,381 (36.6) %Net income (loss) € mn (5) 563 n.m. 872 1,595 (45.3) %Statutory expense ratio % 10.1 11.0 (0.9) pts 10.4 9.2 1.2 pts
Banking 3)
Operating revenues € mn 123 127 (3.1) % 416 455 (8.6) %Operating profit (loss) 2) € mn (17) (14) 21.4 % (6) 28 n.m.Net income (loss) from continuing operations € mn (62) 24 n.m. (72) 65 n.m.Cost-income ratio % 108.1 119.7 (11.6) pts 97.1 94.3 2.8 pts
Asset ManagementOperating revenues € mn 698 803 (13.1) % 2,163 2,380 (9.1) %Operating profit 2) € mn 186 330 (43.6) % 708 967 (26.8) %Net income € mn 52 142 (63.4) % 250 375 (33.3) %Cost-income ratio % 73.4 58.9 14.5 pts 67.3 59.4 7.9 pts
DRESDNER BANK (Discontinued Operations) 3)
Operating revenues € mn 673 1,139 (40.9) % 1,851 4,763 (61.1) %Operating profit (loss) 2) € mn (834) 89 n.m. (1,869) 1,198 n.m.Net income (loss) € mn (2,765) (78) n.m. (3,845) 917 n.m.Cost-income ratio % 185.6 89.4 96.2 pts 183.3 73.1 110.2 pts
BALANCE SHEETTotal assets as of September 30, 4) € mn 1,016,837 1,061,149 (4.2) % 1,016,837 1,061,149 (4.2) %Shareholders’ equity as of September 30, 4) € mn 37,548 47,753 (21.4) % 37,548 47,753 (21.4) %Minority interests as of September 30, 4) € mn 3,644 3,628 0.4 % 3,644 3,628 0.4 %
SHARE INFORMATIONBasic earnings per share € (4.49) 4.30 n.m. 1.48 16.72 (91.1) %Diluted earnings per share € (4.48) 4.23 n.m. 1.41 16.41 (91.4) %Share price as of September 30, 4) € 96.28 147.95 (34.9) % 96.28 147.95 (34.9) %Market capitalization as of September 30, 4) € bn 43.6 66.6 (34.6) % 43.6 66.6 (34.6) %
OTHER DATAThird-party assets under management as of September 30, 4) € bn 754 765 (1.4) % 754 765 (1.4) %
1) Total revenues comprise Property-Casualty segment’s gross premiums written, Life/Health segment’s statutory premiums, Banking segment’s operating revenues and Asset Management segment’s operating revenues.
2) The Allianz Group uses operating profit to evaluate the performance of its business segments and the Group as a whole.3) Following the announcement of the sale, Dresdner Bank qualifies as held-for-sale and discontinued operations. Therefore, all revenue and profit figures presented for our continuing business do
not include the parts of Dresdner Bank which we will sell to Commerzbank. The results from these operations are presented in a separate net income line “net income from discontinued operations, net of income taxes and minority interests in earnings” starting in the third quarter of 2008 (3Q 2008).
4) 2007 figures as of December 31, 2007.
Allianz Group Key Data
2
Highlights of the Third Quarter 2008
On August 31, 2008, Allianz SE (“Allianz”) and Commerz-
bank AG (“Commerzbank”) agreed on the sale of signifi-
cantly all of Dresdner Bank AG (“Dresdner Bank”) to Com-
merzbank. Following the announcement of the sale,
Dresdner Bank qualifies as held-for-sale and discontinued
operations. Therefore, all revenue and profit figures pre-
sented for our continuing business do not include the parts
of Dresdner Bank which we will sell to Commerzbank. The
results from these operations are presented in a separate
net income line “net income from discontinued operations,
net of income taxes and minority interests in earnings”
starting in the third quarter of 2008 (3Q 2008).
In September 2008, subsequent to the agreed sale, Dresdner
Bank reclassified certain assets into the categories “avail-
able for sale” and “loans and receivables” according to
amended IAS 39.2) Without this reclassification, the operat-
ing results of Dresdner Bank would have been � 422 million
lower. However, due to the treatment of Dresdner Bank as a
discontinued operation, the results of Dresdner Bank no
longer affect Allianz Group’s result.
1) The Allianz Group operates and manages its activities primarily through four operating segments: Property-Casualty, Life/Health, Banking and Asset Man-agement. Effective January 1, 2006, in addition to our four operating seg-ments and with retrospective application, we introduced a fifth business segment named Corporate.
2) For further information see Note 2 to the condensed interim financial state-ments.
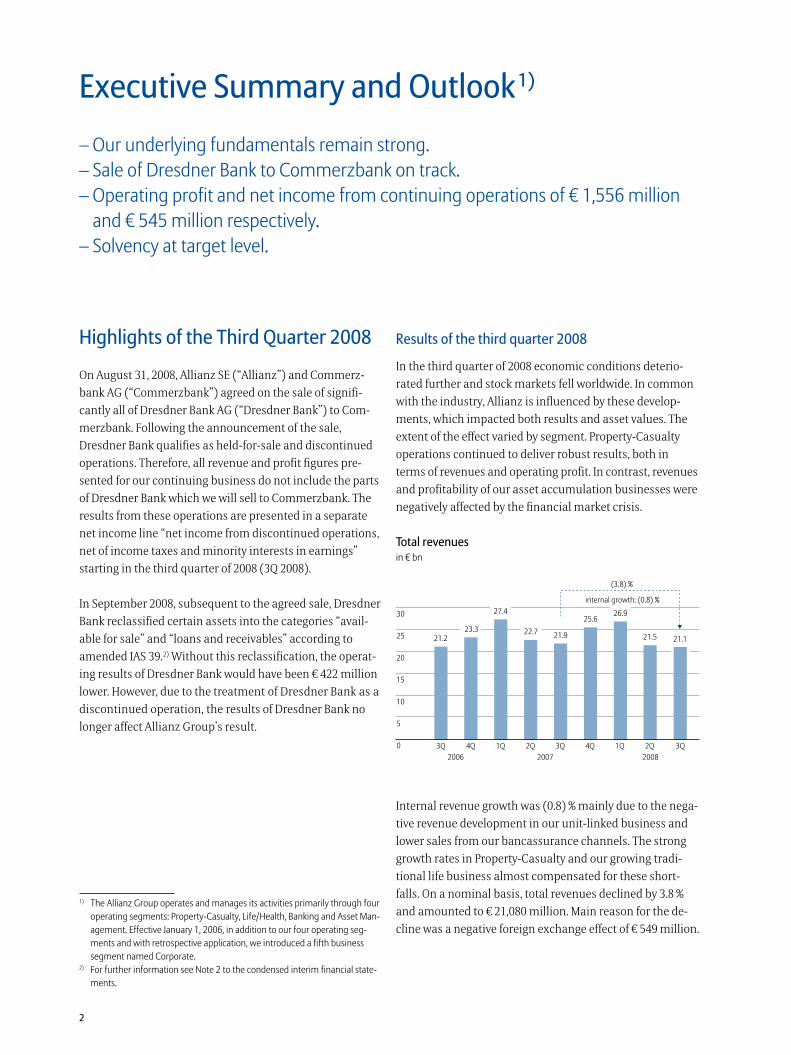
Results of the third quarter 2008
In the third quarter of 2008 economic conditions deterio-
rated further and stock markets fell worldwide. In common
with the industry, Allianz is influenced by these develop-
ments, which impacted both results and asset values. The
extent of the effect varied by segment. Property-Casualty
operations continued to deliver robust results, both in
terms of revenues and operating profit. In contrast, revenues
and profitability of our asset accumulation businesses were
negatively affected by the financial market crisis.
Total revenuesin € bn
Internal revenue growth was (0.8) % mainly due to the nega-
tive revenue development in our unit-linked business and
lower sales from our bancassurance channels. The strong
growth rates in Property-Casualty and our growing tradi-
tional life business almost compensated for these short-
falls. On a nominal basis, total revenues declined by 3.8 %
and amounted to � 21,080 million. Main reason for the de-
cline was a negative foreign exchange effect of � 549 million.
Executive Summary and Outlook 1)
– Our underlying fundamentals remain strong. – Sale of Dresdner Bank to Commerzbank on track. – Operating profit and net income from continuing operations of � 1,556 million
and � 545 million respectively.– Solvency at target level.
Allianz Group Interim Report Third Quarter and First Nine Months of 2008 Group Management Report
3
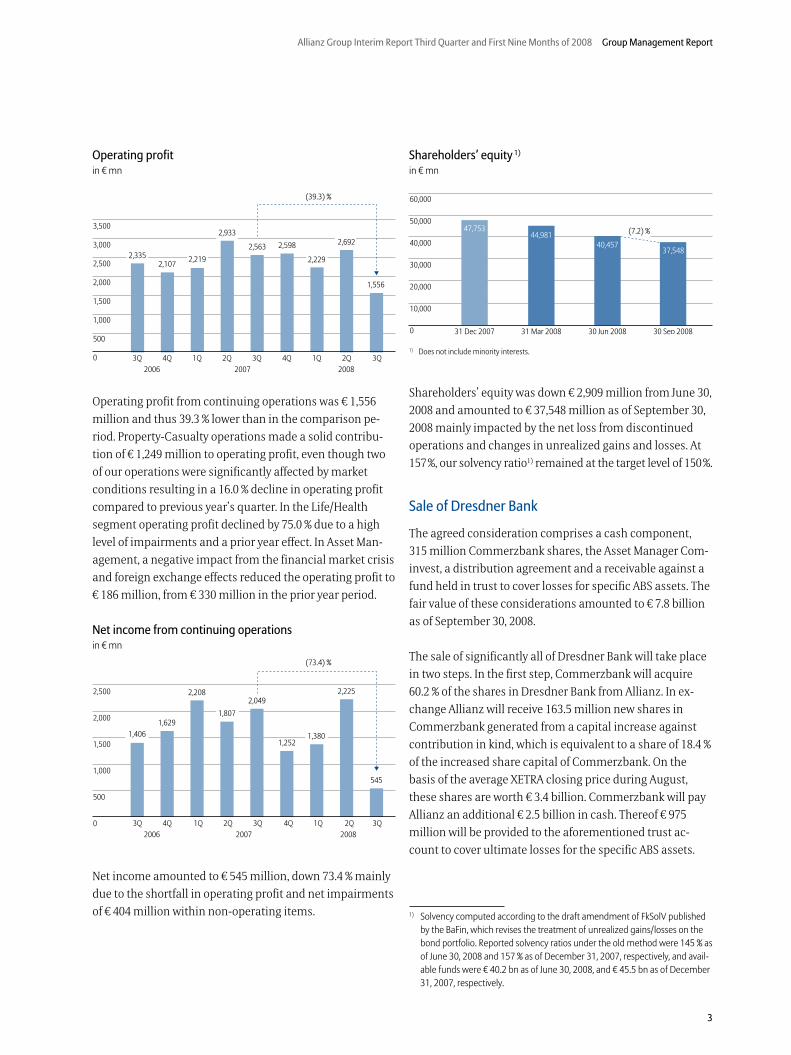
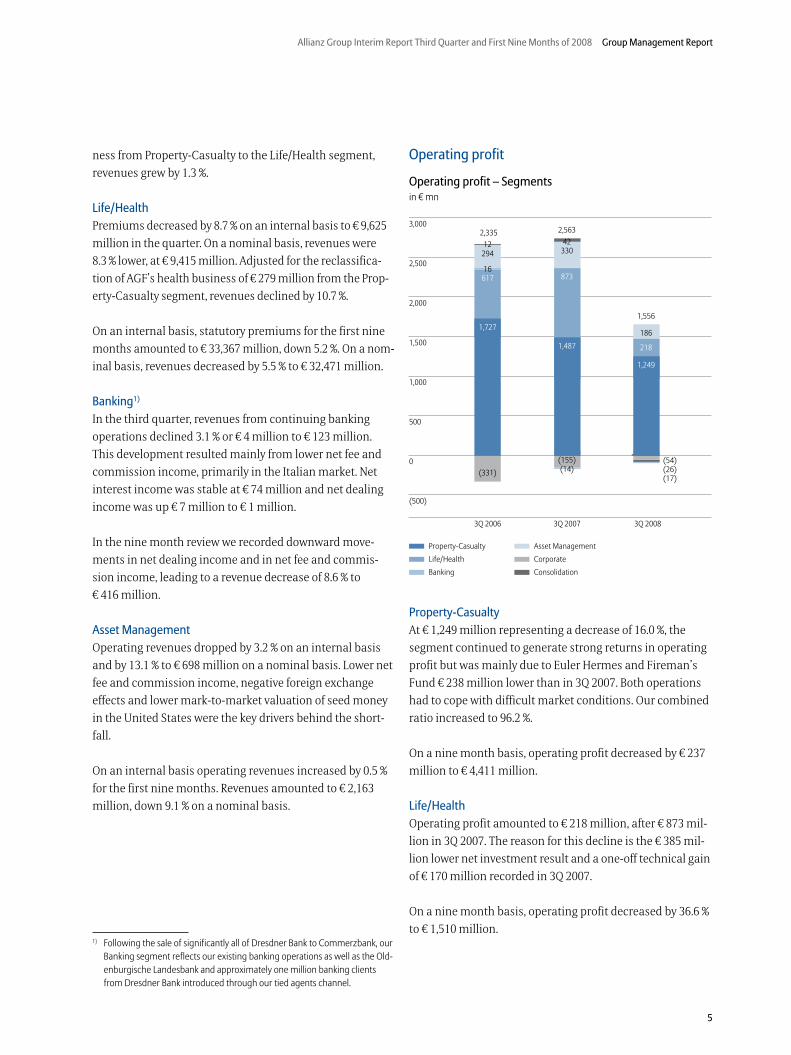
Operating profitin € mn
Operating profit from continuing operations was � 1,556
million and thus 39.3 % lower than in the comparison pe-
riod. Property-Casualty operations made a solid contribu-
tion of � 1,249 million to operating profit, even though two
of our operations were significantly affected by market
conditions resulting in a 16.0 % decline in operating profit
compared to previous year’s quarter. In the Life/Health
segment operating profit declined by 75.0 % due to a high
level of impairments and a prior year effect. In Asset Man-
agement, a negative impact from the financial market crisis
and foreign exchange effects reduced the operating profit to
� 186 million, from � 330 million in the prior year period.
Net income from continuing operationsin € mn
Net income amounted to � 545 million, down 73.4 % mainly
due to the shortfall in operating profit and net impairments
of � 404 million within non-operating items.
Shareholders’ equity 1)
in € mn
1) Does not include minority interests.
Shareholders’ equity was down � 2,909 million from June 30,
2008 and amounted to � 37,548 million as of September 30,
2008 mainly impacted by the net loss from discontinued
operations and changes in unrealized gains and losses. At
157 %, our solvency ratio1) remained at the target level of 150 %.
Sale of Dresdner Bank
The agreed consideration comprises a cash component,
315 million Commerzbank shares, the Asset Manager Com-
invest, a distribution agreement and a receivable against a
fund held in trust to cover losses for specific ABS assets. The
fair value of these considerations amounted to � 7.8 billion
as of September 30, 2008.
The sale of significantly all of Dresdner Bank will take place
in two steps. In the first step, Commerzbank will acquire
60.2 % of the shares in Dresdner Bank from Allianz. In ex-
change Allianz will receive 163.5 million new shares in
Commerzbank generated from a capital increase against
contribution in kind, which is equivalent to a share of 18.4 %
of the increased share capital of Commerzbank. On the
basis of the average XETRA closing price during August,
these shares are worth � 3.4 billion. Commerzbank will pay
Allianz an additional � 2.5 billion in cash. Thereof � 975
million will be provided to the aforementioned trust ac-
count to cover ultimate losses for the specific ABS assets.
1) Solvency computed according to the draft amendment of FkSolV published by the BaFin, which revises the treatment of unrealized gains/losses on the bond portfolio. Reported solvency ratios under the old method were 145 % as of June 30, 2008 and 157 % as of December 31, 2007, respectively, and avail-able funds were � 40.2 bn as of June 30, 2008, and � 45.5 bn as of December 31, 2007, respectively.
4
Group Management Report Allianz Group Interim Report Third Quarter and First Nine Months of 2008
The trust will be dissolved not later than 2018. In the trans-
action, Cominvest which is valued at � 0.7 billion will be
transferred to Allianz.
In the second step, which is subject to the approval by the
General Meetings of both entities, Dresdner Bank will be
merged with Commerzbank and Allianz will receive further
shares in Commerzbank. The final stake in Commerzbank
which Allianz will hold after the second step will depend on
the exact exchange ratio of Commerzbank shares to Dresd-
ner Bank shares. The expected stake that Allianz will hold in
Commerzbank will amount to nearly 30 %. This will make
Allianz SE the largest shareholder and a strong partner of
the new bank.
The transaction is expected to be completed no later than
the end of 2009 and is subject to approval by the regulatory
authorities.
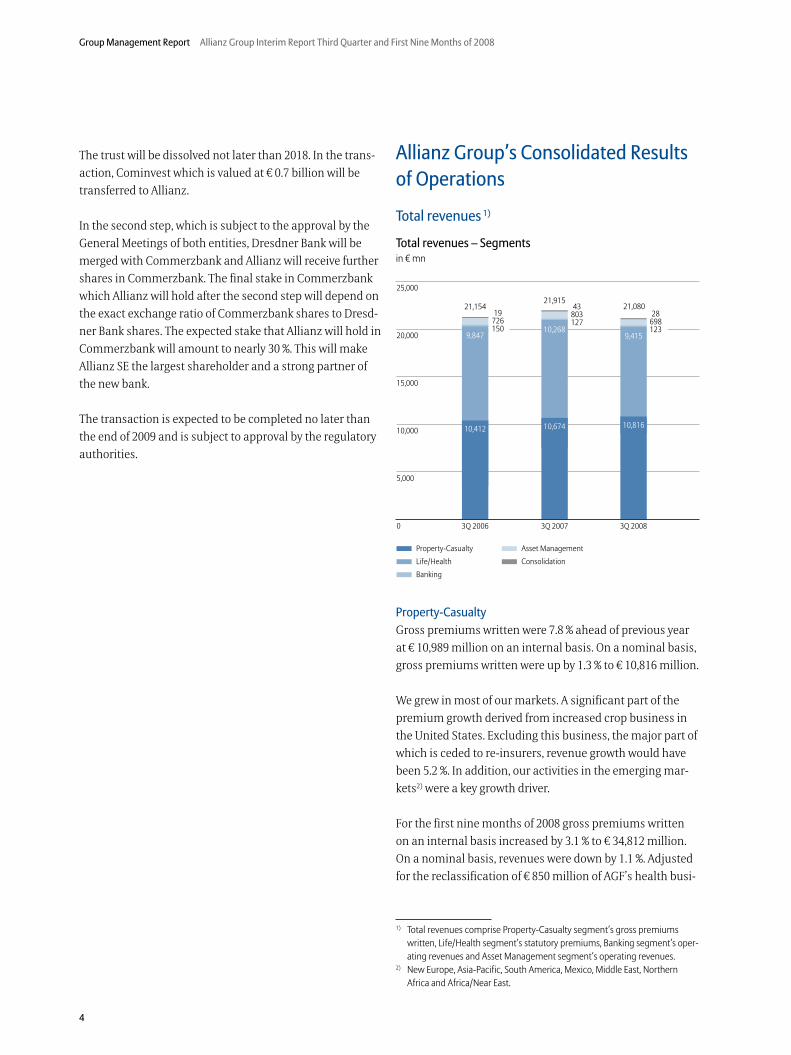
Allianz Group’s Consolidated Results of Operations
Total revenues 1)
Total revenues – Segmentsin € mn
Property-Casualty
Gross premiums written were 7.8 % ahead of previous year
at � 10,989 million on an internal basis. On a nominal basis,
gross premiums written were up by 1.3 % to � 10,816 million.
We grew in most of our markets. A significant part of the
premium growth derived from increased crop business in
the United States. Excluding this business, the major part of
which is ceded to re-insurers, revenue growth would have
been 5.2 %. In addition, our activities in the emerging mar-
kets2) were a key growth driver.
For the first nine months of 2008 gross premiums written
on an internal basis increased by 3.1 % to � 34,812 million.
On a nominal basis, revenues were down by 1.1 %. Adjusted
for the reclassification of � 850 million of AGF’s health busi-
1) Total revenues comprise Property-Casualty segment’s gross premiums written, Life/Health segment’s statutory premiums, Banking segment’s oper-ating revenues and Asset Management segment’s operating revenues.
2) New Europe, Asia-Pacific, South America, Mexico, Middle East, Northern Africa and Africa/Near East.
Allianz Group Interim Report Third Quarter and First Nine Months of 2008 Group Management Report
5
ness from Property-Casualty to the Life/Health segment,
revenues grew by 1.3 %.
Life/Health
Premiums decreased by 8.7 % on an internal basis to � 9,625
million in the quarter. On a nominal basis, revenues were
8.3 % lower, at � 9,415 million. Adjusted for the reclassifica-
tion of AGF’s health business of � 279 million from the Prop-
erty-Casualty segment, revenues declined by 10.7 %.
On an internal basis, statutory premiums for the first nine
months amounted to � 33,367 million, down 5.2 %. On a nom-
inal basis, revenues decreased by 5.5 % to � 32,471 million.
Banking1)
In the third quarter, revenues from continuing banking
operations declined 3.1 % or � 4 million to � 123 million.
This development resulted mainly from lower net fee and
commission income, primarily in the Italian market. Net
interest income was stable at � 74 million and net dealing
income was up � 7 million to � 1 million.
In the nine month review we recorded downward move-
ments in net dealing income and in net fee and commis-
sion income, leading to a revenue decrease of 8.6 % to
� 416 million.
Asset Management
Operating revenues dropped by 3.2 % on an internal basis
and by 13.1 % to � 698 million on a nominal basis. Lower net
fee and commission income, negative foreign exchange
effects and lower mark-to-market valuation of seed money
in the United States were the key drivers behind the short-
fall.
On an internal basis operating revenues increased by 0.5 %
for the first nine months. Revenues amounted to � 2,163
million, down 9.1 % on a nominal basis.
1) Following the sale of significantly all of Dresdner Bank to Commerzbank, our Banking segment reflects our existing banking operations as well as the Old-enburgische Landesbank and approximately one million banking clients from Dresdner Bank introduced through our tied agents channel.
Operating profit
Operating profit – Segmentsin € mn
Property-Casualty
At � 1,249 million representing a decrease of 16.0 %, the
segment continued to generate strong returns in operating
profit but was mainly due to Euler Hermes and Fireman’s
Fund � 238 million lower than in 3Q 2007. Both operations
had to cope with difficult market conditions. Our combined
ratio increased to 96.2 %.
On a nine month basis, operating profit decreased by � 237
million to � 4,411 million.
Life/Health
Operating profit amounted to � 218 million, after � 873 mil-
lion in 3Q 2007. The reason for this decline is the � 385 mil-
lion lower net investment result and a one-off technical gain
of � 170 million recorded in 3Q 2007.
On a nine month basis, operating profit decreased by 36.6 %
to � 1,510 million.
6
Group Management Report Allianz Group Interim Report Third Quarter and First Nine Months of 2008
Banking1)
Operating loss from our continuing Banking operations was
� 17 million after a loss of � 14 million in the comparison
period. This was mainly the result of lower revenues and
higher loan loss provisions.
For the nine months we recorded an operating loss of � 6
million after a profit in 2007 of � 28 million. Higher loan loss
provisions in the third quarter was the major reason.
Asset Management
In the quarter-to-quarter comparison operating profit
dropped by 43.6 % to � 186 million, as a consequence of
lower revenues, increased administrative expenses and a
significant negative foreign exchange effect.
Corporate Segment
The operating loss for the third quarter decreased to � 54
million compared to a loss of � 155 million in 3Q 2007.
In the first nine months the operating loss of � 125 million
represented an improvement of � 141 million compared to
the first nine months of 2007.
Non-operating result
Non-operating items produced a loss of � 729 million com-
ing from a gain of � 37 million a year ago. Due to the current
market environment, the impairments on investments
recorded as non-operating increased to � 921 million main-
ly reflecting high equity impairments. Higher net realized
gains, totalling � 517 million, only partly compensated for
this development. Furthermore, the non-operating result
was reduced by higher restructuring charges mainly relat-
ing to AGF, where we executed a transformation program.
For the first nine months of 2008 we recorded a non-operat-
ing loss of � 817 million compared to a gain of � 1,018 mil-
lion in the prior year, representing significantly higher im-
pairments on investments. Realized gains also decreased by
11.8 % to � 1,981 million, as we benefited from the sales of
equity investments in a very favorable market environment
a year ago.
1) Following the sale of significantly all of Dresdner Bank to Commerzbank, our Banking segment reflects our existing banking operations as well as the Oldenburgische Landesbank and approximately one million banking clients from Dresdner Bank introduced through the tied agents channel.
Net income from continuing operations
Net income from continuing operations decreased by
� 1,504 million to � 545 million. Lower taxable income led to
a decrease in tax expenses. In addition, the prior year period
benefited from the German tax reform by � 119 million.
Without this one-time impact the swing would have been
larger. The effective tax rate increased to 30.0 %. Minority
interests in earnings were reduced to � 34 million.
On a nine month basis, net income from continuing opera-
tions amounted to � 4,150 million. The developments were
largely consistent with those described for the third quarter.
Net income (loss) from discontinued operations
Net loss from discontinued operations amounted to � 2,568
million and represents the expected loss from the sale of
Dresdner Bank. This loss comprises Dresdner Bank’s results
of 2008 amounting to � 1,159 million as well as the impair-
ment charge of � 1,409 million, reflecting the negative differ-
ence between the consideration and the carrying value of
Dresdner Bank in the books of Allianz Group.
Net Income (loss)
Net loss for the third quarter amounted to � 2,023 million
compared to a net income of � 1,921 million a year ago. For
the first nine months net income was � 667 million com-
pared to � 7,301 million in the comparison period.
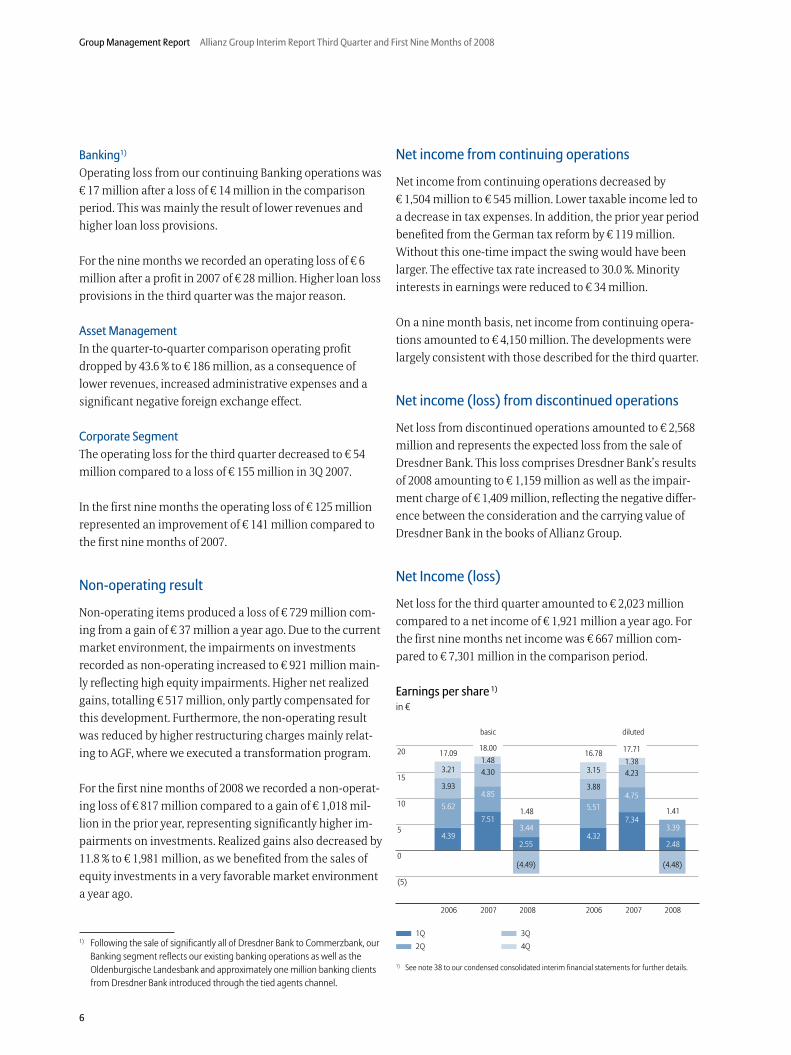
Earnings per share 1)
in €
1) See note 38 to our condensed consolidated interim financial statements for further details.
Allianz Group Interim Report Third Quarter and First Nine Months of 2008 Group Management Report
7
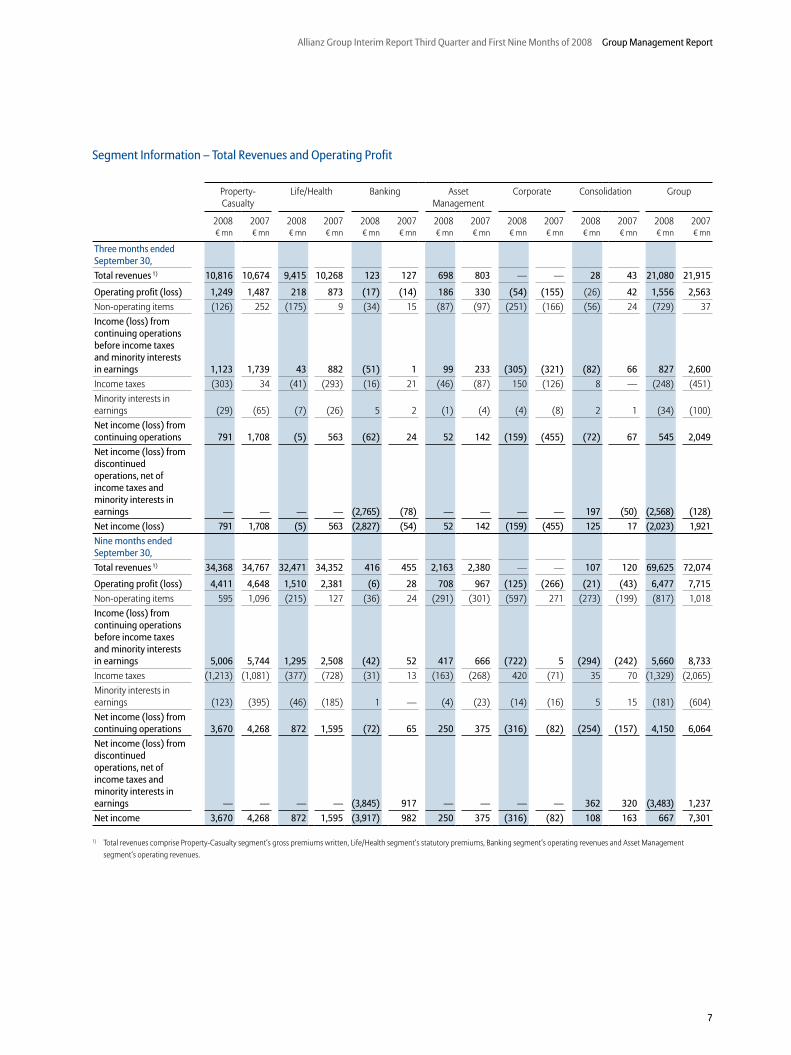
Segment Information – Total Revenues and Operating Profit
Property- Casualty
Life/Health Banking Asset Management
Corporate Consolidation Group
2008 2007 2008 2007 2008 2007 2008 2007 2008 2007 2008 2007 2008 2007� mn � mn � mn � mn � mn � mn � mn � mn � mn � mn � mn � mn � mn � mn
Three months ended September 30,
Total revenues 1) 10,816 10,674 9,415 10,268 123 127 698 803 — — 28 43 21,080 21,915
Operating profit (loss) 1,249 1,487 218 873 (17) (14) 186 330 (54) (155) (26) 42 1,556 2,563
Non-operating items (126) 252 (175) 9 (34) 15 (87) (97) (251) (166) (56) 24 (729) 37Income (loss) from continuing operations before income taxes and minority interests in earnings 1,123 1,739 43 882 (51) 1 99 233 (305) (321) (82) 66 827 2,600
Income taxes (303) 34 (41) (293) (16) 21 (46) (87) 150 (126) 8 — (248) (451)Minority interests in earnings (29) (65) (7) (26) 5 2 (1) (4) (4) (8) 2 1 (34) (100)Net income (loss) from continuing operations 791 1,708 (5) 563 (62) 24 52 142 (159) (455) (72) 67 545 2,049
Net income (loss) from discontinued operations, net of income taxes and minority interests in earnings — — — — (2,765) (78) — — — — 197 (50) (2,568) (128)
Net income (loss) 791 1,708 (5) 563 (2,827) (54) 52 142 (159) (455) 125 17 (2,023) 1,921
Nine months ended September 30,
Total revenues 1) 34,368 34,767 32,471 34,352 416 455 2,163 2,380 — — 107 120 69,625 72,074
Operating profit (loss) 4,411 4,648 1,510 2,381 (6) 28 708 967 (125) (266) (21) (43) 6,477 7,715
Non-operating items 595 1,096 (215) 127 (36) 24 (291) (301) (597) 271 (273) (199) (817) 1,018Income (loss) from continuing operations before income taxes and minority interests in earnings 5,006 5,744 1,295 2,508 (42) 52 417 666 (722) 5 (294) (242) 5,660 8,733
Income taxes (1,213) (1,081) (377) (728) (31) 13 (163) (268) 420 (71) 35 70 (1,329) (2,065)Minority interests in earnings (123) (395) (46) (185) 1 — (4) (23) (14) (16) 5 15 (181) (604)Net income (loss) from continuing operations 3,670 4,268 872 1,595 (72) 65 250 375 (316) (82) (254) (157) 4,150 6,064
Net income (loss) from discontinued operations, net of income taxes and minority interests in earnings — — — — (3,845) 917 — — — — 362 320 (3,483) 1,237
Net income 3,670 4,268 872 1,595 (3,917) 982 250 375 (316) (82) 108 163 667 7,301
1) Total revenues comprise Property-Casualty segment‘s gross premiums written, Life/Health segment‘s statutory premiums, Banking segment‘s operating revenues and Asset Management segment‘s operating revenues.
8
Group Management Report Allianz Group Interim Report Third Quarter and First Nine Months of 2008
Impact of the financial markets turbulence
The financial markets crisis has its root cause in the sub-
prime crisis, when rising defaults on subprime mortgages
in the United States resulted in significant deterioration of
prices for securitized assets. Primarily, this affected collater-
alized debt obligations (“CDO”), and residential mortgage-
backed securities especially those originating in the United
States (“U.S. RMBS”). The revaluation of these assets result-
ed in massive write-downs in the industry. Subsequently,
uncertainty about the extent and distribution of losses
arose and the interbank market started to freeze. This
prompted central banks to take concerted action and pro-
vide the capital market with additional liquidity.
2008 has been characterized by weak equity markets, vola-
tile credit spreads and further declines in U.S. house and
mortgage prices. The downgrading of monoline insurers
(“monoliners”) led to further writedowns on derivatives
contracts banks held with the insurers. Investors faced
further downgrades and market losses on insured bonds. In
September, large financial institutions faltered, leading to
failures, mergers and conservatorships. These recent devel-
opments led to continuously deteriorating market senti-
ment and falling stock markets worldwide and ultimately
prompted governments to take coordinated actions and
announce broad rescue plans for distressed institutions.
The turbulence in the financial markets has clearly impact-
ed our business development. However, the impact varied
in each business segment.
The major operating impact of the crisis comes through
Dresdner Bank which, as already mentioned, we now record
as a discontinued operation. Impacts on our insurance
operations have been limited to the impairments on equity
and fixed-income securities as well as lower sales of unit-
linked life insurance products. Investment activities of the
insurance segments were only impacted to a very limited
extent, reflecting the high quality of the asset bases with no
material CDO or subprime exposure.
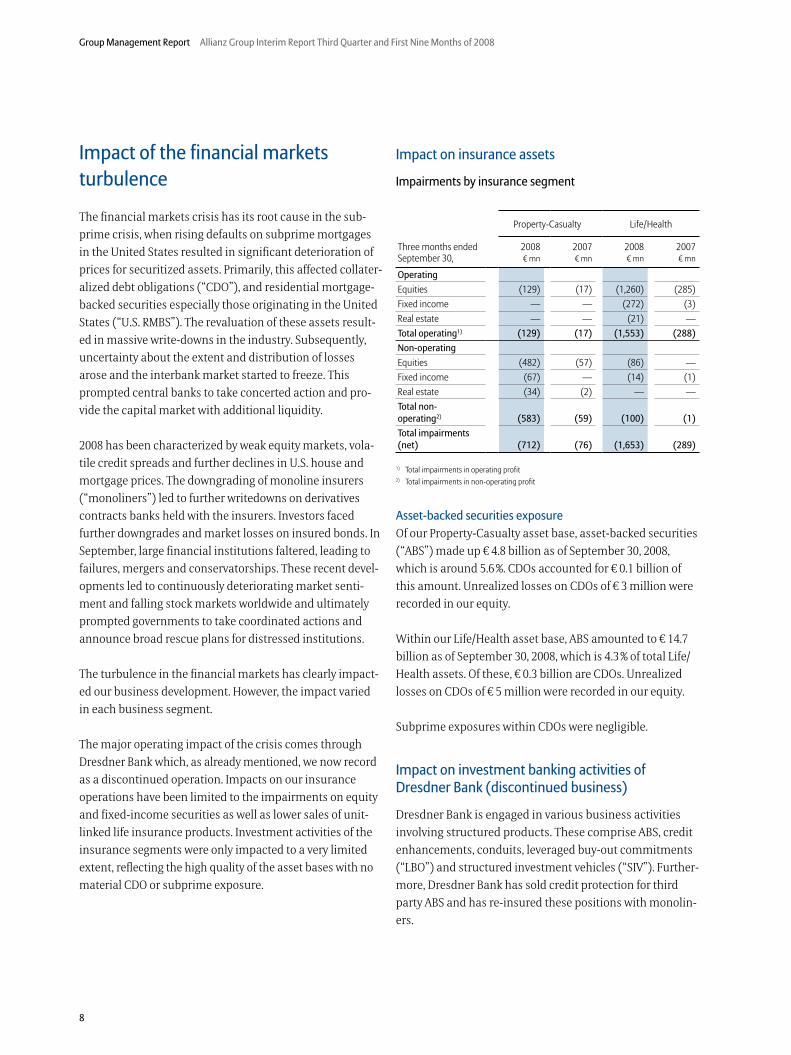
Impact on insurance assets
Impairments by insurance segment
Property-Casualty Life/Health
Three months ended 2008 2007 2008 2007September 30, � mn � mn � mn � mn
Operating
Equities (129) (17) (1,260) (285)Fixed income — — (272) (3)Real estate — — (21) —Total operating1) (129) (17) (1,553) (288)
Non-operating
Equities (482) (57) (86) —Fixed income (67) — (14) (1)Real estate (34) (2) — —Total non- operating2) (583) (59) (100) (1)
Total impairments (net) (712) (76) (1,653) (289)
1) Total impairments in operating profit2) Total impairments in non-operating profit
Asset-backed securities exposure
Of our Property-Casualty asset base, asset-backed securities
(“ABS”) made up � 4.8 bil lion as of September 30, 2008,
which is around 5.6 %. CDOs accounted for � 0.1 billion of
this amount. Unrealized losses on CDOs of � 3 million were
recorded in our equity.
Within our Life/Health asset base, ABS amounted to � 14.7
billion as of September 30, 2008, which is 4.3 % of total Life/
Health assets. Of these, � 0.3 billion are CDOs. Unrealized
losses on CDOs of � 5 million were recorded in our equity.
Subprime exposures within CDOs were negligible.
Impact on investment banking activities of Dresdner Bank (discontinued business)
Dresdner Bank is engaged in various business activities
involving structured products. These comprise ABS, credit
enhancements, conduits, leveraged buy-out commitments
(“LBO”) and structured investment vehicles (“SIV”). Further-
more, Dresdner Bank has sold credit protection for third
party ABS and has re-insured these positions with monolin-
ers.
Allianz Group Interim Report Third Quarter and First Nine Months of 2008 Group Management Report
9
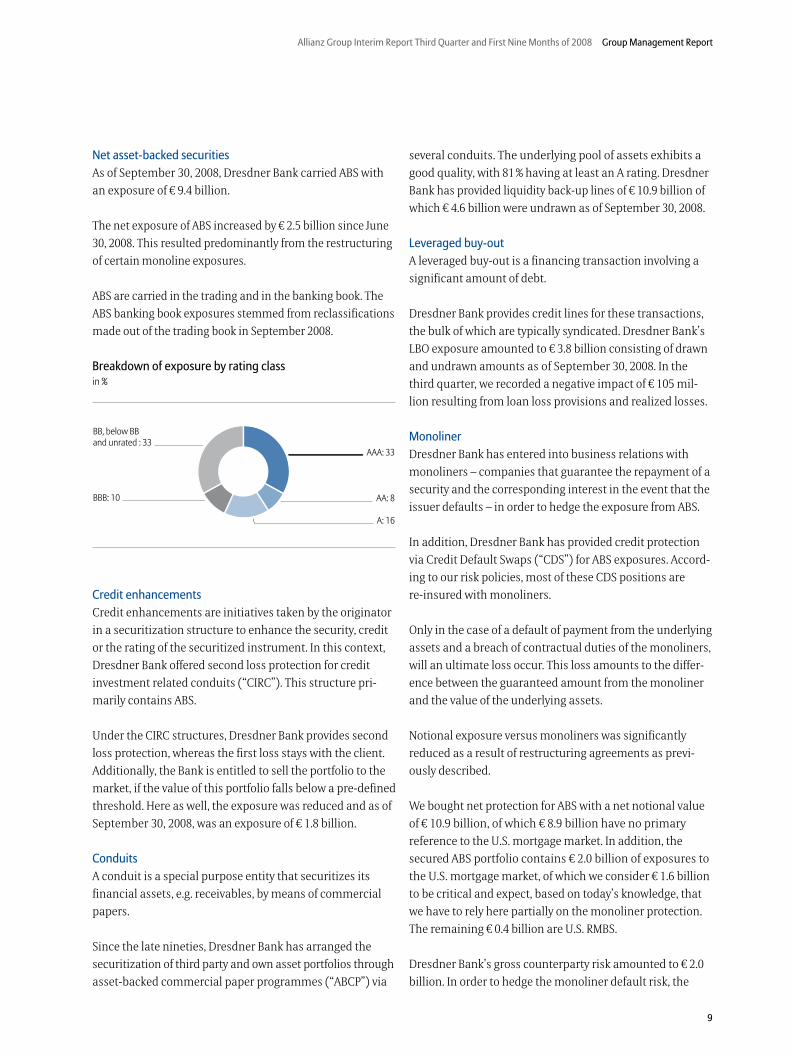
Net asset-backed securities
As of September 30, 2008, Dresdner Bank carried ABS with
an exposure of � 9.4 billion.
The net exposure of ABS increased by � 2.5 billion since June
30, 2008. This resulted predominantly from the restructuring
of certain monoline exposures.
ABS are carried in the trading and in the banking book. The
ABS banking book exposures stemmed from reclassifications
made out of the trading book in September 2008.
Breakdown of exposure by rating classin %
Credit enhancements
Credit enhancements are initiatives taken by the originator
in a securitization structure to enhance the security, credit
or the rating of the securitized instrument. In this context,
Dresdner Bank offered second loss protection for credit
investment related conduits (“CIRC”). This structure pri-
marily contains ABS.
Under the CIRC structures, Dresdner Bank provides second
loss protection, whereas the first loss stays with the client.
Additionally, the Bank is entitled to sell the portfolio to the
market, if the value of this portfolio falls below a pre-defined
threshold. Here as well, the exposure was reduced and as of
September 30, 2008, was an exposure of � 1.8 billion.
Conduits
A conduit is a special purpose entity that securitizes its
financial assets, e.g. receivables, by means of commercial
papers.
Since the late nineties, Dresdner Bank has arranged the
securitization of third party and own asset portfolios through
asset-backed commercial paper programmes (“ABCP”) via
several conduits. The underlying pool of assets exhibits a
good quality, with 81 % having at least an A rating. Dresdner
Bank has provided liquidity back-up lines of � 10.9 billion of
which � 4.6 billion were undrawn as of September 30, 2008.
Leveraged buy-out
A leveraged buy-out is a financing transaction involving a
significant amount of debt.
Dresdner Bank provides credit lines for these transactions,
the bulk of which are typically syndicated. Dresdner Bank’s
LBO exposure amounted to � 3.8 billion consisting of drawn
and undrawn amounts as of September 30, 2008. In the
third quarter, we recorded a negative impact of � 105 mil-
lion resulting from loan loss provisions and realized losses.
Monoliner
Dresdner Bank has entered into business relations with
monoliners – companies that guarantee the repayment of a
security and the corresponding interest in the event that the
issuer defaults – in order to hedge the exposure from ABS.
In addition, Dresdner Bank has provided credit protection
via Credit Default Swaps (“CDS”) for ABS exposures. Accord-
ing to our risk policies, most of these CDS positions are
re-insured with monoliners.
Only in the case of a default of payment from the underlying
assets and a breach of contractual duties of the monoliners,
will an ultimate loss occur. This loss amounts to the differ-
ence between the guaranteed amount from the monoliner
and the value of the underlying assets.
Notional exposure versus monoliners was significantly
reduced as a result of restructuring agreements as previ-
ously described.
We bought net protection for ABS with a net notional value
of � 10.9 billion, of which � 8.9 billion have no primary
reference to the U.S. mortgage market. In addition, the
secured ABS portfolio contains � 2.0 billion of exposures to
the U.S. mortgage market, of which we consider � 1.6 billion
to be critical and expect, based on today’s knowledge, that
we have to rely here partially on the monoliner protection.
The remaining � 0.4 billion are U.S. RMBS.
Dresdner Bank’s gross counterparty risk amounted to � 2.0
billion. In order to hedge the monoliner default risk, the
10
Group Management Report Allianz Group Interim Report Third Quarter and First Nine Months of 2008
bank bought Credit Default Swaps from third parties on the
various monoliners in a total amount of � 0.4 billion, leaving
us with a net counterparty exposure of � 1.6 billion.
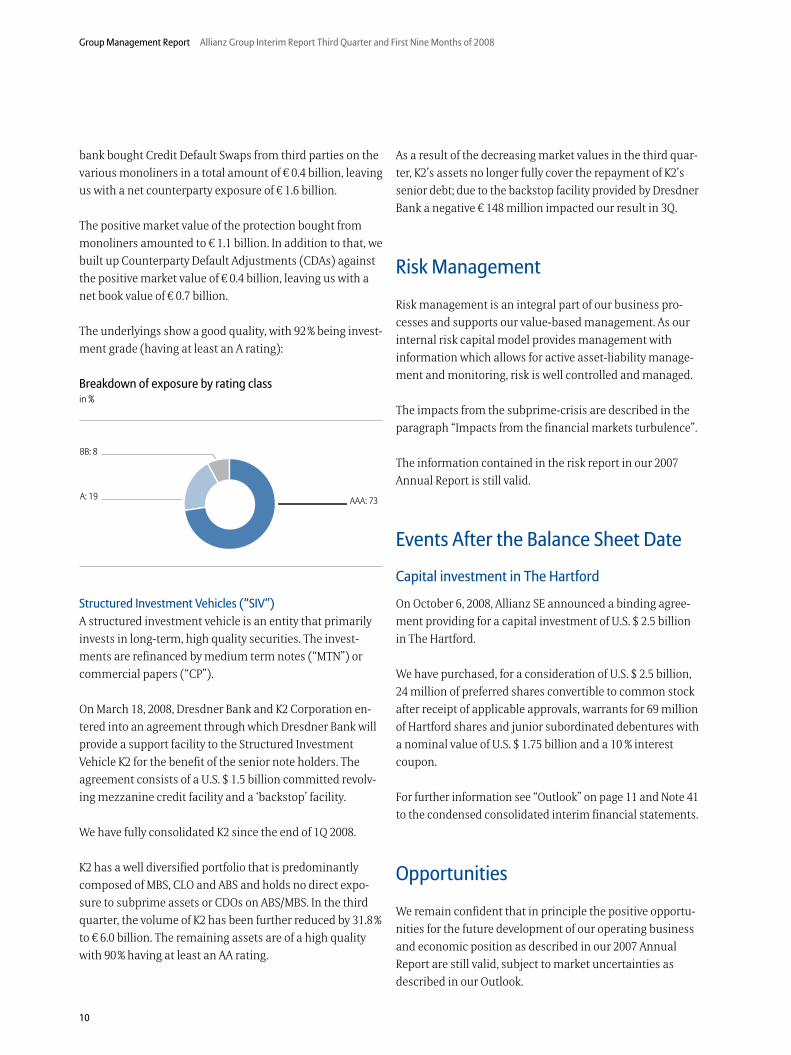
The positive market value of the protection bought from
monoliners amounted to � 1.1 billion. In addition to that, we
built up Counterparty Default Adjustments (CDAs) against
the positive market value of � 0.4 billion, leaving us with a
net book value of � 0.7 billion.
The underlyings show a good quality, with 92 % being invest-
ment grade (having at least an A rating):
Breakdown of exposure by rating classin %
Structured Investment Vehicles (“SIV”)
A structured investment vehicle is an entity that primarily
invests in long-term, high quality securities. The invest-
ments are refinanced by medium term notes (“MTN”) or
commercial papers (“CP”).
On March 18, 2008, Dresdner Bank and K2 Corporation en-
tered into an agreement through which Dresdner Bank will
provide a support facility to the Structured Investment
Vehicle K2 for the benefit of the senior note holders. The
agreement consists of a U.S. $ 1.5 billion committed revolv-
ing mezzanine credit facility and a ‘backstop’ facility.
We have fully consolidated K2 since the end of 1Q 2008.
K2 has a well diversified portfolio that is predominantly
composed of MBS, CLO and ABS and holds no direct expo-
sure to subprime assets or CDOs on ABS/MBS. In the third
quarter, the volume of K2 has been further reduced by 31.8 %
to � 6.0 billion. The remaining assets are of a high quality
with 90 % having at least an AA rating.
As a result of the decreasing market values in the third quar-
ter, K2’s assets no longer fully cover the repayment of K2’s
senior debt; due to the backstop facility provided by Dresdner
Bank a negative � 148 million impacted our result in 3Q.
Risk Management
Risk management is an integral part of our business pro-
cesses and supports our value-based management. As our
internal risk capital model provides management with
information which allows for active asset-liability manage-
ment and monitoring, risk is well controlled and managed.
The impacts from the subprime-crisis are described in the
paragraph “Impacts from the financial markets turbulence”.
The information contained in the risk report in our 2007
Annual Report is still valid.
Events After the Balance Sheet Date
Capital investment in The Hartford
On October 6, 2008, Allianz SE announced a binding agree-
ment providing for a capital investment of U.S. $ 2.5 billion
in The Hartford.
We have purchased, for a consideration of U.S. $ 2.5 billion,
24 million of preferred shares convertible to common stock
after receipt of applicable approvals, warrants for 69 million
of Hartford shares and junior subordinated debentures with
a nominal value of U.S. $ 1.75 billion and a 10 % interest
coupon.
For further information see “Outlook” on page 11 and Note 41
to the condensed consolidated interim financial statements.
Opportunities
We remain confident that in principle the positive opportu-
nities for the future development of our operating business
and economic position as described in our 2007 Annual
Report are still valid, subject to market uncertainties as
described in our Outlook.
Allianz Group Interim Report Third Quarter and First Nine Months of 2008 Group Management Report
11
Cautionary Note Regarding Forward-Looking Statements
The statements contained herein may include statements of future expectations and other forward-looking statements that are based on management’s current views and assumptions and involve known and unknown risks and uncertainties that could cause actual results, performance or events to differ materially from those expressed or implied in such statements. In addition to statements which are forward-looking by reason of context, the words “may”, “will”, “should”, “ex-pects”, “plans”, “intends”, “anticipates”, “believes”, “estimates”, “predicts”, “potential”, or “continue” and similar expressions identify forward-looking statements. Actual results, performance or events may differ materially from those in such statements due to, without limitation, (i) general economic conditions, including in particular economic conditions in the Allianz Group’s core business and core markets, (ii) performance of financial markets, including emerging markets, and in-cluding market volatility, liquidity and credit events (iii) the frequency and severity of insured loss events, including from natural catastrophes and including the development of loss expenses, (iv) mortality and morbidity levels and trends, (v) persistency levels, (vi) the extent of credit defaults, (vii) interest rate levels, (viii) currency exchange rates including the Euro/U.S. Dollar exchange rate, (ix) changing levels of competition, (x) changes in laws and regulations, including monetary convergence and the European Monetary Union, (xi) changes in the policies of central banks and/or foreign governments, (xii) the impact of acquisitions, including related integration issues, (xiii) reorganization measures, and (xiv) general competitive factors, in each case on a local, regional, national and/or global basis. Many of these factors may be more likely to occur, or more pronounced, as a result of terrorist activities and their consequences. The matters discussed herein may also be affected by risks and uncertainties described from time to time in Allianz SE’s filings with the U.S. Securities and Exchange Commission. The company assumes no obligation to update any forward-looking statement.
Furthermore, as part of the sale of Dresdner Bank to Com-
merzbank, Allianz will have access to more than 11 million
banking clients (currently 6.3 million) and approximately
1,200 branches (currently 900) of the combined entity for
the distribution of Allianz products.
Also as part of the Dresdner Bank transaction, the combina-
tion of Allianz Global Investors’ and Cominvest’s strengths
and expertise under the roof of Allianz Global Investors
Germany will create the largest asset manager in Germany
with more than � 325 billion of assets under management.
Outlook
With a solvency ratio1) of 157% at the end of the current
reporting period net of a dividend accrual of � 1.6 billion
(40 % of net income before discontinued operations) and
healthy underlying fundamentals in our operations, we feel
well positioned for the future.
The challenging and volatile conditions in financial mar-
kets continue to impact our asset accumulation businesses.
Further impairments are therefore expected, hitting operat-
ing profit especially in the Life/Health business.
As the nine month Group operating profit of � 6.5 billion
1) Solvency computed according to the draft amendment of FkSolV published by the BaFin, which revises the treatment of unrealized gains/losses on the bond portfolio. Reported solvency ratios under the old method were 145 % as of June 30, 2008 and 157 % as of December 31, 2007, respectively, and avail-able funds were � 40.2 bn as of June 30, 2008, and � 45.5 bn as of December 31, 2007, respectively.
was behind expectations for the same reasons, we expect to
fall short of the 2008 operating profit outlook of � 9 billion
plus before banking.
In these economic circumstances, making accurate earn-
ings predictions for the short to medium term is extremely
difficult. In the absence of a strong recovery in equity mar-
kets, the operating profit outlook for 2009 of � 9 billion plus
cannot be confirmed.
As always, natural catastrophes and adverse developments
in the capital markets, as well as the factors stated in our
cautionary note regarding forward-looking statements, may
severely impact our results of operations.
12
Earnings Summary
Gross premiums written1)
2008 to 2007 third quarter comparison
We maintained our focus on profitability and selectively
wrote only those risks that we believe will generate ad-
equate returns. This disciplined underwriting approach
limited the negative pricing impacts stemming from mar-
kets that have remained soft for longer than expected, while
at the same time achieving organic growth.
Gross premiums written on an internal basis were 7.8 %
ahead of previous year at � 10,989 million. A good part of the
growth came from increased crop business in the United
States. Other contributors to growth included South Ameri-
ca and Allianz Global Corporate & Specialty (“AGCS”). These
growth areas compensated for the negative impact of the
reclassification of � 279 million of AGF’s health business to
the Life/Health segment. Negative currency translation
effects amounted to � 256 million. On a nominal basis,
gross premiums written were up by 1.3 % to � 10,816 million.
1) Since 2Q 2008 we comment on the development of our gross premiums written on an internal basis, meaning adjusted for foreign currency transla-tion and (de-)consolidation effects in order to provide more comparable information.
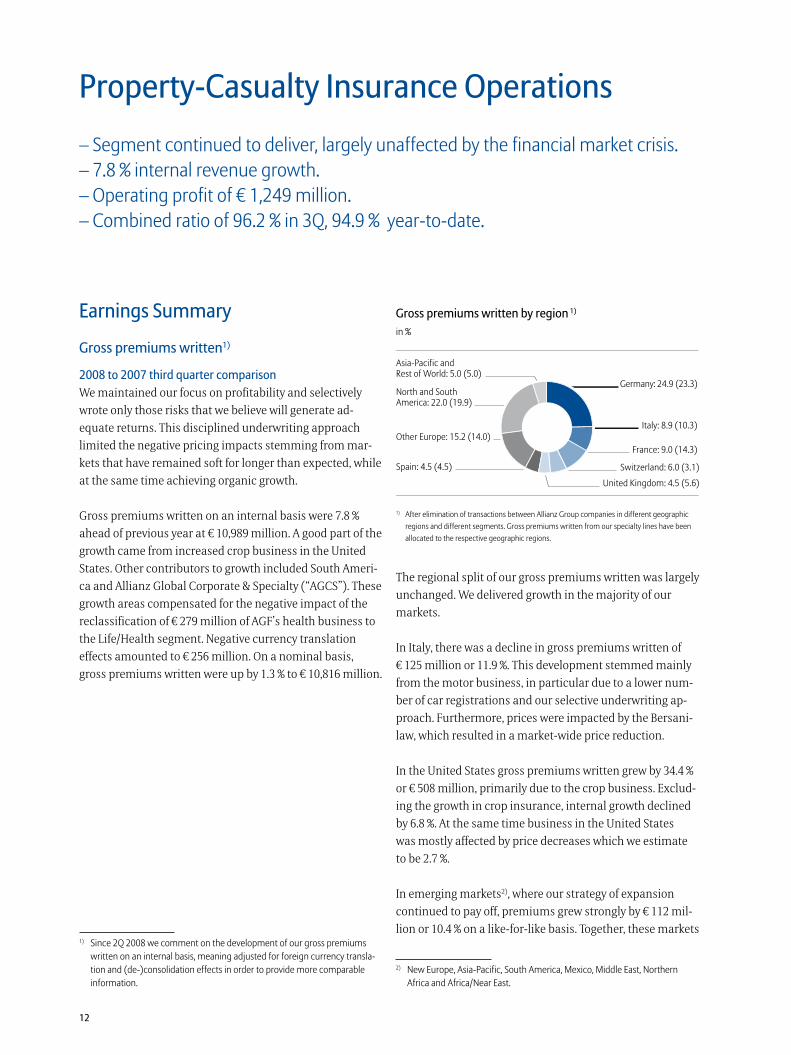
Gross premiums written by region 1)
in %
1) After elimination of transactions between Allianz Group companies in different geographic regions and different segments. Gross premiums written from our specialty lines have been allocated to the respective geographic regions.
The regional split of our gross premiums written was largely
unchanged. We delivered growth in the majority of our
markets.
In Italy, there was a decline in gross premiums written of
� 125 million or 11.9 %. This development stemmed mainly
from the motor business, in particular due to a lower num-
ber of car registrations and our selective underwriting ap-
proach. Furthermore, prices were impacted by the Bersani-
law, which resulted in a market-wide price reduction.
In the United States gross premiums written grew by 34.4 %
or � 508 million, primarily due to the crop business. Exclud-
ing the growth in crop insurance, internal growth declined
by 6.8 %. At the same time business in the United States
was mostly affected by price decreases which we estimate
to be 2.7 %.
In emerging markets2), where our strategy of expansion
continued to pay off, premiums grew strongly by � 112 mil-
lion or 10.4 % on a like-for-like basis. Together, these markets
2) New Europe, Asia-Pacific, South America, Mexico, Middle East, Northern Africa and Africa/Near East.
Property-Casualty Insurance Operations
– Segment continued to deliver, largely unaffected by the financial market crisis. – 7.8 % internal revenue growth.– Operating profit of � 1,249 million.– Combined ratio of 96.2 % in 3Q, 94.9 % year-to-date.
Allianz Group Interim Report Third Quarter and First Nine Months of 2008 Group Management Report
13
contributed � 1,185 million (3Q 2007: � 1,073 million) or
10.8 % (3Q 2007: 10.5 %) to total gross premiums written.
Brazil experienced very dynamic growth across all lines of
business, especially in motor and fire insurance. This drove
the premium growth of � 69 million or 33.0 % in South
America
Adjusted for the full consolidation of Progress Garant in
Russia and ATF-Polis in Kazakhstan, New Europe contrib-
uted � 14 million or 2.0 % to total revenue growth. As in the
second quarter the main driver for the growth was motor
insurance business in Poland.
Premiums in AGCS increased by � 123 million, or 16.5 %,
largely driven by new business in aviation and energy.
Gross premiums written – Internal growth rates 1)
in %
1) Before elimination of transactions between Allianz Group companies in different geographic regions and different segments.
2008 to 2007 nine months comparison
For the first nine months our gross premiums written on an
internal basis increased by 3.1 % to � 34,812 million. On a
nominal basis, revenues were down by 1.1 %. Adjusted for
the reclassification of � 850 million of AGF’s health busi-
ness, revenue grew slightly by 1.3 % nominally. The develop-
ments in our markets were largely consistent with the 2008
to 2007 third quarter comparison.
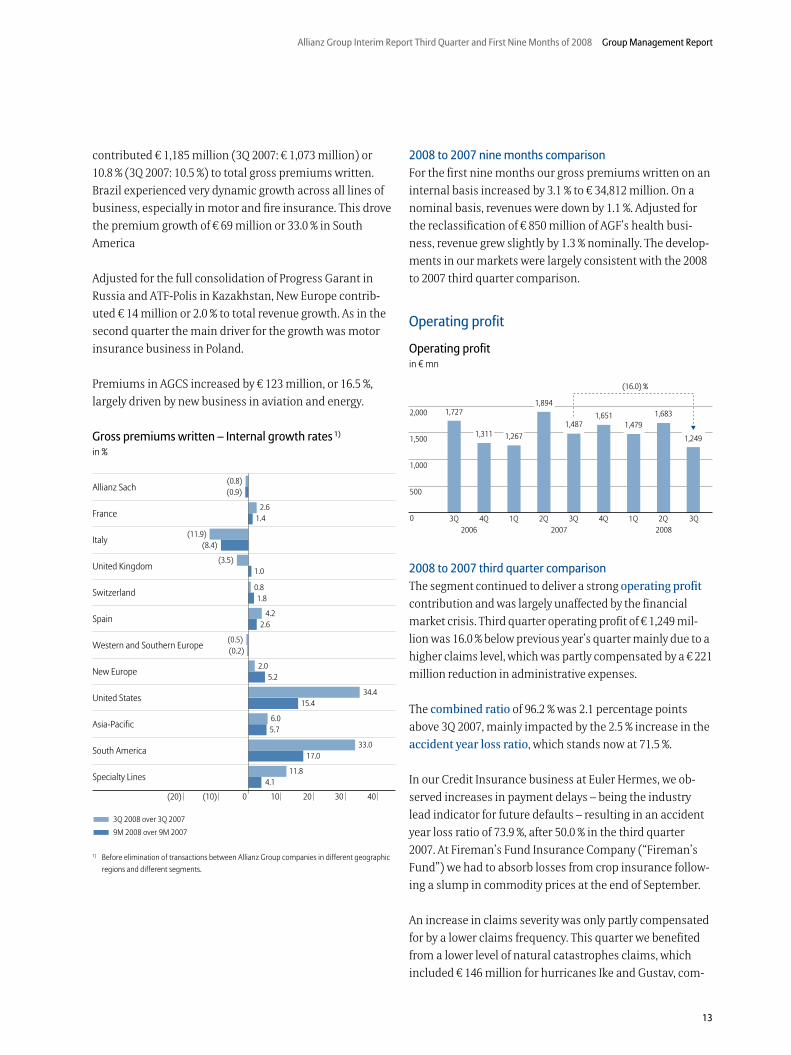
Operating profit
Operating profitin � mn
2008 to 2007 third quarter comparison
The segment continued to deliver a strong operating profit
contribution and was largely unaffected by the financial
market crisis. Third quarter operating profit of � 1,249 mil-
lion was 16.0 % below previous year’s quarter mainly due to a
higher claims level, which was partly compensated by a � 221
million reduction in administrative expenses.
The combined ratio of 96.2 % was 2.1 percentage points
above 3Q 2007, mainly impacted by the 2.5 % increase in the
accident year loss ratio, which stands now at 71.5 %.
In our Credit Insurance business at Euler Hermes, we ob-
served increases in payment delays – being the industry
lead indicator for future defaults – resulting in an accident
year loss ratio of 73.9 %, after 50.0 % in the third quarter
2007. At Fireman’s Fund Insurance Company (“Fireman’s
Fund”) we had to absorb losses from crop insurance follow-
ing a slump in commodity prices at the end of September.
An increase in claims severity was only partly compensated
for by a lower claims frequency. This quarter we benefited
from a lower level of natural catastrophes claims, which
included � 146 million for hurricanes Ike and Gustav, com-
14
Group Management Report Allianz Group Interim Report Third Quarter and First Nine Months of 2008
pared to � 225 million for natural catastrophes in 2007. At
1.5 % the net development in prior years’ loss reserves was
below the average level. Overall, the calendar year loss ratio
increased by 3.5 percentage points to 70.0 %.
Acquisition and administrative expenses decreased by
5.4 % to � 2,597 million. The reduction of administrative
expenses was partly driven by further efficiency improve-
ments that contributed � 56 million. Due to this positive
development, our expense ratio improved by 1.4 percentage
points to 26.2 %.
Interest and similar income was up by 4.2 % to � 1,049 mil-
lion. The reason for this development was the higher invest-
ment income on debt securities that exceeded the decline
in dividend income.
2008 to 2007 nine months comparison
On a nine month basis, operating profit decreased in line
with the third quarter comparison to � 4,411 million. Our
expense ratio improved by 1.5 percentage points to 26.6 %,
but the loss ratio deteriorated by 1.8 percentage points.
Therefore, our combined ratio was up by 0.3 percentage
points to 94.9 %.
Non-operating result
2008 to 2007 third quarter comparison
The non-operating result decreased to a loss of � 126 mil-
lion. This development was mainly due to increased im-
pairments of investments which more than offset higher
net realized gains.
Net realized gains from investments increased by � 228
million to � 530 million mainly reflecting forward sales of
participations in both RWE and Linde.
Non-operating impairments on investments increased to
� 583 million, reflecting the overall weakness in the finan-
cial markets.
2008 to 2007 nine months comparison
The non-operating result decreased to a gain of � 595 mil-
lion, down 45.7 % for the first nine months of 2008. Although
net realized gains increased they were more than out-
weighed by higher impairments of investments.
Net income
2008 to 2007 third quarter comparison
Net income decreased significantly by 53.7 % to � 791 mil-
lion. Higher income tax expenses contributed to this devel-
opment.
Income tax expenses increased to � 303 million, leading
to a rise in the effective tax rate from (1.9) % to 27.0 %. This
mainly resulted from the benefit from the German tax re-
form in the third quarter 2007.
Lower minority interests in earnings amounted to � 29 mil -
lion.
2008 to 2007 nine months comparison
For the first nine months, net income decreased by 14.0 % to
� 3,670 million.
Income tax expenses increased up to � 1,213 million, lead-
ing to an increase in the effective tax rate from 18.8 % to
24.2 % for the reason mentioned above.
Minority interests in earnings were also lower on a nine
months basis, amounting to � 123 million.
Allianz Group Interim Report Third Quarter and First Nine Months of 2008 Group Management Report
15
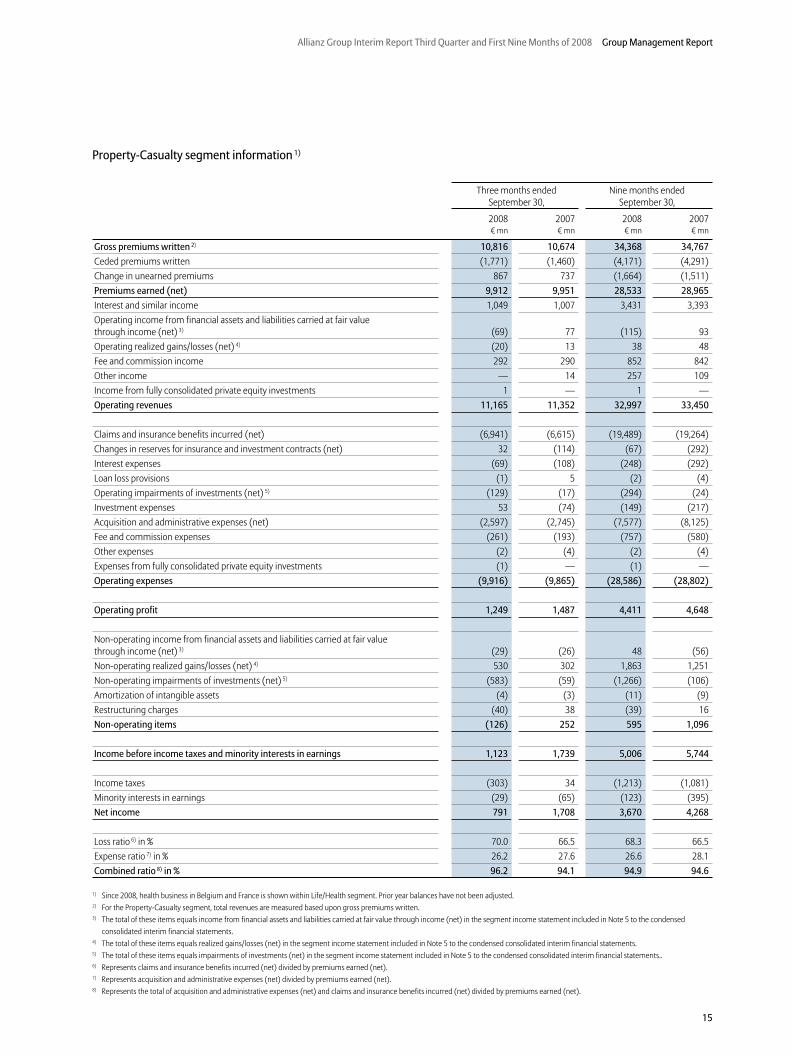
Property-Casualty segment information 1)
Three months ended September 30,
Nine months ended September 30,
2008 2007 2008 2007� mn � mn � mn � mn
Gross premiums written 2) 10,816 10,674 34,368 34,767
Ceded premiums written (1,771) (1,460) (4,171) (4,291)Change in unearned premiums 867 737 (1,664) (1,511)Premiums earned (net) 9,912 9,951 28,533 28,965
Interest and similar income 1,049 1,007 3,431 3,393Operating income from financial assets and liabilities carried at fair value through income (net) 3) (69) 77 (115) 93Operating realized gains/losses (net) 4) (20) 13 38 48Fee and commission income 292 290 852 842Other income — 14 257 109Income from fully consolidated private equity investments 1 — 1 —Operating revenues 11,165 11,352 32,997 33,450
Claims and insurance benefits incurred (net) (6,941) (6,615) (19,489) (19,264)Changes in reserves for insurance and investment contracts (net) 32 (114) (67) (292)Interest expenses (69) (108) (248) (292)Loan loss provisions (1) 5 (2) (4)Operating impairments of investments (net) 5) (129) (17) (294) (24)Investment expenses 53 (74) (149) (217)Acquisition and administrative expenses (net) (2,597) (2,745) (7,577) (8,125)Fee and commission expenses (261) (193) (757) (580)Other expenses (2) (4) (2) (4)Expenses from fully consolidated private equity investments (1) — (1) —Operating expenses (9,916) (9,865) (28,586) (28,802)
Operating profit 1,249 1,487 4,411 4,648
Non-operating income from financial assets and liabilities carried at fair value through income (net) 3) (29) (26) 48 (56)Non-operating realized gains/losses (net) 4) 530 302 1,863 1,251Non-operating impairments of investments (net) 5) (583) (59) (1,266) (106)Amortization of intangible assets (4) (3) (11) (9)Restructuring charges (40) 38 (39) 16Non-operating items (126) 252 595 1,096
Income before income taxes and minority interests in earnings 1,123 1,739 5,006 5,744
Income taxes (303) 34 (1,213) (1,081)Minority interests in earnings (29) (65) (123) (395)Net income 791 1,708 3,670 4,268
Loss ratio 6) in % 70.0 66.5 68.3 66.5Expense ratio 7) in % 26.2 27.6 26.6 28.1Combined ratio 8) in % 96.2 94.1 94.9 94.6
1) Since 2008, health business in Belgium and France is shown within Life/Health segment. Prior year balances have not been adjusted.2) For the Property-Casualty segment, total revenues are measured based upon gross premiums written.3) The total of these items equals income from financial assets and liabilities carried at fair value through income (net) in the segment income statement included in Note 5 to the condensed
consolidated interim financial statements.4) The total of these items equals realized gains/losses (net) in the segment income statement included in Note 5 to the condensed consolidated interim financial statements.5) The total of these items equals impairments of investments (net) in the segment income statement included in Note 5 to the condensed consolidated interim financial statements..6) Represents claims and insurance benefits incurred (net) divided by premiums earned (net).7) Represents acquisition and administrative expenses (net) divided by premiums earned (net).8) Represents the total of acquisition and administrative expenses (net) and claims and insurance benefits incurred (net) divided by premiums earned (net).
16
Group Management Report Allianz Group Interim Report Third Quarter and First Nine Months of 2008
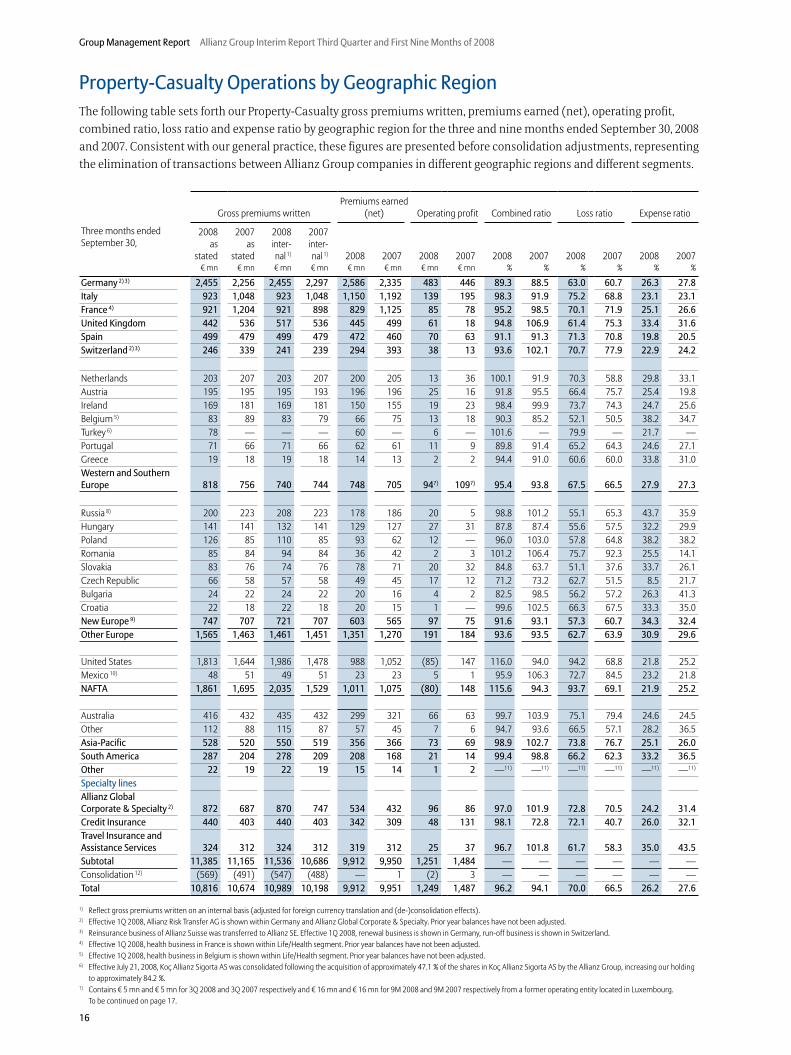
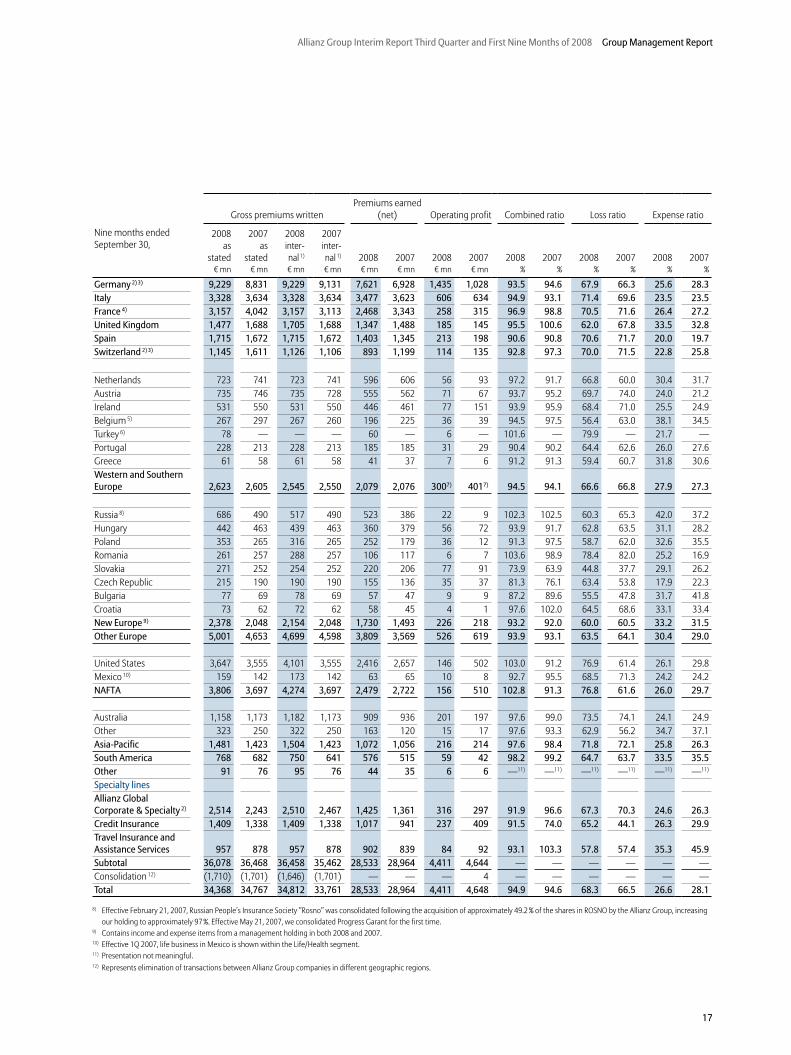
Property-Casualty Operations by Geographic Region The following table sets forth our Property-Casualty gross premiums written, premiums earned (net), operating profit,
combined ratio, loss ratio and expense ratio by geographic region for the three and nine months ended September 30, 2008
and 2007. Consistent with our general practice, these figures are presented before consolidation adjustments, representing
the elimination of transactions between Allianz Group companies in different geographic regions and different segments.
Gross premiums writtenPremiums earned
(net) Operating profit Combined ratio Loss ratio Expense ratio
Three months ended September 30,
2008 as
stated
2007 as
stated
2008 inter-nal 1)
2007 inter-nal 1) 2008 2007 2008 2007 2008 2007 2008 2007 2008 2007
� mn � mn � mn � mn � mn � mn � mn � mn % % % % % %
Germany 2) 3) 2,455 2,256 2,455 2,297 2,586 2,335 483 446 89.3 88.5 63.0 60.7 26.3 27.8
Italy 923 1,048 923 1,048 1,150 1,192 139 195 98.3 91.9 75.2 68.8 23.1 23.1
France 4) 921 1,204 921 898 829 1,125 85 78 95.2 98.5 70.1 71.9 25.1 26.6
United Kingdom 442 536 517 536 445 499 61 18 94.8 106.9 61.4 75.3 33.4 31.6
Spain 499 479 499 479 472 460 70 63 91.1 91.3 71.3 70.8 19.8 20.5
Switzerland 2) 3) 246 339 241 239 294 393 38 13 93.6 102.1 70.7 77.9 22.9 24.2
Netherlands 203 207 203 207 200 205 13 36 100.1 91.9 70.3 58.8 29.8 33.1Austria 195 195 195 193 196 196 25 16 91.8 95.5 66.4 75.7 25.4 19.8Ireland 169 181 169 181 150 155 19 23 98.4 99.9 73.7 74.3 24.7 25.6Belgium 5) 83 89 83 79 66 75 13 18 90.3 85.2 52.1 50.5 38.2 34.7Turkey 6) 78 — — — 60 — 6 — 101.6 — 79.9 — 21.7 —Portugal 71 66 71 66 62 61 11 9 89.8 91.4 65.2 64.3 24.6 27.1Greece 19 18 19 18 14 13 2 2 94.4 91.0 60.6 60.0 33.8 31.0Western and Southern Europe 818 756 740 744 748 705 947) 1097) 95.4 93.8 67.5 66.5 27.9 27.3
Russia 8) 200 223 208 223 178 186 20 5 98.8 101.2 55.1 65.3 43.7 35.9Hungary 141 141 132 141 129 127 27 31 87.8 87.4 55.6 57.5 32.2 29.9Poland 126 85 110 85 93 62 12 — 96.0 103.0 57.8 64.8 38.2 38.2Romania 85 84 94 84 36 42 2 3 101.2 106.4 75.7 92.3 25.5 14.1Slovakia 83 76 74 76 78 71 20 32 84.8 63.7 51.1 37.6 33.7 26.1Czech Republic 66 58 57 58 49 45 17 12 71.2 73.2 62.7 51.5 8.5 21.7Bulgaria 24 22 24 22 20 16 4 2 82.5 98.5 56.2 57.2 26.3 41.3Croatia 22 18 22 18 20 15 1 — 99.6 102.5 66.3 67.5 33.3 35.0New Europe 9) 747 707 721 707 603 565 97 75 91.6 93.1 57.3 60.7 34.3 32.4
Other Europe 1,565 1,463 1,461 1,451 1,351 1,270 191 184 93.6 93.5 62.7 63.9 30.9 29.6
United States 1,813 1,644 1,986 1,478 988 1,052 (85) 147 116.0 94.0 94.2 68.8 21.8 25.2Mexico 10) 48 51 49 51 23 23 5 1 95.9 106.3 72.7 84.5 23.2 21.8NAFTA 1,861 1,695 2,035 1,529 1,011 1,075 (80) 148 115.6 94.3 93.7 69.1 21.9 25.2
Australia 416 432 435 432 299 321 66 63 99.7 103.9 75.1 79.4 24.6 24.5Other 112 88 115 87 57 45 7 6 94.7 93.6 66.5 57.1 28.2 36.5Asia-Pacific 528 520 550 519 356 366 73 69 98.9 102.7 73.8 76.7 25.1 26.0
South America 287 204 278 209 208 168 21 14 99.4 98.8 66.2 62.3 33.2 36.5
Other 22 19 22 19 15 14 1 2 —11) —11) —11) —11) —11) —11)
Specialty lines
Allianz Global Corporate & Specialty 2) 872 687 870 747 534 432 96 86 97.0 101.9 72.8 70.5 24.2 31.4
Credit Insurance 440 403 440 403 342 309 48 131 98.1 72.8 72.1 40.7 26.0 32.1
Travel Insurance and Assistance Services 324 312 324 312 319 312 25 37 96.7 101.8 61.7 58.3 35.0 43.5
Subtotal 11,385 11,165 11,536 10,686 9,912 9,950 1,251 1,484 — — — — — —Consolidation 12) (569) (491) (547) (488) — 1 (2) 3 — — — — — —Total 10,816 10,674 10,989 10,198 9,912 9,951 1,249 1,487 96.2 94.1 70.0 66.5 26.2 27.6
1) Reflect gross premiums written on an internal basis (adjusted for foreign currency translation and (de-)consolidation effects). 2) Effective 1Q 2008, Allianz Risk Transfer AG is shown within Germany and Allianz Global Corporate & Specialty. Prior year balances have not been adjusted.3) Reinsurance business of Allianz Suisse was transferred to Allianz SE. Effective 1Q 2008, renewal business is shown in Germany, run-off business is shown in Switzerland.4) Effective 1Q 2008, health business in France is shown within Life/Health segment. Prior year balances have not been adjusted.5) Effective 1Q 2008, health business in Belgium is shown within Life/Health segment. Prior year balances have not been adjusted.6) Effective July 21, 2008, Koç Allianz Sigorta AS was consolidated following the acquisition of approximately 47.1 % of the shares in Koç Allianz Sigorta AS by the Allianz Group, increasing our holding
to approximately 84.2 %.7) Contains � 5 mn and � 5 mn for 3Q 2008 and 3Q 2007 respectively and � 16 mn and � 16 mn for 9M 2008 and 9M 2007 respectively from a former operating entity located in Luxembourg. To be continued on page 17.
Allianz Group Interim Report Third Quarter and First Nine Months of 2008 Group Management Report
17
Gross premiums writtenPremiums earned
(net) Operating profit Combined ratio Loss ratio Expense ratio
Nine months ended September 30,
2008 as
stated
2007 as
stated
2008 inter-nal 1)
2007 inter-nal 1) 2008 2007 2008 2007 2008 2007 2008 2007 2008 2007
� mn � mn � mn � mn � mn � mn � mn � mn % % % % % %
Germany 2) 3) 9,229 8,831 9,229 9,131 7,621 6,928 1,435 1,028 93.5 94.6 67.9 66.3 25.6 28.3
Italy 3,328 3,634 3,328 3,634 3,477 3,623 606 634 94.9 93.1 71.4 69.6 23.5 23.5
France 4) 3,157 4,042 3,157 3,113 2,468 3,343 258 315 96.9 98.8 70.5 71.6 26.4 27.2
United Kingdom 1,477 1,688 1,705 1,688 1,347 1,488 185 145 95.5 100.6 62.0 67.8 33.5 32.8
Spain 1,715 1,672 1,715 1,672 1,403 1,345 213 198 90.6 90.8 70.6 71.7 20.0 19.7
Switzerland 2) 3) 1,145 1,611 1,126 1,106 893 1,199 114 135 92.8 97.3 70.0 71.5 22.8 25.8
Netherlands 723 741 723 741 596 606 56 93 97.2 91.7 66.8 60.0 30.4 31.7Austria 735 746 735 728 555 562 71 67 93.7 95.2 69.7 74.0 24.0 21.2Ireland 531 550 531 550 446 461 77 151 93.9 95.9 68.4 71.0 25.5 24.9Belgium 5) 267 297 267 260 196 225 36 39 94.5 97.5 56.4 63.0 38.1 34.5Turkey 6) 78 — — — 60 — 6 — 101.6 — 79.9 — 21.7 —Portugal 228 213 228 213 185 185 31 29 90.4 90.2 64.4 62.6 26.0 27.6Greece 61 58 61 58 41 37 7 6 91.2 91.3 59.4 60.7 31.8 30.6Western and Southern Europe 2,623 2,605 2,545 2,550 2,079 2,076 3007) 4017) 94.5 94.1 66.6 66.8 27.9 27.3
Russia 8) 686 490 517 490 523 386 22 9 102.3 102.5 60.3 65.3 42.0 37.2Hungary 442 463 439 463 360 379 56 72 93.9 91.7 62.8 63.5 31.1 28.2Poland 353 265 316 265 252 179 36 12 91.3 97.5 58.7 62.0 32.6 35.5Romania 261 257 288 257 106 117 6 7 103.6 98.9 78.4 82.0 25.2 16.9Slovakia 271 252 254 252 220 206 77 91 73.9 63.9 44.8 37.7 29.1 26.2Czech Republic 215 190 190 190 155 136 35 37 81.3 76.1 63.4 53.8 17.9 22.3Bulgaria 77 69 78 69 57 47 9 9 87.2 89.6 55.5 47.8 31.7 41.8Croatia 73 62 72 62 58 45 4 1 97.6 102.0 64.5 68.6 33.1 33.4New Europe 9) 2,378 2,048 2,154 2,048 1,730 1,493 226 218 93.2 92.0 60.0 60.5 33.2 31.5
Other Europe 5,001 4,653 4,699 4,598 3,809 3,569 526 619 93.9 93.1 63.5 64.1 30.4 29.0
United States 3,647 3,555 4,101 3,555 2,416 2,657 146 502 103.0 91.2 76.9 61.4 26.1 29.8Mexico 10) 159 142 173 142 63 65 10 8 92.7 95.5 68.5 71.3 24.2 24.2NAFTA 3,806 3,697 4,274 3,697 2,479 2,722 156 510 102.8 91.3 76.8 61.6 26.0 29.7
Australia 1,158 1,173 1,182 1,173 909 936 201 197 97.6 99.0 73.5 74.1 24.1 24.9Other 323 250 322 250 163 120 15 17 97.6 93.3 62.9 56.2 34.7 37.1Asia-Pacific 1,481 1,423 1,504 1,423 1,072 1,056 216 214 97.6 98.4 71.8 72.1 25.8 26.3
South America 768 682 750 641 576 515 59 42 98.2 99.2 64.7 63.7 33.5 35.5
Other 91 76 95 76 44 35 6 6 —11) —11) —11) —11) —11) —11)
Specialty lines
Allianz Global Corporate & Specialty 2) 2,514 2,243 2,510 2,467 1,425 1,361 316 297 91.9 96.6 67.3 70.3 24.6 26.3
Credit Insurance 1,409 1,338 1,409 1,338 1,017 941 237 409 91.5 74.0 65.2 44.1 26.3 29.9
Travel Insurance and Assistance Services 957 878 957 878 902 839 84 92 93.1 103.3 57.8 57.4 35.3 45.9
Subtotal 36,078 36,468 36,458 35,462 28,533 28,964 4,411 4,644 — — — — — —Consolidation 12) (1,710) (1,701) (1,646) (1,701) — — — 4 — — — — — —Total 34,368 34,767 34,812 33,761 28,533 28,964 4,411 4,648 94.9 94.6 68.3 66.5 26.6 28.1
8) Effective February 21, 2007, Russian People’s Insurance Society “Rosno” was consolidated following the acquisition of approximately 49.2 % of the shares in ROSNO by the Allianz Group, increasing our holding to approximately 97 %. Effective May 21, 2007, we consolidated Progress Garant for the first time.
9) Contains income and expense items from a management holding in both 2008 and 2007.10) Effective 1Q 2007, life business in Mexico is shown within the Life/Health segment.11) Presentation not meaningful.12) Represents elimination of transactions between Allianz Group companies in different geographic regions.
18
Earnings Summary
Statutory premiums1)
2008 to 2007 third quarter comparison
The current economic crisis left its mark on statutory pre-
mium growth, especially with regards to unit-linked and
other investment-oriented products. Two effects were ob-
served: Customers felt insecure and concerned about bear-
ing investment risk themselves, and secondly bancassur-
ance partners promoting deposit products rather than
unit-linked contracts. The 5.0 % growth in sales from tradi-
tional life insurance products could not outweigh this de-
cline. Therefore, at � 9,625 million, statutory premiums were
down by 8.7 % on an internal basis, which adjusts 2007 for
the AGF’s health business of � 279 million from the Proper-
ty-Casualty segment. At � 9,415 million, statutory premiums
on a nominal basis were down 8.3 % compared to the third
quarter 2007.
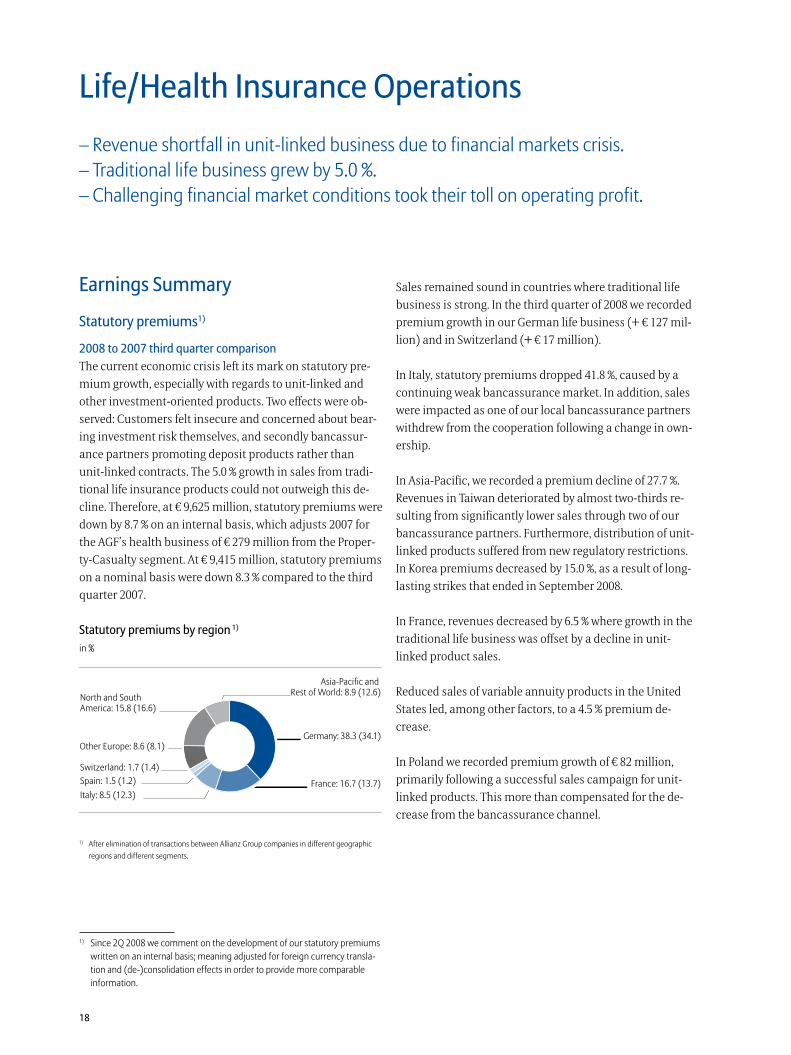
Statutory premiums by region 1)
in %
1) After elimination of transactions between Allianz Group companies in different geographic regions and different segments.
1) Since 2Q 2008 we comment on the development of our statutory premiums written on an internal basis; meaning adjusted for foreign currency transla-tion and (de-)consolidation effects in order to provide more comparable information.
Life/Health Insurance Operations
– Revenue shortfall in unit-linked business due to financial markets crisis.– Traditional life business grew by 5.0 %.– Challenging financial market conditions took their toll on operating profit.
Sales remained sound in countries where traditional life
business is strong. In the third quarter of 2008 we recorded
premium growth in our German life business (+ � 127 mil-
lion) and in Switzerland (+ � 17 million).
In Italy, statutory premiums dropped 41.8 %, caused by a
continuing weak bancassurance market. In addition, sales
were impacted as one of our local bancassurance partners
withdrew from the cooperation following a change in own-
ership.
In Asia-Pacific, we recorded a premium decline of 27.7 %.
Revenues in Taiwan deteriorated by almost two-thirds re-
sulting from significantly lower sales through two of our
bancassurance partners. Furthermore, distribution of unit-
linked products suffered from new regulatory restrictions.
In Korea premiums decreased by 15.0 %, as a result of long-
lasting strikes that ended in September 2008.
In France, revenues decreased by 6.5 % where growth in the
traditional life business was offset by a decline in unit-
linked product sales.
Reduced sales of variable annuity products in the United
States led, among other factors, to a 4.5 % premium de-
crease.
In Poland we recorded premium growth of � 82 million,
primarily following a successful sales campaign for unit-
linked products. This more than compensated for the de-
crease from the bancassurance channel.
Allianz Group Interim Report Third Quarter and First Nine Months of 2008 Group Management Report
19
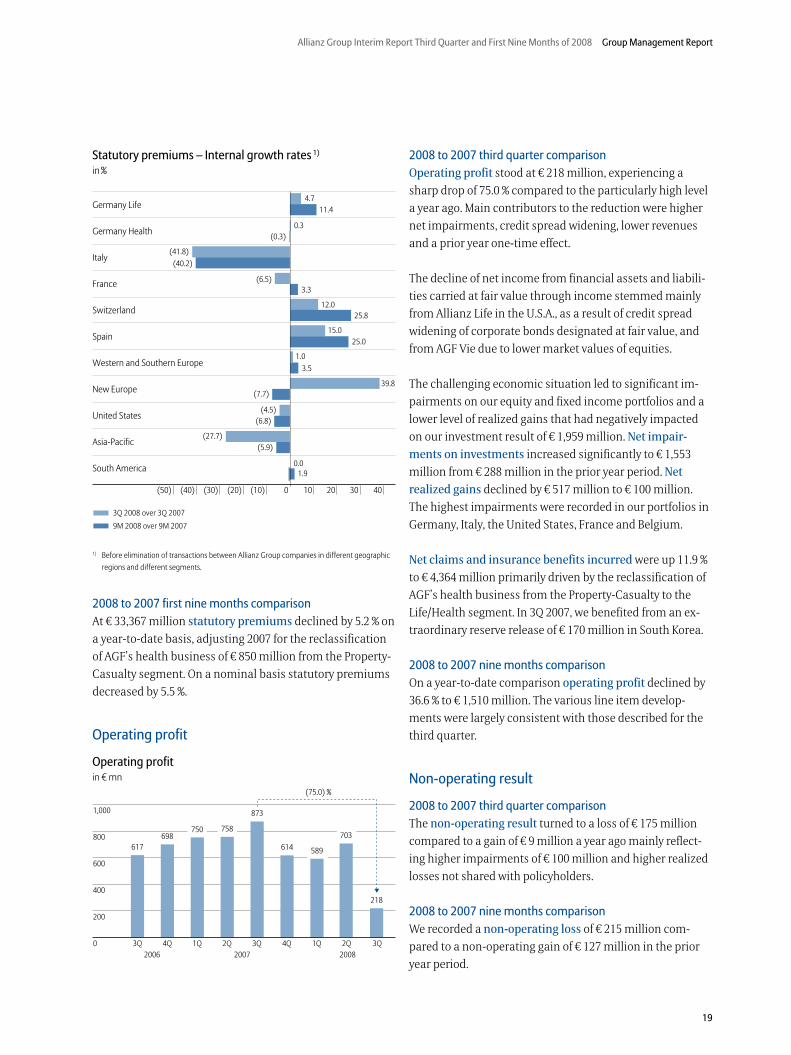
Statutory premiums – Internal growth rates 1)
in %
1) Before elimination of transactions between Allianz Group companies in different geographic regions and different segments.
2008 to 2007 first nine months comparison
At � 33,367 million statutory premiums declined by 5.2 % on
a year-to-date basis, adjusting 2007 for the reclassification
of AGF’s health business of � 850 million from the Property-
Casualty segment. On a nominal basis statutory premiums
decreased by 5.5 %.
Operating profit
Operating profitin � mn
2008 to 2007 third quarter comparison
Operating profit stood at � 218 million, experiencing a
sharp drop of 75.0 % compared to the particularly high level
a year ago. Main contributors to the reduction were higher
net impairments, credit spread widening, lower revenues
and a prior year one-time effect.
The decline of net income from financial assets and liabili-
ties carried at fair value through income stemmed mainly
from Allianz Life in the U.S.A., as a result of credit spread
widening of corporate bonds designated at fair value, and
from AGF Vie due to lower market values of equities.
The challenging economic situation led to significant im-
pairments on our equity and fixed income portfolios and a
lower level of realized gains that had negatively impacted
on our investment result of � 1,959 million. Net impair-
ments on investments increased significantly to � 1,553
million from � 288 million in the prior year period. Net
realized gains declined by � 517 million to � 100 million.
The highest impairments were recorded in our portfolios in
Germany, Italy, the United States, France and Belgium.
Net claims and insurance benefits incurred were up 11.9 %
to � 4,364 million primarily driven by the reclassification of
AGF’s health business from the Property-Casualty to the
Life/Health segment. In 3Q 2007, we benefited from an ex-
traordinary reserve release of � 170 million in South Korea.
2008 to 2007 nine months comparison
On a year-to-date comparison operating profit declined by
36.6 % to � 1,510 million. The various line item develop-
ments were largely consistent with those described for the
third quarter.
Non-operating result
2008 to 2007 third quarter comparison
The non-operating result turned to a loss of � 175 million
compared to a gain of � 9 million a year ago mainly reflect-
ing higher impairments of � 100 million and higher realized
losses not shared with policyholders.
2008 to 2007 nine months comparison
We recorded a non-operating loss of � 215 million com-
pared to a non-operating gain of � 127 million in the prior
year period.
20
Group Management Report Allianz Group Interim Report Third Quarter and First Nine Months of 2008
Net income
2008 to 2007 third quarter comparison
We recorded a net loss of � 5 million compared to a net
income of � 563 million mostly driven by the shortfall in
operating profit that was only partly compensated by lower
tax charges.
Income tax expenses decreased by 86.0 % to � 41 million.
The effective tax rate amounted to 95.3 % (3Q 2007: 33.2 %)
mainly driven by non tax-deductible impairments on
shares in Belgium and Italy.
2008 to 2007 nine months comparison
At � 872 million, down 45.3 % net income reflected the trend
already described in the quarter-over-quarter analysis.
Income tax expenses almost halved, amounting to � 377
million, showing an almost unchanged effective tax rate of
29.1 %.
Minority interests in earnings were � 46 million, � 139 mil-
lion less than in the prior year period. This mainly reflected
the minority buy-out in France.
Allianz Group Interim Report Third Quarter and First Nine Months of 2008 Group Management Report
21
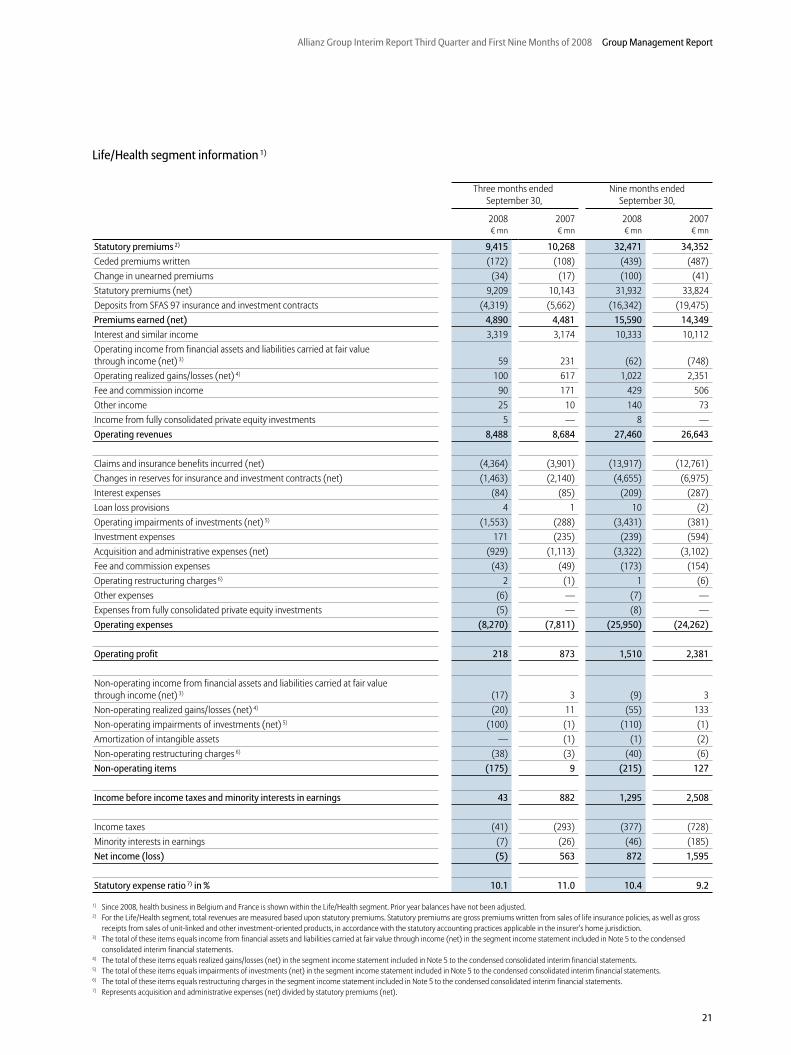
Life/Health segment information 1)
Three months ended September 30,
Nine months endedSeptember 30,
2008 2007 2008 2007� mn � mn � mn � mn
Statutory premiums 2) 9,415 10,268 32,471 34,352
Ceded premiums written (172) (108) (439) (487)Change in unearned premiums (34) (17) (100) (41)Statutory premiums (net) 9,209 10,143 31,932 33,824Deposits from SFAS 97 insurance and investment contracts (4,319) (5,662) (16,342) (19,475)Premiums earned (net) 4,890 4,481 15,590 14,349
Interest and similar income 3,319 3,174 10,333 10,112Operating income from financial assets and liabilities carried at fair value through income (net) 3) 59 231 (62) (748)Operating realized gains/losses (net) 4) 100 617 1,022 2,351Fee and commission income 90 171 429 506Other income 25 10 140 73Income from fully consolidated private equity investments 5 — 8 —Operating revenues 8,488 8,684 27,460 26,643
Claims and insurance benefits incurred (net) (4,364) (3,901) (13,917) (12,761)Changes in reserves for insurance and investment contracts (net) (1,463) (2,140) (4,655) (6,975)Interest expenses (84) (85) (209) (287)Loan loss provisions 4 1 10 (2)Operating impairments of investments (net) 5) (1,553) (288) (3,431) (381)Investment expenses 171 (235) (239) (594)Acquisition and administrative expenses (net) (929) (1,113) (3,322) (3,102)Fee and commission expenses (43) (49) (173) (154)Operating restructuring charges 6) 2 (1) 1 (6)Other expenses (6) — (7) —Expenses from fully consolidated private equity investments (5) — (8) —Operating expenses (8,270) (7,811) (25,950) (24,262)
Operating profit 218 873 1,510 2,381
Non-operating income from financial assets and liabilities carried at fair value through income (net) 3) (17) 3 (9) 3Non-operating realized gains/losses (net) 4) (20) 11 (55) 133Non-operating impairments of investments (net) 5) (100) (1) (110) (1)Amortization of intangible assets — (1) (1) (2)Non-operating restructuring charges 6) (38) (3) (40) (6)Non-operating items (175) 9 (215) 127
Income before income taxes and minority interests in earnings 43 882 1,295 2,508
Income taxes (41) (293) (377) (728)Minority interests in earnings (7) (26) (46) (185)Net income (loss) (5) 563 872 1,595
Statutory expense ratio 7) in % 10.1 11.0 10.4 9.2
1) Since 2008, health business in Belgium and France is shown within the Life/Health segment. Prior year balances have not been adjusted.2) For the Life/Health segment, total revenues are measured based upon statutory premiums. Statutory premiums are gross premiums written from sales of life insurance policies, as well as gross
receipts from sales of unit-linked and other investment-oriented products, in accordance with the statutory accounting practices applicable in the insurer’s home jurisdiction.3) The total of these items equals income from financial assets and liabilities carried at fair value through income (net) in the segment income statement included in Note 5 to the condensed
consolidated interim financial statements.4) The total of these items equals realized gains/losses (net) in the segment income statement included in Note 5 to the condensed consolidated interim financial statements.5) The total of these items equals impairments of investments (net) in the segment income statement included in Note 5 to the condensed consolidated interim financial statements.6) The total of these items equals restructuring charges in the segment income statement included in Note 5 to the condensed consolidated interim financial statements.7) Represents acquisition and administrative expenses (net) divided by statutory premiums (net).
22
Group Management Report Allianz Group Interim Report Third Quarter and First Nine Months of 2008
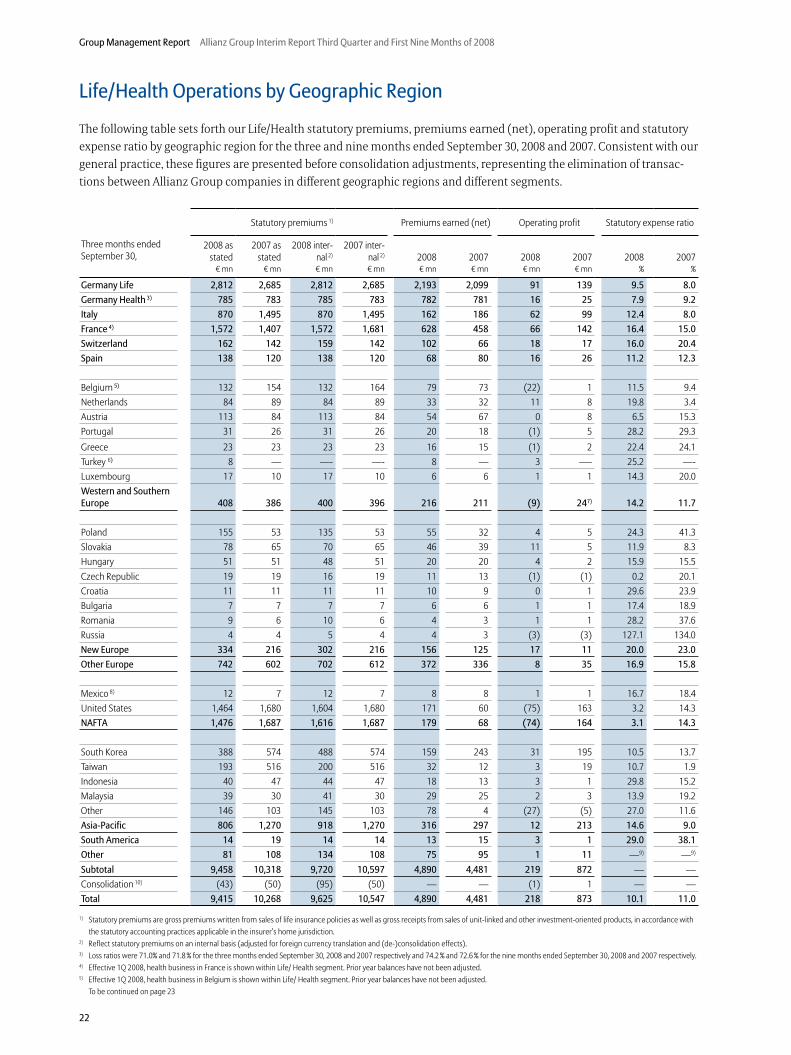
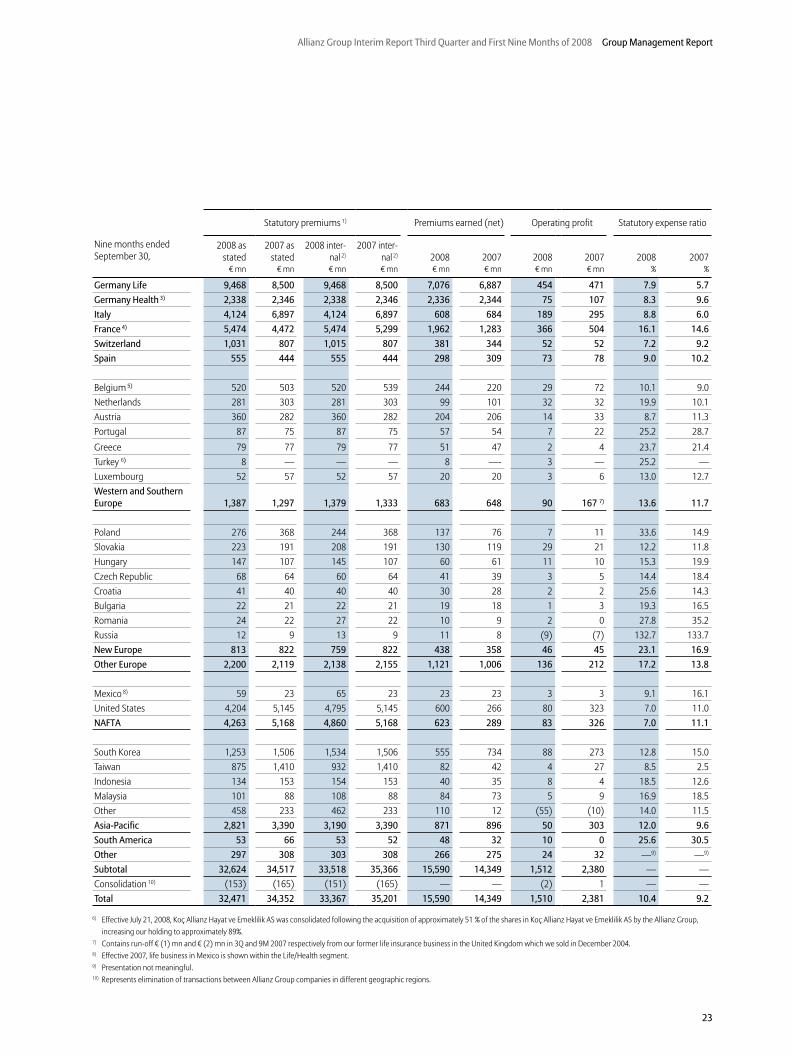
Life/Health Operations by Geographic Region
The following table sets forth our Life/Health statutory premiums, premiums earned (net), operating profit and statutory
expense ratio by geographic region for the three and nine months ended September 30, 2008 and 2007. Consistent with our
general practice, these figures are presented before consolidation adjustments, representing the elimination of transac-
tions between Allianz Group companies in different geographic regions and different segments.
Statutory premiums 1) Premiums earned (net) Operating profit Statutory expense ratio
Three months ended September 30,
2008 as stated
2007 as stated
2008 inter-nal 2)
2007 inter-nal 2) 2008 2007 2008 2007 2008 2007
� mn � mn � mn � mn � mn � mn � mn � mn % %
Germany Life 2,812 2,685 2,812 2,685 2,193 2,099 91 139 9.5 8.0
Germany Health 3) 785 783 785 783 782 781 16 25 7.9 9.2
Italy 870 1,495 870 1,495 162 186 62 99 12.4 8.0
France 4) 1,572 1,407 1,572 1,681 628 458 66 142 16.4 15.0
Switzerland 162 142 159 142 102 66 18 17 16.0 20.4
Spain 138 120 138 120 68 80 16 26 11.2 12.3
Belgium 5) 132 154 132 164 79 73 (22) 1 11.5 9.4Netherlands 84 89 84 89 33 32 11 8 19.8 3.4Austria 113 84 113 84 54 67 0 8 6.5 15.3Portugal 31 26 31 26 20 18 (1) 5 28.2 29.3
Greece 23 23 23 23 16 15 (1) 2 22.4 24.1Turkey 6) 8 — —- —- 8 — 3 —- 25.2 —-Luxembourg 17 10 17 10 6 6 1 1 14.3 20.0Western and Southern Europe 408 386 400 396 216 211 (9) 247) 14.2 11.7
Poland 155 53 135 53 55 32 4 5 24.3 41.3Slovakia 78 65 70 65 46 39 11 5 11.9 8.3Hungary 51 51 48 51 20 20 4 2 15.9 15.5Czech Republic 19 19 16 19 11 13 (1) (1) 0.2 20.1Croatia 11 11 11 11 10 9 0 1 29.6 23.9Bulgaria 7 7 7 7 6 6 1 1 17.4 18.9Romania 9 6 10 6 4 3 1 1 28.2 37.6Russia 4 4 5 4 4 3 (3) (3) 127.1 134.0New Europe 334 216 302 216 156 125 17 11 20.0 23.0
Other Europe 742 602 702 612 372 336 8 35 16.9 15.8
Mexico 8) 12 7 12 7 8 8 1 1 16.7 18.4United States 1,464 1,680 1,604 1,680 171 60 (75) 163 3.2 14.3NAFTA 1,476 1,687 1,616 1,687 179 68 (74) 164 3.1 14.3
South Korea 388 574 488 574 159 243 31 195 10.5 13.7Taiwan 193 516 200 516 32 12 3 19 10.7 1.9Indonesia 40 47 44 47 18 13 3 1 29.8 15.2Malaysia 39 30 41 30 29 25 2 3 13.9 19.2Other 146 103 145 103 78 4 (27) (5) 27.0 11.6Asia-Pacific 806 1,270 918 1,270 316 297 12 213 14.6 9.0
South America 14 19 14 14 13 15 3 1 29.0 38.1
Other 81 108 134 108 75 95 1 11 —9) —9)
Subtotal 9,458 10,318 9,720 10,597 4,890 4,481 219 872 — —Consolidation 10) (43) (50) (95) (50) — — (1) 1 — —Total 9,415 10,268 9,625 10,547 4,890 4,481 218 873 10.1 11.0
1) Statutory premiums are gross premiums written from sales of life insurance policies as well as gross receipts from sales of unit-linked and other investment-oriented products, in accordance with the statutory accounting practices applicable in the insurer’s home jurisdiction.
2) Reflect statutory premiums on an internal basis (adjusted for foreign currency translation and (de-)consolidation effects).3) Loss ratios were 71.0% and 71.8 % for the three months ended September 30, 2008 and 2007 respectively and 74.2 % and 72.6 % for the nine months ended September 30, 2008 and 2007 respectively.4) Effective 1Q 2008, health business in France is shown within Life/ Health segment. Prior year balances have not been adjusted.5) Effective 1Q 2008, health business in Belgium is shown within Life/ Health segment. Prior year balances have not been adjusted. To be continued on page 23
Allianz Group Interim Report Third Quarter and First Nine Months of 2008 Group Management Report
23
Statutory premiums 1) Premiums earned (net) Operating profit Statutory expense ratio
Nine months ended September 30,
2008 as stated
2007 as stated
2008 inter-nal 2)
2007 inter-nal 2) 2008 2007 2008 2007 2008 2007
� mn � mn � mn � mn � mn � mn � mn � mn % %
Germany Life 9,468 8,500 9,468 8,500 7,076 6,887 454 471 7.9 5.7
Germany Health 3) 2,338 2,346 2,338 2,346 2,336 2,344 75 107 8.3 9.6
Italy 4,124 6,897 4,124 6,897 608 684 189 295 8.8 6.0
France 4) 5,474 4,472 5,474 5,299 1,962 1,283 366 504 16.1 14.6
Switzerland 1,031 807 1,015 807 381 344 52 52 7.2 9.2
Spain 555 444 555 444 298 309 73 78 9.0 10.2
Belgium 5) 520 503 520 539 244 220 29 72 10.1 9.0Netherlands 281 303 281 303 99 101 32 32 19.9 10.1Austria 360 282 360 282 204 206 14 33 8.7 11.3Portugal 87 75 87 75 57 54 7 22 25.2 28.7
Greece 79 77 79 77 51 47 2 4 23.7 21.4Turkey 6) 8 — — — 8 —- 3 — 25.2 —Luxembourg 52 57 52 57 20 20 3 6 13.0 12.7Western and Southern Europe 1,387 1,297 1,379 1,333 683 648 90 167 7) 13.6 11.7
Poland 276 368 244 368 137 76 7 11 33.6 14.9Slovakia 223 191 208 191 130 119 29 21 12.2 11.8Hungary 147 107 145 107 60 61 11 10 15.3 19.9Czech Republic 68 64 60 64 41 39 3 5 14.4 18.4Croatia 41 40 40 40 30 28 2 2 25.6 14.3Bulgaria 22 21 22 21 19 18 1 3 19.3 16.5Romania 24 22 27 22 10 9 2 0 27.8 35.2Russia 12 9 13 9 11 8 (9) (7) 132.7 133.7New Europe 813 822 759 822 438 358 46 45 23.1 16.9
Other Europe 2,200 2,119 2,138 2,155 1,121 1,006 136 212 17.2 13.8
Mexico 8) 59 23 65 23 23 23 3 3 9.1 16.1United States 4,204 5,145 4,795 5,145 600 266 80 323 7.0 11.0NAFTA 4,263 5,168 4,860 5,168 623 289 83 326 7.0 11.1
South Korea 1,253 1,506 1,534 1,506 555 734 88 273 12.8 15.0Taiwan 875 1,410 932 1,410 82 42 4 27 8.5 2.5Indonesia 134 153 154 153 40 35 8 4 18.5 12.6Malaysia 101 88 108 88 84 73 5 9 16.9 18.5Other 458 233 462 233 110 12 (55) (10) 14.0 11.5Asia-Pacific 2,821 3,390 3,190 3,390 871 896 50 303 12.0 9.6
South America 53 66 53 52 48 32 10 0 25.6 30.5
Other 297 308 303 308 266 275 24 32 —9) —9)
Subtotal 32,624 34,517 33,518 35,366 15,590 14,349 1,512 2,380 — —Consolidation 10) (153) (165) (151) (165) — — (2) 1 — —Total 32,471 34,352 33,367 35,201 15,590 14,349 1,510 2,381 10.4 9.2
6) Effective July 21, 2008, Koç Allianz Hayat ve Emeklilik AS was consolidated following the acquisition of approximately 51 % of the shares in Koç Allianz Hayat ve Emeklilik AS by the Allianz Group, increasing our holding to approximately 89%.7) Contains run-off � (1) mn and � (2) mn in 3Q and 9M 2007 respectively from our former life insurance business in the United Kingdom which we sold in December 2004.8) Effective 2007, life business in Mexico is shown within the Life/Health segment.9) Presentation not meaningful. 10) Represents elimination of transactions between Allianz Group companies in different geographic regions.
24
Scope of Continuing Banking Opera-tions
On August 31, 2008, Allianz SE (“Allianz”) and Commerz-
bank AG (“Commerzbank”) agreed on the sale of signif-
icantly all of Dresdner Bank AG (“Dresdner Bank”) to
Commerzbank with the exception of Oldenburgische
Landesbank and approximately one million banking clients
from Dresdner Bank introduced through the tied agents
channel. Those entities will be presented in our Banking
segment together with existing banking operations. Follow-
ing the announcement of the sale, Dresdner Bank qualifies
as held-for-sale and discontinued operations and is now
presented as “Discontinued Operations of Dresdner Bank”
on pages 33 to 35. Therefore, all revenue and profit figures
presented for our continuing business do not include the
parts of Dresdner Bank sold to Commerzbank. The results
from these operations are presented in a separate net in-
come line “net income from discontinued operations, net of
income taxes and minority interests in earnings” starting in
the third quarter of 2008 (3Q 2008).
Earnings Summary
Operating revenues
2008 to 2007 third quarter comparison
Operating revenues in our Banking segment declined by
3.1 % to � 123 million, mainly resulting from lower net fee
income. Revenues in Oldenburgische Landesbank, made up
the largest proportion of the revenues, and remained stable.
Net interest income was slightly higher, up � 3 million to
� 74 million. In particular Oldenburgische Landesbank’s net
interest income was steady. Net fee and commission in-
come declined by 22.6 % to � 48 million, following the indus-
try-wide trend in lower fee income, especially with regard to
our banking activities in Italy.
Net dealing income, which comprises net trading income
and net income from financial assets and liabilities desig-
nated at fair value through income, was up � 7 million
resulting in a positive amount of � 1 million.
2008 to 2007 first nine months comparison
The Banking segment’s operating revenues were down 8.6 %
compared to the prior year period to � 416 million. Net
interest income improved slightly to � 240 million, up � 5
million. This was offset however by downward movements
in net dealing income of � 16 million, leaving a net dealing
loss of � 10 million, and in net fee and commission income
of � 28 million to � 186 million.
Banking Operations
– Due to the sale of Dresdner Bank the scope of our commentary on the banking segment has changed. It refers to the continuing banking operations of the Group.
– Oldenburgische Landesbank and banking customers introduced by Allianz tied agents are included.
– Continuing banking operations produced an operating loss of � 17 million and a net loss of � 62 million.
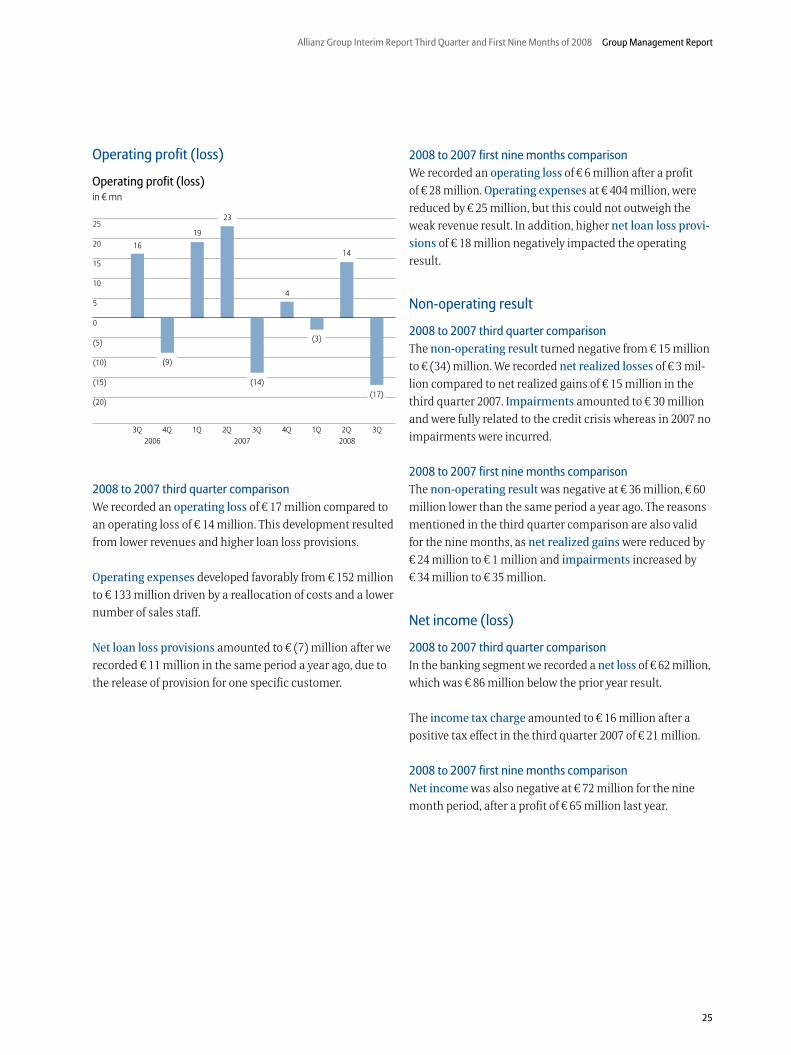
Allianz Group Interim Report Third Quarter and First Nine Months of 2008 Group Management Report
25
Operating profit (loss)
Operating profit (loss)in � mn
2008 to 2007 third quarter comparison
We recorded an operating loss of � 17 million compared to
an operating loss of � 14 million. This development resulted
from lower revenues and higher loan loss provisions.
Operating expenses developed favorably from � 152 million
to � 133 million driven by a reallocation of costs and a lower
number of sales staff.
Net loan loss provisions amounted to � (7) million after we
recorded � 11 million in the same period a year ago, due to
the release of provision for one specific customer.
2008 to 2007 first nine months comparison
We recorded an operating loss of � 6 million after a profit
of � 28 million. Operating expenses at � 404 million, were
reduced by � 25 million, but this could not outweigh the
weak revenue result. In addition, higher net loan loss provi-
sions of � 18 million negatively impacted the operating
result.
Non-operating result
2008 to 2007 third quarter comparison
The non-operating result turned negative from � 15 million
to � (34) million. We recorded net realized losses of � 3 mil-
lion compared to net realized gains of � 15 million in the
third quarter 2007. Impairments amounted to � 30 million
and were fully related to the credit crisis whereas in 2007 no
impairments were incurred.
2008 to 2007 first nine months comparison
The non-operating result was negative at � 36 million, � 60
million lower than the same period a year ago. The reasons
mentioned in the third quarter comparison are also valid
for the nine months, as net realized gains were reduced by
� 24 million to � 1 million and impairments increased by
� 34 million to � 35 million.
Net income (loss)
2008 to 2007 third quarter comparison
In the banking segment we recorded a net loss of � 62 million,
which was � 86 million below the prior year result.
The income tax charge amounted to � 16 million after a
positive tax effect in the third quarter 2007 of � 21 million.
2008 to 2007 first nine months comparison
Net income was also negative at � 72 million for the nine
month period, after a profit of � 65 million last year.
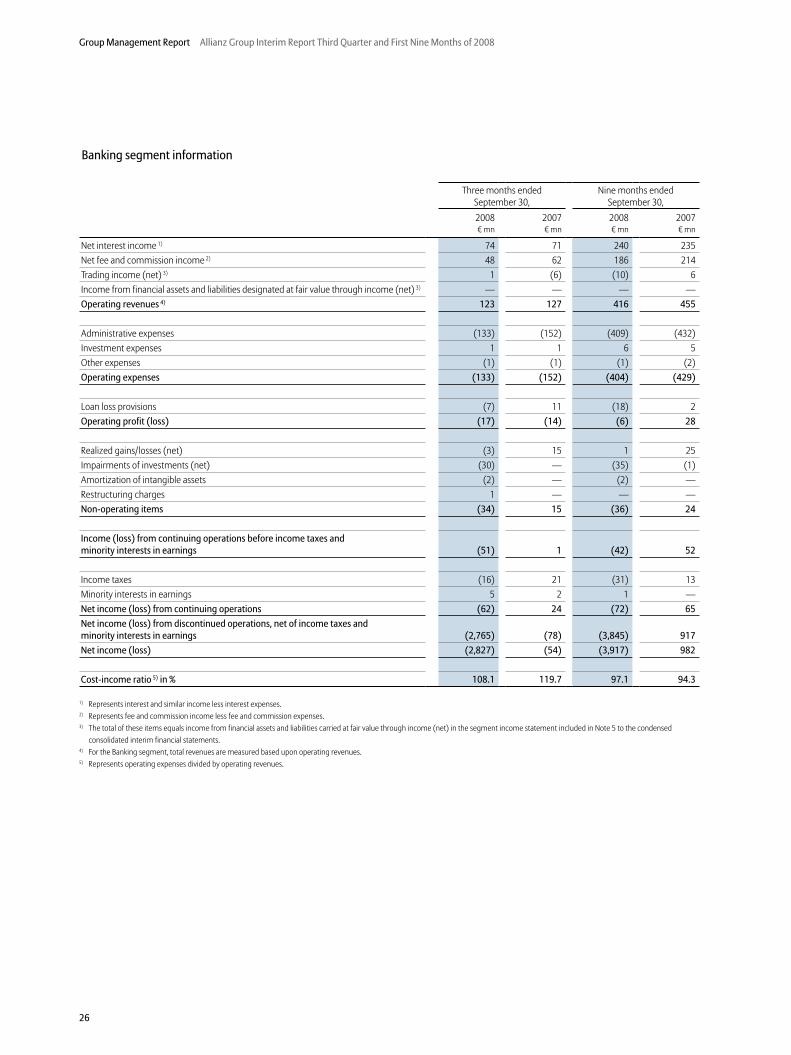
26
Group Management Report Allianz Group Interim Report Third Quarter and First Nine Months of 2008
Banking segment information
Three months ended September 30,
Nine months ended September 30,
2008 2007 2008 2007� mn � mn � mn � mn
Net interest income 1) 74 71 240 235Net fee and commission income 2) 48 62 186 214Trading income (net) 3) 1 (6) (10) 6Income from financial assets and liabilities designated at fair value through income (net) 3) — — — —Operating revenues 4) 123 127 416 455
Administrative expenses (133) (152) (409) (432)Investment expenses 1 1 6 5Other expenses (1) (1) (1) (2)Operating expenses (133) (152) (404) (429)
Loan loss provisions (7) 11 (18) 2Operating profit (loss) (17) (14) (6) 28
Realized gains/losses (net) (3) 15 1 25Impairments of investments (net) (30) — (35) (1)Amortization of intangible assets (2) — (2) —Restructuring charges 1 — — —Non-operating items (34) 15 (36) 24
Income (loss) from continuing operations before income taxes and minority interests in earnings (51) 1 (42) 52
Income taxes (16) 21 (31) 13Minority interests in earnings 5 2 1 —Net income (loss) from continuing operations (62) 24 (72) 65
Net income (loss) from discontinued operations, net of income taxes and minority interests in earnings (2,765) (78) (3,845) 917
Net income (loss) (2,827) (54) (3,917) 982
Cost-income ratio 5) in % 108.1 119.7 97.1 94.3
1) Represents interest and similar income less interest expenses.2) Represents fee and commission income less fee and commission expenses.3) The total of these items equals income from financial assets and liabilities carried at fair value through income (net) in the segment income statement included in Note 5 to the condensed
consolidated interim financial statements.4) For the Banking segment, total revenues are measured based upon operating revenues.5) Represents operating expenses divided by operating revenues.
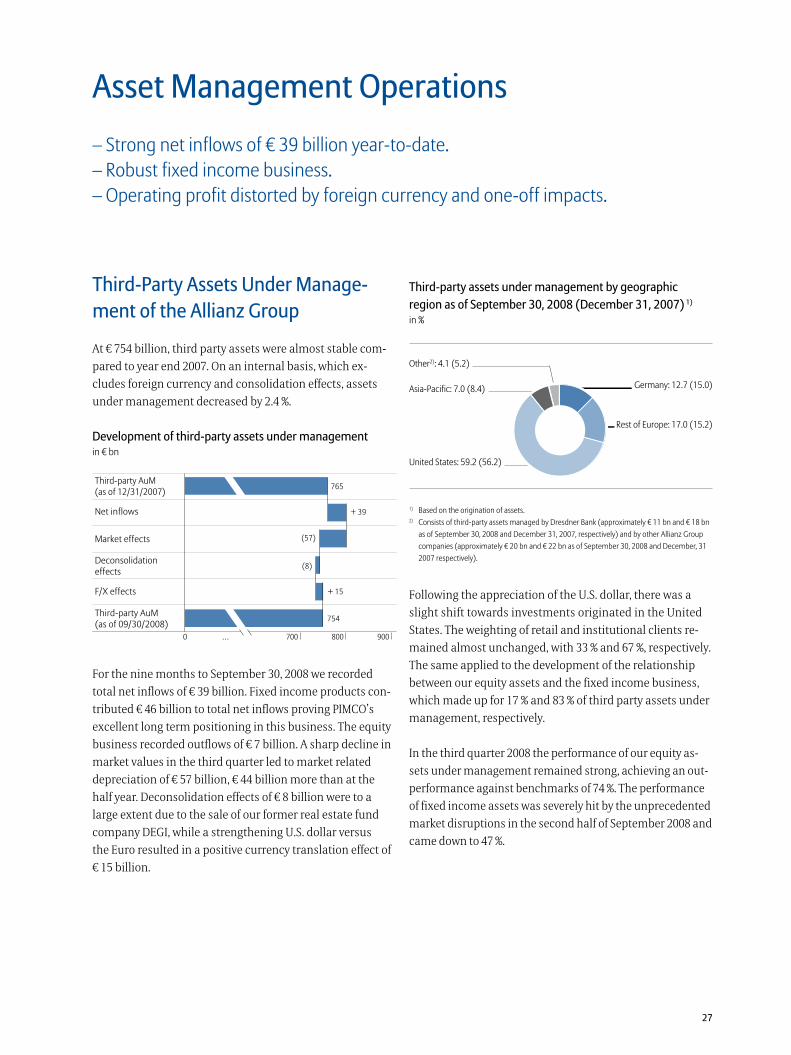
27
Third-Party Assets Under Manage-ment of the Allianz Group
At � 754 billion, third party assets were almost stable com-
pared to year end 2007. On an internal basis, which ex-
cludes foreign currency and consolidation effects, assets
under management decreased by 2.4 %.
Development of third-party assets under managementin � bn
For the nine months to September 30, 2008 we recorded
total net inflows of � 39 billion. Fixed income products con-
tributed � 46 billion to total net inflows proving PIMCO’s
excellent long term positioning in this business. The equity
business recorded outflows of � 7 billion. A sharp decline in
market values in the third quarter led to market related
depreciation of � 57 billion, � 44 billion more than at the
half year. Deconsolidation effects of � 8 billion were to a
large extent due to the sale of our former real estate fund
company DEGI, while a strengthening U.S. dollar versus
the Euro resulted in a positive currency translation effect of
� 15 billion.
Third-party assets under management by geographic
region as of September 30, 2008 (December 31, 2007) 1)
in %
1) Based on the origination of assets.2) Consists of third-party assets managed by Dresdner Bank (approximately � 11 bn and � 18 bn
as of September 30, 2008 and December 31, 2007, respectively) and by other Allianz Group companies (approximately � 20 bn and � 22 bn as of September 30, 2008 and December, 31 2007 respectively).
Following the appreciation of the U.S. dollar, there was a
slight shift towards investments originated in the United
States. The weighting of retail and institutional clients re-
mained almost unchanged, with 33 % and 67 %, respectively.
The same applied to the development of the relationship
between our equity assets and the fixed income business,
which made up for 17 % and 83 % of third party assets under
management, respectively.
In the third quarter 2008 the performance of our equity as-
sets under management remained strong, achieving an out-
performance against benchmarks of 74 %. The performance
of fixed income assets was severely hit by the unprecedented
market disruptions in the second half of September 2008 and
came down to 47 %.
Asset Management Operations
– Strong net inflows of � 39 billion year-to-date.– Robust fixed income business.– Operating profit distorted by foreign currency and one-off impacts.
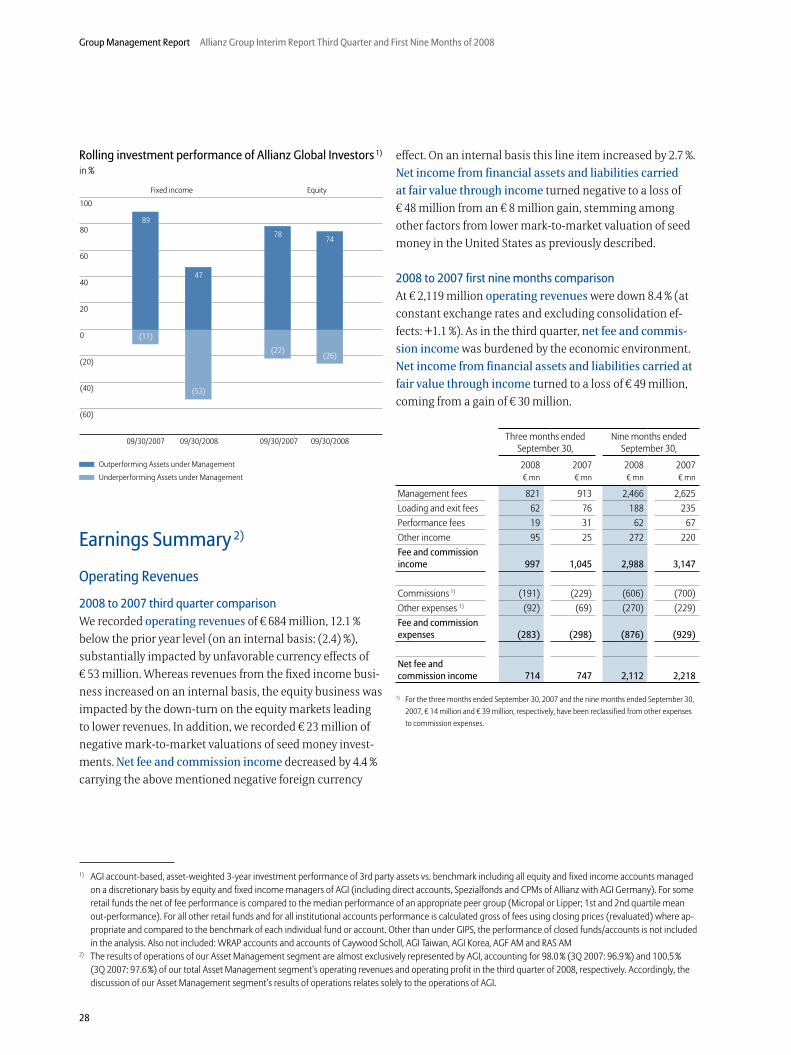
28
Group Management Report Allianz Group Interim Report Third Quarter and First Nine Months of 2008
Rolling investment performance of Allianz Global Investors 1)
in %
Earnings Summary 2)
Operating Revenues
2008 to 2007 third quarter comparison
We recorded operating revenues of � 684 million, 12.1 %
below the prior year level (on an internal basis: (2.4) %),
substantially impacted by unfavorable currency effects of
� 53 million. Whereas revenues from the fixed income busi-
ness increased on an internal basis, the equity business was
impacted by the down-turn on the equity markets leading
to lower revenues. In addition, we recorded � 23 million of
negative mark-to-market valuations of seed money invest-
ments. Net fee and commission income decreased by 4.4 %
carrying the above mentioned negative foreign currency
effect. On an internal basis this line item increased by 2.7 %.
Net income from financial assets and liabilities carried
at fair value through income turned negative to a loss of
� 48 million from an � 8 million gain, stemming among
other factors from lower mark-to-market valuation of seed
money in the United States as previously described.
2008 to 2007 first nine months comparison
At � 2,119 million operating revenues were down 8.4 % (at
constant exchange rates and excluding consolidation ef-
fects: +1.1 %). As in the third quarter, net fee and commis-
sion income was burdened by the economic environment.
Net income from financial assets and liabilities carried at
fair value through income turned to a loss of � 49 million,
coming from a gain of � 30 million.
Three months endedSeptember 30,
Nine months endedSeptember 30,
2008 2007 2008 2007� mn � mn � mn � mn
Management fees 821 913 2,466 2,625Loading and exit fees 62 76 188 235Performance fees 19 31 62 67Other income 95 25 272 220Fee and commission income 997 1,045 2,988 3,147
Commissions 1) (191) (229) (606) (700)Other expenses 1) (92) (69) (270) (229)Fee and commission expenses (283) (298) (876) (929)
Net fee and commission income 714 747 2,112 2,218
1) For the three months ended September 30, 2007 and the nine months ended September 30, 2007, � 14 million and � 39 million, respectively, have been reclassified from other expenses to commission expenses.
1) AGI account-based, asset-weighted 3-year investment performance of 3rd party assets vs. benchmark including all equity and fixed income accounts managed on a discretionary basis by equity and fixed income managers of AGI (including direct accounts, Spezialfonds and CPMs of Allianz with AGI Germany). For some retail funds the net of fee performance is compared to the median performance of an appropriate peer group (Micropal or Lipper; 1st and 2nd quartile mean out-performance). For all other retail funds and for all institutional accounts performance is calculated gross of fees using closing prices (revaluated) where ap-propriate and compared to the benchmark of each individual fund or account. Other than under GIPS, the performance of closed funds/accounts is not included in the analysis. Also not included: WRAP accounts and accounts of Caywood Scholl, AGI Taiwan, AGI Korea, AGF AM and RAS AM
2) The results of operations of our Asset Management segment are almost exclusively represented by AGI, accounting for 98.0 % (3Q 2007: 96.9 %) and 100.5 % (3Q 2007: 97.6 %) of our total Asset Management segment’s operating revenues and operating profit in the third quarter of 2008, respectively. Accordingly, the discussion of our Asset Management segment’s results of operations relates solely to the operations of AGI.
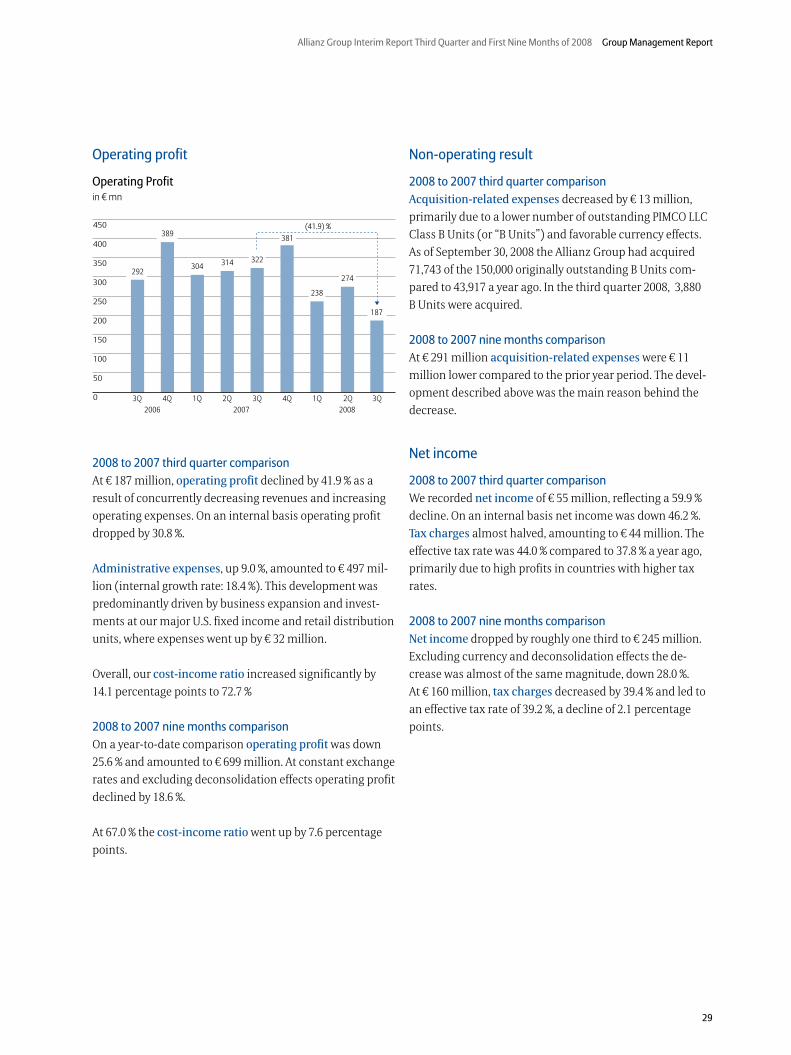
Allianz Group Interim Report Third Quarter and First Nine Months of 2008 Group Management Report
29
Operating profit
Operating Profit in � mn
2008 to 2007 third quarter comparison
At � 187 million, operating profit declined by 41.9 % as a
result of concurrently decreasing revenues and increasing
operating expenses. On an internal basis operating profit
dropped by 30.8 %.
Administrative expenses, up 9.0 %, amounted to � 497 mil-
lion (internal growth rate: 18.4 %). This development was
predominantly driven by business expansion and invest-
ments at our major U.S. fixed income and retail distribution
units, where expenses went up by � 32 million.
Overall, our cost-income ratio increased significantly by
14.1 percentage points to 72.7 %
2008 to 2007 nine months comparison
On a year-to-date comparison operating profit was down
25.6 % and amounted to � 699 million. At constant exchange
rates and excluding deconsolidation effects operating profit
declined by 18.6 %.
At 67.0 % the cost-income ratio went up by 7.6 percentage
points.
Non-operating result
2008 to 2007 third quarter comparison
Acquisition-related expenses decreased by � 13 million,
primarily due to a lower number of outstanding PIMCO LLC
Class B Units (or “B Units”) and favorable currency effects.
As of September 30, 2008 the Allianz Group had acquired
71,743 of the 150,000 originally outstanding B Units com-
pared to 43,917 a year ago. In the third quarter 2008, 3,880
B Units were acquired.
2008 to 2007 nine months comparison
At � 291 million acquisition-related expenses were � 11
million lower compared to the prior year period. The devel-
opment described above was the main reason behind the
decrease.
Net income
2008 to 2007 third quarter comparison
We recorded net income of � 55 million, reflecting a 59.9 %
decline. On an internal basis net income was down 46.2 %.
Tax charges almost halved, amounting to � 44 million. The
effective tax rate was 44.0 % compared to 37.8 % a year ago,
primarily due to high profits in countries with higher tax
rates.
2008 to 2007 nine months comparison
Net income dropped by roughly one third to � 245 million.
Excluding currency and deconsolidation effects the de-
crease was almost of the same magnitude, down 28.0 %.
At � 160 million, tax charges decreased by 39.4 % and led to
an effective tax rate of 39.2 %, a decline of 2.1 percentage
points.
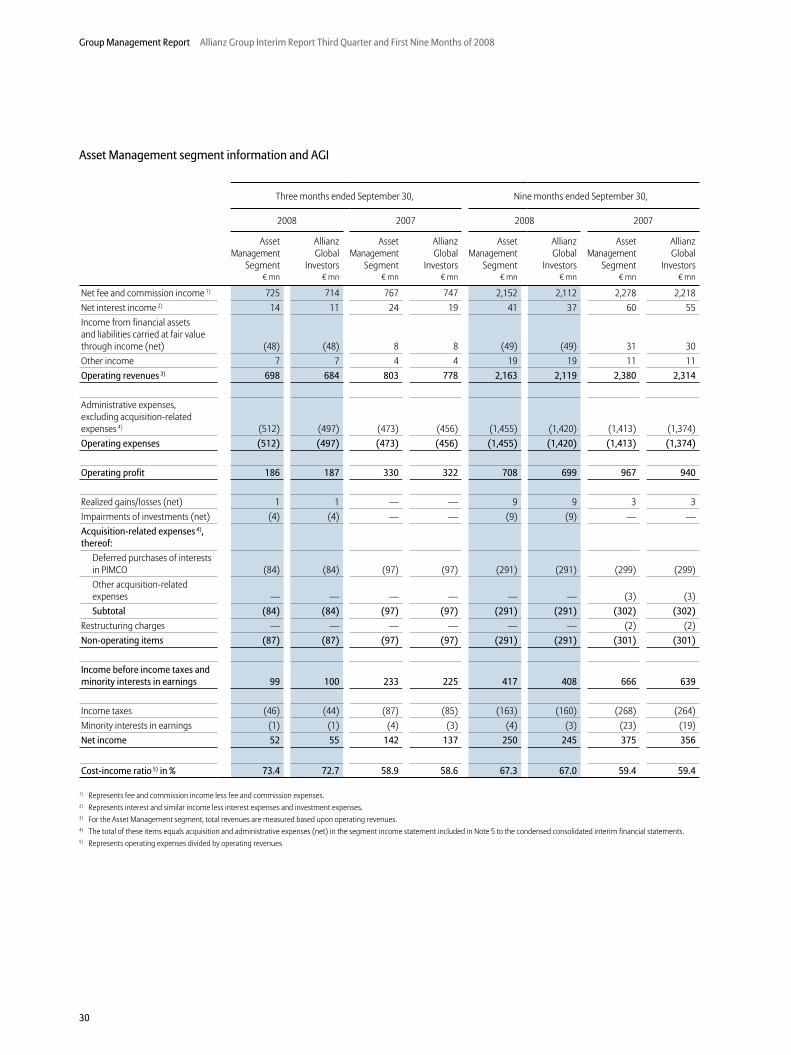
30
Group Management Report Allianz Group Interim Report Third Quarter and First Nine Months of 2008
Asset Management segment information and AGI
Three months ended September 30, Nine months ended September 30,
2008 2007 2008 2007
Asset Management
Segment
Allianz Global
Investors
Asset Management
Segment
Allianz Global
Investors
Asset Management
Segment
Allianz Global
Investors
Asset Management
Segment
Allianz Global
Investors� mn � mn � mn � mn � mn � mn � mn � mn
Net fee and commission income 1) 725 714 767 747 2,152 2,112 2,278 2,218Net interest income 2) 14 11 24 19 41 37 60 55Income from financial assets and liabilities carried at fair value through income (net) (48) (48) 8 8 (49) (49) 31 30Other income 7 7 4 4 19 19 11 11Operating revenues 3) 698 684 803 778 2,163 2,119 2,380 2,314
Administrative expenses, excluding acquisition-related expenses 4) (512) (497) (473) (456) (1,455) (1,420) (1,413) (1,374)Operating expenses (512) (497) (473) (456) (1,455) (1,420) (1,413) (1,374)
Operating profit 186 187 330 322 708 699 967 940
Realized gains/losses (net) 1 1 — — 9 9 3 3Impairments of investments (net) (4) (4) — — (9) (9) — —Acquisition-related expenses 4), thereof:
Deferred purchases of interests in PIMCO (84) (84) (97) (97) (291) (291) (299) (299)Other acquisition-related expenses — — — — — — (3) (3)Subtotal (84) (84) (97) (97) (291) (291) (302) (302)
Restructuring charges — — — — — — (2) (2)Non-operating items (87) (87) (97) (97) (291) (291) (301) (301)
Income before income taxes and minority interests in earnings 99 100 233 225 417 408 666 639
Income taxes (46) (44) (87) (85) (163) (160) (268) (264)Minority interests in earnings (1) (1) (4) (3) (4) (3) (23) (19)Net income 52 55 142 137 250 245 375 356
Cost-income ratio 5) in % 73.4 72.7 58.9 58.6 67.3 67.0 59.4 59.4
1) Represents fee and commission income less fee and commission expenses.2) Represents interest and similar income less interest expenses and investment expenses.3) For the Asset Management segment, total revenues are measured based upon operating revenues.4) The total of these items equals acquisition and administrative expenses (net) in the segment income statement included in Note 5 to the condensed consolidated interim financial statements.5) Represents operating expenses divided by operating revenues
31
Earnings Summary
The aggregate operating loss for the third quarter decreased
to � 54 million compared to � 155 million in 3Q 2007. This
development was attributable to a lower loss in the Holding
Function and a gain in the Private Equity business. For the
same reasons the operating loss of � 125 million for the first
nine months of the year was � 141 million lower than in the
first nine months of 2007.
At � 159 million, the net loss was � 296 million lower than in
the respective quarter 2007, primarily due to a swing in the
tax position. In the first nine months the net loss increased
to � 316 million in 2008 reflecting higher impairments and
lower realized gains in the Holding Function that could not
be compensated for by the positive development in the
Private Equity business.
Holding Function
Operating profit (loss)
At � 83 million the operating loss was 35.2 % lower in the
third quarter of 2008. This development benefited from
increased foreign currency gains (+ � 82 million). This de-
velopment was partly compensated for by lower interest
and similar income, due to lower dividends received.
In the first nine months of 2008 – except for interest and
similar income which increased – similar effects as in the
quarter led to an operating loss of � 251 million, � 55 million
lower than last year.
Non-operating result
The non-operating loss increased to � 269 million in the third
quarter. The main reason for this development were signifi-
cantly increased impairments due to the weak market con-
ditions.
For the nine month period non-operating items showed a
loss of � 652 million coming from a gain of � 298 million in
the prior year. The key drivers of this development were sig-
nificantly higher realized gains a year earlier which were
not repeated in the period under review, and increased im-
pairments.
Net income (loss)
In the third quarter, we recorded a net loss of � 198 million
coming from a net loss of � 431 million in the prior year.
Negative movements in non-operating items were partially
compensated by tax income (� 156 million).
In the first nine months of 2008 the above mentioned
effects led to a net loss of � 462 million after a net loss of
� 68 million in 2007. Income tax income amounted to
� 444 million.
Private Equity
Operating profit
Driven by lower administrative expenses as well as higher
fee income, the third quarter operating profit turned to a
gain of � 29 million after a loss of � 27 million in the previ-
ous year.
Accumulated for the first nine months, operating profit
increased by � 86 million to � 126 million. As in the third
quarter comparison the administrative expenses were
Corporate Activities
– Operating loss declined by � 101 million driven by foreign currency gains.– Result of corporate activities is largely affected by increased impairments.
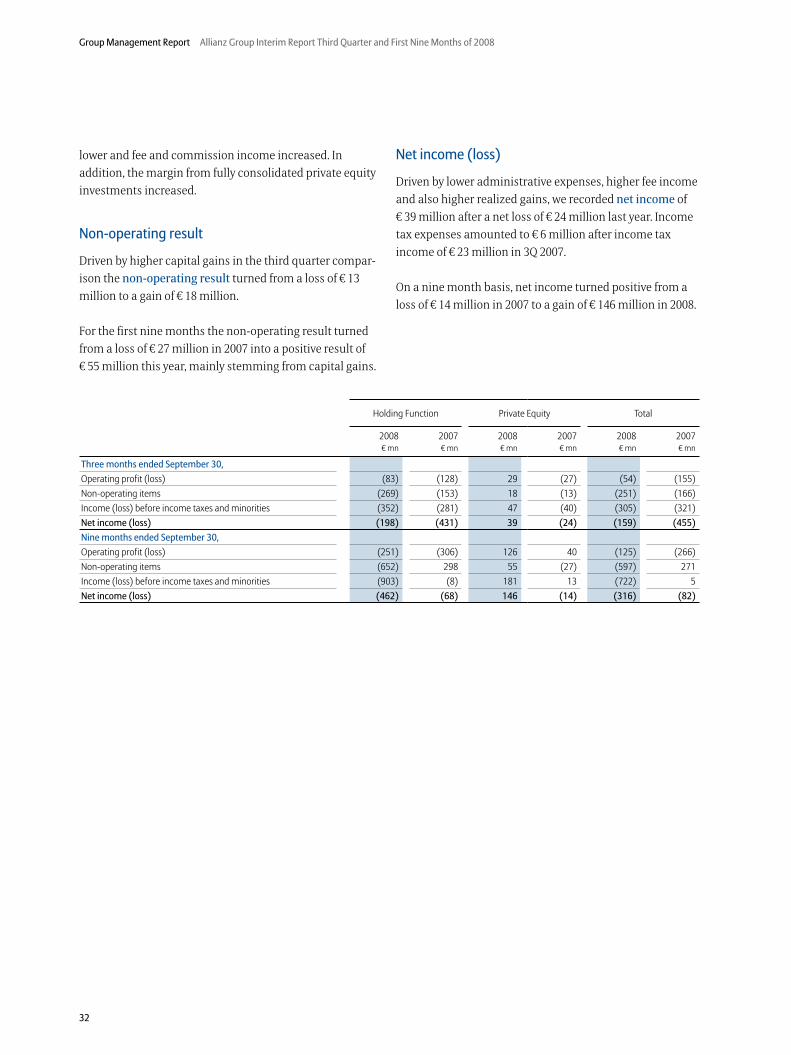
32
Group Management Report Allianz Group Interim Report Third Quarter and First Nine Months of 2008
lower and fee and commission income increased. In
addition, the margin from fully consolidated private equity
investments increased.
Non-operating result
Driven by higher capital gains in the third quarter compar-
ison the non-operating result turned from a loss of � 13
million to a gain of � 18 million.
For the first nine months the non-operating result turned
from a loss of � 27 million in 2007 into a positive result of
� 55 million this year, mainly stemming from capital gains.
Net income (loss)
Driven by lower administrative expenses, higher fee income
and also higher realized gains, we recorded net income of
� 39 million after a net loss of � 24 million last year. Income
tax expenses amounted to � 6 million after income tax
income of � 23 million in 3Q 2007.
On a nine month basis, net income turned positive from a
loss of � 14 million in 2007 to a gain of � 146 million in 2008.
Holding Function Private Equity Total
2008 2007 2008 2007 2008 2007� mn � mn � mn � mn � mn � mn
Three months ended September 30,
Operating profit (loss) (83) (128) 29 (27) (54) (155)Non-operating items (269) (153) 18 (13) (251) (166)Income (loss) before income taxes and minorities (352) (281) 47 (40) (305) (321)Net income (loss) (198) (431) 39 (24) (159) (455)
Nine months ended September 30,
Operating profit (loss) (251) (306) 126 40 (125) (266)Non-operating items (652) 298 55 (27) (597) 271Income (loss) before income taxes and minorities (903) (8) 181 13 (722) 5Net income (loss) (462) (68) 146 (14) (316) (82)
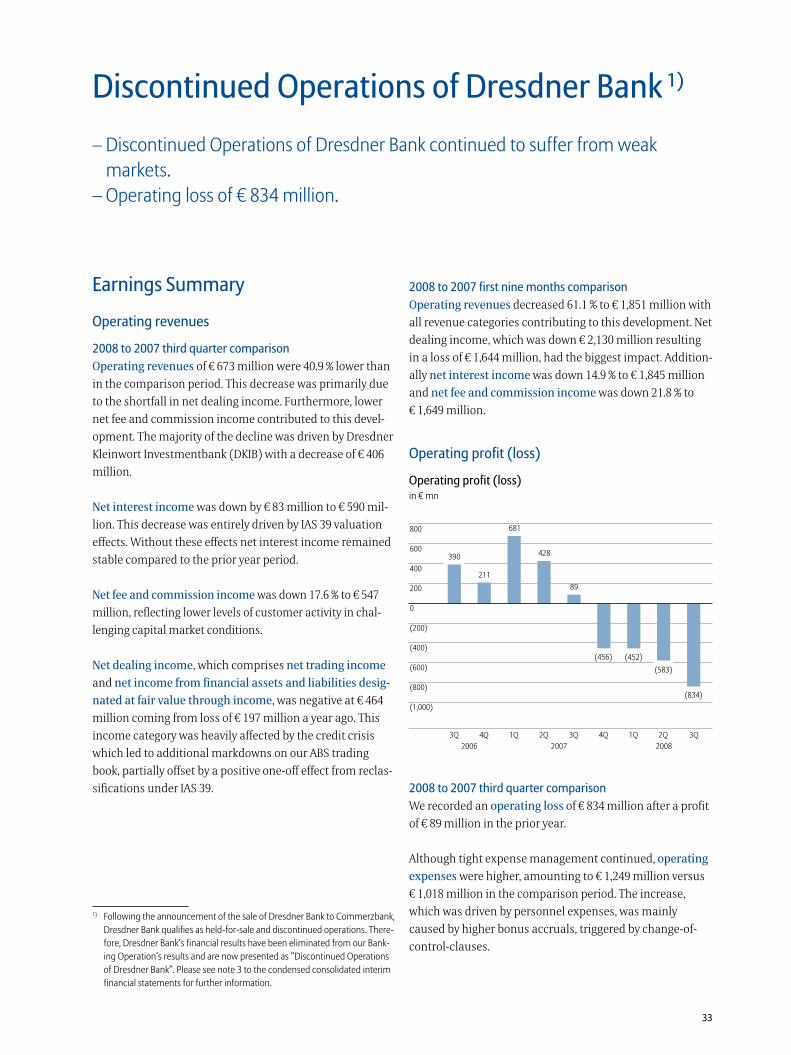
33
Earnings Summary
Operating revenues
2008 to 2007 third quarter comparison
Operating revenues of � 673 million were 40.9 % lower than
in the comparison period. This decrease was primarily due
to the shortfall in net dealing income. Furthermore, lower
net fee and commission income contributed to this devel-
opment. The majority of the decline was driven by Dresdner
Kleinwort Investmentbank (DKIB) with a decrease of � 406
million.
Net interest income was down by � 83 million to � 590 mil-
lion. This decrease was entirely driven by IAS 39 valuation
effects. Without these effects net interest income remained
stable compared to the prior year period.
Net fee and commission income was down 17.6 % to � 547
million, reflecting lower levels of customer activity in chal-
lenging capital market conditions.
Net dealing income, which comprises net trading income
and net income from financial assets and liabilities desig-
nated at fair value through income, was negative at � 464
million coming from loss of � 197 million a year ago. This
income category was heavily affected by the credit crisis
which led to additional markdowns on our ABS trading
book, partially offset by a positive one-off effect from reclas-
sifications under IAS 39.
1) Following the announcement of the sale of Dresdner Bank to Commerzbank, Dresdner Bank qualifies as held-for-sale and discontinued operations. There-fore, Dresdner Bank’s financial results have been eliminated from our Bank-ing Operation’s results and are now presented as “Discontinued Operations of Dresdner Bank”. Please see note 3 to the condensed consolidated interim financial statements for further information.
2008 to 2007 first nine months comparison
Operating revenues decreased 61.1 % to � 1,851 million with
all revenue categories contributing to this development. Net
dealing income, which was down � 2,130 million resulting
in a loss of � 1,644 million, had the biggest impact. Addition-
ally net interest income was down 14.9 % to � 1,845 million
and net fee and commission income was down 21.8 % to
� 1,649 million.
Operating profit (loss)
Operating profit (loss)in � mn
2008 to 2007 third quarter comparison
We recorded an operating loss of � 834 million after a profit
of � 89 million in the prior year.
Although tight expense management continued, operating
expenses were higher, amounting to � 1,249 million versus
� 1,018 million in the comparison period. The increase,
which was driven by personnel expenses, was mainly
caused by higher bonus accruals, triggered by change-of-
control-clauses.
Discontinued Operations of Dresdner Bank 1)
– Discontinued Operations of Dresdner Bank continued to suffer from weak markets.
– Operating loss of � 834 million.
34
Group Management Report Allianz Group Interim Report Third Quarter and First Nine Months of 2008
Net loan loss provisions increased from � 32 million to
� 258 million due to some large individual cases in connec-
tion with the financial crisis.
2008 to 2007 first nine months comparison
For the nine months we recorded an operating loss of
� 1,869 million after a profit of � 1,198 million. Operating
expenses were slightly lower by 2.6 % at � 3,393 million. Net
loan loss provisions increased from � 83 million to � 327
million mostly from the additions in the third quarter, as
already discribed.
Non-operating result
2008 to 2007 third quarter comparison
The non-operating result amounted to a loss of � 249 mil-
lion compared to a profit of � 48 million in the previous
year. Net realized gains were lower at � 16 million coming
from � 65 million a year ago. The significantly higher level of
impairments of � 231 million compared to � 13 million in
the third quarter 2007 was the key driver of the overall de-
cline in non-operating result.
2008 to 2007 first nine months comparison
The non-operating result turned negative from a � 192
million gain to a loss of � 132 million mainly due to the
impairment development in the third quarter.
Net income (loss) from discontinued operations
2008 to 2007 third quarter comparison
Income tax charges of � 255 million were significantly high-
er than in the comparison period. This was mainly driven by
the write-down on deferred tax assets on tax losses carried
forward in the U.S.A. and further taxable income in other
jurisdictions. The result from operating activities of dis-
continued operations was negative, amounting to � 1,356
million (third quarter 2007: � (78) million). Together with
the impairment loss recognized on remeasurement of
assets of disposal group to fair value less costs to sell at
� 1,409 million we recorded a net loss from discontinued
operations of � 2,765 million, which was � 2,687 million
higher than in the prior year period.
2008 to 2007 first nine months comparison
Despite the negative pre-tax income, we recorded an in-
come tax charge of � 393 million (9M 2007: � 414 million)
due to positive income in other jurisdictions. The non-
recognition of deferred tax assets for current year tax losses
and the write-down on deferred tax assets for tax losses
carried forward in the USA led to an effective tax rate of
(19.6) % (9M 2007: 29.8 %). We recorded a result from oper-
ating activities of discontinued operations of � (2,436)
million (9M 2007: positive at � 917 million). Together with
the impairment loss recognized on remeasurement of
assets of disposal group to fair value less costs to sell at
� 1,409 million this led to a net loss from discontinued
operations of � 3,845 million.
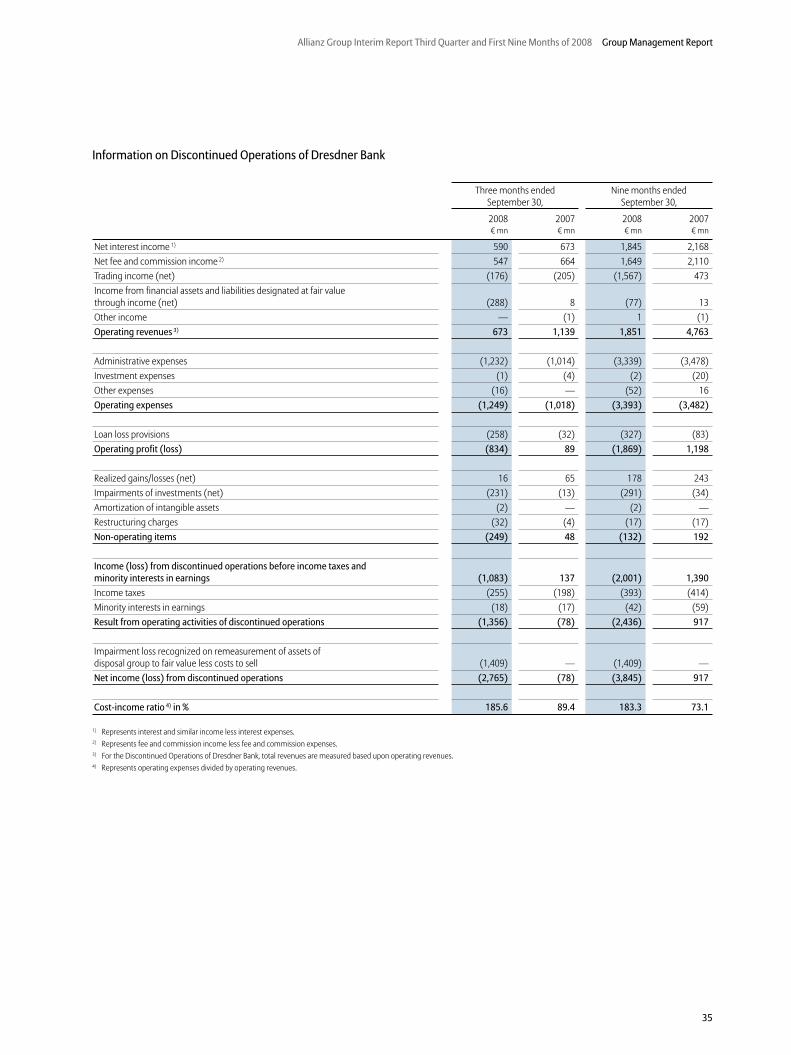
Allianz Group Interim Report Third Quarter and First Nine Months of 2008 Group Management Report
35
Information on Discontinued Operations of Dresdner Bank
Three months ended September 30,
Nine months ended September 30,
2008 2007 2008 2007� mn � mn � mn � mn
Net interest income 1) 590 673 1,845 2,168Net fee and commission income 2) 547 664 1,649 2,110Trading income (net) (176) (205) (1,567) 473Income from financial assets and liabilities designated at fair value through income (net) (288) 8 (77) 13Other income — (1) 1 (1)Operating revenues 3) 673 1,139 1,851 4,763
Administrative expenses (1,232) (1,014) (3,339) (3,478)Investment expenses (1) (4) (2) (20)Other expenses (16) — (52) 16Operating expenses (1,249) (1,018) (3,393) (3,482)
Loan loss provisions (258) (32) (327) (83)Operating profit (loss) (834) 89 (1,869) 1,198
Realized gains/losses (net) 16 65 178 243Impairments of investments (net) (231) (13) (291) (34)Amortization of intangible assets (2) — (2) —Restructuring charges (32) (4) (17) (17)Non-operating items (249) 48 (132) 192
Income (loss) from discontinued operations before income taxes and minority interests in earnings (1,083) 137 (2,001) 1,390
Income taxes (255) (198) (393) (414)Minority interests in earnings (18) (17) (42) (59)Result from operating activities of discontinued operations (1,356) (78) (2,436) 917
Impairment loss recognized on remeasurement of assets of disposal group to fair value less costs to sell (1,409) — (1,409) —Net income (loss) from discontinued operations (2,765) (78) (3,845) 917
Cost-income ratio 4) in % 185.6 89.4 183.3 73.1
1) Represents interest and similar income less interest expenses.2) Represents fee and commission income less fee and commission expenses.3) For the Discontinued Operations of Dresdner Bank, total revenues are measured based upon operating revenues.4) Represents operating expenses divided by operating revenues.
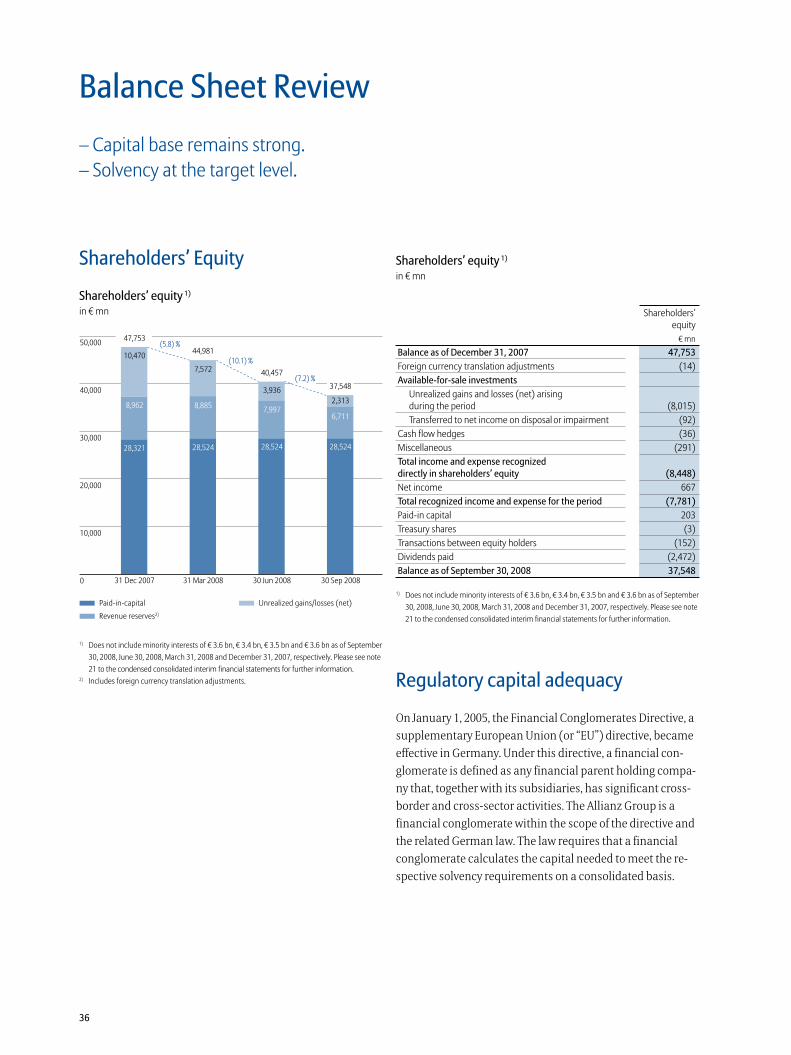
36
Shareholders’ Equity
Shareholders’ equity 1)
in � mn
1) Does not include minority interests of � 3.6 bn, � 3.4 bn, � 3.5 bn and � 3.6 bn as of September 30, 2008, June 30, 2008, March 31, 2008 and December 31, 2007, respectively. Please see note 21 to the condensed consolidated interim financial statements for further information.
2) Includes foreign currency translation adjustments.
Shareholders’ equity 1)
in � mn
Shareholders’ equity
� mn
Balance as of December 31, 2007 47,753
Foreign currency translation adjustments (14)Available-for-sale investments
Unrealized gains and losses (net) arising during the period (8,015)Transferred to net income on disposal or impairment (92)
Cash flow hedges (36)Miscellaneous (291)Total income and expense recognized directly in shareholders’ equity (8,448)
Net income 667Total recognized income and expense for the period (7,781)
Paid-in capital 203Treasury shares (3)Transactions between equity holders (152)Dividends paid (2,472)Balance as of September 30, 2008 37,548
1) Does not include minority interests of � 3.6 bn, � 3.4 bn, � 3.5 bn and � 3.6 bn as of September 30, 2008, June 30, 2008, March 31, 2008 and December 31, 2007, respectively. Please see note 21 to the condensed consolidated interim financial statements for further information.
Regulatory capital adequacy
On January 1, 2005, the Financial Conglomerates Directive, a
supplementary European Union (or “EU”) directive, became
effective in Germany. Under this directive, a financial con-
glomerate is defined as any financial parent holding compa-
ny that, together with its subsidiaries, has significant cross-
border and cross-sector activities. The Allianz Group is a
financial conglomerate within the scope of the directive and
the related German law. The law requires that a financial
conglomerate calculates the capital needed to meet the re-
spective solvency requirements on a consolidated basis.
Balance Sheet Review
– Capital base remains strong.– Solvency at the target level.
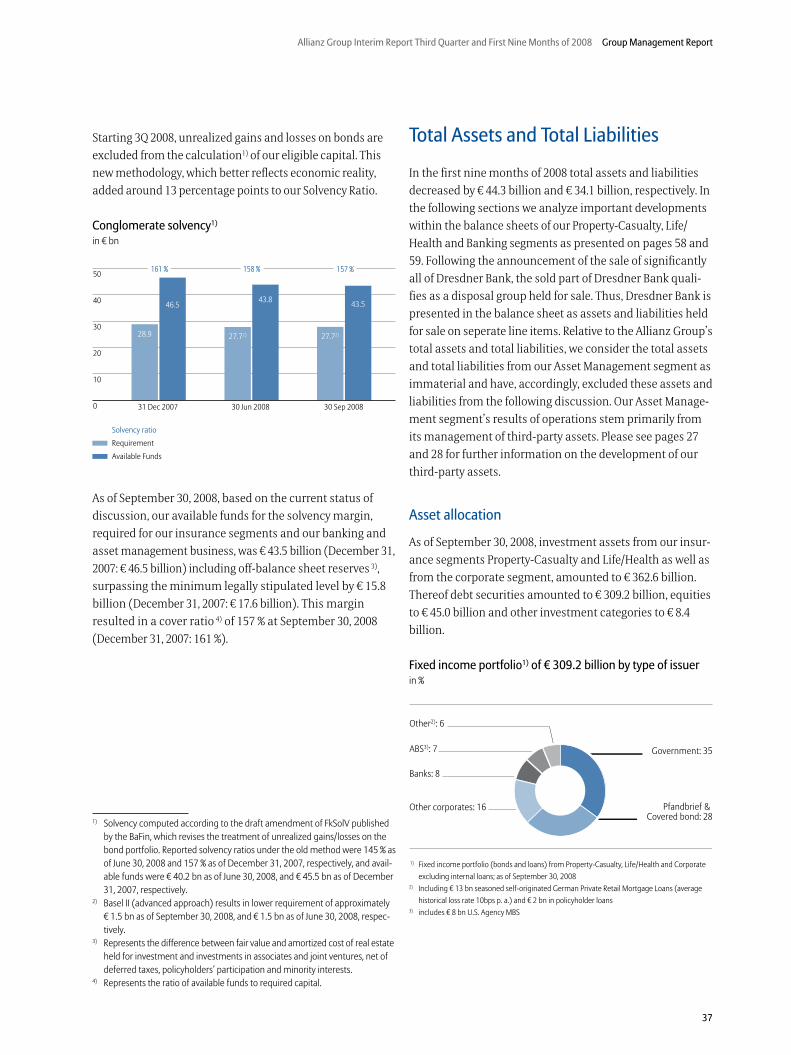
Allianz Group Interim Report Third Quarter and First Nine Months of 2008 Group Management Report
37
Starting 3Q 2008, unrealized gains and losses on bonds are
excluded from the calculation1) of our eligible capital. This
new methodology, which better reflects economic reality,
added around 13 percentage points to our Solvency Ratio.
Conglomerate solvency1) 2)
in � bn
As of September 30, 2008, based on the current status of
discussion, our available funds for the solvency margin,
required for our insurance segments and our banking and
asset management business, was � 43.5 billion (December 31,
2007: � 46.5 billion) including off-balance sheet reserves 3),
surpassing the minimum legally stipulated level by � 15.8
billion (December 31, 2007: � 17.6 billion). This margin
resulted in a cover ratio 4) of 157 % at September 30, 2008
(December 31, 2007: 161 %).
1) Solvency computed according to the draft amendment of FkSolV published by the BaFin, which revises the treatment of unrealized gains/losses on the bond portfolio. Reported solvency ratios under the old method were 145 % as of June 30, 2008 and 157 % as of December 31, 2007, respectively, and avail-able funds were � 40.2 bn as of June 30, 2008, and � 45.5 bn as of December 31, 2007, respectively.
2) Basel II (advanced approach) results in lower requirement of approximately � 1.5 bn as of September 30, 2008, and � 1.5 bn as of June 30, 2008, respec-tively.
3) Represents the difference between fair value and amortized cost of real estate held for investment and investments in associates and joint ventures, net of deferred taxes, policyholders’ participation and minority interests.
4) Represents the ratio of available funds to required capital.
Total Assets and Total Liabilities
In the first nine months of 2008 total assets and liabilities
decreased by � 44.3 billion and � 34.1 billion, respectively. In
the following sections we analyze important developments
within the balance sheets of our Property-Casualty, Life/
Health and Banking segments as presented on pages 58 and
59. Following the announcement of the sale of significantly
all of Dresdner Bank, the sold part of Dresdner Bank quali-
fies as a disposal group held for sale. Thus, Dresdner Bank is
presented in the balance sheet as assets and liabilities held
for sale on seperate line items. Relative to the Allianz Group’s
total assets and total liabilities, we consider the total assets
and total liabilities from our Asset Management segment as
immaterial and have, accordingly, excluded these assets and
liabilities from the following discussion. Our Asset Manage-
ment segment’s results of operations stem primarily from
its management of third-party assets. Please see pages 27
and 28 for further information on the development of our
third-party assets.
Asset allocation
As of September 30, 2008, investment assets from our insur-
ance segments Property-Casualty and Life/Health as well as
from the corporate segment, amounted to � 362.6 billion.
Thereof debt securities amounted to � 309.2 billion, equities
to � 45.0 billion and other investment categories to � 8.4
billion.
Fixed income portfolio1) of � 309.2 billion by type of issuerin %
1) Fixed income portfolio (bonds and loans) from Property-Casualty, Life/Health and Corporate excluding internal loans; as of September 30, 2008
2) Including � 13 bn seasoned self-originated German Private Retail Mortgage Loans (average historical loss rate 10bps p. a.) and � 2 bn in policyholder loans
3) includes � 8 bn U.S. Agency MBS
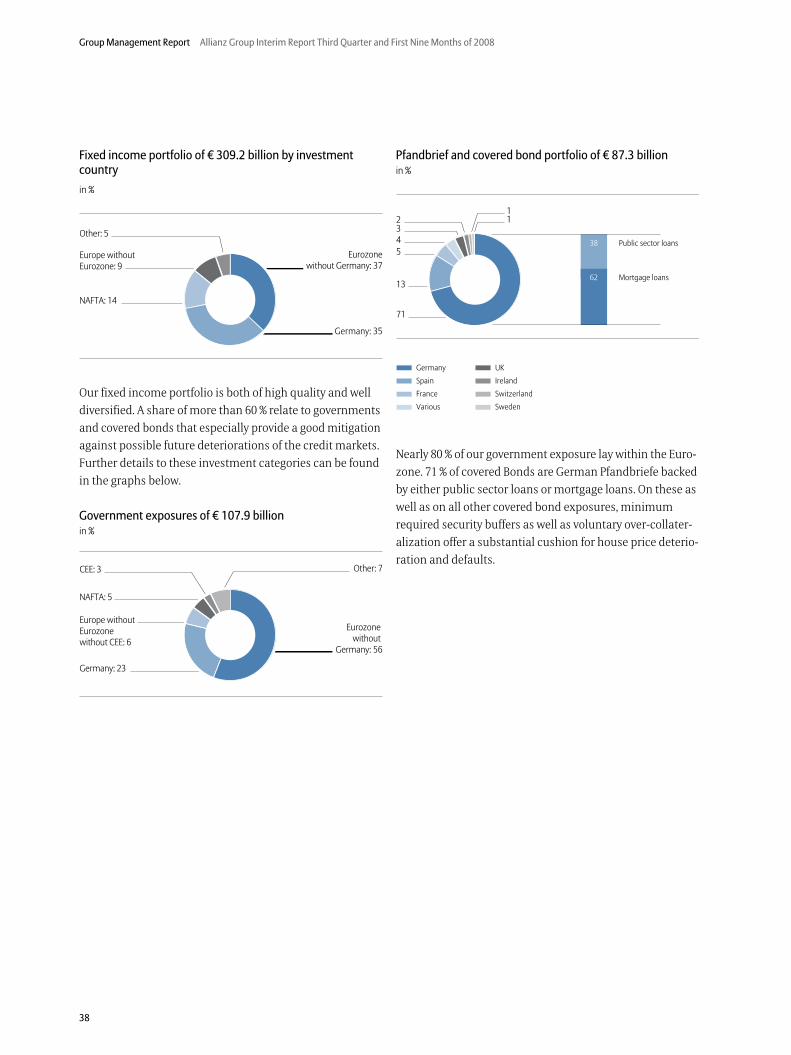
38
Group Management Report Allianz Group Interim Report Third Quarter and First Nine Months of 2008
Fixed income portfolio of � 309.2 billion by investment country
in %
Our fixed income portfolio is both of high quality and well
diversified. A share of more than 60 % relate to governments
and covered bonds that especially provide a good mitigation
against possible future deteriorations of the credit markets.
Further details to these investment categories can be found
in the graphs below.
Government exposures of � 107.9 billionin %
Pfandbrief and covered bond portfolio of � 87.3 billionin %
Nearly 80 % of our government exposure lay within the Euro-
zone. 71 % of covered Bonds are German Pfandbriefe backed
by either public sector loans or mortgage loans. On these as
well as on all other covered bond exposures, minimum
required security buffers as well as voluntary over-collater-
alization offer a substantial cushion for house price deterio-
ration and defaults.

Allianz Group Interim Report Third Quarter and First Nine Months of 2008 Group Management Report
39
Assets and Liabilities of the Property-Casualty segment
Property-Casualty assets
Property-Casualty asset basefair values 1) in � bn
1) Loans and advances to banks and customers, held-to-maturity investments, and real estate held for investment are stated at amortized cost. Investments in associates and joint ventures are stated at either amortized cost or equity, depending upon, among other factors, our own-ership percentage.
Composition of the Property-Casualty asset basefair values 1) in � bn
30 Sep 2008 31 Dec 2007� bn � bn
Investments 2)
Equities 9.4 16.5Debt securities 50.9 50.3Other 7.0 6.9Subtotal 67.3 73.7
Loans and advances 17.3 20.7
Financial assets and liabilities carried at fair value through income
Equity 0.3 0.4Debt 1.6 2.7Other 0.1 0.1Subtotal 2.0 3.2
Property-Casualty asset base 86.6 97.6
1) Loans and advances to banks and customers, held-to-maturity investments, and real estate held for investment are stated at amortized cost. Investments in associates and joint ventures are stated at either amortized cost or equity, depending upon, among other factors, our ownership percentage.
2) Does not include affiliates of � 9.9 bn, � 9.8 bn, � 9.8 bn and � 10.0 bn as of September 30, 2008, June 30, 2008, March 31, 2008 and December 31, 2008, respectively.
Of our Property-Casualty asset base, ABS made up � 4.8 bil -
lion as of September 30, 2008, which is around 5.6 %. CDOs
accounted for � 0.1 billion of this amount. Unrealized losses
on CDOs of � 3 million were recorded in our equity. Sub-
prime exposures within CDOs were negligible.
Property-Casualty liabilities
In the third quarter, the segment’s reserves for loss and loss
adjustment expenses increased by 3.5 % to � 56.7 billion
(9M 2008: (0.4) %). Main reasons for this development were
positive currency translation effects and the first consolida-
tion of our entity in Turkey. Main contributors for the nine
month development were the reclassification of AGF’s health
insurance business from the Property-Casualty segment to
the Life/Health segment, the first-time consolidation of our
entity in Turkey, and foreign currency trans lation effects.
Assets and Liabilities of the Life/Health segment
Life/Health assets
Life/Health asset basefair values 1) in � bn
1) Loans and advances to banks and customers, held-to-maturity investments, and real estate held for investment are stated at amortized cost. Investments in associates and joint ventures are stated at either amortized cost or equity, depending upon, among other factors, our own-ership percentage.
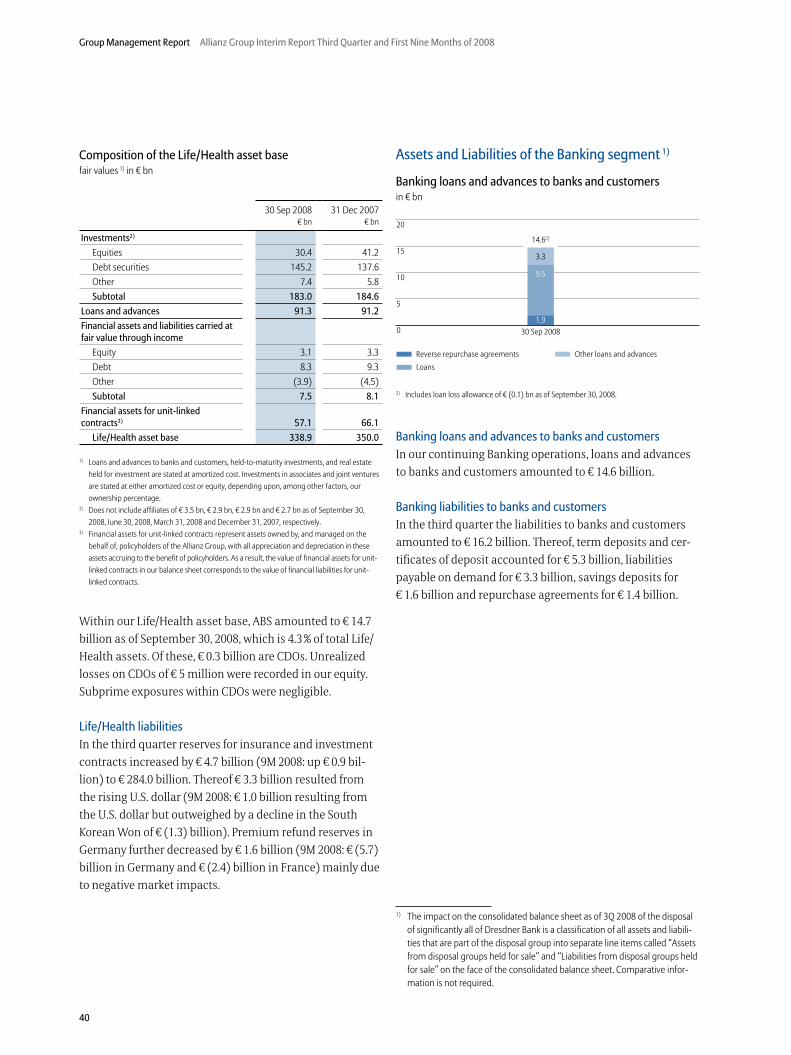
40
Group Management Report Allianz Group Interim Report Third Quarter and First Nine Months of 2008
Composition of the Life/Health asset basefair values 1) in � bn
30 Sep 2008 31 Dec 2007� bn � bn
Investments2)
Equities 30.4 41.2Debt securities 145.2 137.6Other 7.4 5.8Subtotal 183.0 184.6
Loans and advances 91.3 91.2
Financial assets and liabilities carried at fair value through income
Equity 3.1 3.3Debt 8.3 9.3Other (3.9) (4.5)Subtotal 7.5 8.1
Financial assets for unit-linked contracts3) 57.1 66.1
Life/Health asset base 338.9 350.0
1) Loans and advances to banks and customers, held-to-maturity investments, and real estate held for investment are stated at amortized cost. Investments in associates and joint ventures are stated at either amortized cost or equity, depending upon, among other factors, our ownership percentage.
2) Does not include affiliates of � 3.5 bn, � 2.9 bn, � 2.9 bn and � 2.7 bn as of September 30, 2008, June 30, 2008, March 31, 2008 and December 31, 2007, respectively.
3) Financial assets for unit-linked contracts represent assets owned by, and managed on the behalf of, policyholders of the Allianz Group, with all appreciation and depreciation in these assets accruing to the benefit of policyholders. As a result, the value of financial assets for unit-linked contracts in our balance sheet corresponds to the value of financial liabilities for unit-linked contracts.
Within our Life/Health asset base, ABS amounted to � 14.7
billion as of September 30, 2008, which is 4.3 % of total Life/
Health assets. Of these, � 0.3 billion are CDOs. Unrealized
losses on CDOs of � 5 million were recorded in our equity.
Subprime exposures within CDOs were negligible.
Life/Health liabilities
In the third quarter reserves for insurance and investment
contracts increased by � 4.7 billion (9M 2008: up � 0.9 bil-
lion) to � 284.0 billion. Thereof � 3.3 billion resulted from
the rising U.S. dollar (9M 2008: � 1.0 billion resulting from
the U.S. dollar but outweighed by a decline in the South
Korean Won of � (1.3) billion). Premium refund reserves in
Germany further decreased by � 1.6 billion (9M 2008: � (5.7)
billion in Germany and � (2.4) billion in France) mainly due
to negative market impacts.
Assets and Liabilities of the Banking segment 1)
Banking loans and advances to banks and customers in � bn
2) Includes loan loss allowance of � (0.1) bn as of September 30, 2008.
Banking loans and advances to banks and customers
In our continuing Banking operations, loans and advances
to banks and customers amounted to � 14.6 billion.
Banking liabilities to banks and customers
In the third quarter the liabilities to banks and customers
amounted to � 16.2 billion. Thereof, term deposits and cer-
tificates of deposit accounted for � 5.3 bil lion, liabilities
payable on demand for � 3.3 billion, savings deposits for
� 1.6 billion and repurchase agreements for � 1.4 billion.
1) The impact on the consolidated balance sheet as of 3Q 2008 of the disposal of significantly all of Dresdner Bank is a classification of all assets and liabili-ties that are part of the disposal group into separate line items called “Assets from disposal groups held for sale” and “Liabilities from disposal groups held for sale” on the face of the consolidated balance sheet. Comparative infor-mation is not required.
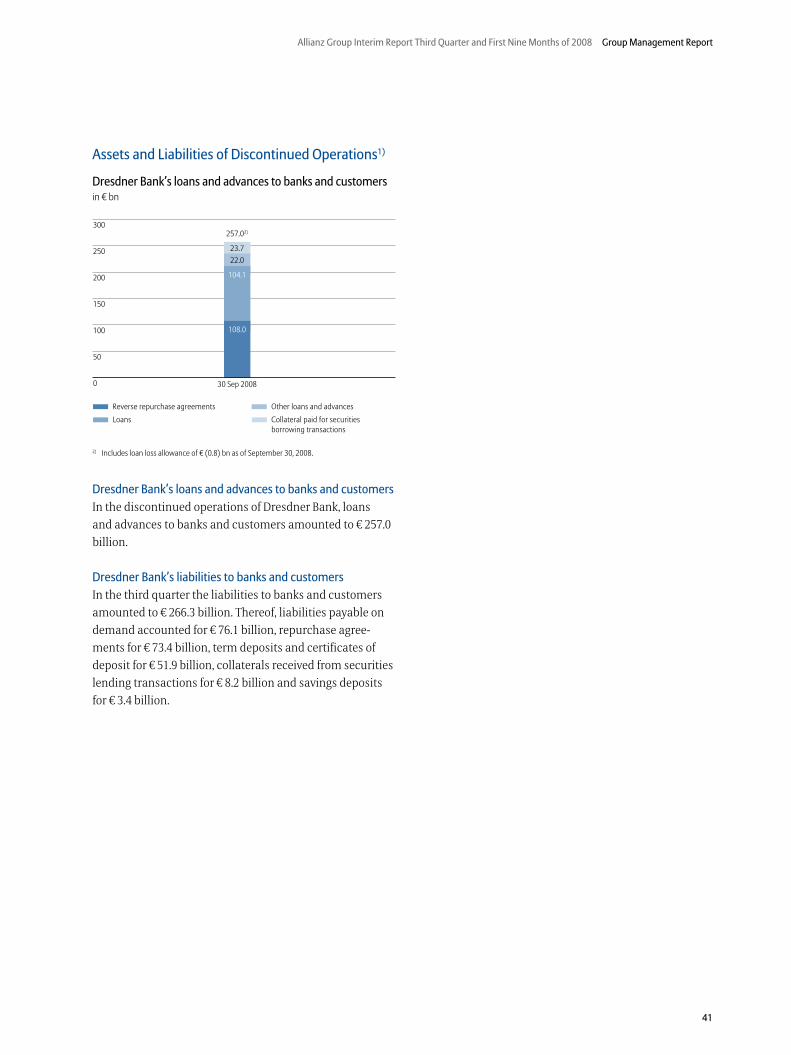
Allianz Group Interim Report Third Quarter and First Nine Months of 2008 Group Management Report
41
Assets and Liabilities of Discontinued Operations1)
Dresdner Bank’s loans and advances to banks and customers in � bn
2) Includes loan loss allowance of � (0.8) bn as of September 30, 2008.
Dresdner Bank’s loans and advances to banks and customers
In the discontinued operations of Dresdner Bank, loans
and advances to banks and customers amounted to � 257.0
billion.
Dresdner Bank’s liabilities to banks and customers
In the third quarter the liabilities to banks and customers
amounted to � 266.3 billion. Thereof, liabilities payable on
demand accounted for � 76.1 billion, repurchase agree-
ments for � 73.4 billion, term deposits and certificates of
deposit for � 51.9 bil lion, collaterals received from securities
lending transactions for � 8.2 billion and savings deposits
for � 3.4 billion.

42
Reconciliation of Consolidated Oper-ating Profit and Income Before In-come Taxes and Minority Interests in Earnings
The previous analysis is based on our consolidated financial
statements and should be read in conjunction with them.
The Allianz Group uses operating profit to evaluate the
performance of its business segments and the Group as a
whole. The Allianz Group considers the presentation of
operating profit to be useful and meaningful to investors
because it enhances the understanding of the Allianz
Group’s underlying operating performance and the compa-
rability of its operating performance over time. Operating
profit highlights the portion of income before income taxes
and minority interests in earnings attributable to the on-
going core operations of the Allianz Group. To better under-
stand the on-going operations of the business, we exclude
the effects of acquisition-related expenses and the amorti-
zation of intangible assets, as these relate to business com-
binations; and we exclude interest expense from external
debt and non-operating income from financial assets and
liabilities carried at fair value through income (net) as these
relate to our capital structure.
We believe that trends in the underlying profitability of our
business can be more clearly identified without the fluctu-
ating effects of the realized capital gains and losses or im-
pairments of investment securities, as these are largely
dependent on market cycles or issuer-specific events over
which we have little or no control, and can and do vary,
sometimes materially, across periods. Furthermore, the
timing of sales that would result in such gains or losses is
largely at our discretion.
Similarly, we exclude restructuring charges because the
timing of the restructuring charges are largely within our
control, and accordingly their exclusion provides additional
insight into the operating trends of the underlying business.
This differentiation is not made if the profit sources are
shared with the policyholder.
Operating profit should be viewed as complementary to,
and not a substitute for income before income taxes and
minority interests in earnings or net income as determined
in accordance with IFRS.
Other Information
Reconciliation of operating profit on a consolidated basis to the Allianz Group’s income before income taxes and minority
interests in earnings
Three months ended September 30,
Nine months endedSeptember 30,
2008 2007 2008 2007� mn � mn � mn � mn
Operating profit 1,556 2,563 6,477 7,715
Non-operating realized gains/losses (net) and impairments of investments (net) (404) 310 157 2,129Non-operating income from financial assets and liabilities carried at fair value through income (net) 72 48 127 45Interest expenses from external debt (227) (271) (712) (771)Non-operating restructuring charges (77) 27 (79) –Acquisition-related expenses (78) (72) (264) (329)Amortization of intangible assets (6) (4) (14) (11)Reclassification of tax benefits (9) (1) (32) (45)Income before income taxes and minority interests in earnings 827 2,600 5,660 8,733
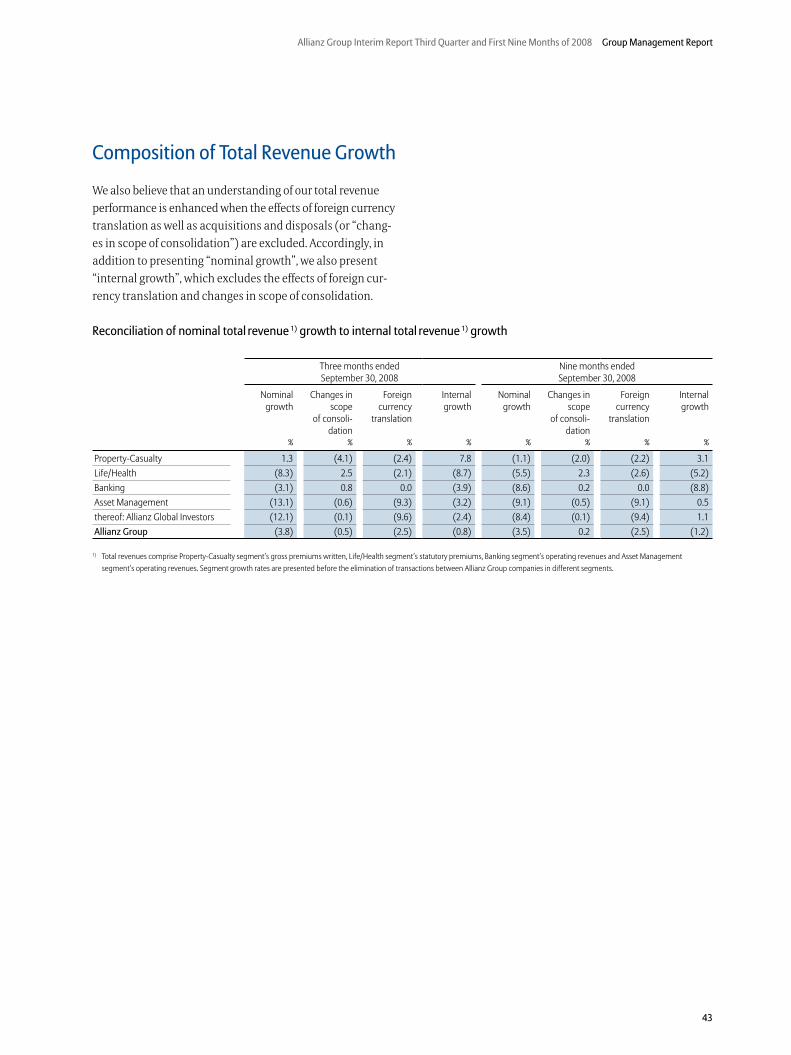
Allianz Group Interim Report Third Quarter and First Nine Months of 2008 Group Management Report
43
Composition of Total Revenue Growth
We also believe that an understanding of our total revenue
performance is enhanced when the effects of foreign currency
translation as well as acquisitions and disposals (or “chang-
es in scope of consolidation”) are excluded. Accordingly, in
addition to presenting “nominal growth”, we also present
“internal growth”, which excludes the effects of foreign cur-
rency translation and changes in scope of consolidation.
Reconciliation of nominal total revenue 1) growth to internal total revenue 1) growth
Three months ended September 30, 2008
Nine months endedSeptember 30, 2008
Nominal growth
Changes in scope
of consoli-dation
Foreign currency
translation
Internal growth
Nominal growth
Changes in scope
of consoli-dation
Foreign currency
translation
Internal growth
% % % % % % % %
Property-Casualty 1.3 (4.1) (2.4) 7.8 (1.1) (2.0) (2.2) 3.1Life/Health (8.3) 2.5 (2.1) (8.7) (5.5) 2.3 (2.6) (5.2)Banking (3.1) 0.8 0.0 (3.9) (8.6) 0.2 0.0 (8.8)Asset Management (13.1) (0.6) (9.3) (3.2) (9.1) (0.5) (9.1) 0.5thereof: Allianz Global Investors (12.1) (0.1) (9.6) (2.4) (8.4) (0.1) (9.4) 1.1Allianz Group (3.8) (0.5) (2.5) (0.8) (3.5) 0.2 (2.5) (1.2)
1) Total revenues comprise Property-Casualty segment’s gross premiums written, Life/Health segment’s statutory premiums, Banking segment’s operating revenues and Asset Management segment’s operating revenues. Segment growth rates are presented before the elimination of transactions between Allianz Group companies in different segments.

44
Group Management Report Allianz Group Interim Report Third Quarter and First Nine Months of 2008
[THIS PAGE INTENTIONALLY LEFT BLANK]
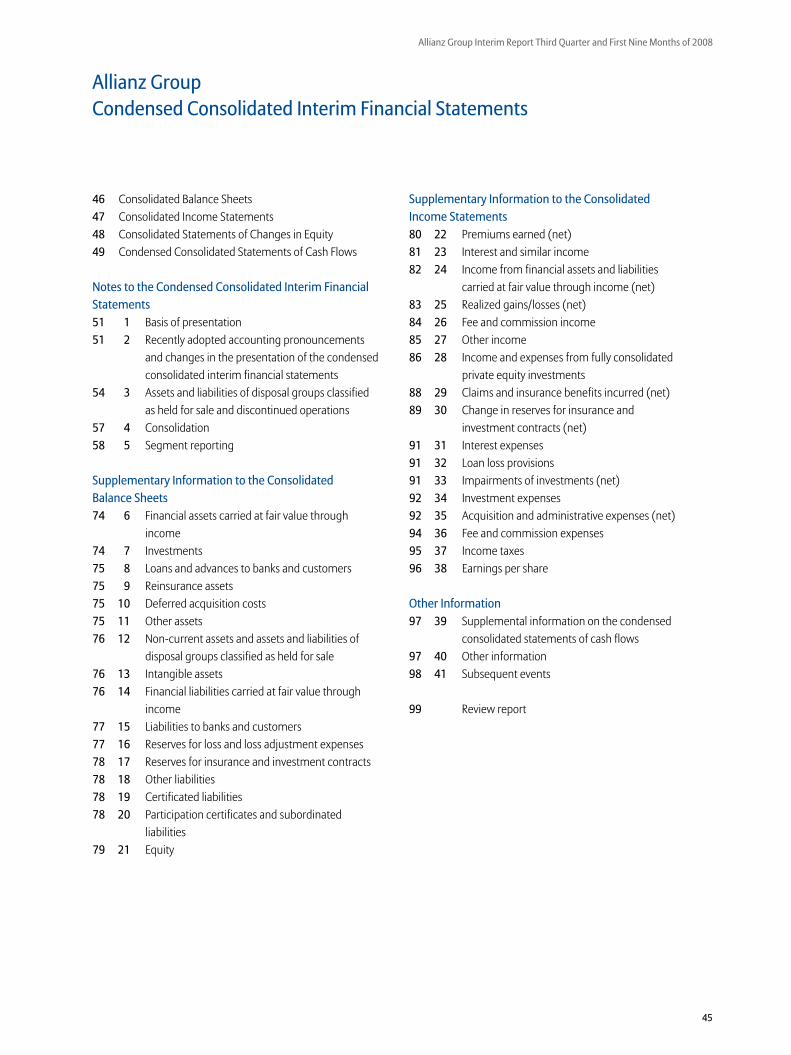
45
Allianz Group Interim Report Third Quarter and First Nine Months of 2008
Supplementary Information to the Consolidated
Income Statements
80 22 Premiums earned (net)81 23 Interest and similar income82 24 Income from financial assets and liabilities
carried at fair value through income (net)83 25 Realized gains/losses (net)84 26 Fee and commission income85 27 Other income86 28 Income and expenses from fully consolidated
private equity investments88 29 Claims and insurance benefits incurred (net)89 30 Change in reserves for insurance and
investment contracts (net)91 31 Interest expenses91 32 Loan loss provisions91 33 Impairments of investments (net)92 34 Investment expenses92 35 Acquisition and administrative expenses (net)94 36 Fee and commission expenses95 37 Income taxes96 38 Earnings per share
Other Information
97 39 Supplemental information on the condensed consolidated statements of cash flows
97 40 Other information98 41 Subsequent events
99 Review report
Allianz Group Condensed Consolidated Interim Financial Statements
46 Consolidated Balance Sheets47 Consolidated Income Statements48 Consolidated Statements of Changes in Equity49 Condensed Consolidated Statements of Cash Flows
Notes to the Condensed Consolidated Interim Financial
Statements
51 1 Basis of presentation51 2 Recently adopted accounting pronouncements
and changes in the presentation of the condensed consolidated interim financial statements
54 3 Assets and liabilities of disposal groups classified as held for sale and discontinued operations
57 4 Consolidation58 5 Segment reporting
Supplementary Information to the Consolidated
Balance Sheets
74 6 Financial assets carried at fair value through income
74 7 Investments75 8 Loans and advances to banks and customers75 9 Reinsurance assets75 10 Deferred acquisition costs75 11 Other assets76 12 Non-current assets and assets and liabilities of
disposal groups classified as held for sale 76 13 Intangible assets76 14 Financial liabilities carried at fair value through
income77 15 Liabilities to banks and customers77 16 Reserves for loss and loss adjustment expenses78 17 Reserves for insurance and investment contracts78 18 Other liabilities78 19 Certificated liabilities78 20 Participation certificates and subordinated
liabilities79 21 Equity
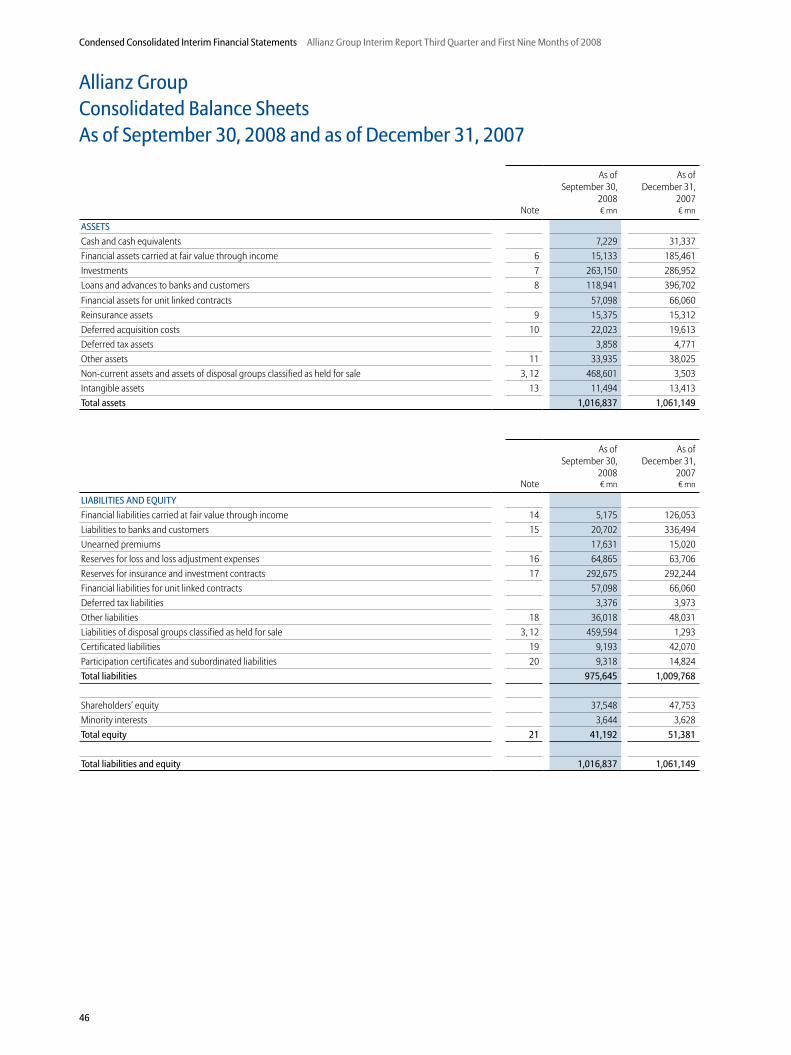
46
Condensed Consolidated Interim Financial Statements Allianz Group Interim Report Third Quarter and First Nine Months of 2008
Allianz Group Consolidated Balance SheetsAs of September 30, 2008 and as of December 31, 2007
Note
As ofSeptember 30,
2008
As ofDecember 31,
2007� mn � mn
ASSETS
Cash and cash equivalents 7,229 31,337Financial assets carried at fair value through income 6 15,133 185,461Investments 7 263,150 286,952Loans and advances to banks and customers 8 118,941 396,702Financial assets for unit linked contracts 57,098 66,060Reinsurance assets 9 15,375 15,312Deferred acquisition costs 10 22,023 19,613Deferred tax assets 3,858 4,771Other assets 11 33,935 38,025Non-current assets and assets of disposal groups classified as held for sale 3, 12 468,601 3,503Intangible assets 13 11,494 13,413Total assets 1,016,837 1,061,149
Note
As ofSeptember 30,
2008
As of December 31,
2007� mn � mn
LIABILITIES AND EQUITY
Financial liabilities carried at fair value through income 14 5,175 126,053Liabilities to banks and customers 15 20,702 336,494Unearned premiums 17,631 15,020Reserves for loss and loss adjustment expenses 16 64,865 63,706Reserves for insurance and investment contracts 17 292,675 292,244Financial liabilities for unit linked contracts 57,098 66,060Deferred tax liabilities 3,376 3,973Other liabilities 18 36,018 48,031Liabilities of disposal groups classified as held for sale 3, 12 459,594 1,293Certificated liabilities 19 9,193 42,070Participation certificates and subordinated liabilities 20 9,318 14,824Total liabilities 975,645 1,009,768
Shareholders’ equity 37,548 47,753Minority interests 3,644 3,628Total equity 21 41,192 51,381
Total liabilities and equity 1,016,837 1,061,149
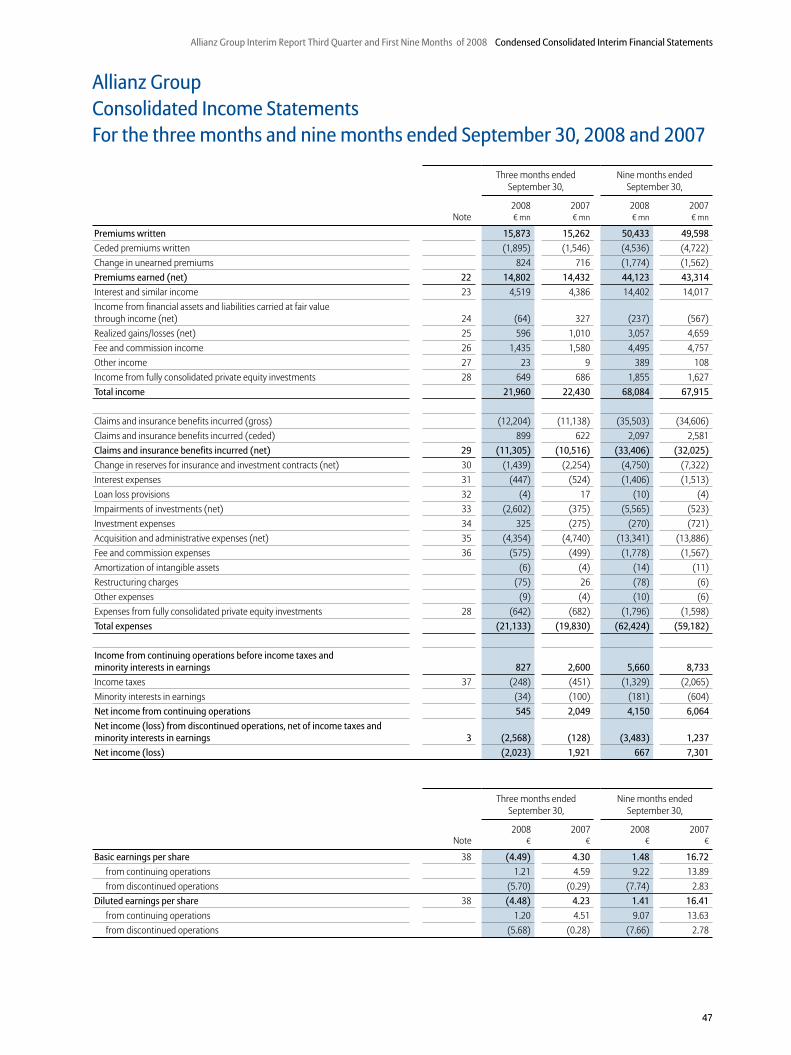
47
Allianz Group Interim Report Third Quarter and First Nine Months of 2008 Condensed Consolidated Interim Financial Statements
Allianz Group Consolidated Income StatementsFor the three months and nine months ended September 30, 2008 and 2007
Three months ended September 30,
Nine months ended September 30,
Note2008 2007 2008 2007� mn � mn � mn � mn
Premiums written 15,873 15,262 50,433 49,598
Ceded premiums written (1,895) (1,546) (4,536) (4,722)Change in unearned premiums 824 716 (1,774) (1,562)Premiums earned (net) 22 14,802 14,432 44,123 43,314
Interest and similar income 23 4,519 4,386 14,402 14,017Income from financial assets and liabilities carried at fair value through income (net) 24 (64) 327 (237) (567)Realized gains/losses (net) 25 596 1,010 3,057 4,659Fee and commission income 26 1,435 1,580 4,495 4,757Other income 27 23 9 389 108Income from fully consolidated private equity investments 28 649 686 1,855 1,627Total income 21,960 22,430 68,084 67,915
Claims and insurance benefits incurred (gross) (12,204) (11,138) (35,503) (34,606)Claims and insurance benefits incurred (ceded) 899 622 2,097 2,581Claims and insurance benefits incurred (net) 29 (11,305) (10,516) (33,406) (32,025)
Change in reserves for insurance and investment contracts (net) 30 (1,439) (2,254) (4,750) (7,322)Interest expenses 31 (447) (524) (1,406) (1,513)Loan loss provisions 32 (4) 17 (10) (4)Impairments of investments (net) 33 (2,602) (375) (5,565) (523)Investment expenses 34 325 (275) (270) (721)Acquisition and administrative expenses (net) 35 (4,354) (4,740) (13,341) (13,886)Fee and commission expenses 36 (575) (499) (1,778) (1,567)Amortization of intangible assets (6) (4) (14) (11)Restructuring charges (75) 26 (78) (6)Other expenses (9) (4) (10) (6)Expenses from fully consolidated private equity investments 28 (642) (682) (1,796) (1,598)Total expenses (21,133) (19,830) (62,424) (59,182)
Income from continuing operations before income taxes and minority interests in earnings 827 2,600 5,660 8,733
Income taxes 37 (248) (451) (1,329) (2,065)Minority interests in earnings (34) (100) (181) (604)Net income from continuing operations 545 2,049 4,150 6,064
Net income (loss) from discontinued operations, net of income taxes and minority interests in earnings 3 (2,568) (128) (3,483) 1,237
Net income (loss) (2,023) 1,921 667 7,301
Three months ended September 30,
Nine months ended September 30,
Note2008 2007 2008 2007
� � � �
Basic earnings per share 38 (4.49) 4.30 1.48 16.72
from continuing operations 1.21 4.59 9.22 13.89from discontinued operations (5.70) (0.29) (7.74) 2.83
Diluted earnings per share 38 (4.48) 4.23 1.41 16.41
from continuing operations 1.20 4.51 9.07 13.63from discontinued operations (5.68) (0.28) (7.66) 2.78
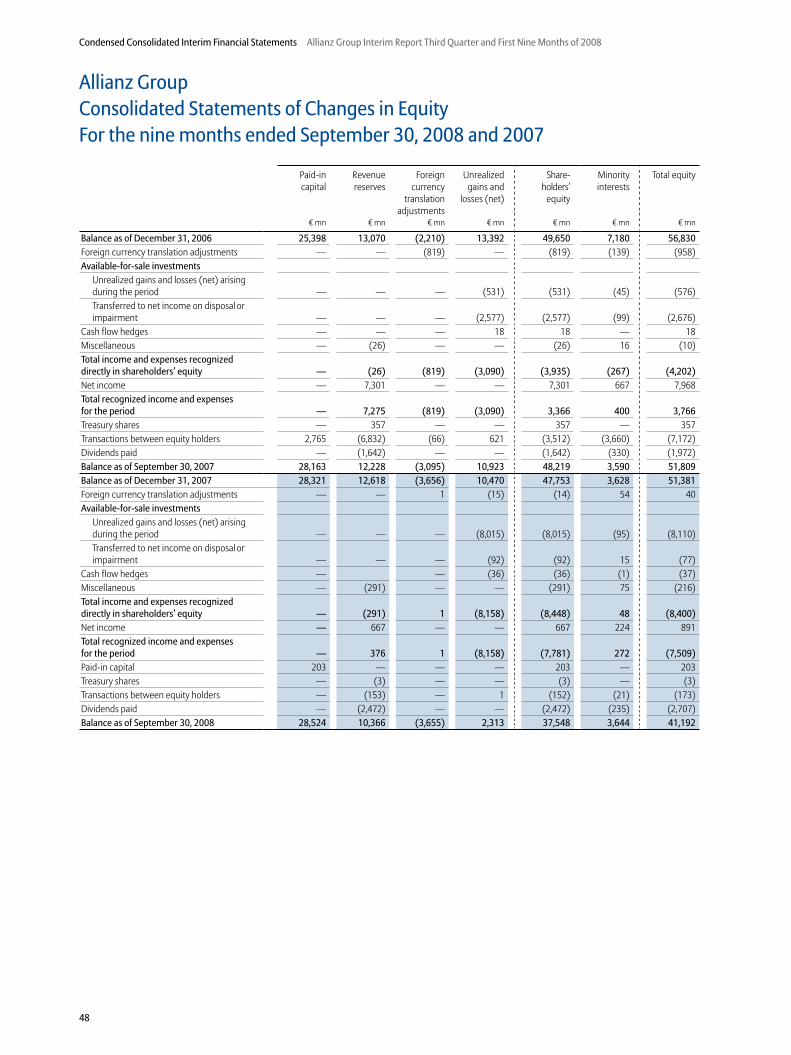
48
Condensed Consolidated Interim Financial Statements Allianz Group Interim Report Third Quarter and First Nine Months of 2008
Allianz Group Consolidated Statements of Changes in EquityFor the nine months ended September 30, 2008 and 2007
Paid-in capital
Revenue reserves
Foreign currency
translation adjustments
Unrealized gains and
losses (net)
Share- holders’
equity
Minority interests
Total equity
� mn � mn � mn � mn � mn � mn � mn
Balance as of December 31, 2006 25,398 13,070 (2,210) 13,392 49,650 7,180 56,830
Foreign currency translation adjustments — — (819) — (819) (139) (958)Available-for-sale investments
Unrealized gains and losses (net) arising during the period — — — (531) (531) (45) (576)Transferred to net income on disposal or impairment — — — (2,577) (2,577) (99) (2,676)
Cash flow hedges — — — 18 18 — 18Miscellaneous — (26) — — (26) 16 (10)Total income and expenses recognized directly in shareholders’ equity — (26) (819) (3,090) (3,935) (267) (4,202)
Net income — 7,301 — — 7,301 667 7,968Total recognized income and expenses for the period — 7,275 (819) (3,090) 3,366 400 3,766
Treasury shares — 357 — — 357 — 357Transactions between equity holders 2,765 (6,832) (66) 621 (3,512) (3,660) (7,172)Dividends paid — (1,642) — — (1,642) (330) (1,972)Balance as of September 30, 2007 28,163 12,228 (3,095) 10,923 48,219 3,590 51,809
Balance as of December 31, 2007 28,321 12,618 (3,656) 10,470 47,753 3,628 51,381
Foreign currency translation adjustments — — 1 (15) (14) 54 40Available-for-sale investments
Unrealized gains and losses (net) arising during the period — — — (8,015) (8,015) (95) (8,110)Transferred to net income on disposal or impairment — — — (92) (92) 15 (77)
Cash flow hedges — — (36) (36) (1) (37)Miscellaneous — (291) — — (291) 75 (216)Total income and expenses recognized directly in shareholders’ equity — (291) 1 (8,158) (8,448) 48 (8,400)
Net income — 667 — — 667 224 891Total recognized income and expenses for the period — 376 1 (8,158) (7,781) 272 (7,509)
Paid-in capital 203 — — — 203 — 203Treasury shares — (3) — — (3) — (3)Transactions between equity holders — (153) — 1 (152) (21) (173)Dividends paid — (2,472) — — (2,472) (235) (2,707)Balance as of September 30, 2008 28,524 10,366 (3,655) 2,313 37,548 3,644 41,192
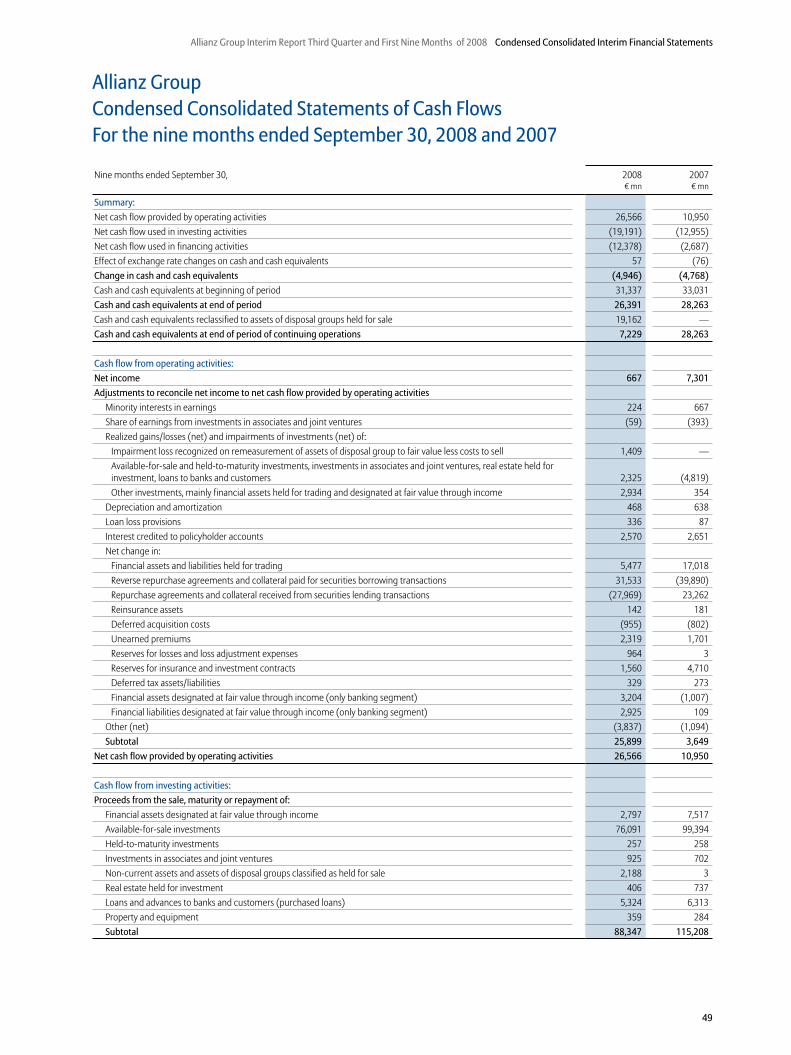
49
Allianz Group Interim Report Third Quarter and First Nine Months of 2008 Condensed Consolidated Interim Financial Statements
Allianz Group Condensed Consolidated Statements of Cash Flows For the nine months ended September 30, 2008 and 2007
Nine months ended September 30, 2008 2007� mn � mn
Summary:
Net cash flow provided by operating activities 26,566 10,950Net cash flow used in investing activities (19,191) (12,955)Net cash flow used in financing activities (12,378) (2,687)Effect of exchange rate changes on cash and cash equivalents 57 (76)Change in cash and cash equivalents (4,946) (4,768)
Cash and cash equivalents at beginning of period 31,337 33,031Cash and cash equivalents at end of period 26,391 28,263
Cash and cash equivalents reclassified to assets of disposal groups held for sale 19,162 —Cash and cash equivalents at end of period of continuing operations 7,229 28,263
Cash flow from operating activities:
Net income 667 7,301
Adjustments to reconcile net income to net cash flow provided by operating activities
Minority interests in earnings 224 667Share of earnings from investments in associates and joint ventures (59) (393)Realized gains/losses (net) and impairments of investments (net) of:
Impairment loss recognized on remeasurement of assets of disposal group to fair value less costs to sell 1,409 —Available-for-sale and held-to-maturity investments, investments in associates and joint ventures, real estate held for investment, loans to banks and customers 2,325 (4,819)Other investments, mainly financial assets held for trading and designated at fair value through income 2,934 354
Depreciation and amortization 468 638Loan loss provisions 336 87Interest credited to policyholder accounts 2,570 2,651Net change in:
Financial assets and liabilities held for trading 5,477 17,018Reverse repurchase agreements and collateral paid for securities borrowing transactions 31,533 (39,890)Repurchase agreements and collateral received from securities lending transactions (27,969) 23,262Reinsurance assets 142 181Deferred acquisition costs (955) (802)Unearned premiums 2,319 1,701Reserves for losses and loss adjustment expenses 964 3Reserves for insurance and investment contracts 1,560 4,710Deferred tax assets/liabilities 329 273Financial assets designated at fair value through income (only banking segment) 3,204 (1,007)Financial liabilities designated at fair value through income (only banking segment) 2,925 109
Other (net) (3,837) (1,094)Subtotal 25,899 3,649
Net cash flow provided by operating activities 26,566 10,950
Cash flow from investing activities:
Proceeds from the sale, maturity or repayment of:
Financial assets designated at fair value through income 2,797 7,517Available-for-sale investments 76,091 99,394Held-to-maturity investments 257 258Investments in associates and joint ventures 925 702Non-current assets and assets of disposal groups classified as held for sale 2,188 3Real estate held for investment 406 737Loans and advances to banks and customers (purchased loans) 5,324 6,313Property and equipment 359 284Subtotal 88,347 115,208
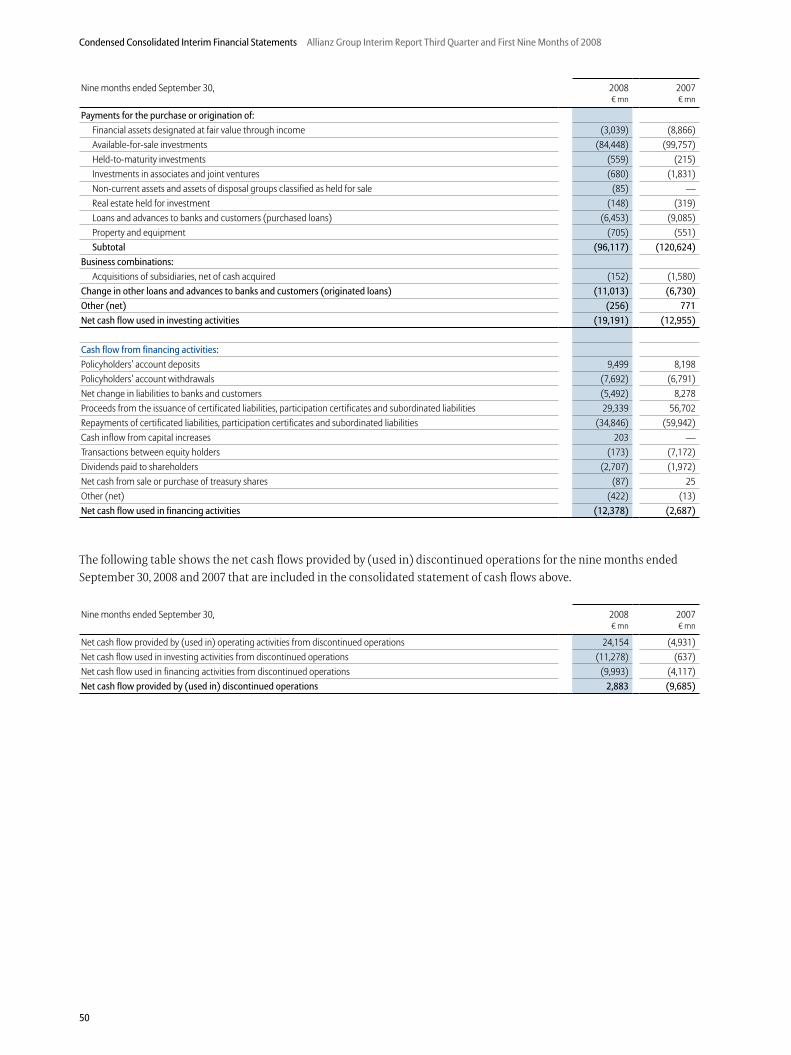
50
Condensed Consolidated Interim Financial Statements Allianz Group Interim Report Third Quarter and First Nine Months of 2008
Nine months ended September 30, 2008 2007� mn � mn
Payments for the purchase or origination of:
Financial assets designated at fair value through income (3,039) (8,866)Available-for-sale investments (84,448) (99,757)Held-to-maturity investments (559) (215)Investments in associates and joint ventures (680) (1,831)Non-current assets and assets of disposal groups classified as held for sale (85) —Real estate held for investment (148) (319)Loans and advances to banks and customers (purchased loans) (6,453) (9,085)Property and equipment (705) (551)Subtotal (96,117) (120,624)
Business combinations:
Acquisitions of subsidiaries, net of cash acquired (152) (1,580)Change in other loans and advances to banks and customers (originated loans) (11,013) (6,730)
Other (net) (256) 771
Net cash flow used in investing activities (19,191) (12,955)
Cash flow from financing activities:
Policyholders’ account deposits 9,499 8,198Policyholders’ account withdrawals (7,692) (6,791)Net change in liabilities to banks and customers (5,492) 8,278Proceeds from the issuance of certificated liabilities, participation certificates and subordinated liabilities 29,339 56,702Repayments of certificated liabilities, participation certificates and subordinated liabilities (34,846) (59,942)Cash inflow from capital increases 203 —Transactions between equity holders (173) (7,172)Dividends paid to shareholders (2,707) (1,972)Net cash from sale or purchase of treasury shares (87) 25Other (net) (422) (13)Net cash flow used in financing activities (12,378) (2,687)
The following table shows the net cash flows provided by (used in) discontinued operations for the nine months ended
September 30, 2008 and 2007 that are included in the consolidated statement of cash flows above.
Nine months ended September 30, 2008 2007� mn � mn
Net cash flow provided by (used in) operating activities from discontinued operations 24,154 (4,931)Net cash flow used in investing activities from discontinued operations (11,278) (637)Net cash flow used in financing activities from discontinued operations (9,993) (4,117)Net cash flow provided by (used in) discontinued operations 2,883 (9,685)
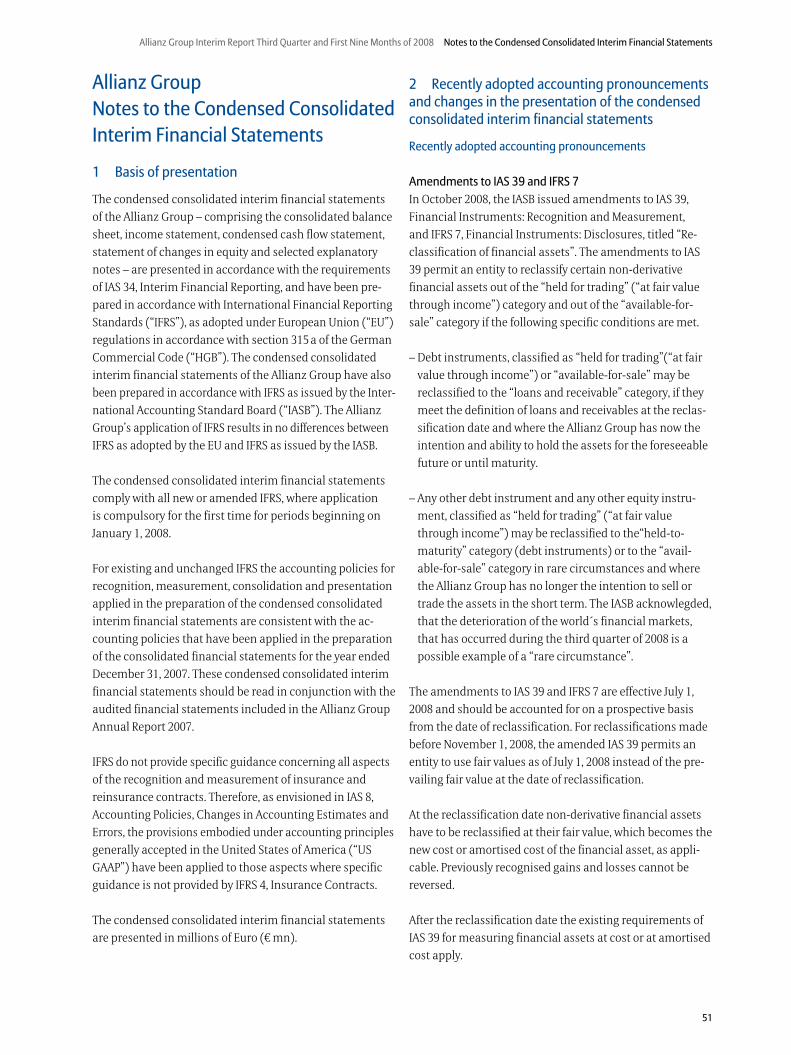
51
Allianz Group Interim Report Third Quarter and First Nine Months of 2008 Notes to the Condensed Consolidated Interim Financial Statements
Allianz Group Notes to the Condensed Consolidated Interim Financial Statements
1 Basis of presentation
The condensed consolidated interim financial statements
of the Allianz Group – comprising the consolidated balance
sheet, income statement, condensed cash flow statement,
statement of changes in equity and selected explanatory
notes – are presented in accordance with the requirements
of IAS 34, Interim Financial Reporting, and have been pre-
pared in accordance with International Financial Reporting
Standards (“IFRS”), as adopted under European Union (“EU”)
regulations in accordance with section 315 a of the German
Commercial Code (“HGB”). The condensed consolidated
interim financial statements of the Allianz Group have also
been prepared in accordance with IFRS as issued by the Inter-
national Accounting Standard Board (“IASB”). The Allianz
Group’s application of IFRS results in no differences between
IFRS as adopted by the EU and IFRS as issued by the IASB.
The condensed consolidated interim financial statements
comply with all new or amended IFRS, where application
is compulsory for the first time for periods beginning on
January 1, 2008.
For existing and unchanged IFRS the accounting policies for
recognition, measurement, consolidation and presentation
applied in the preparation of the condensed consolidated
interim financial statements are consistent with the ac-
counting policies that have been applied in the preparation
of the consolidated financial statements for the year ended
December 31, 2007. These condensed consolidated interim
financial statements should be read in conjunction with the
audited financial statements included in the Allianz Group
Annual Report 2007.
IFRS do not provide specific guidance concerning all aspects
of the recognition and measurement of insurance and
reinsurance contracts. Therefore, as envisioned in IAS 8,
Accounting Policies, Changes in Accounting Estimates and
Errors, the provisions embodied under accounting principles
generally accepted in the United States of America (“US
GAAP”) have been applied to those aspects where specific
guidance is not provided by IFRS 4, Insurance Contracts.
The condensed consolidated interim financial statements
are presented in millions of Euro (� mn).
2 Recently adopted accounting pronouncements and changes in the presentation of the condensed consolidated interim financial statements
Recently adopted accounting pronouncements
Amendments to IAS 39 and IFRS 7
In October 2008, the IASB issued amendments to IAS 39,
Financial Instruments: Recognition and Measurement,
and IFRS 7, Financial Instruments: Disclosures, titled “Re-
classification of financial assets”. The amendments to IAS
39 permit an entity to reclassify certain non-derivative
financial assets out of the “held for trading” (“at fair value
through income”) category and out of the “available-for-
sale” category if the following specific conditions are met.
– Debt instruments, classified as “held for trading”(“at fair
value through income”) or “available-for-sale” may be
reclassified to the “loans and receivable” category, if they
meet the definition of loans and receivables at the reclas-
sification date and where the Allianz Group has now the
intention and ability to hold the assets for the foreseeable
future or until maturity.
– Any other debt instrument and any other equity instru-
ment, classified as “held for trading” (“at fair value
through income”) may be reclassified to the“held-to-
maturity” category (debt instruments) or to the “avail-
able-for-sale” category in rare circumstances and where
the Allianz Group has no longer the intention to sell or
trade the assets in the short term. The IASB acknowlegded,
that the deterioration of the world´s financial markets,
that has occurred during the third quarter of 2008 is a
possible example of a “rare circumstance”.
The amendments to IAS 39 and IFRS 7 are effective July 1,
2008 and should be accounted for on a prospective basis
from the date of reclassification. For reclassifications made
before November 1, 2008, the amended IAS 39 permits an
entity to use fair values as of July 1, 2008 instead of the pre-
vailing fair value at the date of reclassification.
At the reclassification date non-derivative financial assets
have to be reclassified at their fair value, which becomes the
new cost or amortised cost of the financial asset, as appli-
cable. Previously recognised gains and losses cannot be
reversed.
After the reclassification date the existing requirements of
IAS 39 for measuring financial assets at cost or at amortised
cost apply.
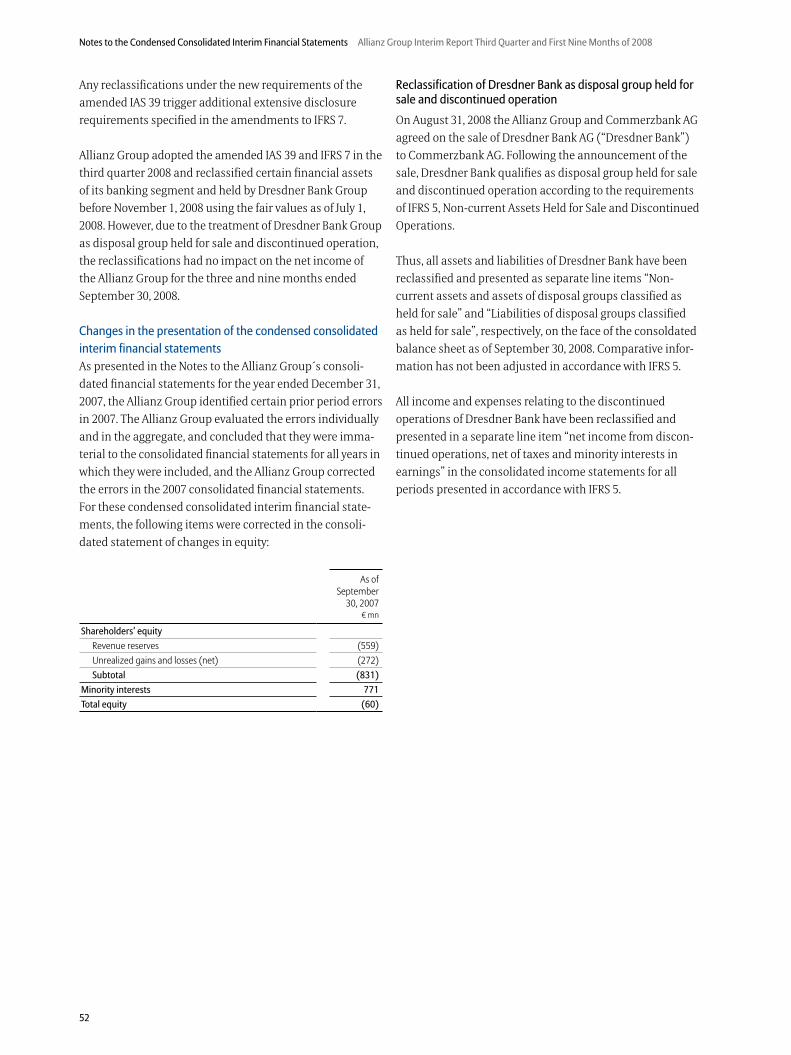
52
Notes to the Condensed Consolidated Interim Financial Statements Allianz Group Interim Report Third Quarter and First Nine Months of 2008
Any reclassifications under the new requirements of the
amended IAS 39 trigger additional extensive disclosure
requirements specified in the amendments to IFRS 7.
Allianz Group adopted the amended IAS 39 and IFRS 7 in the
third quarter 2008 and reclassified certain financial assets
of its banking segment and held by Dresdner Bank Group
before November 1, 2008 using the fair values as of July 1,
2008. However, due to the treatment of Dresdner Bank Group
as disposal group held for sale and discontinued operation,
the reclassifications had no impact on the net income of
the Allianz Group for the three and nine months ended
September 30, 2008.
Changes in the presentation of the condensed consolidated
interim financial statements
As presented in the Notes to the Allianz Group´s consoli-
dated financial statements for the year ended December 31,
2007, the Allianz Group identified certain prior period errors
in 2007. The Allianz Group evaluated the errors individually
and in the aggregate, and concluded that they were imma-
terial to the consolidated financial statements for all years in
which they were included, and the Allianz Group corrected
the errors in the 2007 consolidated financial statements.
For these condensed consolidated interim financial state-
ments, the following items were corrected in the consoli-
dated statement of changes in equity:
As of September
30, 2007� mn
Shareholders’ equity
Revenue reserves (559)Unrealized gains and losses (net) (272)Subtotal (831)
Minority interests 771
Total equity (60)
Reclassification of Dresdner Bank as disposal group held for sale and discontinued operation
On August 31, 2008 the Allianz Group and Commerzbank AG
agreed on the sale of Dresdner Bank AG (“Dresdner Bank”)
to Commerzbank AG. Following the announcement of the
sale, Dresdner Bank qualifies as disposal group held for sale
and discontinued operation according to the requirements
of IFRS 5, Non-current Assets Held for Sale and Discontinued
Operations.
Thus, all assets and liabilities of Dresdner Bank have been
reclassified and presented as separate line items “Non-
current assets and assets of disposal groups classified as
held for sale” and “Liabilities of disposal groups classified
as held for sale”, respectively, on the face of the consoldated
balance sheet as of September 30, 2008. Comparative infor-
mation has not been adjusted in accordance with IFRS 5.
All income and expenses relating to the discontinued
operations of Dresdner Bank have been reclassified and
presented in a separate line item “net income from discon-
tinued operations, net of taxes and minority interests in
earnings” in the consolidated income statements for all
periods presented in accordance with IFRS 5.
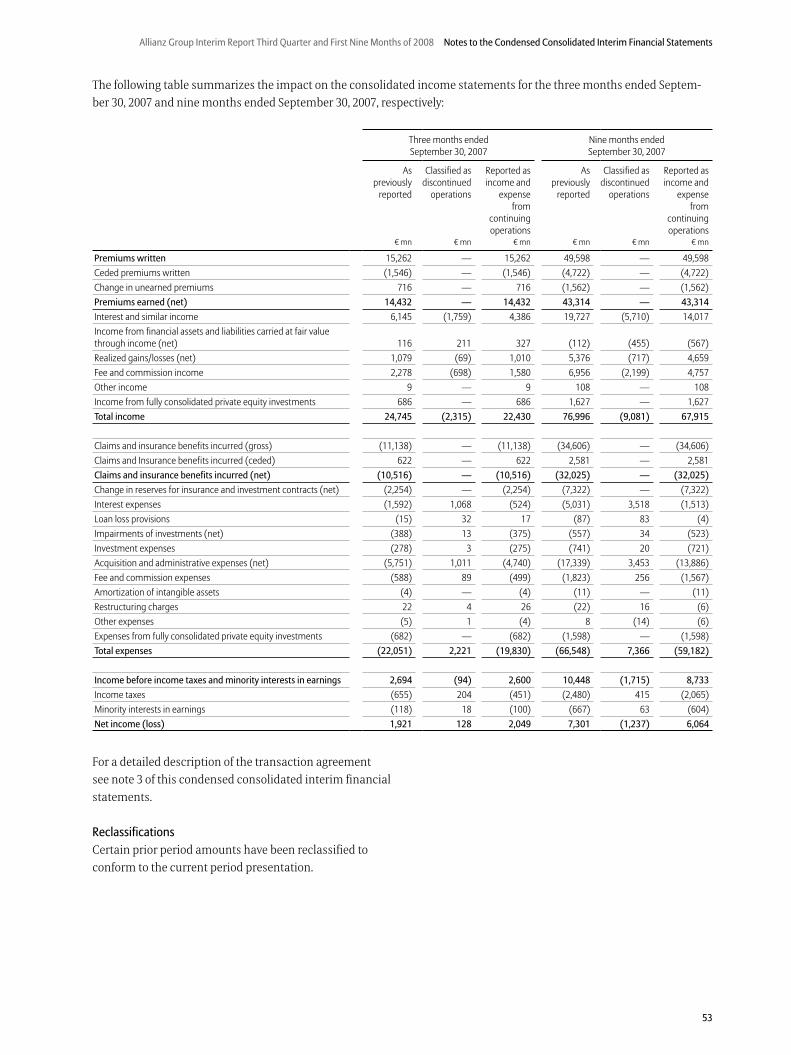
53
Allianz Group Interim Report Third Quarter and First Nine Months of 2008 Notes to the Condensed Consolidated Interim Financial Statements
The following table summarizes the impact on the consolidated income statements for the three months ended Septem-
ber 30, 2007 and nine months ended September 30, 2007, respectively:
Three months ended September 30, 2007
Nine months ended September 30, 2007
As previously
reported
Classified as discontinued
operations
Reported as income and
expense from
continuing operations
As previously
reported
Classified as discontinued
operations
Reported as income and
expense from
continuing operations
� mn � mn � mn � mn � mn � mn
Premiums written 15,262 — 15,262 49,598 — 49,598Ceded premiums written (1,546) — (1,546) (4,722) — (4,722)Change in unearned premiums 716 — 716 (1,562) — (1,562)Premiums earned (net) 14,432 — 14,432 43,314 — 43,314
Interest and similar income 6,145 (1,759) 4,386 19,727 (5,710) 14,017Income from financial assets and liabilities carried at fair value through income (net) 116 211 327 (112) (455) (567)Realized gains/losses (net) 1,079 (69) 1,010 5,376 (717) 4,659Fee and commission income 2,278 (698) 1,580 6,956 (2,199) 4,757Other income 9 — 9 108 — 108Income from fully consolidated private equity investments 686 — 686 1,627 — 1,627Total income 24,745 (2,315) 22,430 76,996 (9,081) 67,915
Claims and insurance benefits incurred (gross) (11,138) — (11,138) (34,606) — (34,606)Claims and Insurance benefits incurred (ceded) 622 — 622 2,581 — 2,581Claims and insurance benefits incurred (net) (10,516) — (10,516) (32,025) — (32,025)
Change in reserves for insurance and investment contracts (net) (2,254) — (2,254) (7,322) — (7,322)Interest expenses (1,592) 1,068 (524) (5,031) 3,518 (1,513)Loan loss provisions (15) 32 17 (87) 83 (4)Impairments of investments (net) (388) 13 (375) (557) 34 (523)Investment expenses (278) 3 (275) (741) 20 (721)Acquisition and administrative expenses (net) (5,751) 1,011 (4,740) (17,339) 3,453 (13,886)Fee and commission expenses (588) 89 (499) (1,823) 256 (1,567)Amortization of intangible assets (4) — (4) (11) — (11)Restructuring charges 22 4 26 (22) 16 (6)Other expenses (5) 1 (4) 8 (14) (6)Expenses from fully consolidated private equity investments (682) — (682) (1,598) — (1,598)Total expenses (22,051) 2,221 (19,830) (66,548) 7,366 (59,182)
Income before income taxes and minority interests in earnings 2,694 (94) 2,600 10,448 (1,715) 8,733
Income taxes (655) 204 (451) (2,480) 415 (2,065)Minority interests in earnings (118) 18 (100) (667) 63 (604)Net income (loss) 1,921 128 2,049 7,301 (1,237) 6,064
For a detailed description of the transaction agreement
see note 3 of this condensed consolidated interim financial
statements.
Reclassifications
Certain prior period amounts have been reclassified to
conform to the current period presentation.
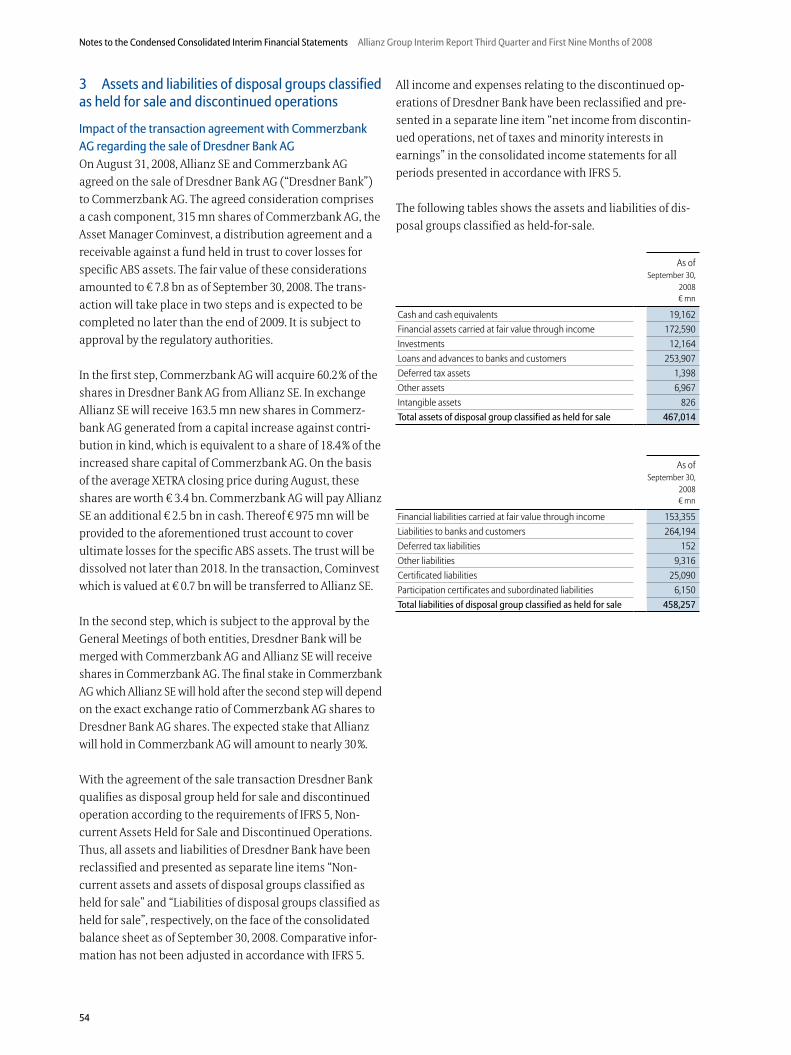
54
Notes to the Condensed Consolidated Interim Financial Statements Allianz Group Interim Report Third Quarter and First Nine Months of 2008
3 Assets and liabilities of disposal groups classified as held for sale and discontinued operations
Impact of the transaction agreement with Commerzbank
AG regarding the sale of Dresdner Bank AG
On August 31, 2008, Allianz SE and Commerzbank AG
agreed on the sale of Dresdner Bank AG (“Dresdner Bank”)
to Commerzbank AG. The agreed consideration comprises
a cash component, 315 mn shares of Commerzbank AG, the
Asset Manager Cominvest, a distribution agreement and a
receivable against a fund held in trust to cover losses for
specific ABS assets. The fair value of these considerations
amounted to � 7.8 bn as of September 30, 2008. The trans-
action will take place in two steps and is expected to be
completed no later than the end of 2009. It is subject to
approval by the regulatory authorities.
In the first step, Commerzbank AG will acquire 60.2 % of the
shares in Dresdner Bank AG from Allianz SE. In exchange
Allianz SE will receive 163.5 mn new shares in Commerz-
bank AG generated from a capital increase against contri-
bution in kind, which is equivalent to a share of 18.4 % of the
increased share capital of Commerzbank AG. On the basis
of the average XETRA closing price during August, these
shares are worth � 3.4 bn. Commerzbank AG will pay Allianz
SE an additional � 2.5 bn in cash. Thereof � 975 mn will be
provided to the aforementioned trust account to cover
ultimate losses for the specific ABS assets. The trust will be
dissolved not later than 2018. In the transaction, Cominvest
which is valued at � 0.7 bn will be transferred to Allianz SE.
In the second step, which is subject to the approval by the
General Meetings of both entities, Dresdner Bank will be
merged with Commerzbank AG and Allianz SE will receive
shares in Commerzbank AG. The final stake in Commerzbank
AG which Allianz SE will hold after the second step will depend
on the exact exchange ratio of Commerzbank AG shares to
Dresdner Bank AG shares. The expected stake that Allianz
will hold in Commerzbank AG will amount to nearly 30 %.
With the agreement of the sale transaction Dresdner Bank
qualifies as disposal group held for sale and discontinued
operation according to the requirements of IFRS 5, Non-
current Assets Held for Sale and Discontinued Operations.
Thus, all assets and liabilities of Dresdner Bank have been
reclassified and presented as separate line items “Non-
current assets and assets of disposal groups classified as
held for sale” and “Liabilities of disposal groups classified as
held for sale”, respectively, on the face of the consolidated
balance sheet as of September 30, 2008. Comparative infor-
mation has not been adjusted in accordance with IFRS 5.
All income and expenses relating to the discontinued op-
erations of Dresdner Bank have been reclassified and pre-
sented in a separate line item “net income from discontin-
ued operations, net of taxes and minority interests in
earnings” in the consolidated income statements for all
periods presented in accordance with IFRS 5.
The following tables shows the assets and liabilities of dis-
posal groups classified as held-for-sale.
As ofSeptember 30,
2008� mn
Cash and cash equivalents 19,162Financial assets carried at fair value through income 172,590Investments 12,164Loans and advances to banks and customers 253,907Deferred tax assets 1,398Other assets 6,967Intangible assets 826Total assets of disposal group classified as held for sale 467,014
As ofSeptember 30,
2008� mn
Financial liabilities carried at fair value through income 153,355Liabilities to banks and customers 264,194Deferred tax liabilities 152Other liabilities 9,316Certificated liabilities 25,090Participation certificates and subordinated liabilities 6,150Total liabilities of disposal group classified as held for sale 458,257
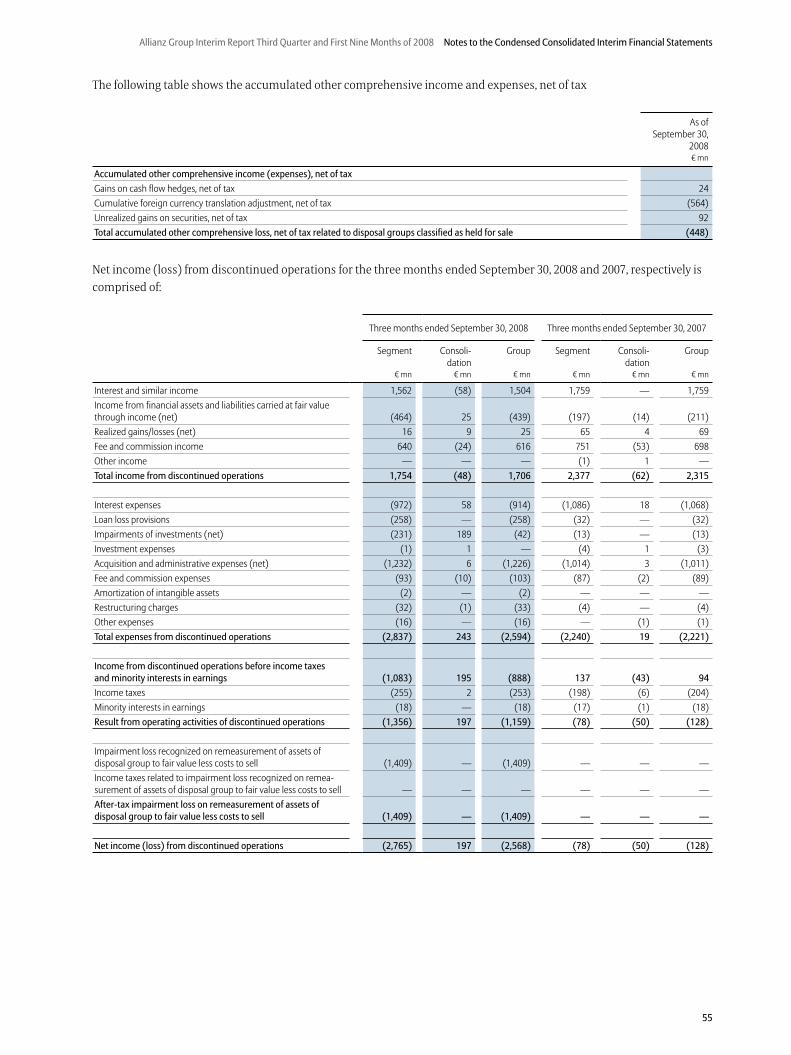
55
Allianz Group Interim Report Third Quarter and First Nine Months of 2008 Notes to the Condensed Consolidated Interim Financial Statements
The following table shows the accumulated other comprehensive income and expenses, net of tax
As ofSeptember 30,
2008� mn
Accumulated other comprehensive income (expenses), net of tax
Gains on cash flow hedges, net of tax 24Cumulative foreign currency translation adjustment, net of tax (564)Unrealized gains on securities, net of tax 92Total accumulated other comprehensive loss, net of tax related to disposal groups classified as held for sale (448)
Net income (loss) from discontinued operations for the three months ended September 30, 2008 and 2007, respectively is
comprised of:
Three months ended September 30, 2008 Three months ended September 30, 2007
Segment Consoli-dation
Group Segment Consoli-dation
Group
� mn � mn � mn � mn � mn � mn
Interest and similar income 1,562 (58) 1,504 1,759 — 1,759Income from financial assets and liabilities carried at fair value through income (net) (464) 25 (439) (197) (14) (211)Realized gains/losses (net) 16 9 25 65 4 69Fee and commission income 640 (24) 616 751 (53) 698Other income — — — (1) 1 — Total income from discontinued operations 1,754 (48) 1,706 2,377 (62) 2,315
Interest expenses (972) 58 (914) (1,086) 18 (1,068)Loan loss provisions (258) — (258) (32) — (32)Impairments of investments (net) (231) 189 (42) (13) — (13)Investment expenses (1) 1 — (4) 1 (3)Acquisition and administrative expenses (net) (1,232) 6 (1,226) (1,014) 3 (1,011)Fee and commission expenses (93) (10) (103) (87) (2) (89)Amortization of intangible assets (2) — (2) — — — Restructuring charges (32) (1) (33) (4) — (4)Other expenses (16) — (16) — (1) (1)Total expenses from discontinued operations (2,837) 243 (2,594) (2,240) 19 (2,221)
Income from discontinued operations before income taxes and minority interests in earnings (1,083) 195 (888) 137 (43) 94
Income taxes (255) 2 (253) (198) (6) (204)Minority interests in earnings (18) — (18) (17) (1) (18)Result from operating activities of discontinued operations (1,356) 197 (1,159) (78) (50) (128)
Impairment loss recognized on remeasurement of assets of disposal group to fair value less costs to sell (1,409) — (1,409) — — — Income taxes related to impairment loss recognized on remea-surement of assets of disposal group to fair value less costs to sell — — — — — — After-tax impairment loss on remeasurement of assets of disposal group to fair value less costs to sell (1,409) — (1,409) — — —
Net income (loss) from discontinued operations (2,765) 197 (2,568) (78) (50) (128)
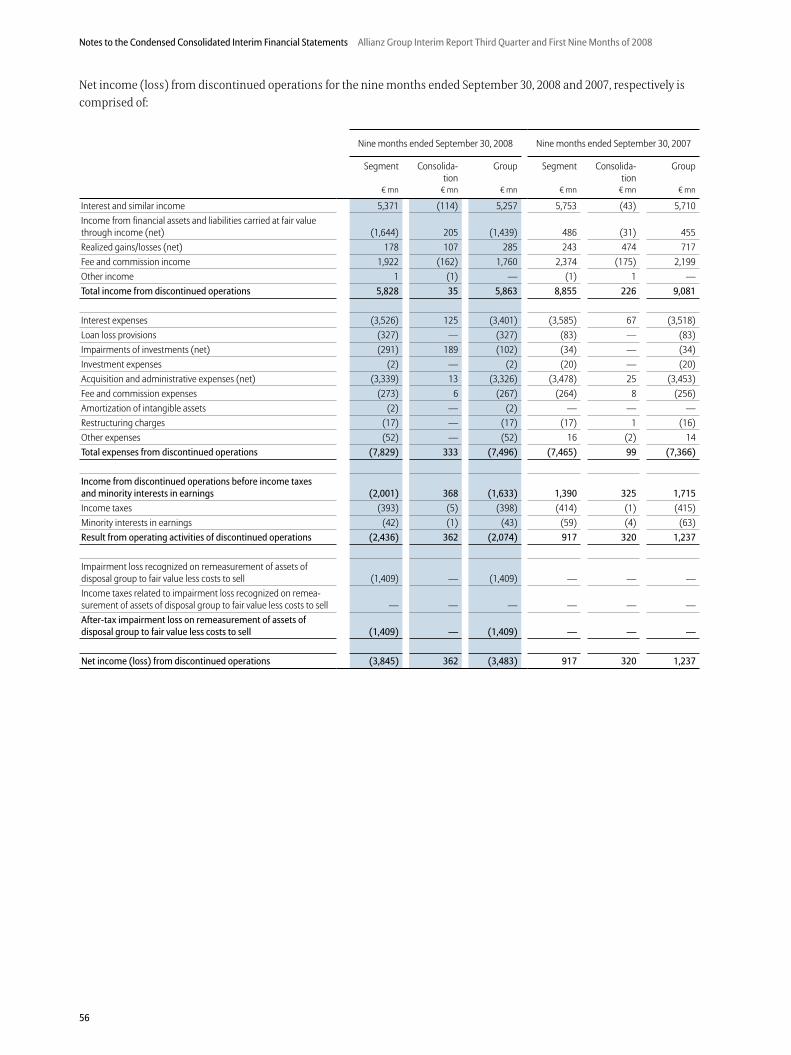
56
Notes to the Condensed Consolidated Interim Financial Statements Allianz Group Interim Report Third Quarter and First Nine Months of 2008
Net income (loss) from discontinued operations for the nine months ended September 30, 2008 and 2007, respectively is
comprised of:
Nine months ended September 30, 2008 Nine months ended September 30, 2007
Segment Consolida-tion
Group Segment Consolida-tion
Group
� mn � mn � mn � mn � mn � mn
Interest and similar income 5,371 (114) 5,257 5,753 (43) 5,710Income from financial assets and liabilities carried at fair value through income (net) (1,644) 205 (1,439) 486 (31) 455Realized gains/losses (net) 178 107 285 243 474 717Fee and commission income 1,922 (162) 1,760 2,374 (175) 2,199Other income 1 (1) — (1) 1 —Total income from discontinued operations 5,828 35 5,863 8,855 226 9,081
Interest expenses (3,526) 125 (3,401) (3,585) 67 (3,518)Loan loss provisions (327) — (327) (83) — (83)Impairments of investments (net) (291) 189 (102) (34) — (34)Investment expenses (2) — (2) (20) — (20)Acquisition and administrative expenses (net) (3,339) 13 (3,326) (3,478) 25 (3,453)Fee and commission expenses (273) 6 (267) (264) 8 (256)Amortization of intangible assets (2) — (2) — — — Restructuring charges (17) — (17) (17) 1 (16)Other expenses (52) — (52) 16 (2) 14Total expenses from discontinued operations (7,829) 333 (7,496) (7,465) 99 (7,366)
Income from discontinued operations before income taxes and minority interests in earnings (2,001) 368 (1,633) 1,390 325 1,715
Income taxes (393) (5) (398) (414) (1) (415)Minority interests in earnings (42) (1) (43) (59) (4) (63)Result from operating activities of discontinued operations (2,436) 362 (2,074) 917 320 1,237
Impairment loss recognized on remeasurement of assets of disposal group to fair value less costs to sell (1,409) — (1,409) — — — Income taxes related to impairment loss recognized on remea-surement of assets of disposal group to fair value less costs to sell — — — — — — After-tax impairment loss on remeasurement of assets of disposal group to fair value less costs to sell (1,409) — (1,409) — — —
Net income (loss) from discontinued operations (3,845) 362 (3,483) 917 320 1,237
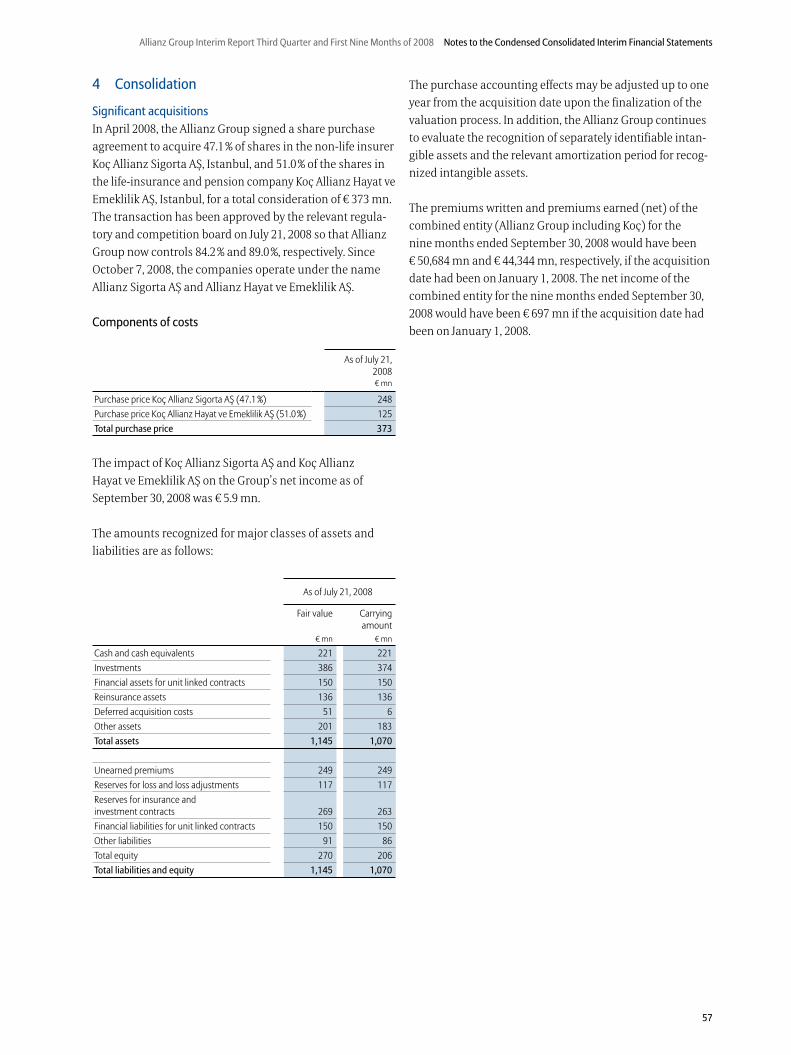
57
Allianz Group Interim Report Third Quarter and First Nine Months of 2008 Notes to the Condensed Consolidated Interim Financial Statements
The purchase accounting effects may be adjusted up to one
year from the acquisition date upon the finalization of the
valuation process. In addition, the Allianz Group continues
to evaluate the recognition of separately identifiable intan-
gible assets and the relevant amortization period for recog-
nized intangible assets.
The premiums written and premiums earned (net) of the
combined entity (Allianz Group including Koç) for the
nine months ended September 30, 2008 would have been
� 50,684 mn and � 44,344 mn, respectively, if the acquisition
date had been on January 1, 2008. The net income of the
combined entity for the nine months ended September 30,
2008 would have been � 697 mn if the acquisition date had
been on January 1, 2008.
4 Consolidation
Significant acquisitions
In April 2008, the Allianz Group signed a share purchase
agreement to acquire 47.1 % of shares in the non-life insurer
Koç Allianz Sigorta AŞ, Istanbul, and 51.0 % of the shares in
the life-insurance and pension company Koç Allianz Hayat ve
Emeklilik AŞ, Istanbul, for a total consideration of � 373 mn.
The transaction has been approved by the relevant regula-
tory and competition board on July 21, 2008 so that Allianz
Group now controls 84.2 % and 89.0 %, respectively. Since
October 7, 2008, the companies operate under the name
Allianz Sigorta AŞ and Allianz Hayat ve Emeklilik AŞ.
Components of costs
As of July 21, 2008� mn
Purchase price Koç Allianz Sigorta AŞ (47.1 %) 248Purchase price Koç Allianz Hayat ve Emeklilik AŞ (51.0 %) 125Total purchase price 373
The impact of Koç Allianz Sigorta AŞ and Koç Allianz
Hayat ve Emeklilik AŞ on the Group’s net income as of
September 30, 2008 was � 5.9 mn.
The amounts recognized for major classes of assets and
liabilities are as follows:
As of July 21, 2008
Fair value Carrying amount
� mn � mn
Cash and cash equivalents 221 221Investments 386 374Financial assets for unit linked contracts 150 150Reinsurance assets 136 136Deferred acquisition costs 51 6Other assets 201 183Total assets 1,145 1,070
Unearned premiums 249 249Reserves for loss and loss adjustments 117 117Reserves for insurance and investment contracts 269 263Financial liabilities for unit linked contracts 150 150Other liabilities 91 86Total equity 270 206Total liabilities and equity 1,145 1,070
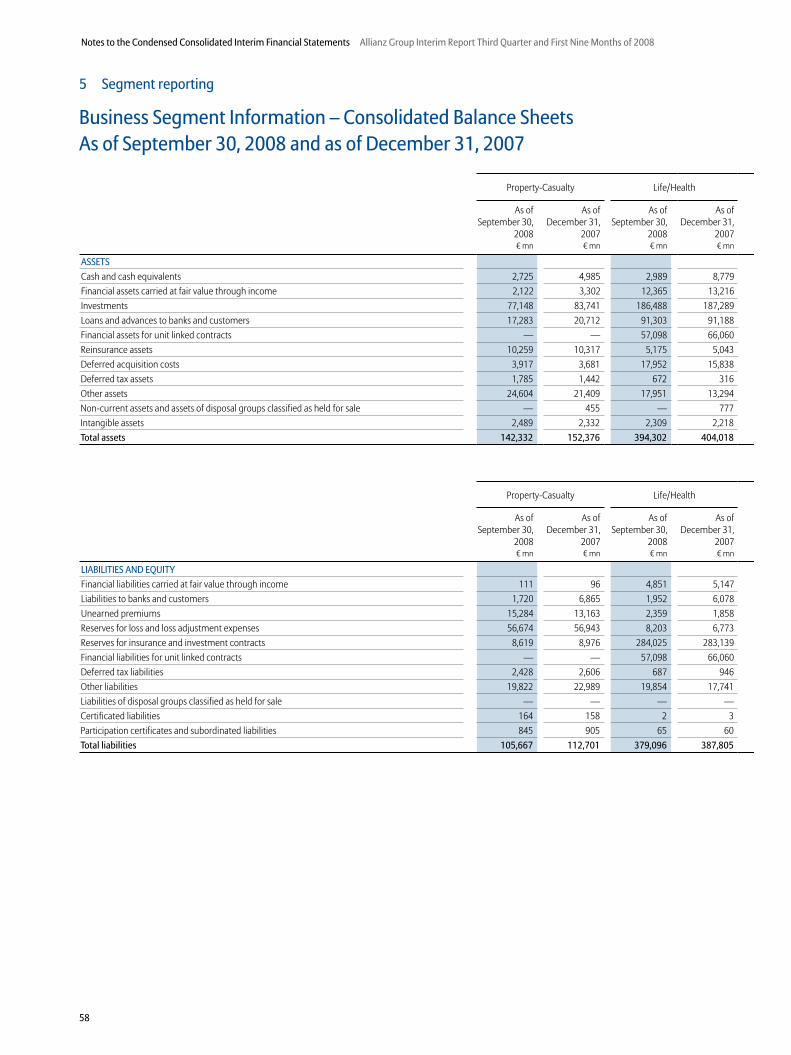
58
Notes to the Condensed Consolidated Interim Financial Statements Allianz Group Interim Report Third Quarter and First Nine Months of 2008
5 Segment reporting
Business Segment Information – Consolidated Balance Sheets As of September 30, 2008 and as of December 31, 2007
Property-Casualty Life/Health
As ofSeptember 30,
2008
As ofDecember 31,
2007
As ofSeptember 30,
2008
As ofDecember 31,
2007� mn � mn � mn � mn
ASSETS
Cash and cash equivalents 2,725 4,985 2,989 8,779Financial assets carried at fair value through income 2,122 3,302 12,365 13,216Investments 77,148 83,741 186,488 187,289Loans and advances to banks and customers 17,283 20,712 91,303 91,188Financial assets for unit linked contracts — — 57,098 66,060Reinsurance assets 10,259 10,317 5,175 5,043Deferred acquisition costs 3,917 3,681 17,952 15,838Deferred tax assets 1,785 1,442 672 316Other assets 24,604 21,409 17,951 13,294Non-current assets and assets of disposal groups classified as held for sale — 455 — 777Intangible assets 2,489 2,332 2,309 2,218Total assets 142,332 152,376 394,302 404,018
Property-Casualty Life/Health
As ofSeptember 30,
2008
As ofDecember 31,
2007
As ofSeptember 30,
2008
As ofDecember 31,
2007� mn � mn � mn � mn
LIABILITIES AND EQUITY
Financial liabilities carried at fair value through income 111 96 4,851 5,147Liabilities to banks and customers 1,720 6,865 1,952 6,078Unearned premiums 15,284 13,163 2,359 1,858Reserves for loss and loss adjustment expenses 56,674 56,943 8,203 6,773Reserves for insurance and investment contracts 8,619 8,976 284,025 283,139Financial liabilities for unit linked contracts — — 57,098 66,060Deferred tax liabilities 2,428 2,606 687 946Other liabilities 19,822 22,989 19,854 17,741Liabilities of disposal groups classified as held for sale — — — —Certificated liabilities 164 158 2 3Participation certificates and subordinated liabilities 845 905 65 60Total liabilities 105,667 112,701 379,096 387,805
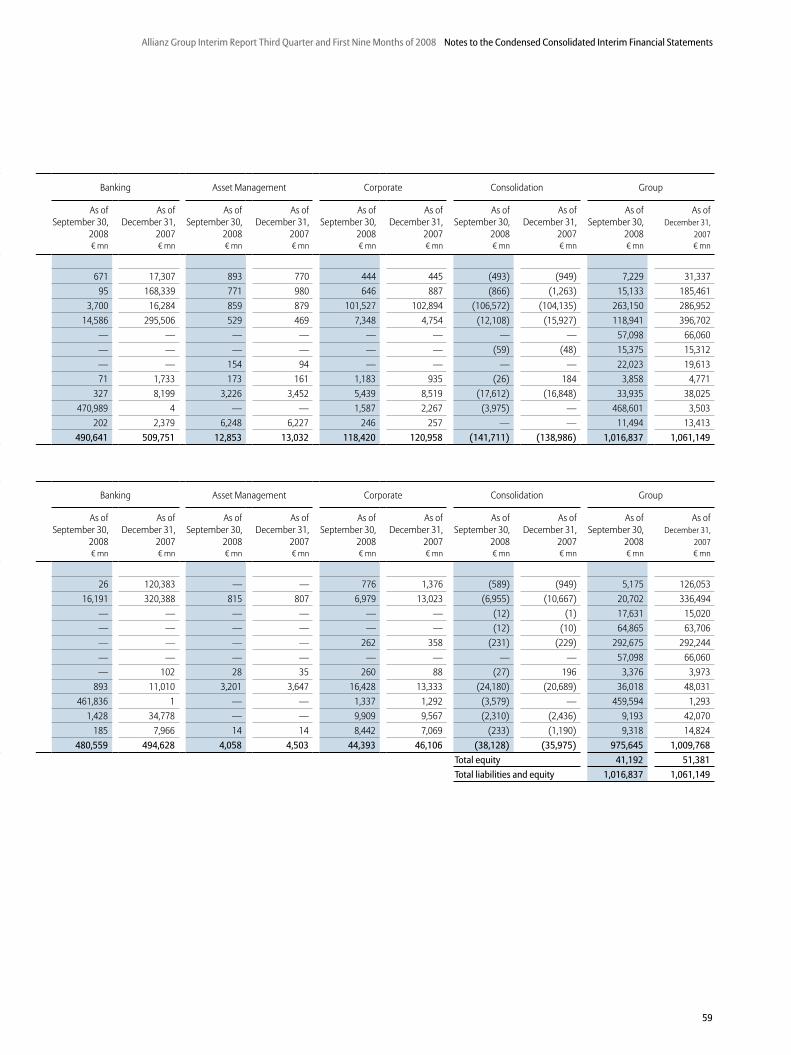
59
Allianz Group Interim Report Third Quarter and First Nine Months of 2008 Notes to the Condensed Consolidated Interim Financial Statements
Banking Asset Management Corporate Consolidation Group
As ofSeptember 30,
2008
As ofDecember 31,
2007
As ofSeptember 30,
2008
As ofDecember 31,
2007
As ofSeptember 30,
2008
As ofDecember 31,
2007
As ofSeptember 30,
2008
As ofDecember 31,
2007
As ofSeptember 30,
2008
As ofDecember 31,
2007� mn � mn � mn � mn � mn � mn � mn � mn � mn � mn
671 17,307 893 770 444 445 (493) (949) 7,229 31,33795 168,339 771 980 646 887 (866) (1,263) 15,133 185,461
3,700 16,284 859 879 101,527 102,894 (106,572) (104,135) 263,150 286,95214,586 295,506 529 469 7,348 4,754 (12,108) (15,927) 118,941 396,702
— — — — — — — — 57,098 66,060— — — — — — (59) (48) 15,375 15,312— — 154 94 — — — — 22,023 19,61371 1,733 173 161 1,183 935 (26) 184 3,858 4,771
327 8,199 3,226 3,452 5,439 8,519 (17,612) (16,848) 33,935 38,025470,989 4 — — 1,587 2,267 (3,975) — 468,601 3,503
202 2,379 6,248 6,227 246 257 — — 11,494 13,413490,641 509,751 12,853 13,032 118,420 120,958 (141,711) (138,986) 1,016,837 1,061,149
Banking Asset Management Corporate Consolidation Group
As ofSeptember 30,
2008
As ofDecember 31,
2007
As ofSeptember 30,
2008
As ofDecember 31,
2007
As ofSeptember 30,
2008
As ofDecember 31,
2007
As ofSeptember 30,
2008
As ofDecember 31,
2007
As ofSeptember 30,
2008
As ofDecember 31,
2007� mn � mn � mn � mn � mn � mn � mn � mn � mn � mn
26 120,383 — — 776 1,376 (589) (949) 5,175 126,05316,191 320,388 815 807 6,979 13,023 (6,955) (10,667) 20,702 336,494
— — — — — — (12) (1) 17,631 15,020— — — — — — (12) (10) 64,865 63,706— — — — 262 358 (231) (229) 292,675 292,244— — — — — — — — 57,098 66,060— 102 28 35 260 88 (27) 196 3,376 3,973
893 11,010 3,201 3,647 16,428 13,333 (24,180) (20,689) 36,018 48,031461,836 1 — — 1,337 1,292 (3,579) — 459,594 1,293
1,428 34,778 — — 9,909 9,567 (2,310) (2,436) 9,193 42,070185 7,966 14 14 8,442 7,069 (233) (1,190) 9,318 14,824
480,559 494,628 4,058 4,503 44,393 46,106 (38,128) (35,975) 975,645 1,009,768
Total equity 41,192 51,381
Total liabilities and equity 1,016,837 1,061,149
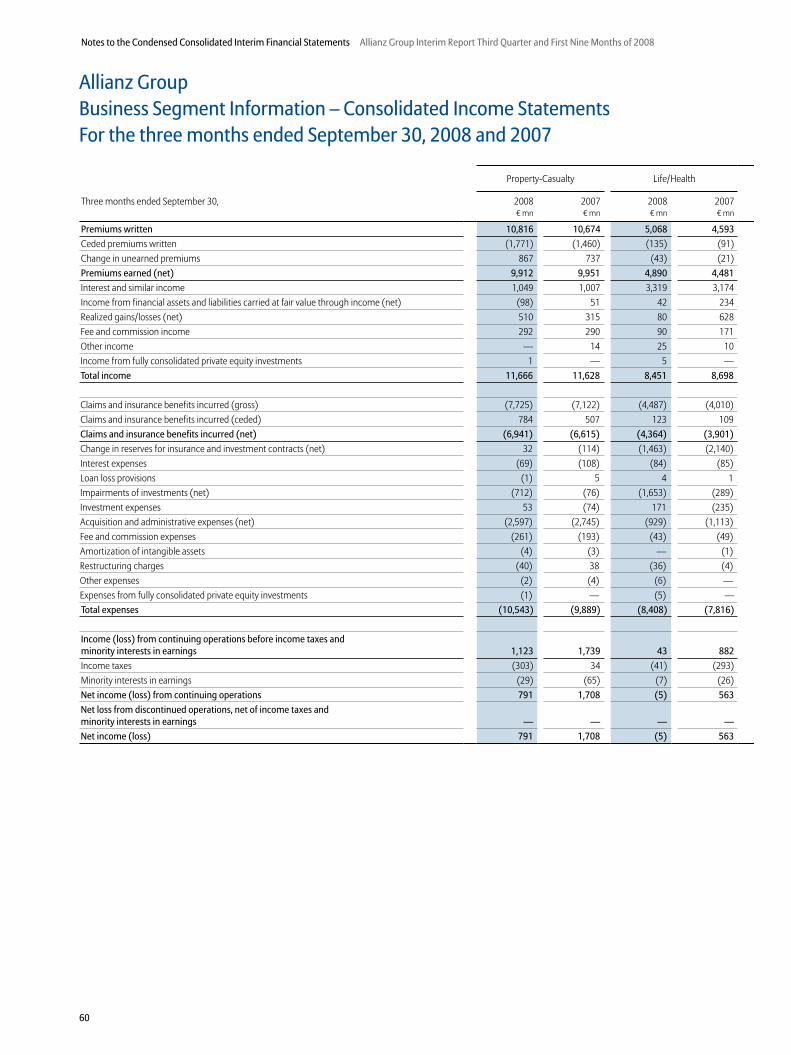
60
Notes to the Condensed Consolidated Interim Financial Statements Allianz Group Interim Report Third Quarter and First Nine Months of 2008
Allianz Group Business Segment Information – Consolidated Income StatementsFor the three months ended September 30, 2008 and 2007
Property-Casualty Life/Health
Three months ended September 30, 2008 2007 2008 2007� mn � mn � mn � mn
Premiums written 10,816 10,674 5,068 4,593
Ceded premiums written (1,771) (1,460) (135) (91)Change in unearned premiums 867 737 (43) (21)Premiums earned (net) 9,912 9,951 4,890 4,481
Interest and similar income 1,049 1,007 3,319 3,174Income from financial assets and liabilities carried at fair value through income (net) (98) 51 42 234Realized gains/losses (net) 510 315 80 628Fee and commission income 292 290 90 171Other income — 14 25 10Income from fully consolidated private equity investments 1 — 5 —Total income 11,666 11,628 8,451 8,698
Claims and insurance benefits incurred (gross) (7,725) (7,122) (4,487) (4,010)Claims and insurance benefits incurred (ceded) 784 507 123 109Claims and insurance benefits incurred (net) (6,941) (6,615) (4,364) (3,901)
Change in reserves for insurance and investment contracts (net) 32 (114) (1,463) (2,140)Interest expenses (69) (108) (84) (85)Loan loss provisions (1) 5 4 1Impairments of investments (net) (712) (76) (1,653) (289)Investment expenses 53 (74) 171 (235)Acquisition and administrative expenses (net) (2,597) (2,745) (929) (1,113)Fee and commission expenses (261) (193) (43) (49)Amortization of intangible assets (4) (3) — (1)Restructuring charges (40) 38 (36) (4)Other expenses (2) (4) (6) —Expenses from fully consolidated private equity investments (1) — (5) —Total expenses (10,543) (9,889) (8,408) (7,816)
Income (loss) from continuing operations before income taxes and minority interests in earnings 1,123 1,739 43 882
Income taxes (303) 34 (41) (293)Minority interests in earnings (29) (65) (7) (26)Net income (loss) from continuing operations 791 1,708 (5) 563
Net loss from discontinued operations, net of income taxes and minority interests in earnings — — — —
Net income (loss) 791 1,708 (5) 563
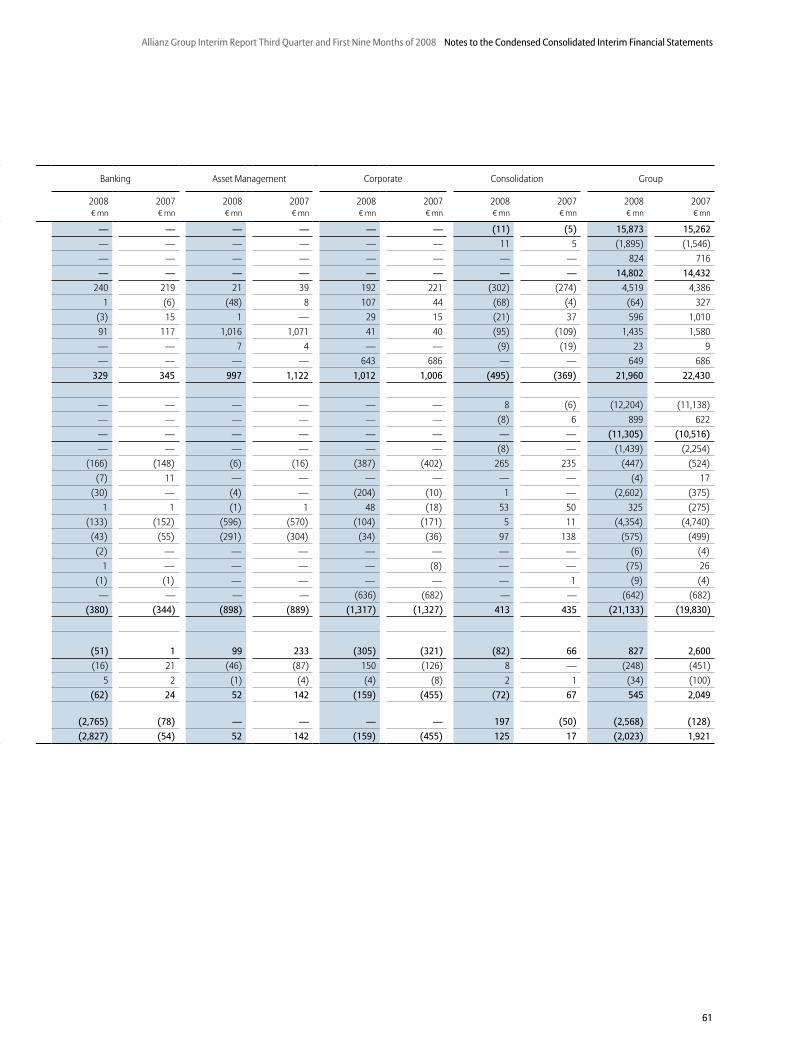
61
Allianz Group Interim Report Third Quarter and First Nine Months of 2008 Notes to the Condensed Consolidated Interim Financial Statements
Banking Asset Management Corporate Consolidation Group
2008 2007 2008 2007 2008 2007 2008 2007 2008 2007� mn � mn � mn � mn � mn � mn � mn � mn � mn � mn
— — — — — — (11) (5) 15,873 15,262
— — — — — — 11 5 (1,895) (1,546)— — — — — — — — 824 716— — — — — — — — 14,802 14,432
240 219 21 39 192 221 (302) (274) 4,519 4,3861 (6) (48) 8 107 44 (68) (4) (64) 327
(3) 15 1 — 29 15 (21) 37 596 1,01091 117 1,016 1,071 41 40 (95) (109) 1,435 1,580— — 7 4 — — (9) (19) 23 9— — — — 643 686 — — 649 686
329 345 997 1,122 1,012 1,006 (495) (369) 21,960 22,430
— — — — — — 8 (6) (12,204) (11,138)— — — — — — (8) 6 899 622— — — — — — — — (11,305) (10,516)
— — — — — — (8) — (1,439) (2,254) (166) (148) (6) (16) (387) (402) 265 235 (447) (524)
(7) 11 — — — — — — (4) 17 (30) — (4) — (204) (10) 1 — (2,602) (375)
1 1 (1) 1 48 (18) 53 50 325 (275) (133) (152) (596) (570) (104) (171) 5 11 (4,354) (4,740)
(43) (55) (291) (304) (34) (36) 97 138 (575) (499) (2) — — — — — — — (6) (4)
1 — — — — (8) — — (75) 26 (1) (1) — — — — — 1 (9) (4)
— — — — (636) (682) — — (642) (682) (380) (344) (898) (889) (1,317) (1,327) 413 435 (21,133) (19,830)
(51) 1 99 233 (305) (321) (82) 66 827 2,600
(16) 21 (46) (87) 150 (126) 8 — (248) (451)5 2 (1) (4) (4) (8) 2 1 (34) (100)
(62) 24 52 142 (159) (455) (72) 67 545 2,049
(2,765) (78) — — — — 197 (50) (2,568) (128)
(2,827) (54) 52 142 (159) (455) 125 17 (2,023) 1,921
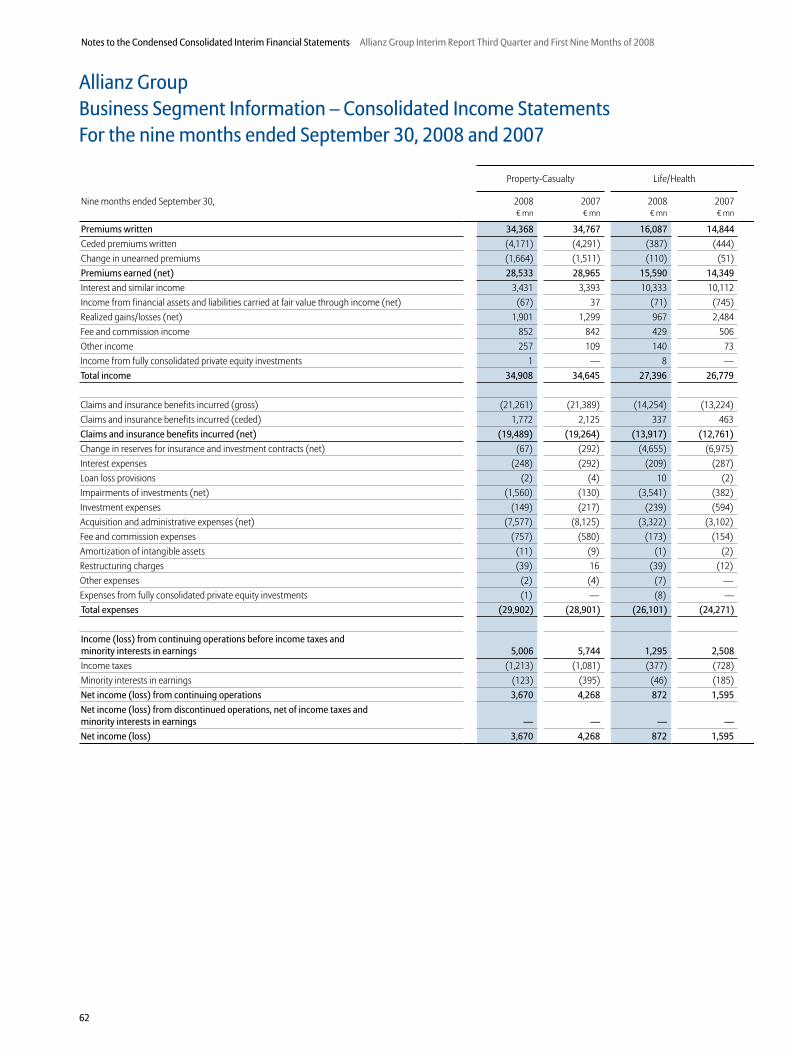
62
Notes to the Condensed Consolidated Interim Financial Statements Allianz Group Interim Report Third Quarter and First Nine Months of 2008
Allianz Group Business Segment Information – Consolidated Income StatementsFor the nine months ended September 30, 2008 and 2007
Property-Casualty Life/Health
Nine months ended September 30, 2008 2007 2008 2007� mn � mn � mn � mn
Premiums written 34,368 34,767 16,087 14,844
Ceded premiums written (4,171) (4,291) (387) (444)Change in unearned premiums (1,664) (1,511) (110) (51)Premiums earned (net) 28,533 28,965 15,590 14,349
Interest and similar income 3,431 3,393 10,333 10,112Income from financial assets and liabilities carried at fair value through income (net) (67) 37 (71) (745)Realized gains/losses (net) 1,901 1,299 967 2,484Fee and commission income 852 842 429 506Other income 257 109 140 73Income from fully consolidated private equity investments 1 — 8 —Total income 34,908 34,645 27,396 26,779
Claims and insurance benefits incurred (gross) (21,261) (21,389) (14,254) (13,224)Claims and insurance benefits incurred (ceded) 1,772 2,125 337 463Claims and insurance benefits incurred (net) (19,489) (19,264) (13,917) (12,761)
Change in reserves for insurance and investment contracts (net) (67) (292) (4,655) (6,975)Interest expenses (248) (292) (209) (287)Loan loss provisions (2) (4) 10 (2)Impairments of investments (net) (1,560) (130) (3,541) (382)Investment expenses (149) (217) (239) (594)Acquisition and administrative expenses (net) (7,577) (8,125) (3,322) (3,102)Fee and commission expenses (757) (580) (173) (154)Amortization of intangible assets (11) (9) (1) (2)Restructuring charges (39) 16 (39) (12)Other expenses (2) (4) (7) —Expenses from fully consolidated private equity investments (1) — (8) —Total expenses (29,902) (28,901) (26,101) (24,271)
Income (loss) from continuing operations before income taxes and minority interests in earnings 5,006 5,744 1,295 2,508
Income taxes (1,213) (1,081) (377) (728)Minority interests in earnings (123) (395) (46) (185)Net income (loss) from continuing operations 3,670 4,268 872 1,595
Net income (loss) from discontinued operations, net of income taxes and minority interests in earnings — — — —
Net income (loss) 3,670 4,268 872 1,595

63
Allianz Group Interim Report Third Quarter and First Nine Months of 2008 Notes to the Condensed Consolidated Interim Financial Statements
Banking Asset Management Corporate Consolidation Group
2008 2007 2008 2007 2008 2007 2008 2007 2008 2007� mn � mn � mn � mn � mn � mn � mn � mn � mn � mn
— — — — — — (22) (13) 50,433 49,598
— — — — — — 22 13 (4,536) (4,722)— — — — — — — — (1,774) (1,562)— — — — — — — — 44,123 43,314
735 649 71 105 707 620 (875) (862) 14,402 14,017 (10) 6 (49) 31 197 85 (237) 19 (237) (567)
1 25 9 3 178 1,003 1 (155) 3,057 4,659339 395 3,054 3,224 153 129 (332) (339) 4,495 4,757
— — 19 11 1 14 (28) (99) 389 108— — — — 1,846 1,627 — — 1,855 1,627
1,065 1,075 3,104 3,374 3,082 3,478 (1,471) (1,436) 68,084 67,915
— — — — — — 12 7 (35,503) (34,606)— — — — — — (12) (7) 2,097 2,581— — — — — — — — (33,406) (32,025)
— — — — — — (28) (55) (4,750) (7,322) (495) (414) (29) (46) (1,178) (1,149) 753 675 (1,406) (1,513)
(18) 2 — — — — — — (10) (4) (35) (1) (9) — (370) (10) (50) — (5,565) (523)
6 5 (1) 1 (46) (72) 159 156 (270) (721) (409) (432) (1,746) (1,715) (323) (539) 36 27 (13,341) (13,886) (153) (181) (902) (946) (100) (97) 307 391 (1,778) (1,567)
(2) — — — — — — — (14) (11)— — — (2) — (8) — — (78) (6)
(1) (2) — — — — — — (10) (6)— — — — (1,787) (1,598) — — (1,796) (1,598)
(1,107) (1,023) (2,687) (2,708) (3,804) (3,473) 1,177 1,194 (62,424) (59,182)
(42) 52 417 666 (722) 5 (294) (242) 5,660 8,733
(31) 13 (163) (268) 420 (71) 35 70 (1,329) (2,065)1 — (4) (23) (14) (16) 5 15 (181) (604)
(72) 65 250 375 (316) (82) (254) (157) 4,150 6,064
(3,845) 917 — — — — 362 320 (3,483) 1,237
(3,917) 982 250 375 (316) (82) 108 163 667 7,301

64
Notes to the Condensed Consolidated Interim Financial Statements Allianz Group Interim Report Third Quarter and First Nine Months of 2008
Allianz Group Business Segment Information – Total revenues and reconciliation of Operating Profit and Net Income For the three months ended September 30, 2008 and 2 007
Property-Casualty 1) Life/Health 1)
Three months ended September 30, 2008 2007 2008 2007� mn � mn � mn � mn
Total revenues 2) 10,816 10,674 9,415 10,268
Premiums earned (net) 9,912 9,951 4,890 4,481Interest and similar income 1,049 1,007 3,319 3,174Operating income from financial assets and liabilities carried at fair value through income (net) (69) 77 59 231Operating realized gains/losses (net) (20) 13 100 617Fee and commission income 292 290 90 171Other income — 14 25 10Income from fully consolidated private equity investments 1 — 5 —Claims and insurance benefits incurred (net) (6,941) (6,615) (4,364) (3,901)Change in reserves for insurance and investment contracts (net) 32 (114) (1,463) (2,140)Interest expenses, excluding interest expenses from external debt (69) (108) (84) (85)Loan loss provisions (1) 5 4 1Operating impairments of investments (net) (129) (17) (1,553) (288)Investment expenses 53 (74) 171 (235)Acquisition and administrative expenses (net), excluding acquisition-related expenses (2,597) (2,745) (929) (1,113)Fee and commission expenses (261) (193) (43) (49)Operating restructuring charges — — 2 (1)Other expenses (2) (4) (6) —Expenses from fully consolidated private equity investments (1) — (5) —Reclassification of tax benefits — — — —Operating profit (loss) 1,249 1,487 218 873
Non-operating income from financial assets and liabilities carried at fair value through income (net) (29) (26) (17) 3Non-operating realized gains/losses (net) 530 302 (20) 11Non-operating impairments of investments (net) (583) (59) (100) (1)Interest expenses from external debt — — — —Acquisition-related expenses — — — —Amortization of intangible assets (4) (3) — (1)Non-operating restructuring charges (40) 38 (38) (3)Reclassification of tax benefits — — — —Non-operating items (126) 252 (175) 9
Income (loss) from continuing operations before income taxes and minority interests in earnings 1,123 1,739 43 882
Income taxes (303) 34 (41) (293)Minority interests in earnings (29) (65) (7) (26)Net income (loss) from continuing operations 791 1,708 (5) 563
Net loss from discontinued operations, net of income taxes and minority interests in earnings — — — —
Net income (loss) 791 1,708 (5) 563
1) Since the first quarter 2008, health business in Belgium and France is shown within Life/Health segment. Prior year balances have not been adjusted.2) Total revenues comprise Property-Casualty segment’s gross premiums written, Life/Health segment’s statutory premiums, Banking segment’s operating revenues and Asset Management
segment’s operating revenues.

65
Allianz Group Interim Report Third Quarter and First Nine Months of 2008 Notes to the Condensed Consolidated Interim Financial Statements
Banking Asset Management Corporate Consolidation Group
2008 2007 2008 2007 2008 2007 2008 2007 2008 2007� mn � mn � mn � mn � mn � mn � mn � mn � mn � mn
123 127 698 803 — — 28 43 21,080 21,915
— — — — — — — — 14,802 14,432240 219 21 39 192 221 (302) (274) 4,519 4,386
1 (6) (48) 8 (38) (39) (41) 8 (136) 279— — — — — — (1) — 79 63091 117 1,016 1,071 41 40 (95) (109) 1,435 1,580— — 7 4 — — (9) (19) 23 9— — — — 643 686 — — 649 686— — — — — — — — (11,305) (10,516)— — — — — — (8) — (1,439) (2,254)
(166) (148) (6) (16) (160) (131) 265 235 (220) (253) (7) 11 — — — — — — (4) 17
— — — — — — 1 — (1,681) (305)1 1 (1) 1 48 (18) 53 50 325 (275)
(133) (152) (512) (473) (110) (196) 5 11 (4,276) (4,668) (43) (55) (291) (304) (34) (36) 97 138 (575) (499)
— — — — — — — — 2 (1) (1) (1) — — — — — 1 (9) (4)
— — — — (636) (682) — — (642) (682)— — — — — — 9 1 9 1
(17) (14) 186 330 (54) (155) (26) 42 1,556 2,563
— — — — 145 83 (27) (12) 72 48 (3) 15 1 — 29 15 (20) 37 517 380
(30) — (4) — (204) (10) — — (921) (70)— — — — (227) (271) — — (227) (271)— — (84) (97) 6 25 — — (78) (72)
(2) — — — — — — — (6) (4)1 — — — — (8) — — (77) 27
— — — — — — (9) (1) (9) (1) (34) 15 (87) (97) (251) (166) (56) 24 (729) 37
(51) 1 99 233 (305) (321) (82) 66 827 2,600
(16) 21 (46) (87) 150 (126) 8 — (248) (451)5 2 (1) (4) (4) (8) 2 1 (34) (100)
(62) 24 52 142 (159) (455) (72) 67 545 2,049
(2,765) (78) — — — — 197 (50) (2,568) (128)
(2,827) (54) 52 142 (159) (455) 125 17 (2,023) 1,921
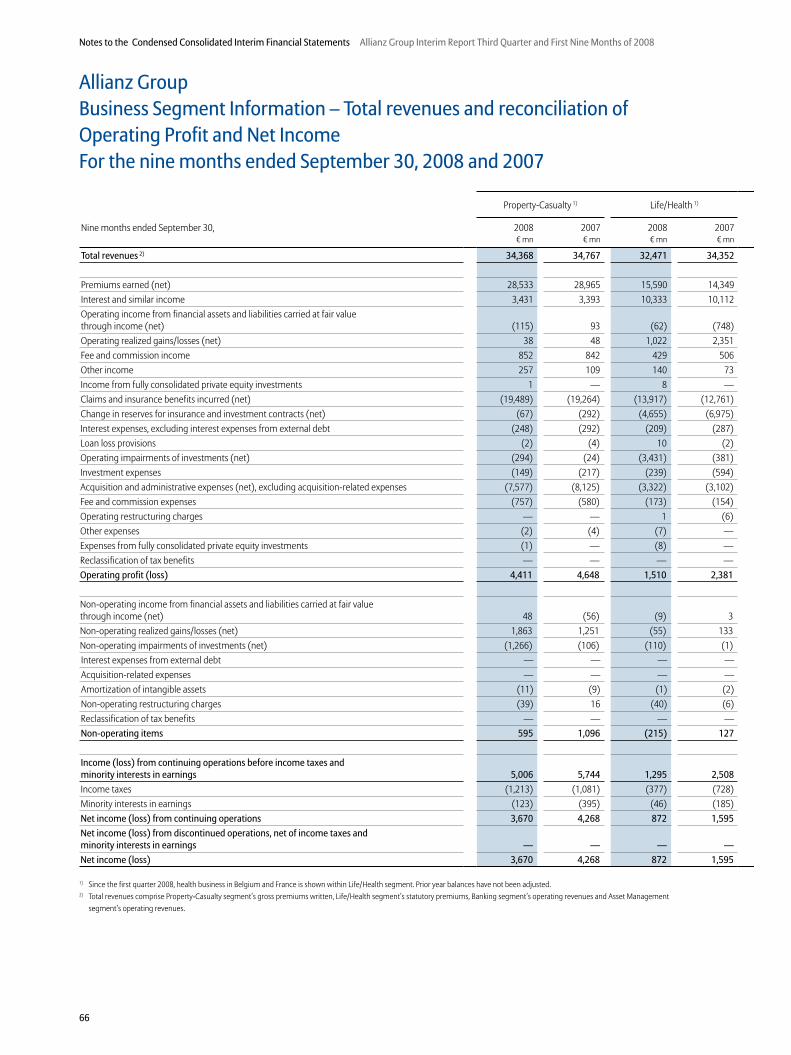
66
Notes to the Condensed Consolidated Interim Financial Statements Allianz Group Interim Report Third Quarter and First Nine Months of 2008
Allianz Group Business Segment Information – Total revenues and reconciliation of Operating Profit and Net Income For the nine months ended September 30, 2008 and 2 007
Property-Casualty 1) Life/Health 1)
Nine months ended September 30, 2008 2007 2008 2007� mn � mn � mn � mn
Total revenues 2) 34,368 34,767 32,471 34,352
Premiums earned (net) 28,533 28,965 15,590 14,349Interest and similar income 3,431 3,393 10,333 10,112Operating income from financial assets and liabilities carried at fair value through income (net) (115) 93 (62) (748)Operating realized gains/losses (net) 38 48 1,022 2,351Fee and commission income 852 842 429 506Other income 257 109 140 73Income from fully consolidated private equity investments 1 — 8 —Claims and insurance benefits incurred (net) (19,489) (19,264) (13,917) (12,761)Change in reserves for insurance and investment contracts (net) (67) (292) (4,655) (6,975)Interest expenses, excluding interest expenses from external debt (248) (292) (209) (287)Loan loss provisions (2) (4) 10 (2)Operating impairments of investments (net) (294) (24) (3,431) (381)Investment expenses (149) (217) (239) (594)Acquisition and administrative expenses (net), excluding acquisition-related expenses (7,577) (8,125) (3,322) (3,102)Fee and commission expenses (757) (580) (173) (154)Operating restructuring charges — — 1 (6)Other expenses (2) (4) (7) —Expenses from fully consolidated private equity investments (1) — (8) —Reclassification of tax benefits — — — —Operating profit (loss) 4,411 4,648 1,510 2,381
Non-operating income from financial assets and liabilities carried at fair value through income (net) 48 (56) (9) 3Non-operating realized gains/losses (net) 1,863 1,251 (55) 133Non-operating impairments of investments (net) (1,266) (106) (110) (1)Interest expenses from external debt — — — —Acquisition-related expenses — — — —Amortization of intangible assets (11) (9) (1) (2)Non-operating restructuring charges (39) 16 (40) (6)Reclassification of tax benefits — — — —Non-operating items 595 1,096 (215) 127
Income (loss) from continuing operations before income taxes and minority interests in earnings 5,006 5,744 1,295 2,508
Income taxes (1,213) (1,081) (377) (728)Minority interests in earnings (123) (395) (46) (185)Net income (loss) from continuing operations 3,670 4,268 872 1,595
Net income (loss) from discontinued operations, net of income taxes and minority interests in earnings — — — —
Net income (loss) 3,670 4,268 872 1,595
1) Since the first quarter 2008, health business in Belgium and France is shown within Life/Health segment. Prior year balances have not been adjusted.2) Total revenues comprise Property-Casualty segment’s gross premiums written, Life/Health segment’s statutory premiums, Banking segment’s operating revenues and Asset Management
segment’s operating revenues.
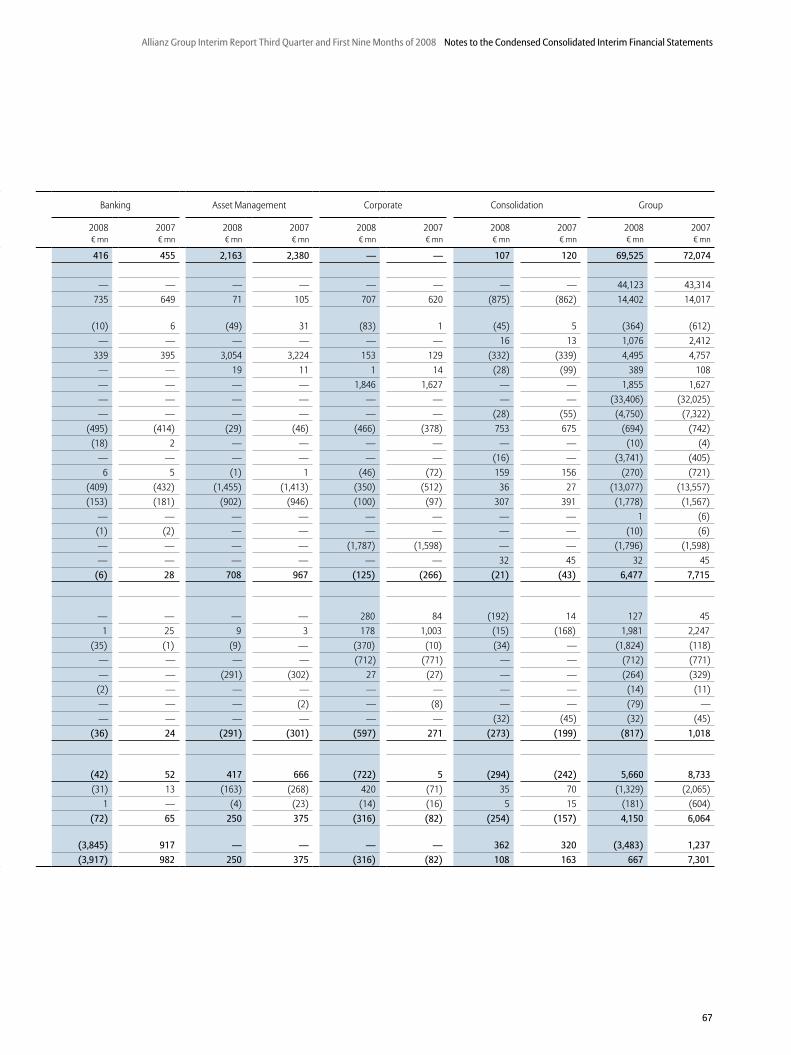
67
Allianz Group Interim Report Third Quarter and First Nine Months of 2008 Notes to the Condensed Consolidated Interim Financial Statements
Banking Asset Management Corporate Consolidation Group
2008 2007 2008 2007 2008 2007 2008 2007 2008 2007� mn � mn � mn � mn � mn � mn � mn � mn � mn � mn
416 455 2,163 2,380 — — 107 120 69,525 72,074
— — — — — — — — 44,123 43,314735 649 71 105 707 620 (875) (862) 14,402 14,017
(10) 6 (49) 31 (83) 1 (45) 5 (364) (612)— — — — — — 16 13 1,076 2,412
339 395 3,054 3,224 153 129 (332) (339) 4,495 4,757— — 19 11 1 14 (28) (99) 389 108— — — — 1,846 1,627 — — 1,855 1,627— — — — — — — — (33,406) (32,025)— — — — — — (28) (55) (4,750) (7,322)
(495) (414) (29) (46) (466) (378) 753 675 (694) (742) (18) 2 — — — — — — (10) (4)
— — — — — — (16) — (3,741) (405)6 5 (1) 1 (46) (72) 159 156 (270) (721)
(409) (432) (1,455) (1,413) (350) (512) 36 27 (13,077) (13,557) (153) (181) (902) (946) (100) (97) 307 391 (1,778) (1,567)
— — — — — — — — 1 (6) (1) (2) — — — — — — (10) (6)
— — — — (1,787) (1,598) — — (1,796) (1,598)— — — — — — 32 45 32 45
(6) 28 708 967 (125) (266) (21) (43) 6,477 7,715
— — — — 280 84 (192) 14 127 451 25 9 3 178 1,003 (15) (168) 1,981 2,247
(35) (1) (9) — (370) (10) (34) — (1,824) (118)— — — — (712) (771) — — (712) (771)— — (291) (302) 27 (27) — — (264) (329)
(2) — — — — — — — (14) (11)— — — (2) — (8) — — (79) —— — — — — — (32) (45) (32) (45)
(36) 24 (291) (301) (597) 271 (273) (199) (817) 1,018
(42) 52 417 666 (722) 5 (294) (242) 5,660 8,733
(31) 13 (163) (268) 420 (71) 35 70 (1,329) (2,065)1 — (4) (23) (14) (16) 5 15 (181) (604)
(72) 65 250 375 (316) (82) (254) (157) 4,150 6,064
(3,845) 917 — — — — 362 320 (3,483) 1,237
(3,917) 982 250 375 (316) (82) 108 163 667 7,301
68
Notes to the Condensed Consolidated Interim Financial Statements Allianz Group Interim Report Third Quarter and First Nine Months of 2008
Operating Profit
The Allianz Group uses operating profit to evaluate the
performance of its business segments and the Group as a
whole. The Allianz Group considers the presentation of
operating profit to be useful and meaningful to investors
because it enhances the understanding of the Allianz
Group’s underlying operating performance and the compa-
rability of its operating performance over time. Operating
profit highlights the portion of income before income taxes
and minority interests in earnings attributable to the on-
going core operations of the Allianz Group. To better under-
stand the on-going operations of the business, we exclude
the effects of acquisition-related expenses and the amorti-
zation of intangible assets, as these relate to business com-
binations; and we exclude interest expense from external
debt and non-operating income from financial assets and
liabilities carried at fair value through income (net) as these
relate to our capital structure.
The Allianz Group believes that trends in the underlying
profitability of its business can be more clearly identified
without the fluctuating effects of the realized capital gains
and losses or impairments of investment securities, as these
are largely dependent on market cycles or issuer-specific
events over which the Allianz Group has little or no control,
and can and do vary, sometimes materially, across periods.
Further, the timing of sales that would result in such gains
or losses is largely at the discretion of the Allianz Group.
Similarly, restructuring charges are excluded because the
timing of the restructuring charges are largely within the
control of the Allianz Group, and accordingly their exclusion
provides additional insight into the operating trends of the
underlying business. This differentiation is not made if the
profit sources are shared with policyholders.
Operating profit should be viewed as complementary to,
and not a substitute for, income before income taxes and
minority interests in earnings or net income as determined
in accordance with IFRS.
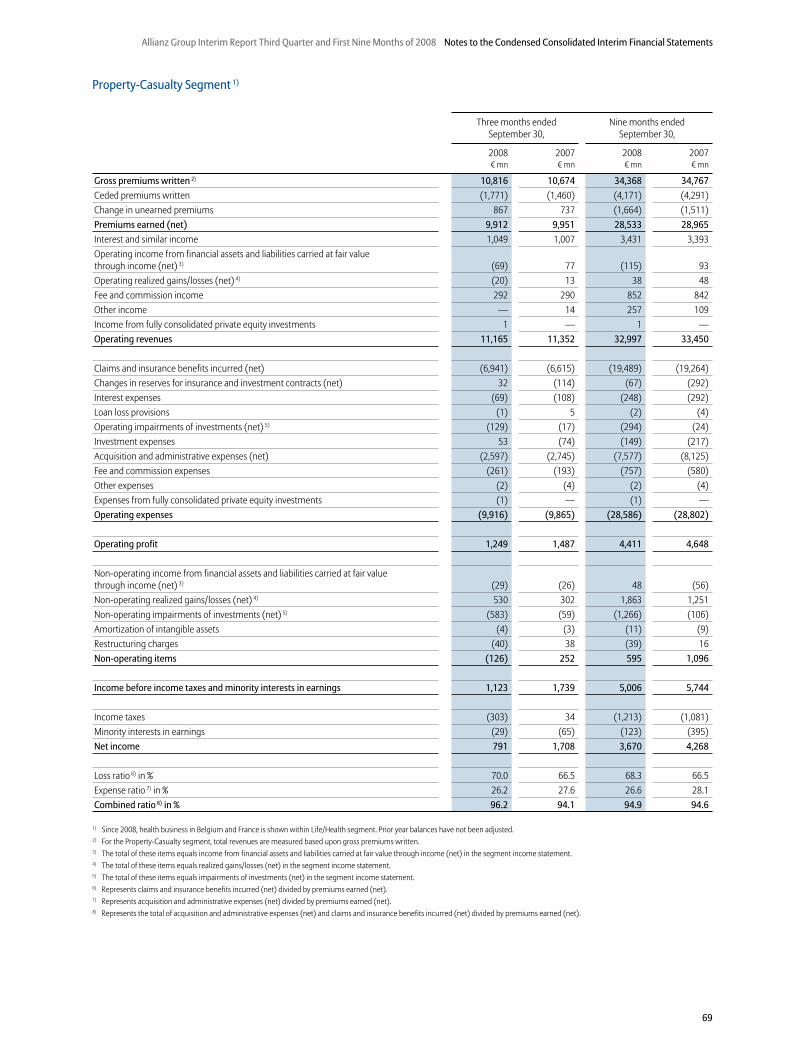
69
Allianz Group Interim Report Third Quarter and First Nine Months of 2008 Notes to the Condensed Consolidated Interim Financial Statements
Property-Casualty Segment 1)
Three months ended September 30,
Nine months ended September 30,
2008 2007 2008 2007� mn � mn � mn � mn
Gross premiums written 2) 10,816 10,674 34,368 34,767
Ceded premiums written (1,771) (1,460) (4,171) (4,291)Change in unearned premiums 867 737 (1,664) (1,511)Premiums earned (net) 9,912 9,951 28,533 28,965
Interest and similar income 1,049 1,007 3,431 3,393Operating income from financial assets and liabilities carried at fair value through income (net) 3) (69) 77 (115) 93Operating realized gains/losses (net) 4) (20) 13 38 48Fee and commission income 292 290 852 842Other income — 14 257 109Income from fully consolidated private equity investments 1 — 1 —Operating revenues 11,165 11,352 32,997 33,450
Claims and insurance benefits incurred (net) (6,941) (6,615) (19,489) (19,264)Changes in reserves for insurance and investment contracts (net) 32 (114) (67) (292)Interest expenses (69) (108) (248) (292)Loan loss provisions (1) 5 (2) (4)Operating impairments of investments (net) 5) (129) (17) (294) (24)Investment expenses 53 (74) (149) (217)Acquisition and administrative expenses (net) (2,597) (2,745) (7,577) (8,125)Fee and commission expenses (261) (193) (757) (580)Other expenses (2) (4) (2) (4)Expenses from fully consolidated private equity investments (1) — (1) —Operating expenses (9,916) (9,865) (28,586) (28,802)
Operating profit 1,249 1,487 4,411 4,648
Non-operating income from financial assets and liabilities carried at fair value through income (net) 3) (29) (26) 48 (56)Non-operating realized gains/losses (net) 4) 530 302 1,863 1,251Non-operating impairments of investments (net) 5) (583) (59) (1,266) (106)Amortization of intangible assets (4) (3) (11) (9)Restructuring charges (40) 38 (39) 16Non-operating items (126) 252 595 1,096
Income before income taxes and minority interests in earnings 1,123 1,739 5,006 5,744
Income taxes (303) 34 (1,213) (1,081)Minority interests in earnings (29) (65) (123) (395)Net income 791 1,708 3,670 4,268
Loss ratio 6) in % 70.0 66.5 68.3 66.5Expense ratio 7) in % 26.2 27.6 26.6 28.1Combined ratio 8) in % 96.2 94.1 94.9 94.6
1) Since 2008, health business in Belgium and France is shown within Life/Health segment. Prior year balances have not been adjusted.2) For the Property-Casualty segment, total revenues are measured based upon gross premiums written.3) The total of these items equals income from financial assets and liabilities carried at fair value through income (net) in the segment income statement.4) The total of these items equals realized gains/losses (net) in the segment income statement.5) The total of these items equals impairments of investments (net) in the segment income statement.6) Represents claims and insurance benefits incurred (net) divided by premiums earned (net).7) Represents acquisition and administrative expenses (net) divided by premiums earned (net).8) Represents the total of acquisition and administrative expenses (net) and claims and insurance benefits incurred (net) divided by premiums earned (net).
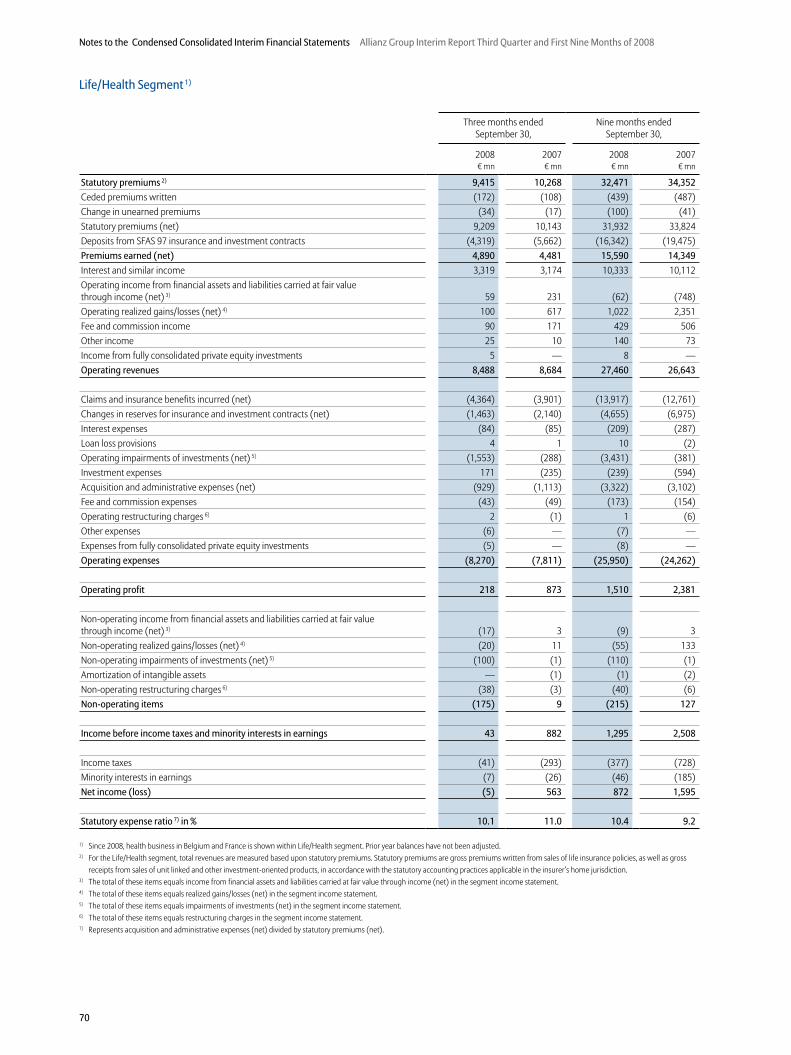
70
Notes to the Condensed Consolidated Interim Financial Statements Allianz Group Interim Report Third Quarter and First Nine Months of 2008
Life/Health Segment 1)
Three months ended September 30,
Nine months ended September 30,
2008 2007 2008 2007� mn � mn � mn � mn
Statutory premiums 2) 9,415 10,268 32,471 34,352
Ceded premiums written (172) (108) (439) (487)Change in unearned premiums (34) (17) (100) (41)Statutory premiums (net) 9,209 10,143 31,932 33,824Deposits from SFAS 97 insurance and investment contracts (4,319) (5,662) (16,342) (19,475)Premiums earned (net) 4,890 4,481 15,590 14,349
Interest and similar income 3,319 3,174 10,333 10,112Operating income from financial assets and liabilities carried at fair value through income (net) 3) 59 231 (62) (748)Operating realized gains/losses (net) 4) 100 617 1,022 2,351Fee and commission income 90 171 429 506Other income 25 10 140 73Income from fully consolidated private equity investments 5 — 8 —Operating revenues 8,488 8,684 27,460 26,643
Claims and insurance benefits incurred (net) (4,364) (3,901) (13,917) (12,761)Changes in reserves for insurance and investment contracts (net) (1,463) (2,140) (4,655) (6,975)Interest expenses (84) (85) (209) (287)Loan loss provisions 4 1 10 (2)Operating impairments of investments (net) 5) (1,553) (288) (3,431) (381)Investment expenses 171 (235) (239) (594)Acquisition and administrative expenses (net) (929) (1,113) (3,322) (3,102)Fee and commission expenses (43) (49) (173) (154)Operating restructuring charges 6) 2 (1) 1 (6)Other expenses (6) — (7) —Expenses from fully consolidated private equity investments (5) — (8) —Operating expenses (8,270) (7,811) (25,950) (24,262)
Operating profit 218 873 1,510 2,381
Non-operating income from financial assets and liabilities carried at fair value through income (net) 3) (17) 3 (9) 3Non-operating realized gains/losses (net) 4) (20) 11 (55) 133Non-operating impairments of investments (net) 5) (100) (1) (110) (1)Amortization of intangible assets — (1) (1) (2)Non-operating restructuring charges 6) (38) (3) (40) (6)Non-operating items (175) 9 (215) 127
Income before income taxes and minority interests in earnings 43 882 1,295 2,508
Income taxes (41) (293) (377) (728)Minority interests in earnings (7) (26) (46) (185)Net income (loss) (5) 563 872 1,595
Statutory expense ratio 7) in % 10.1 11.0 10.4 9.2
1) Since 2008, health business in Belgium and France is shown within Life/Health segment. Prior year balances have not been adjusted.2) For the Life/Health segment, total revenues are measured based upon statutory premiums. Statutory premiums are gross premiums written from sales of life insurance policies, as well as gross
receipts from sales of unit linked and other investment-oriented products, in accordance with the statutory accounting practices applicable in the insurer’s home jurisdiction.3) The total of these items equals income from financial assets and liabilities carried at fair value through income (net) in the segment income statement.4) The total of these items equals realized gains/losses (net) in the segment income statement.5) The total of these items equals impairments of investments (net) in the segment income statement.6) The total of these items equals restructuring charges in the segment income statement.7) Represents acquisition and administrative expenses (net) divided by statutory premiums (net).
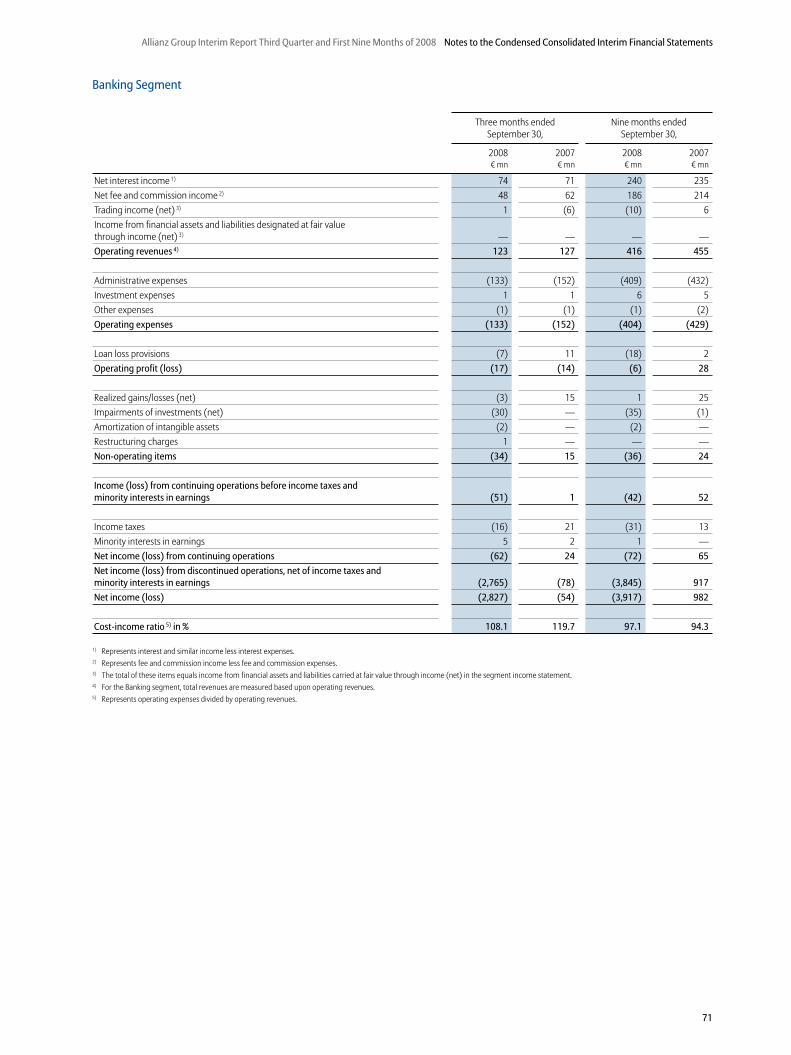
71
Allianz Group Interim Report Third Quarter and First Nine Months of 2008 Notes to the Condensed Consolidated Interim Financial Statements
Banking Segment
Three months ended September 30,
Nine months ended September 30,
2008 2007 2008 2007� mn � mn � mn � mn
Net interest income 1) 74 71 240 235Net fee and commission income 2) 48 62 186 214Trading income (net) 3) 1 (6) (10) 6Income from financial assets and liabilities designated at fair value through income (net) 3) — — — —Operating revenues 4) 123 127 416 455
Administrative expenses (133) (152) (409) (432)Investment expenses 1 1 6 5Other expenses (1) (1) (1) (2)Operating expenses (133) (152) (404) (429)
Loan loss provisions (7) 11 (18) 2Operating profit (loss) (17) (14) (6) 28
Realized gains/losses (net) (3) 15 1 25Impairments of investments (net) (30) — (35) (1)Amortization of intangible assets (2) — (2) —Restructuring charges 1 — — —Non-operating items (34) 15 (36) 24
Income (loss) from continuing operations before income taxes and minority interests in earnings (51) 1 (42) 52
Income taxes (16) 21 (31) 13Minority interests in earnings 5 2 1 —Net income (loss) from continuing operations (62) 24 (72) 65
Net income (loss) from discontinued operations, net of income taxes and minority interests in earnings (2,765) (78) (3,845) 917
Net income (loss) (2,827) (54) (3,917) 982
Cost-income ratio 5) in % 108.1 119.7 97.1 94.3
1) Represents interest and similar income less interest expenses.2) Represents fee and commission income less fee and commission expenses.3) The total of these items equals income from financial assets and liabilities carried at fair value through income (net) in the segment income statement.4) For the Banking segment, total revenues are measured based upon operating revenues.5) Represents operating expenses divided by operating revenues.
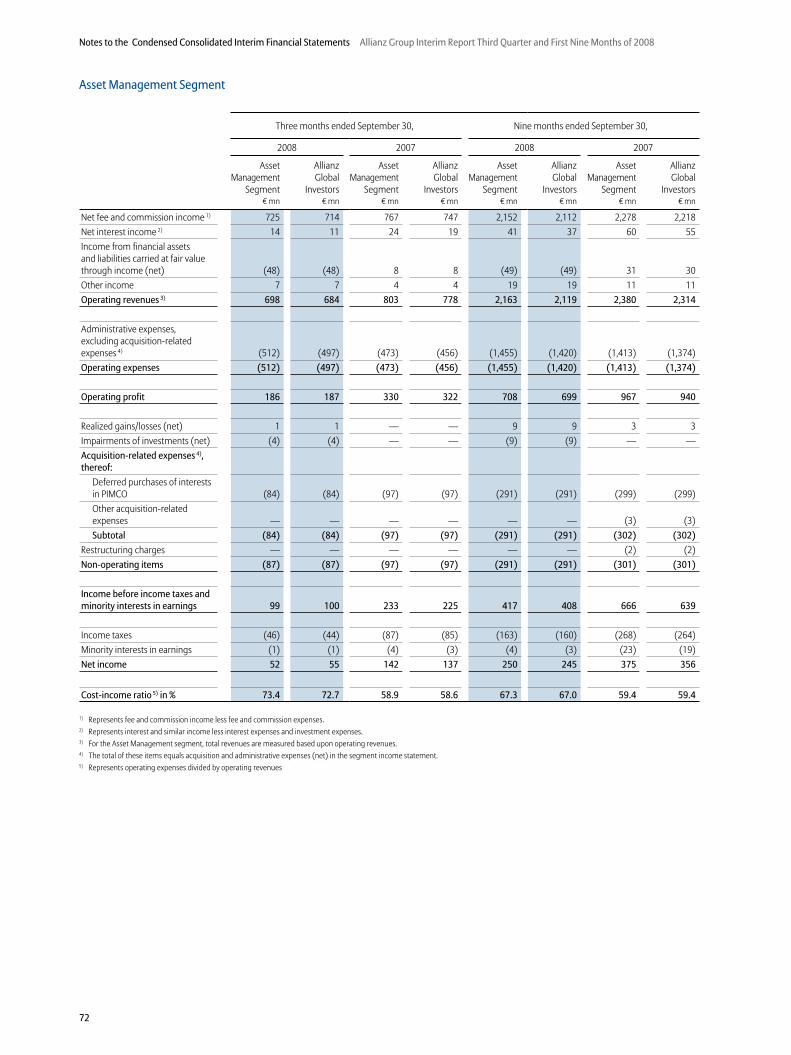
72
Notes to the Condensed Consolidated Interim Financial Statements Allianz Group Interim Report Third Quarter and First Nine Months of 2008
Asset Management Segment
Three months ended September 30, Nine months ended September 30,
2008 2007 2008 2007
Asset Management
Segment
Allianz Global
Investors
Asset Management
Segment
Allianz Global
Investors
Asset Management
Segment
Allianz Global
Investors
Asset Management
Segment
Allianz Global
Investors� mn � mn � mn � mn � mn � mn � mn � mn
Net fee and commission income 1) 725 714 767 747 2,152 2,112 2,278 2,218Net interest income 2) 14 11 24 19 41 37 60 55Income from financial assets and liabilities carried at fair value through income (net) (48) (48) 8 8 (49) (49) 31 30Other income 7 7 4 4 19 19 11 11Operating revenues 3) 698 684 803 778 2,163 2,119 2,380 2,314
Administrative expenses, excluding acquisition-related expenses 4) (512) (497) (473) (456) (1,455) (1,420) (1,413) (1,374)Operating expenses (512) (497) (473) (456) (1,455) (1,420) (1,413) (1,374)
Operating profit 186 187 330 322 708 699 967 940
Realized gains/losses (net) 1 1 — — 9 9 3 3Impairments of investments (net) (4) (4) — — (9) (9) — —Acquisition-related expenses 4), thereof:
Deferred purchases of interests in PIMCO (84) (84) (97) (97) (291) (291) (299) (299)Other acquisition-related expenses — — — — — — (3) (3)Subtotal (84) (84) (97) (97) (291) (291) (302) (302)
Restructuring charges — — — — — — (2) (2)Non-operating items (87) (87) (97) (97) (291) (291) (301) (301)
Income before income taxes and minority interests in earnings 99 100 233 225 417 408 666 639
Income taxes (46) (44) (87) (85) (163) (160) (268) (264)Minority interests in earnings (1) (1) (4) (3) (4) (3) (23) (19)Net income 52 55 142 137 250 245 375 356
Cost-income ratio 5) in % 73.4 72.7 58.9 58.6 67.3 67.0 59.4 59.4
1) Represents fee and commission income less fee and commission expenses.2) Represents interest and similar income less interest expenses and investment expenses.3) For the Asset Management segment, total revenues are measured based upon operating revenues.4) The total of these items equals acquisition and administrative expenses (net) in the segment income statement.5) Represents operating expenses divided by operating revenues
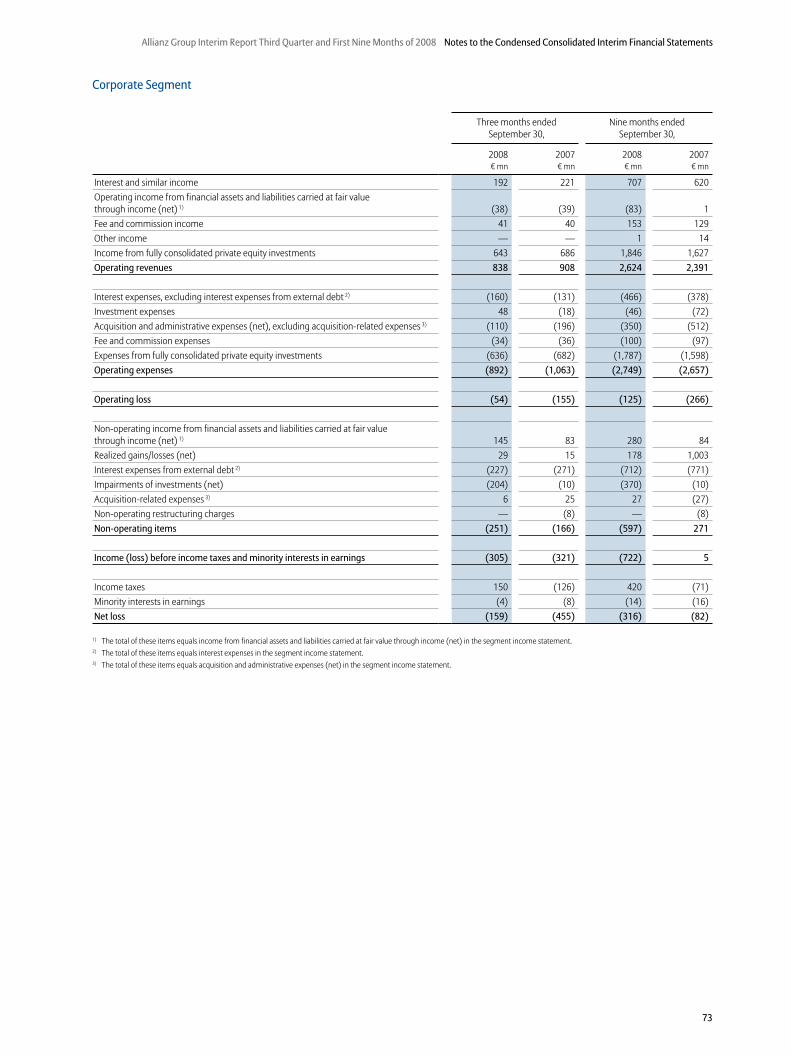
73
Allianz Group Interim Report Third Quarter and First Nine Months of 2008 Notes to the Condensed Consolidated Interim Financial Statements
Corporate Segment
Three months ended September 30,
Nine months ended September 30,
2008 2007 2008 2007� mn � mn � mn � mn
Interest and similar income 192 221 707 620Operating income from financial assets and liabilities carried at fair value through income (net) 1) (38) (39) (83) 1Fee and commission income 41 40 153 129Other income — — 1 14Income from fully consolidated private equity investments 643 686 1,846 1,627Operating revenues 838 908 2,624 2,391
Interest expenses, excluding interest expenses from external debt 2) (160) (131) (466) (378)Investment expenses 48 (18) (46) (72)Acquisition and administrative expenses (net), excluding acquisition-related expenses 3) (110) (196) (350) (512)Fee and commission expenses (34) (36) (100) (97)Expenses from fully consolidated private equity investments (636) (682) (1,787) (1,598)Operating expenses (892) (1,063) (2,749) (2,657)
Operating loss (54) (155) (125) (266)
Non-operating income from financial assets and liabilities carried at fair value through income (net) 1) 145 83 280 84Realized gains/losses (net) 29 15 178 1,003Interest expenses from external debt 2) (227) (271) (712) (771)Impairments of investments (net) (204) (10) (370) (10)Acquisition-related expenses 3) 6 25 27 (27)Non-operating restructuring charges — (8) — (8)Non-operating items (251) (166) (597) 271
Income (loss) before income taxes and minority interests in earnings (305) (321) (722) 5
Income taxes 150 (126) 420 (71)Minority interests in earnings (4) (8) (14) (16)Net loss (159) (455) (316) (82)
1) The total of these items equals income from financial assets and liabilities carried at fair value through income (net) in the segment income statement.2) The total of these items equals interest expenses in the segment income statement.3) The total of these items equals acquisition and administrative expenses (net) in the segment income statement.
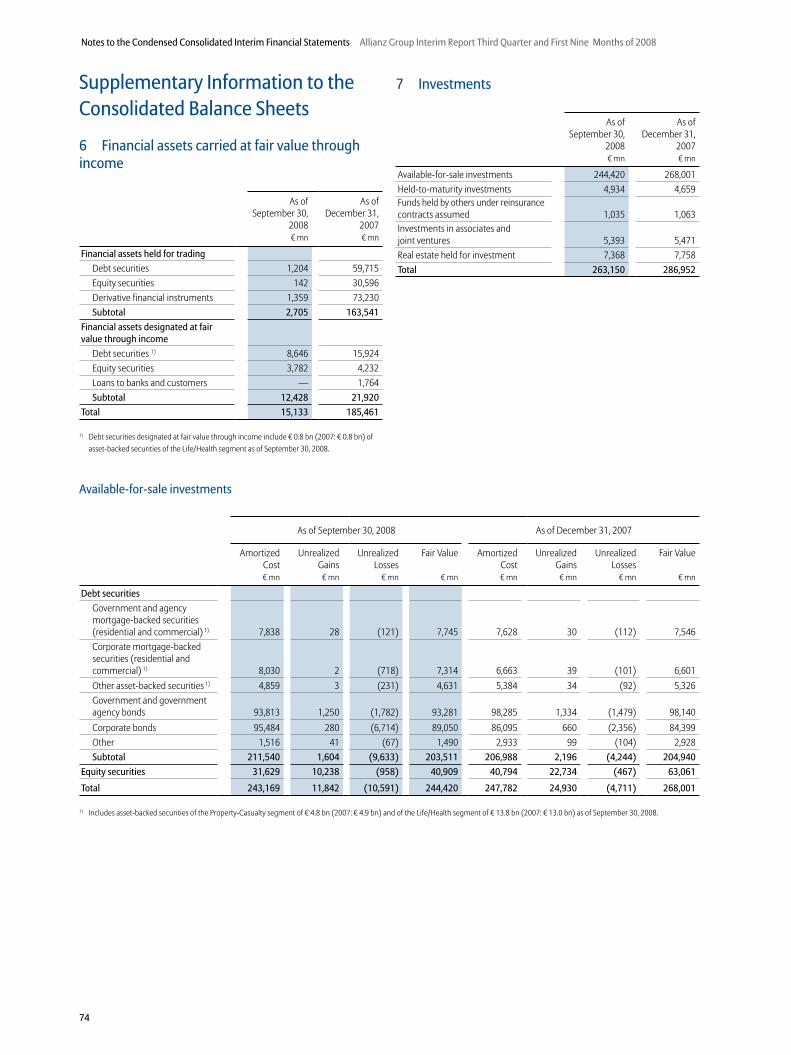
74
Notes to the Condensed Consolidated Interim Financial Statements Allianz Group Interim Report Third Quarter and First Nine Months of 2008
Supplementary Information to the Consolidated Balance Sheets
6 Financial assets carried at fair value through income
As of September 30,
2008
As of December 31,
2007� mn � mn
Financial assets held for trading
Debt securities 1,204 59,715Equity securities 142 30,596Derivative financial instruments 1,359 73,230Subtotal 2,705 163,541
Financial assets designated at fair value through income
Debt securities 1) 8,646 15,924Equity securities 3,782 4,232Loans to banks and customers — 1,764Subtotal 12,428 21,920
Total 15,133 185,461
1) Debt securities designated at fair value through income include � 0.8 bn (2007: � 0.8 bn) of asset-backed securities of the Life/Health segment as of September 30, 2008.
7 Investments
As of September 30,
2008
As of December 31,
2007� mn � mn
Available-for-sale investments 244,420 268,001Held-to-maturity investments 4,934 4,659Funds held by others under reinsurance contracts assumed 1,035 1,063Investments in associates and joint ventures 5,393 5,471Real estate held for investment 7,368 7,758Total 263,150 286,952
Available-for-sale investments
As of September 30, 2008 As of December 31, 2007
Amortized Cost
Unrealized Gains
Unrealized Losses
Fair Value Amortized Cost
Unrealized Gains
Unrealized Losses
Fair Value
� mn � mn � mn � mn � mn � mn � mn � mn
Debt securities
Government and agency mortgage-backed securities (residential and commercial) 1) 7,838 28 (121) 7,745 7,628 30 (112) 7,546Corporate mortgage-backed securities (residential and commercial) 1) 8,030 2 (718) 7,314 6,663 39 (101) 6,601Other asset-backed securities 1) 4,859 3 (231) 4,631 5,384 34 (92) 5,326Government and government agency bonds 93,813 1,250 (1,782) 93,281 98,285 1,334 (1,479) 98,140Corporate bonds 95,484 280 (6,714) 89,050 86,095 660 (2,356) 84,399Other 1,516 41 (67) 1,490 2,933 99 (104) 2,928Subtotal 211,540 1,604 (9,633) 203,511 206,988 2,196 (4,244) 204,940
Equity securities 31,629 10,238 (958) 40,909 40,794 22,734 (467) 63,061
Total 243,169 11,842 (10,591) 244,420 247,782 24,930 (4,711) 268,001
1) Includes asset-backed securities of the Property-Casualty segment of � 4.8 bn (2007: � 4.9 bn) and of the Life/Health segment of � 13.8 bn (2007: � 13.0 bn) as of September 30, 2008.
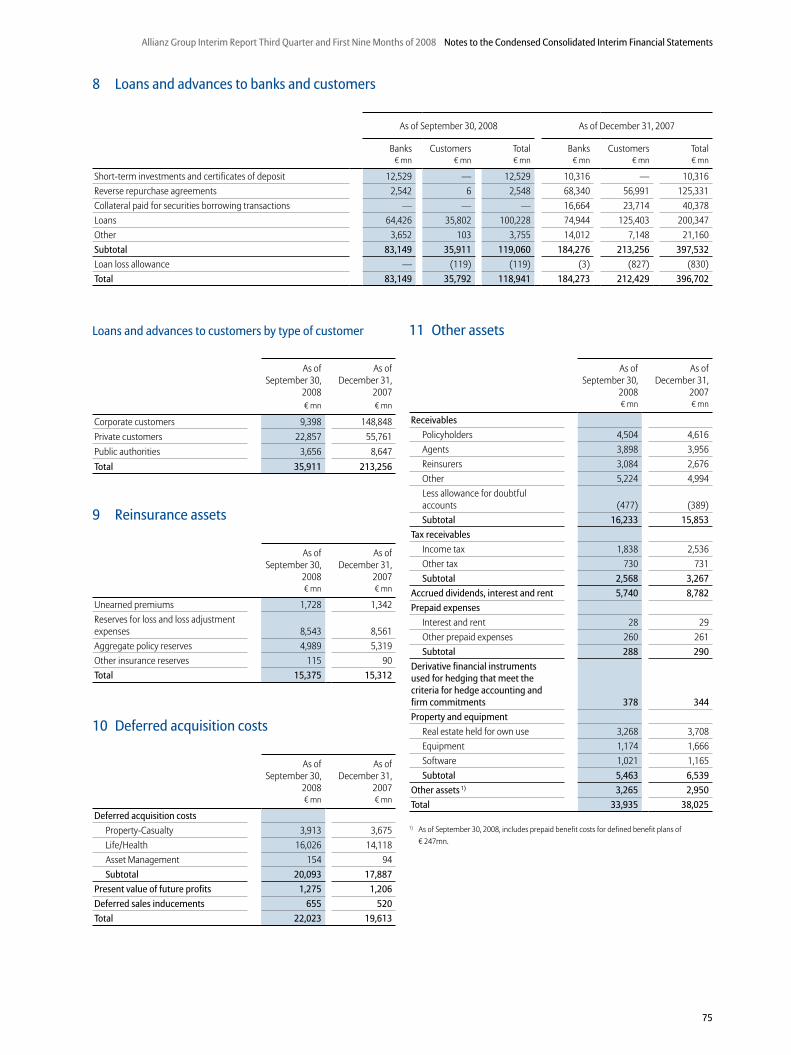
75
Allianz Group Interim Report Third Quarter and First Nine Months of 2008 Notes to the Condensed Consolidated Interim Financial Statements
Loans and advances to customers by type of customer
As of September 30,
2008
As of December 31,
2007� mn � mn
Corporate customers 9,398 148,848Private customers 22,857 55,761Public authorities 3,656 8,647Total 35,911 213,256
9 Reinsurance assets
As of September 30,
2008
As of December 31,
2007� mn � mn
Unearned premiums 1,728 1,342Reserves for loss and loss adjustment expenses 8,543 8,561Aggregate policy reserves 4,989 5,319Other insurance reserves 115 90Total 15,375 15,312
10 Deferred acquisition costs
As of September 30,
2008
As of December 31,
2007� mn � mn
Deferred acquisition costs
Property-Casualty 3,913 3,675Life/Health 16,026 14,118Asset Management 154 94Subtotal 20,093 17,887
Present value of future profits 1,275 1,206
Deferred sales inducements 655 520
Total 22,023 19,613
8 Loans and advances to banks and customers
As of September 30, 2008 As of December 31, 2007
Banks Customers Total Banks Customers Total� mn � mn � mn � mn � mn � mn
Short-term investments and certificates of deposit 12,529 — 12,529 10,316 — 10,316Reverse repurchase agreements 2,542 6 2,548 68,340 56,991 125,331Collateral paid for securities borrowing transactions — — — 16,664 23,714 40,378Loans 64,426 35,802 100,228 74,944 125,403 200,347Other 3,652 103 3,755 14,012 7,148 21,160Subtotal 83,149 35,911 119,060 184,276 213,256 397,532
Loan loss allowance — (119) (119) (3) (827) (830)Total 83,149 35,792 118,941 184,273 212,429 396,702
11 Other assets
As of September 30,
2008
As of December 31,
2007� mn � mn
Receivables
Policyholders 4,504 4,616Agents 3,898 3,956Reinsurers 3,084 2,676Other 5,224 4,994Less allowance for doubtfulaccounts (477) (389)Subtotal 16,233 15,853
Tax receivables
Income tax 1,838 2,536Other tax 730 731Subtotal 2,568 3,267
Accrued dividends, interest and rent 5,740 8,782
Prepaid expenses
Interest and rent 28 29Other prepaid expenses 260 261Subtotal 288 290
Derivative financial instruments used for hedging that meet the criteria for hedge accounting and firm commitments 378 344
Property and equipment
Real estate held for own use 3,268 3,708Equipment 1,174 1,666Software 1,021 1,165Subtotal 5,463 6,539
Other assets 1) 3,265 2,950
Total 33,935 38,025
1) As of September 30, 2008, includes prepaid benefit costs for defined benefit plans of � 247mn.
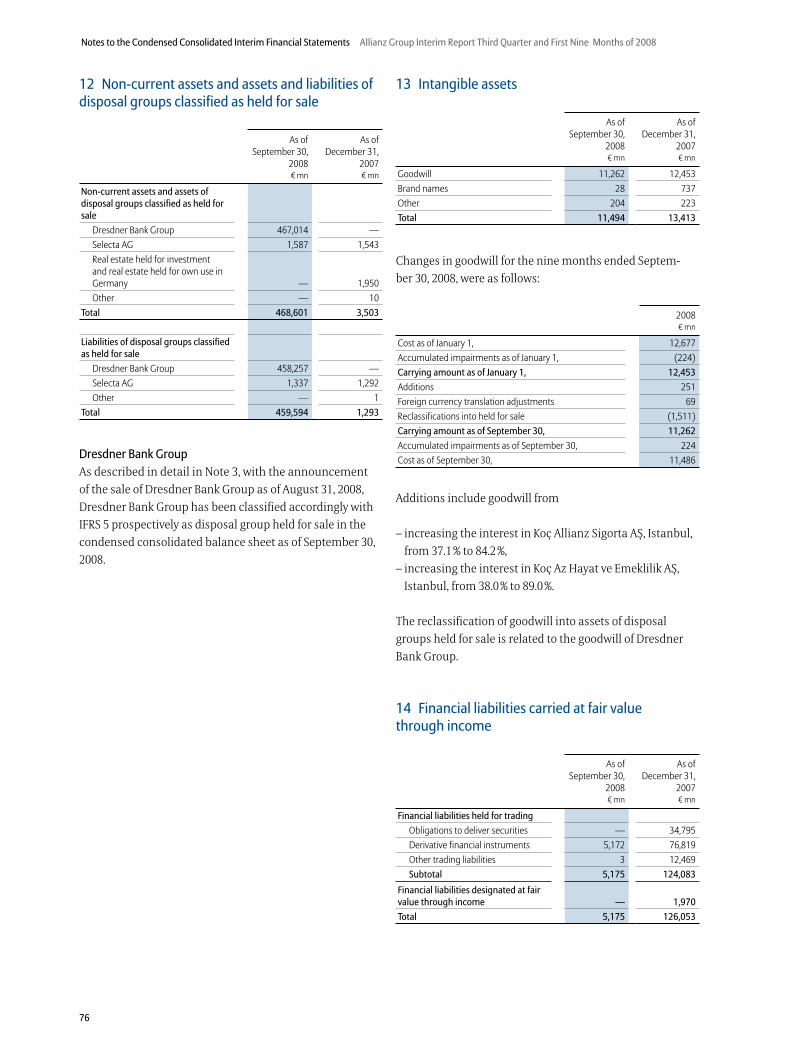
76
Notes to the Condensed Consolidated Interim Financial Statements Allianz Group Interim Report Third Quarter and First Nine Months of 2008
12 Non-current assets and assets and liabilities of disposal groups classified as held for sale
As of September 30,
2008
As of December 31,
2007� mn � mn
Non-current assets and assets of disposal groups classified as held for sale
Dresdner Bank Group 467,014 —Selecta AG 1,587 1,543Real estate held for investment and real estate held for own use in Germany — 1,950Other — 10
Total 468,601 3,503
Liabilities of disposal groups classified as held for sale
Dresdner Bank Group 458,257 —Selecta AG 1,337 1,292Other — 1
Total 459,594 1,293
Dresdner Bank Group
As described in detail in Note 3, with the announcement
of the sale of Dresdner Bank Group as of August 31, 2008,
Dresdner Bank Group has been classified accordingly with
IFRS 5 prospectively as disposal group held for sale in the
condensed consolidated balance sheet as of September 30,
2008.
13 Intangible assets
As of September 30,
2008
As of December 31,
2007� mn � mn
Goodwill 11,262 12,453Brand names 28 737Other 204 223Total 11,494 13,413
Changes in goodwill for the nine months ended Septem-
ber 30, 2008, were as follows:
2008� mn
Cost as of January 1, 12,677Accumulated impairments as of January 1, (224)Carrying amount as of January 1, 12,453
Additions 251Foreign currency translation adjustments 69Reclassifications into held for sale (1,511)Carrying amount as of September 30, 11,262
Accumulated impairments as of September 30, 224Cost as of September 30, 11,486
Additions include goodwill from
– increasing the interest in Koç Allianz Sigorta AŞ, Istanbul,
from 37.1 % to 84.2 %,
– increasing the interest in Koç Az Hayat ve Emeklilik AŞ,
Istanbul, from 38.0 % to 89.0 %.
The reclassification of goodwill into assets of disposal
groups held for sale is related to the goodwill of Dresdner
Bank Group.
14 Financial liabilities carried at fair value through income
As of September 30,
2008
As of December 31,
2007� mn � mn
Financial liabilities held for trading
Obligations to deliver securities — 34,795Derivative financial instruments 5,172 76,819Other trading liabilities 3 12,469Subtotal 5,175 124,083
Financial liabilities designated at fair value through income — 1,970
Total 5,175 126,053
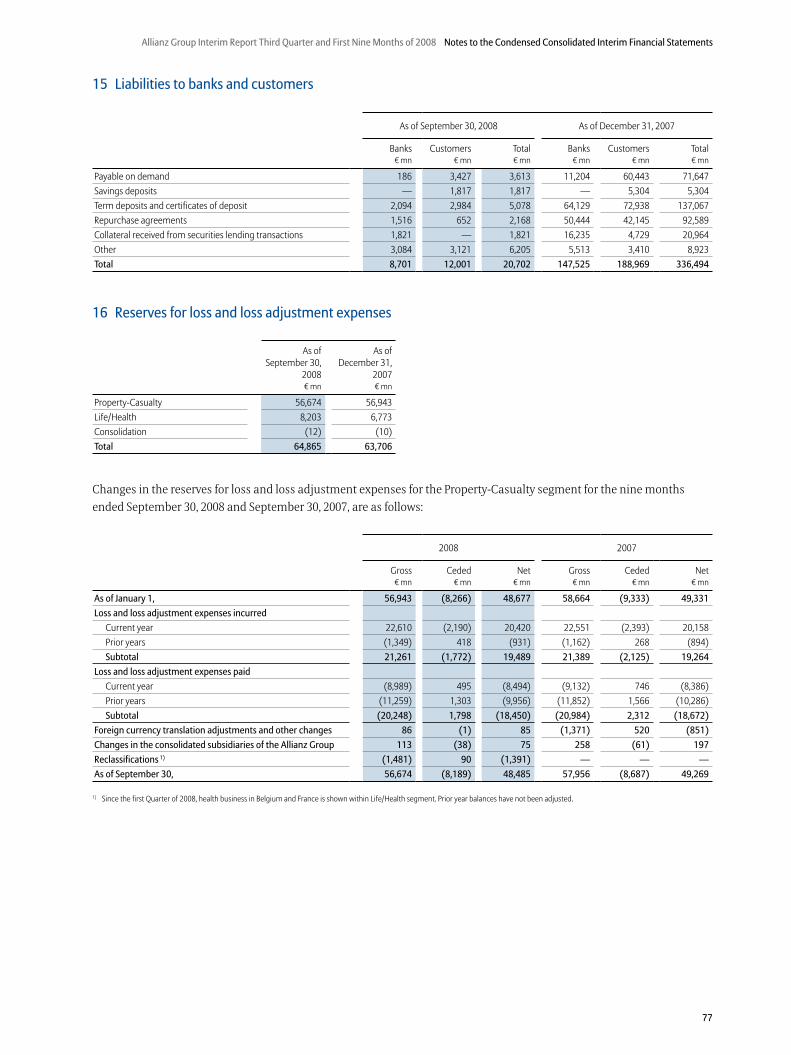
77
Allianz Group Interim Report Third Quarter and First Nine Months of 2008 Notes to the Condensed Consolidated Interim Financial Statements
15 Liabilities to banks and customers
As of September 30, 2008 As of December 31, 2007
Banks Customers Total Banks Customers Total� mn � mn � mn � mn � mn � mn
Payable on demand 186 3,427 3,613 11,204 60,443 71,647Savings deposits — 1,817 1,817 — 5,304 5,304Term deposits and certificates of deposit 2,094 2,984 5,078 64,129 72,938 137,067Repurchase agreements 1,516 652 2,168 50,444 42,145 92,589Collateral received from securities lending transactions 1,821 — 1,821 16,235 4,729 20,964Other 3,084 3,121 6,205 5,513 3,410 8,923Total 8,701 12,001 20,702 147,525 188,969 336,494
16 Reserves for loss and loss adjustment expenses
As of September 30,
2008
As of December 31,
2007� mn � mn
Property-Casualty 56,674 56,943Life/Health 8,203 6,773Consolidation (12) (10)Total 64,865 63,706
Changes in the reserves for loss and loss adjustment expenses for the Property-Casualty segment for the nine months
ended September 30, 2008 and September 30, 2007, are as follows:
2008 2007
Gross Ceded Net Gross Ceded Net� mn � mn � mn � mn � mn � mn
As of January 1, 56,943 (8,266) 48,677 58,664 (9,333) 49,331
Loss and loss adjustment expenses incurred
Current year 22,610 (2,190) 20,420 22,551 (2,393) 20,158Prior years (1,349) 418 (931) (1,162) 268 (894)Subtotal 21,261 (1,772) 19,489 21,389 (2,125) 19,264
Loss and loss adjustment expenses paid
Current year (8,989) 495 (8,494) (9,132) 746 (8,386)Prior years (11,259) 1,303 (9,956) (11,852) 1,566 (10,286)Subtotal (20,248) 1,798 (18,450) (20,984) 2,312 (18,672)
Foreign currency trans lation adjustments and other changes 86 (1) 85 (1,371) 520 (851)
Changes in the consolidated subsidiaries of the Allianz Group 113 (38) 75 258 (61) 197
Reclassifications 1) (1,481) 90 (1,391) — — —
As of September 30, 56,674 (8,189) 48,485 57,956 (8,687) 49,269
1) Since the first Quarter of 2008, health business in Belgium and France is shown within Life/Health segment. Prior year balances have not been adjusted.
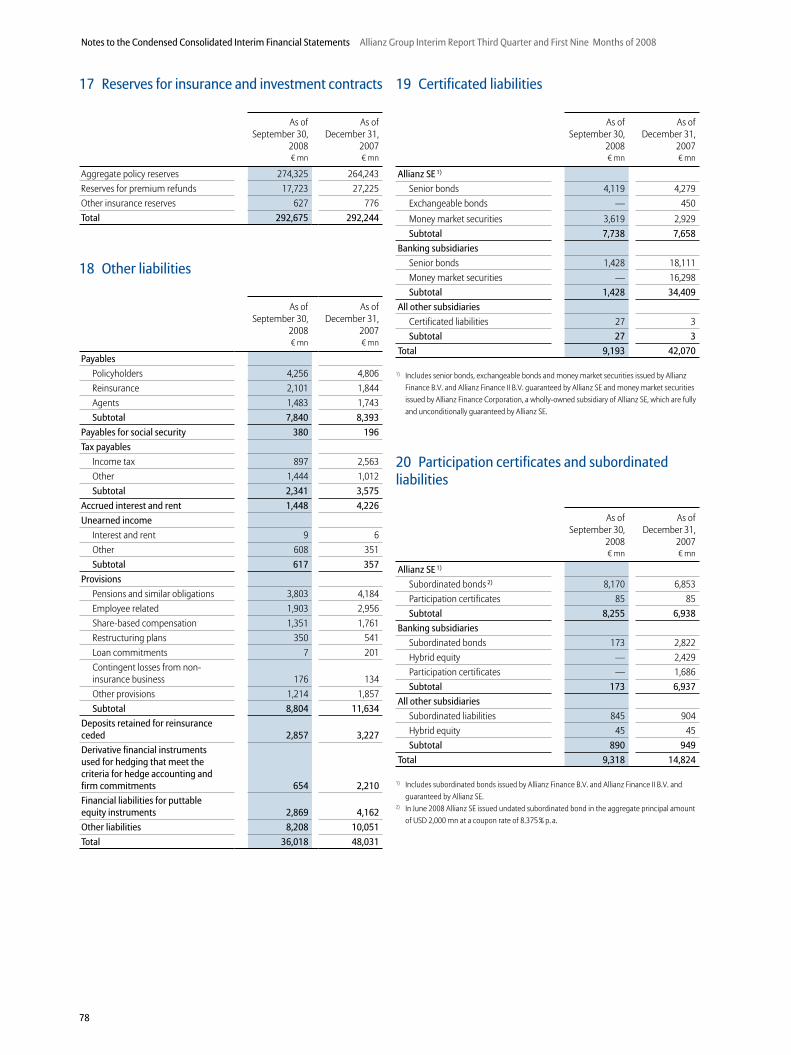
78
Notes to the Condensed Consolidated Interim Financial Statements Allianz Group Interim Report Third Quarter and First Nine Months of 2008
20 Participation certificates and subordinated liabilities
As of September 30,
2008
As of December 31,
2007� mn � mn
Allianz SE 1)
Subordinated bonds 2) 8,170 6,853Participation certificates 85 85Subtotal 8,255 6,938
Banking subsidiaries
Subordinated bonds 173 2,822Hybrid equity — 2,429Participation certificates — 1,686Subtotal 173 6,937
All other subsidiaries
Subordinated liabilities 845 904Hybrid equity 45 45Subtotal 890 949
Total 9,318 14,824
1) Includes subordinated bonds issued by Allianz Finance B.V. and Allianz Finance II B.V. and guaranteed by Allianz SE.
2) In June 2008 Allianz SE issued undated subordinated bond in the aggregate principal amount of USD 2,000 mn at a coupon rate of 8.375 % p. a.
19 Certificated liabilities
As of September 30,
2008
As of December 31,
2007� mn � mn
Allianz SE 1)
Senior bonds 4,119 4,279Exchangeable bonds — 450Money market securities 3,619 2,929Subtotal 7,738 7,658
Banking subsidiaries
Senior bonds 1,428 18,111Money market securities — 16,298Subtotal 1,428 34,409
All other subsidiaries
Certificated liabilities 27 3Subtotal 27 3
Total 9,193 42,070
1) Includes senior bonds, exchangeable bonds and money market securities issued by Allianz Finance B.V. and Allianz Finance II B.V. guaranteed by Allianz SE and money market securities issued by Allianz Finance Corporation, a wholly-owned subsidiary of Allianz SE, which are fully and unconditionally guaranteed by Allianz SE.
18 Other liabilities
As of September 30,
2008
As of December 31,
2007� mn � mn
Payables
Policyholders 4,256 4,806Reinsurance 2,101 1,844Agents 1,483 1,743Subtotal 7,840 8,393
Payables for social security 380 196
Tax payables
Income tax 897 2,563Other 1,444 1,012Subtotal 2,341 3,575
Accrued interest and rent 1,448 4,226
Unearned income
Interest and rent 9 6Other 608 351Subtotal 617 357
Provisions
Pensions and similar obligations 3,803 4,184Employee related 1,903 2,956Share-based compensation 1,351 1,761Restructuring plans 350 541Loan commitments 7 201Contingent losses from non- insurance business 176 134Other provisions 1,214 1,857Subtotal 8,804 11,634
Deposits retained for reinsurance ceded 2,857 3,227
Derivative financial instruments used for hedging that meet the criteria for hedge accounting and firm commitments 654 2,210
Financial liabilities for puttableequity instruments 2,869 4,162
Other liabilities 8,208 10,051
Total 36,018 48,031
17 Reserves for insurance and investment contracts
As of September 30,
2008
As of December 31,
2007� mn � mn
Aggregate policy reserves 274,325 264,243Reserves for premium refunds 17,723 27,225Other insurance reserves 627 776Total 292,675 292,244
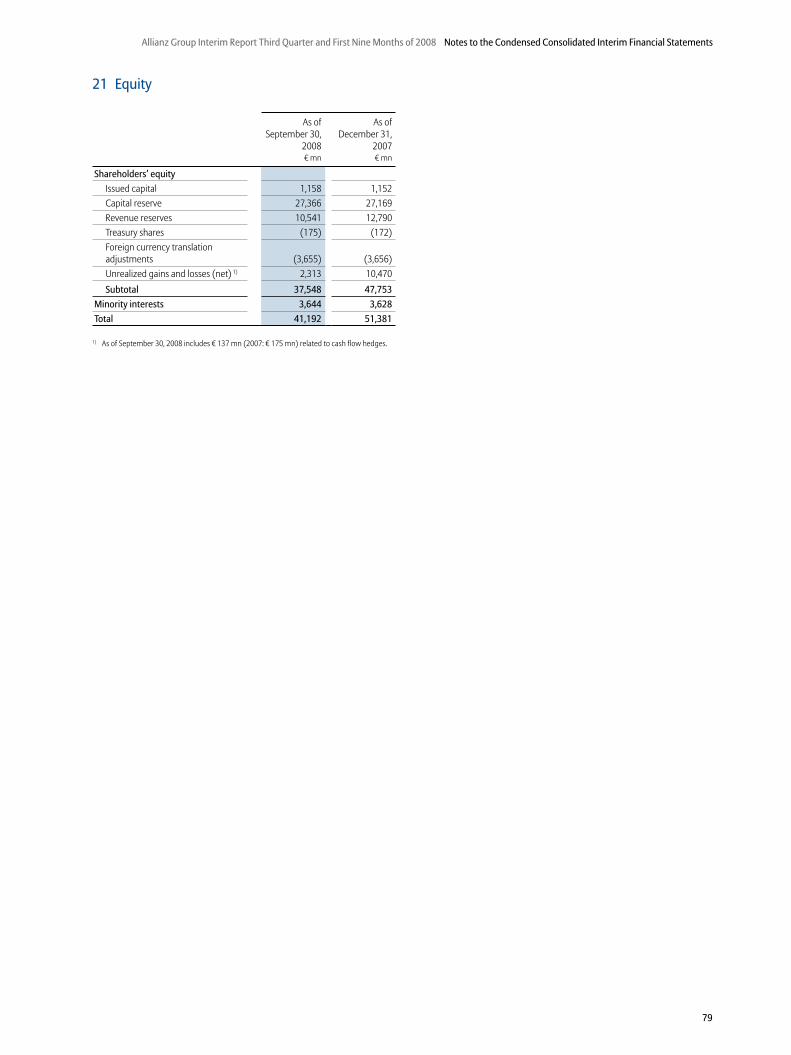
79
Allianz Group Interim Report Third Quarter and First Nine Months of 2008 Notes to the Condensed Consolidated Interim Financial Statements
21 Equity
As of September 30,
2008
As ofDecember 31,
2007� mn � mn
Shareholders’ equity
Issued capital 1,158 1,152Capital reserve 27,366 27,169Revenue reserves 10,541 12,790Treasury shares (175) (172)Foreign currency translation adjustments (3,655) (3,656)Unrealized gains and losses (net) 1) 2,313 10,470
Subtotal 37,548 47,753
Minority interests 3,644 3,628
Total 41,192 51,381
1) As of September 30, 2008 includes � 137 mn (2007: � 175 mn) related to cash flow hedges.
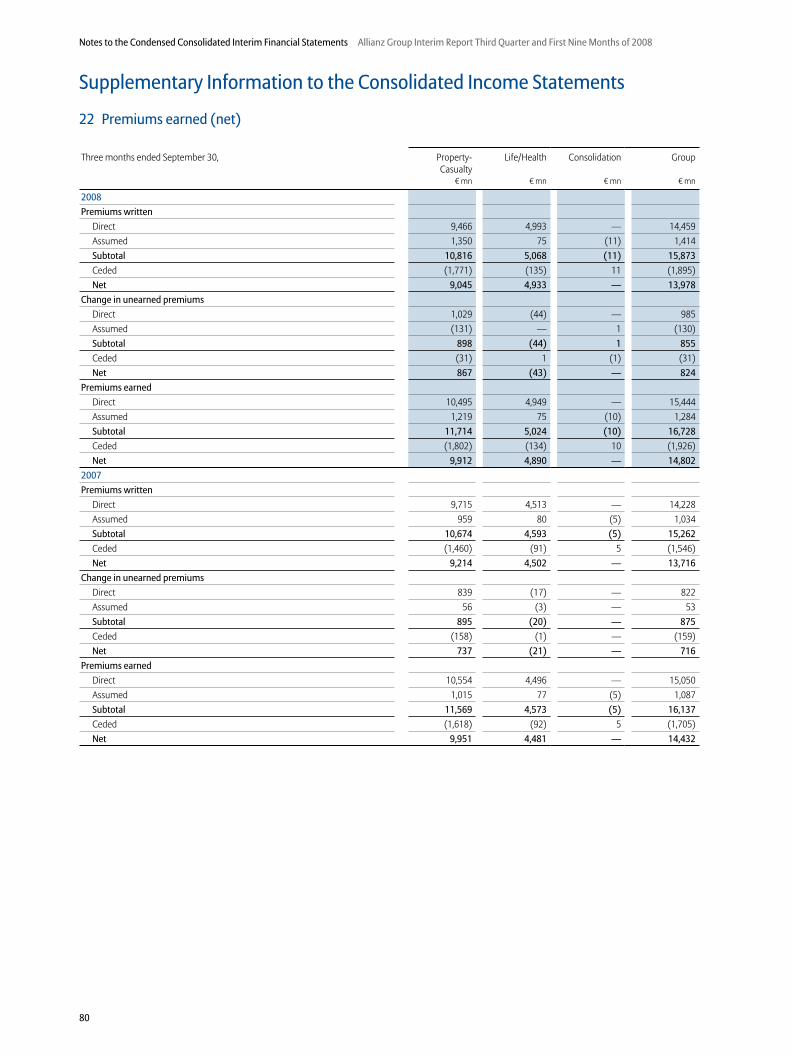
80
Notes to the Condensed Consolidated Interim Financial Statements Allianz Group Interim Report Third Quarter and First Nine Months of 2008
Supplementary Information to the Consolidated Income Statements
22 Premiums earned (net)
Three months ended September 30, Property- Casualty
Life/Health Consolidation Group
� mn � mn � mn � mn
2008
Premiums written
Direct 9,466 4,993 — 14,459Assumed 1,350 75 (11) 1,414Subtotal 10,816 5,068 (11) 15,873
Ceded (1,771) (135) 11 (1,895)Net 9,045 4,933 — 13,978
Change in unearned premiums
Direct 1,029 (44) — 985Assumed (131) — 1 (130)Subtotal 898 (44) 1 855
Ceded (31) 1 (1) (31)Net 867 (43) — 824
Premiums earned
Direct 10,495 4,949 — 15,444Assumed 1,219 75 (10) 1,284Subtotal 11,714 5,024 (10) 16,728
Ceded (1,802) (134) 10 (1,926)Net 9,912 4,890 — 14,802
2007
Premiums written
Direct 9,715 4,513 — 14,228Assumed 959 80 (5) 1,034Subtotal 10,674 4,593 (5) 15,262
Ceded (1,460) (91) 5 (1,546)Net 9,214 4,502 — 13,716
Change in unearned premiums
Direct 839 (17) — 822Assumed 56 (3) — 53Subtotal 895 (20) — 875
Ceded (158) (1) — (159)Net 737 (21) — 716
Premiums earned
Direct 10,554 4,496 — 15,050Assumed 1,015 77 (5) 1,087Subtotal 11,569 4,573 (5) 16,137
Ceded (1,618) (92) 5 (1,705)Net 9,951 4,481 — 14,432
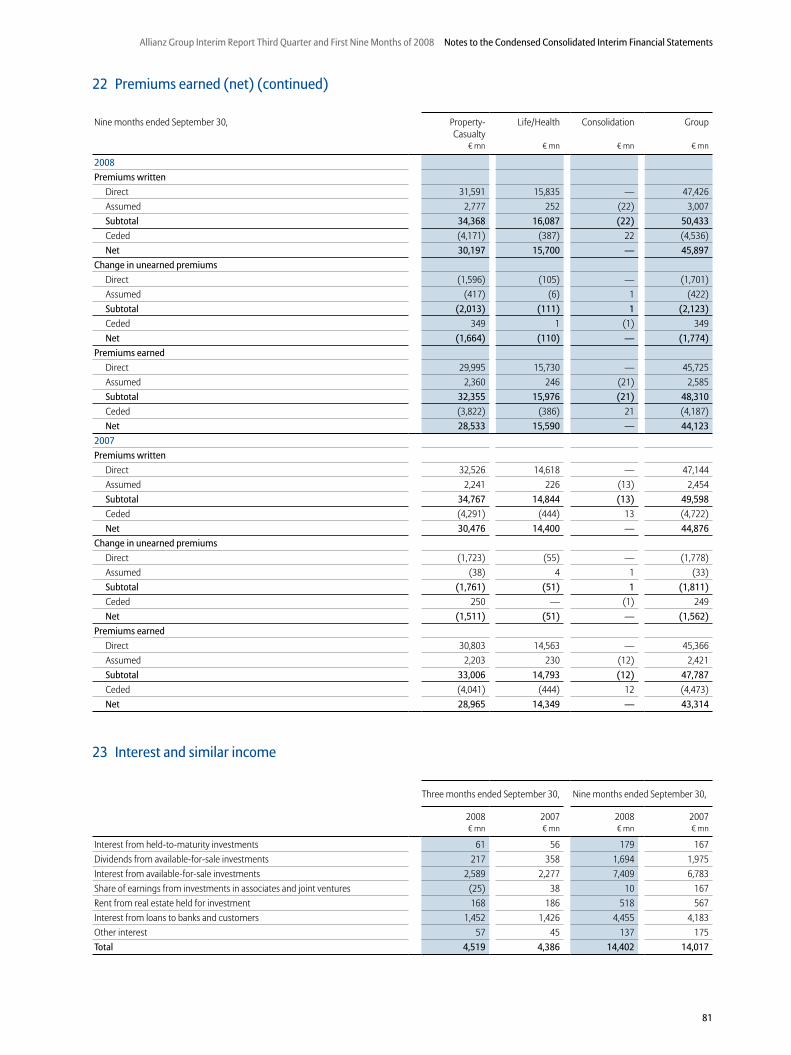
81
Allianz Group Interim Report Third Quarter and First Nine Months of 2008 Notes to the Condensed Consolidated Interim Financial Statements
22 Premiums earned (net) (continued)
Nine months ended September 30, Property- Casualty
Life/Health Consolidation Group
� mn � mn � mn � mn
2008
Premiums written
Direct 31,591 15,835 — 47,426Assumed 2,777 252 (22) 3,007Subtotal 34,368 16,087 (22) 50,433
Ceded (4,171) (387) 22 (4,536)Net 30,197 15,700 — 45,897
Change in unearned premiums
Direct (1,596) (105) — (1,701)Assumed (417) (6) 1 (422)Subtotal (2,013) (111) 1 (2,123)
Ceded 349 1 (1) 349Net (1,664) (110) — (1,774)
Premiums earned
Direct 29,995 15,730 — 45,725Assumed 2,360 246 (21) 2,585Subtotal 32,355 15,976 (21) 48,310
Ceded (3,822) (386) 21 (4,187)Net 28,533 15,590 — 44,123
2007
Premiums written
Direct 32,526 14,618 — 47,144Assumed 2,241 226 (13) 2,454Subtotal 34,767 14,844 (13) 49,598
Ceded (4,291) (444) 13 (4,722)Net 30,476 14,400 — 44,876
Change in unearned premiums
Direct (1,723) (55) — (1,778)Assumed (38) 4 1 (33)Subtotal (1,761) (51) 1 (1,811)
Ceded 250 — (1) 249Net (1,511) (51) — (1,562)
Premiums earned
Direct 30,803 14,563 — 45,366Assumed 2,203 230 (12) 2,421Subtotal 33,006 14,793 (12) 47,787
Ceded (4,041) (444) 12 (4,473)Net 28,965 14,349 — 43,314
23 Interest and similar income
Three months ended September 30, Nine months ended September 30,
2008 2007 2008 2007� mn � mn � mn � mn
Interest from held-to-maturity investments 61 56 179 167Dividends from available-for-sale investments 217 358 1,694 1,975Interest from available-for-sale investments 2,589 2,277 7,409 6,783Share of earnings from investments in associates and joint ventures (25) 38 10 167Rent from real estate held for investment 168 186 518 567Interest from loans to banks and customers 1,452 1,426 4,455 4,183Other interest 57 45 137 175Total 4,519 4,386 14,402 14,017
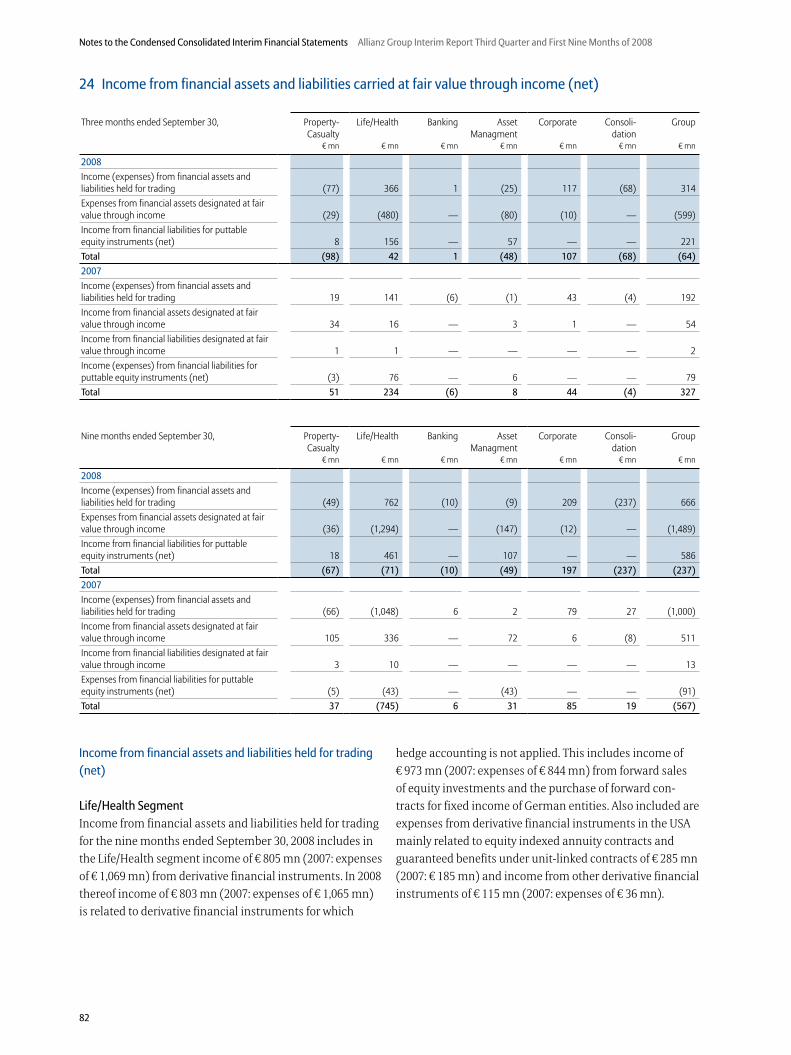
82
Notes to the Condensed Consolidated Interim Financial Statements Allianz Group Interim Report Third Quarter and First Nine Months of 2008
Nine months ended September 30, Property- Casualty
Life/Health Banking Asset Managment
Corporate Consoli-dation
Group
� mn � mn � mn � mn � mn � mn � mn
2008
Income (expenses) from financial assets and liabilities held for trading (49) 762 (10) (9) 209 (237) 666Expenses from financial assets designated at fair value through income (36) (1,294) — (147) (12) — (1,489)Income from financial liabilities for puttable equity instruments (net) 18 461 — 107 — — 586Total (67) (71) (10) (49) 197 (237) (237)
2007
Income (expenses) from financial assets and liabilities held for trading (66) (1,048) 6 2 79 27 (1,000)Income from financial assets designated at fair value through income 105 336 — 72 6 (8) 511Income from financial liabilities designated at fair value through income 3 10 — — — — 13Expenses from financial liabilities for puttable equity instruments (net) (5) (43) — (43) — — (91)Total 37 (745) 6 31 85 19 (567)
24 Income from financial assets and liabilities carried at fair value through income (net)
Three months ended September 30, Property- Casualty
Life/Health Banking Asset Managment
Corporate Consoli-dation
Group
� mn � mn � mn � mn � mn � mn � mn
2008
Income (expenses) from financial assets and liabilities held for trading (77) 366 1 (25) 117 (68) 314Expenses from financial assets designated at fair value through income (29) (480) — (80) (10) — (599)Income from financial liabilities for puttable equity instruments (net) 8 156 — 57 — — 221Total (98) 42 1 (48) 107 (68) (64)
2007
Income (expenses) from financial assets and liabilities held for trading 19 141 (6) (1) 43 (4) 192Income from financial assets designated at fair value through income 34 16 — 3 1 — 54Income from financial liabilities designated at fair value through income 1 1 — — — — 2Income (expenses) from financial liabilities for puttable equity instruments (net) (3) 76 — 6 — — 79Total 51 234 (6) 8 44 (4) 327
hedge accounting is not applied. This includes income of
� 973 mn (2007: expenses of � 844 mn) from forward sales
of equity investments and the purchase of forward con-
tracts for fixed income of German entities. Also included are
expenses from derivative financial instruments in the USA
mainly related to equity indexed annuity con tracts and
guaranteed benefits under unit-linked contracts of � 285 mn
(2007: � 185 mn) and income from other derivative financial
instruments of � 115 mn (2007: expenses of � 36 mn).
Income from financial assets and liabilities held for trading
(net)
Life/Health Segment
Income from financial assets and liabilities held for trading
for the nine months ended September 30, 2008 includes in
the Life/Health segment income of � 805 mn (2007: expenses
of � 1,069 mn) from derivative financial instruments. In 2008
thereof income of � 803 mn (2007: expenses of � 1,065 mn)
is related to derivative financial instruments for which

83
Allianz Group Interim Report Third Quarter and First Nine Months of 2008 Notes to the Condensed Consolidated Interim Financial Statements
25 Realized gains/losses (net)
Three months ended September 30, Nine months ended September 30,
2008 2007 2008 2007� mn � mn � mn � mn
Realized gains
Available-for-sale investments
Equity securities 809 1,183 4,195 5,045Debt securities 127 73 390 314Subtotal 936 1,256 4,585 5,359
Investments in associates and joint ventures 1) 159 112 161 157
Real estate held for investment 14 110 189 327
Loans to banks and customers 9 16 42 33
Subtotal 1,118 1,494 4,977 5,876
Realized losses
Available-for-sale investments
Equity securities (265) (118) (1,234) (256)Debt securities (229) (307) (550) (832)Subtotal (494) (425) (1,784) (1,088)
Investments in associates and joint ventures 2) (1) (48) (1) (49)
Real estate held for investment (15) (3) (109) (43)
Loans to banks and customers (12) (8) (26) (37)
Subtotal (522) (484) (1,920) (1,217)
Total 596 1,010 3,057 4,659
1) During the three and nine months ended September 30, 2008, includes realized gains from the disposal of subsidiaries and businesses of � 143 mn (2007: � 106 mn) and � 143 mn (2007: � 114 mn) respectively.
2) During the three and nine months ended September 30, 2008, includes realized losses from the disposal of subsidiaries of � 1 mn (2007: � 46 mn) and � 1 mn (2007: � 46 mn) respectively.
Corporate Segment
Income from financial assets and liabilities held for trading
for the nine months ended September 30, 2008, includes in
the Corporate segment expenses of � 16 mn (2007: income
of � 88 mn) from derivative financial instruments. In 2008
thereof expenses of � 22 mn (2007: income of � 88 mn) is
related to financial derivative instruments for which hedge
accounting is not applied. This includes income from
derivative financial instruments embedded in exchangeable
bonds of � 133 mn (2007: expenses of � 200 mn), expenses
from derivative financial instruments which partially hedge
the exchangeable bonds, however, which do not qualify for
hedge accounting, of � 7 mn (2007: income of � 164 mn),
and expenses from other derivative financial instruments of
� 149 mn (2007: income of � 124 mn).
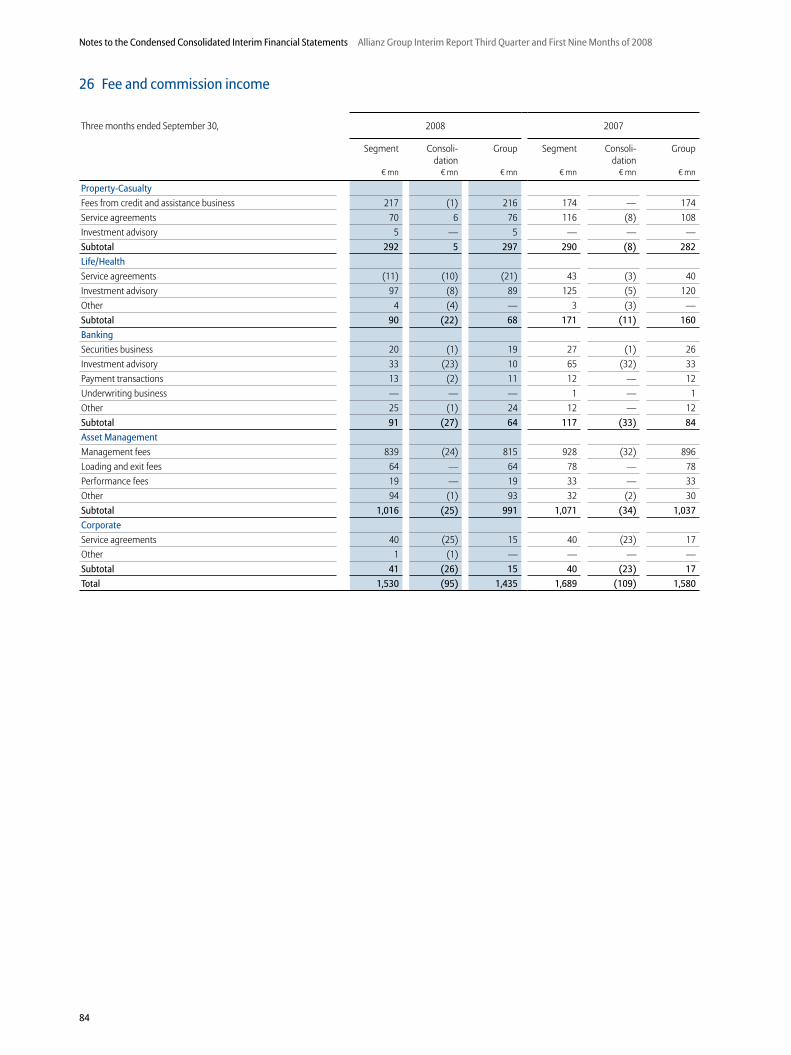
84
Notes to the Condensed Consolidated Interim Financial Statements Allianz Group Interim Report Third Quarter and First Nine Months of 2008
26 Fee and commission income
Three months ended September 30, 2008 2007
Segment Consoli-dation
Group Segment Consoli-dation
Group
� mn � mn � mn � mn � mn � mn
Property-Casualty
Fees from credit and assistance business 217 (1) 216 174 — 174Service agreements 70 6 76 116 (8) 108Investment advisory 5 — 5 — — —Subtotal 292 5 297 290 (8) 282
Life/Health
Service agreements (11) (10) (21) 43 (3) 40Investment advisory 97 (8) 89 125 (5) 120Other 4 (4) — 3 (3) —Subtotal 90 (22) 68 171 (11) 160
Banking
Securities business 20 (1) 19 27 (1) 26Investment advisory 33 (23) 10 65 (32) 33Payment transactions 13 (2) 11 12 — 12Underwriting business — — — 1 — 1Other 25 (1) 24 12 — 12Subtotal 91 (27) 64 117 (33) 84
Asset Management
Management fees 839 (24) 815 928 (32) 896Loading and exit fees 64 — 64 78 — 78Performance fees 19 — 19 33 — 33Other 94 (1) 93 32 (2) 30Subtotal 1,016 (25) 991 1,071 (34) 1,037
Corporate
Service agreements 40 (25) 15 40 (23) 17Other 1 (1) — — — —Subtotal 41 (26) 15 40 (23) 17
Total 1,530 (95) 1,435 1,689 (109) 1,580

85
Allianz Group Interim Report Third Quarter and First Nine Months of 2008 Notes to the Condensed Consolidated Interim Financial Statements
26 Fee and commission income (continued)
Nine months ended September 30, 2008 2007
Segment Consoli-dation
Group Segment Consoli-dation
Group
� mn � mn � mn � mn � mn � mn
Property-Casualty
Fees from credit and assistance business 572 (2) 570 530 (1) 529Service agreements 275 (13) 262 312 (19) 293Investment advisory 5 — 5 — — —Subtotal 852 (15) 837 842 (20) 822
Life/Health
Service agreements 63 (24) 39 134 (10) 124Investment advisory 357 (27) 330 361 (12) 349Other 9 (9) — 11 (11) —Subtotal 429 (60) 369 506 (33) 473
Banking
Securities business 81 (2) 79 108 (1) 107Investment advisory 118 (76) 42 206 (109) 97Payment transactions 39 (2) 37 35 — 35Underwriting business — — — 2 — 2Other 101 (10) 91 44 (3) 41Subtotal 339 (90) 249 395 (113) 282
Asset Management
Management fees 2,520 (84) 2,436 2,670 (92) 2,578Loading and exit fees 194 — 194 240 — 240Performance fees 62 — 62 70 — 70Other 278 (2) 276 244 (6) 238Subtotal 3,054 (86) 2,968 3,224 (98) 3,126
Corporate
Service agreements 151 (79) 72 129 (75) 54Other 2 (2) — — — —Subtotal 153 (81) 72 129 (75) 54
Total 4,827 (332) 4,495 5,096 (339) 4,757
27 Other income
Three months ended September 30, Nine months ended September 30,
2008 2007 2008 2007� mn � mn � mn � mn
Income from real estate held for own use
Realized gains from disposals of real estate held for own use 21 9 373 103Other income from real estate held for own use (5) — 1 1Subtotal 16 9 374 104
Income from non-current assets and disposal groups held for sale — — — 3
Other 7 — 15 1
Total 23 9 389 108
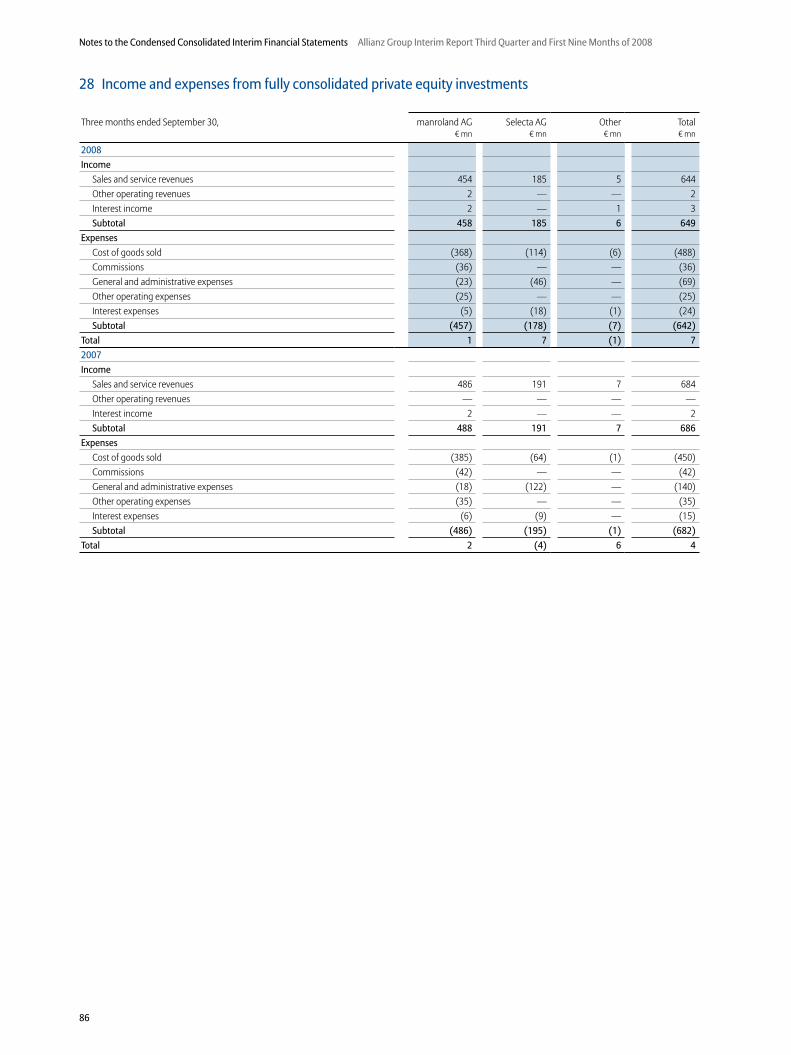
86
Notes to the Condensed Consolidated Interim Financial Statements Allianz Group Interim Report Third Quarter and First Nine Months of 2008
28 Income and expenses from fully consolidated private equity investments
Three months ended September 30, manroland AG Selecta AG Other Total� mn � mn � mn � mn
2008
Income
Sales and service revenues 454 185 5 644Other operating revenues 2 — — 2Interest income 2 — 1 3Subtotal 458 185 6 649
Expenses
Cost of goods sold (368) (114) (6) (488)Commissions (36) — — (36)General and administrative expenses (23) (46) — (69)Other operating expenses (25) — — (25)Interest expenses (5) (18) (1) (24)Subtotal (457) (178) (7) (642)
Total 1 7 (1) 7
2007
Income
Sales and service revenues 486 191 7 684Other operating revenues — — — —Interest income 2 — — 2Subtotal 488 191 7 686
Expenses
Cost of goods sold (385) (64) (1) (450)Commissions (42) — — (42)General and administrative expenses (18) (122) — (140)Other operating expenses (35) — — (35)Interest expenses (6) (9) — (15)Subtotal (486) (195) (1) (682)
Total 2 (4) 6 4
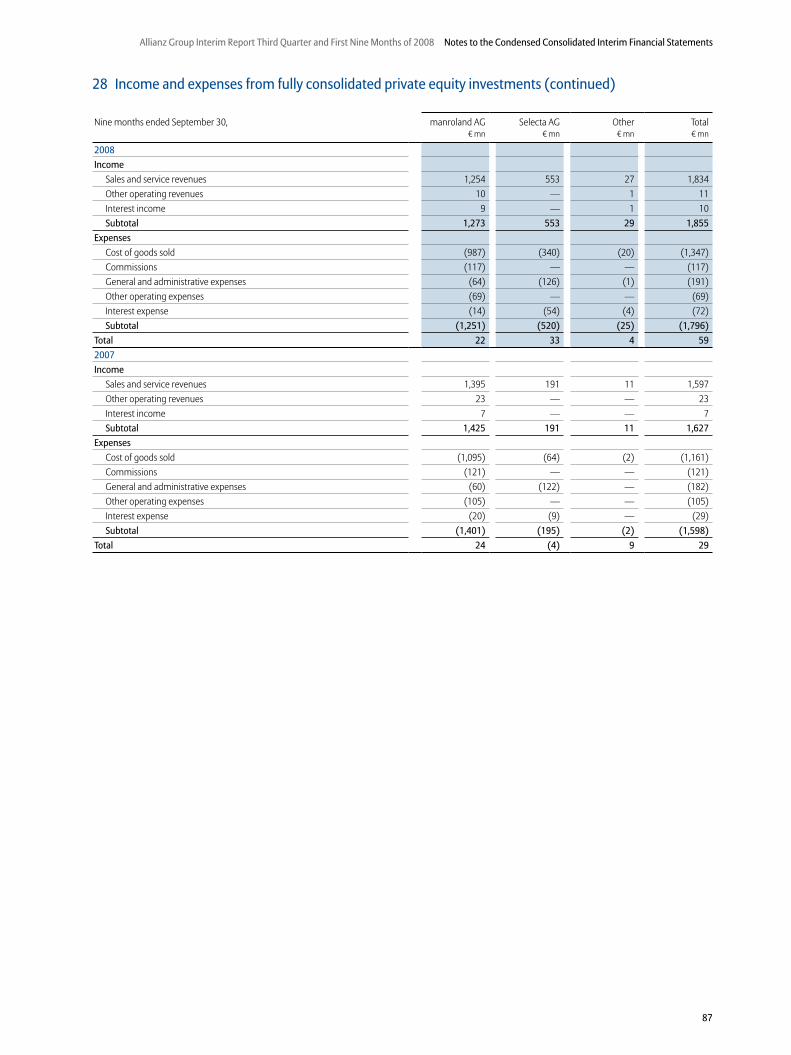
87
Allianz Group Interim Report Third Quarter and First Nine Months of 2008 Notes to the Condensed Consolidated Interim Financial Statements
28 Income and expenses from fully consolidated private equity investments (continued)
Nine months ended September 30, manroland AG Selecta AG Other Total� mn � mn � mn � mn
2008
Income
Sales and service revenues 1,254 553 27 1,834Other operating revenues 10 — 1 11Interest income 9 — 1 10Subtotal 1,273 553 29 1,855
Expenses
Cost of goods sold (987) (340) (20) (1,347)Commissions (117) — — (117)General and administrative expenses (64) (126) (1) (191)Other operating expenses (69) — — (69)Interest expense (14) (54) (4) (72)Subtotal (1,251) (520) (25) (1,796)
Total 22 33 4 59
2007
Income
Sales and service revenues 1,395 191 11 1,597Other operating revenues 23 — — 23Interest income 7 — — 7Subtotal 1,425 191 11 1,627
Expenses
Cost of goods sold (1,095) (64) (2) (1,161)Commissions (121) — — (121)General and administrative expenses (60) (122) — (182)Other operating expenses (105) — — (105)Interest expense (20) (9) — (29)Subtotal (1,401) (195) (2) (1,598)
Total 24 (4) 9 29
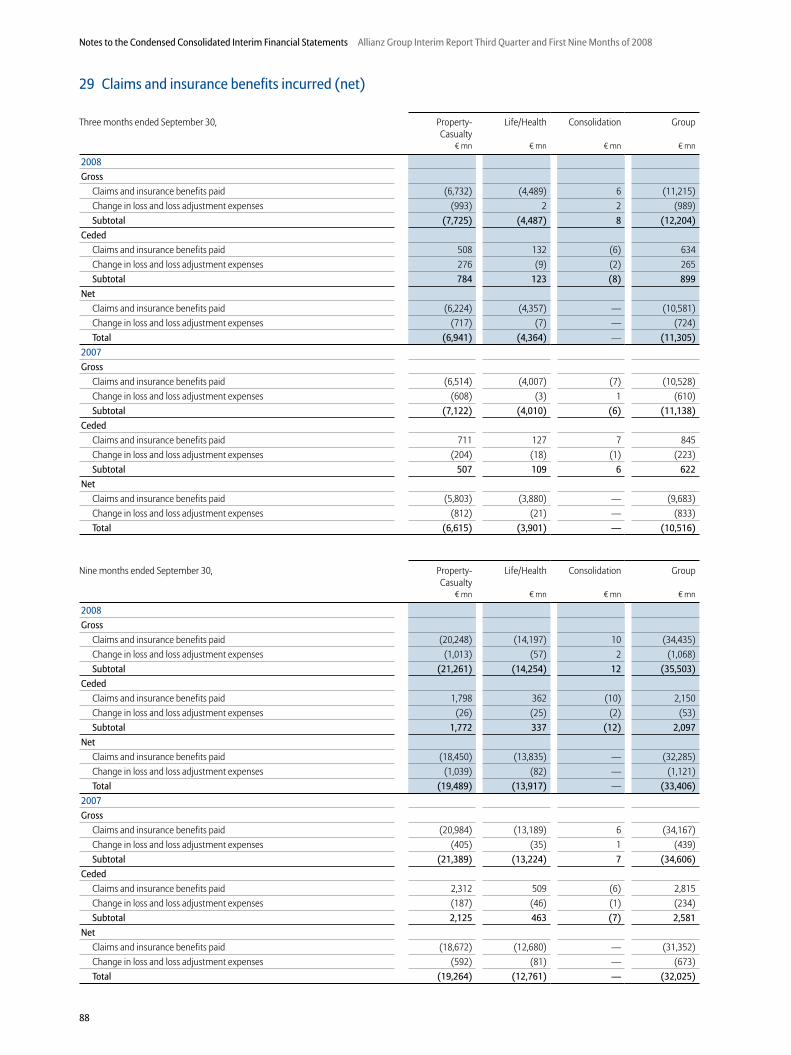
88
Notes to the Condensed Consolidated Interim Financial Statements Allianz Group Interim Report Third Quarter and First Nine Months of 2008
29 Claims and insurance benefits incurred (net)
Three months ended September 30, Property- Casualty
Life/Health Consolidation Group
� mn � mn � mn � mn
2008
Gross
Claims and insurance benefits paid (6,732) (4,489) 6 (11,215)Change in loss and loss adjustment expenses (993) 2 2 (989)Subtotal (7,725) (4,487) 8 (12,204)
Ceded
Claims and insurance benefits paid 508 132 (6) 634Change in loss and loss adjustment expenses 276 (9) (2) 265Subtotal 784 123 (8) 899
Net
Claims and insurance benefits paid (6,224) (4,357) — (10,581)Change in loss and loss adjustment expenses (717) (7) — (724)Total (6,941) (4,364) — (11,305)
2007
Gross
Claims and insurance benefits paid (6,514) (4,007) (7) (10,528)Change in loss and loss adjustment expenses (608) (3) 1 (610)Subtotal (7,122) (4,010) (6) (11,138)
Ceded
Claims and insurance benefits paid 711 127 7 845Change in loss and loss adjustment expenses (204) (18) (1) (223)Subtotal 507 109 6 622
Net
Claims and insurance benefits paid (5,803) (3,880) — (9,683)Change in loss and loss adjustment expenses (812) (21) — (833)Total (6,615) (3,901) — (10,516)
Nine months ended September 30, Property- Casualty
Life/Health Consolidation Group
� mn � mn � mn � mn
2008
Gross
Claims and insurance benefits paid (20,248) (14,197) 10 (34,435)Change in loss and loss adjustment expenses (1,013) (57) 2 (1,068)Subtotal (21,261) (14,254) 12 (35,503)
Ceded
Claims and insurance benefits paid 1,798 362 (10) 2,150Change in loss and loss adjustment expenses (26) (25) (2) (53)Subtotal 1,772 337 (12) 2,097
Net
Claims and insurance benefits paid (18,450) (13,835) — (32,285)Change in loss and loss adjustment expenses (1,039) (82) — (1,121)Total (19,489) (13,917) — (33,406)
2007
Gross
Claims and insurance benefits paid (20,984) (13,189) 6 (34,167)Change in loss and loss adjustment expenses (405) (35) 1 (439)Subtotal (21,389) (13,224) 7 (34,606)
Ceded
Claims and insurance benefits paid 2,312 509 (6) 2,815Change in loss and loss adjustment expenses (187) (46) (1) (234)Subtotal 2,125 463 (7) 2,581
Net
Claims and insurance benefits paid (18,672) (12,680) — (31,352)Change in loss and loss adjustment expenses (592) (81) — (673)Total (19,264) (12,761) — (32,025)
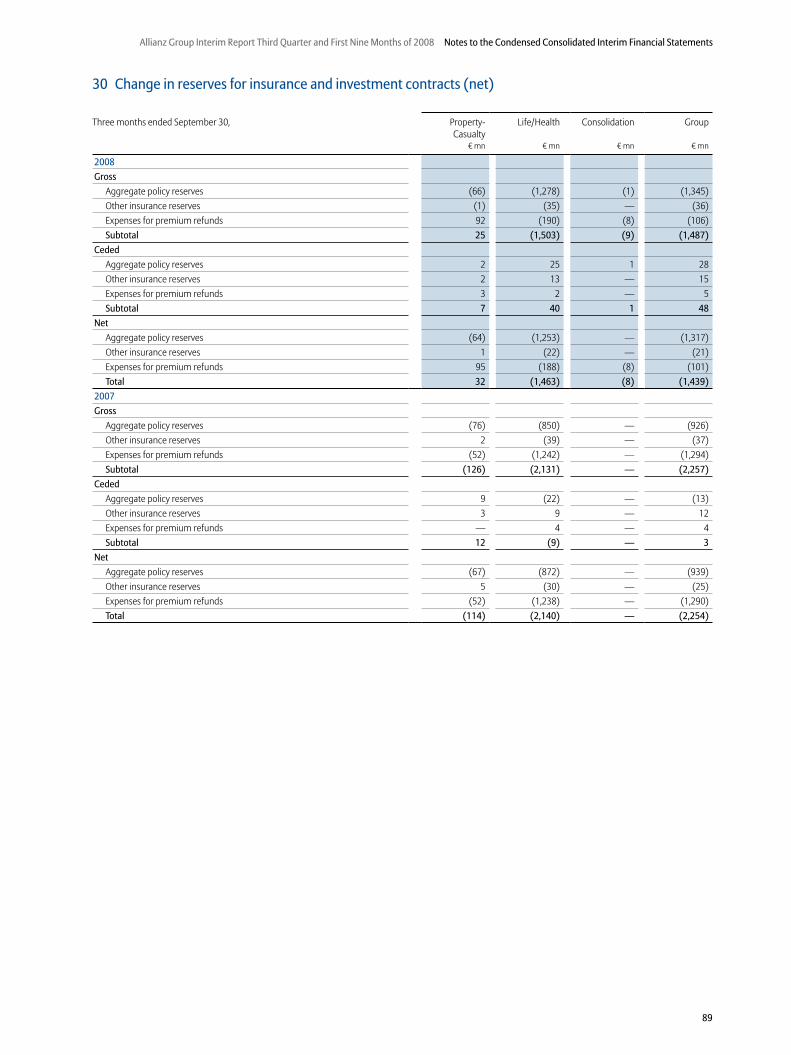
89
Allianz Group Interim Report Third Quarter and First Nine Months of 2008 Notes to the Condensed Consolidated Interim Financial Statements
30 Change in reserves for insurance and investment contracts (net)
Three months ended September 30, Property- Casualty
Life/Health Consolidation Group
� mn � mn � mn � mn
2008
Gross
Aggregate policy reserves (66) (1,278) (1) (1,345)Other insurance reserves (1) (35) — (36)Expenses for premium refunds 92 (190) (8) (106)Subtotal 25 (1,503) (9) (1,487)
Ceded
Aggregate policy reserves 2 25 1 28Other insurance reserves 2 13 — 15Expenses for premium refunds 3 2 — 5Subtotal 7 40 1 48
Net
Aggregate policy reserves (64) (1,253) — (1,317)Other insurance reserves 1 (22) — (21)Expenses for premium refunds 95 (188) (8) (101)Total 32 (1,463) (8) (1,439)
2007
Gross
Aggregate policy reserves (76) (850) — (926)Other insurance reserves 2 (39) — (37)Expenses for premium refunds (52) (1,242) — (1,294)Subtotal (126) (2,131) — (2,257)
Ceded
Aggregate policy reserves 9 (22) — (13)Other insurance reserves 3 9 — 12Expenses for premium refunds — 4 — 4Subtotal 12 (9) — 3
Net
Aggregate policy reserves (67) (872) — (939)Other insurance reserves 5 (30) — (25)Expenses for premium refunds (52) (1,238) — (1,290)Total (114) (2,140) — (2,254)
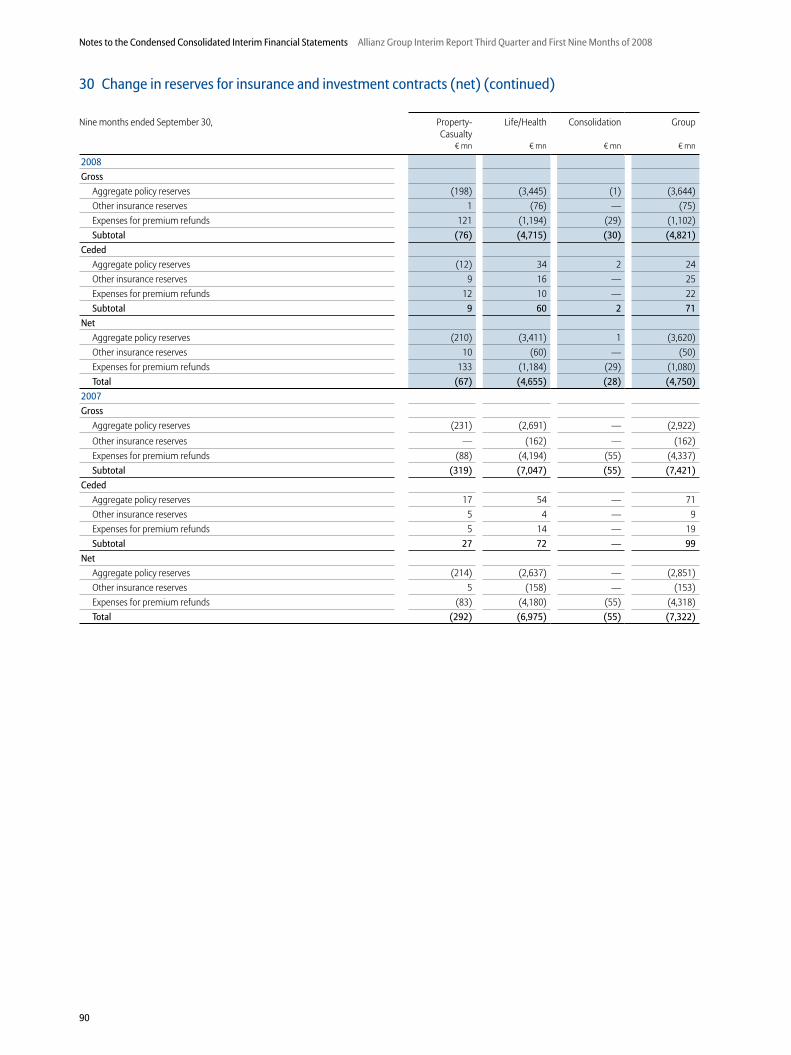
90
Notes to the Condensed Consolidated Interim Financial Statements Allianz Group Interim Report Third Quarter and First Nine Months of 2008
30 Change in reserves for insurance and investment contracts (net) (continued)
Nine months ended September 30, Property- Casualty
Life/Health Consolidation Group
� mn � mn � mn � mn
2008
Gross
Aggregate policy reserves (198) (3,445) (1) (3,644)Other insurance reserves 1 (76) — (75)Expenses for premium refunds 121 (1,194) (29) (1,102)Subtotal (76) (4,715) (30) (4,821)
Ceded
Aggregate policy reserves (12) 34 2 24Other insurance reserves 9 16 — 25Expenses for premium refunds 12 10 — 22Subtotal 9 60 2 71
Net
Aggregate policy reserves (210) (3,411) 1 (3,620)Other insurance reserves 10 (60) — (50)Expenses for premium refunds 133 (1,184) (29) (1,080)Total (67) (4,655) (28) (4,750)
2007
Gross
Aggregate policy reserves (231) (2,691) — (2,922)Other insurance reserves — (162) — (162)Expenses for premium refunds (88) (4,194) (55) (4,337)Subtotal (319) (7,047) (55) (7,421)
Ceded
Aggregate policy reserves 17 54 — 71Other insurance reserves 5 4 — 9Expenses for premium refunds 5 14 — 19Subtotal 27 72 — 99
Net
Aggregate policy reserves (214) (2,637) — (2,851)Other insurance reserves 5 (158) — (153)Expenses for premium refunds (83) (4,180) (55) (4,318)Total (292) (6,975) (55) (7,322)
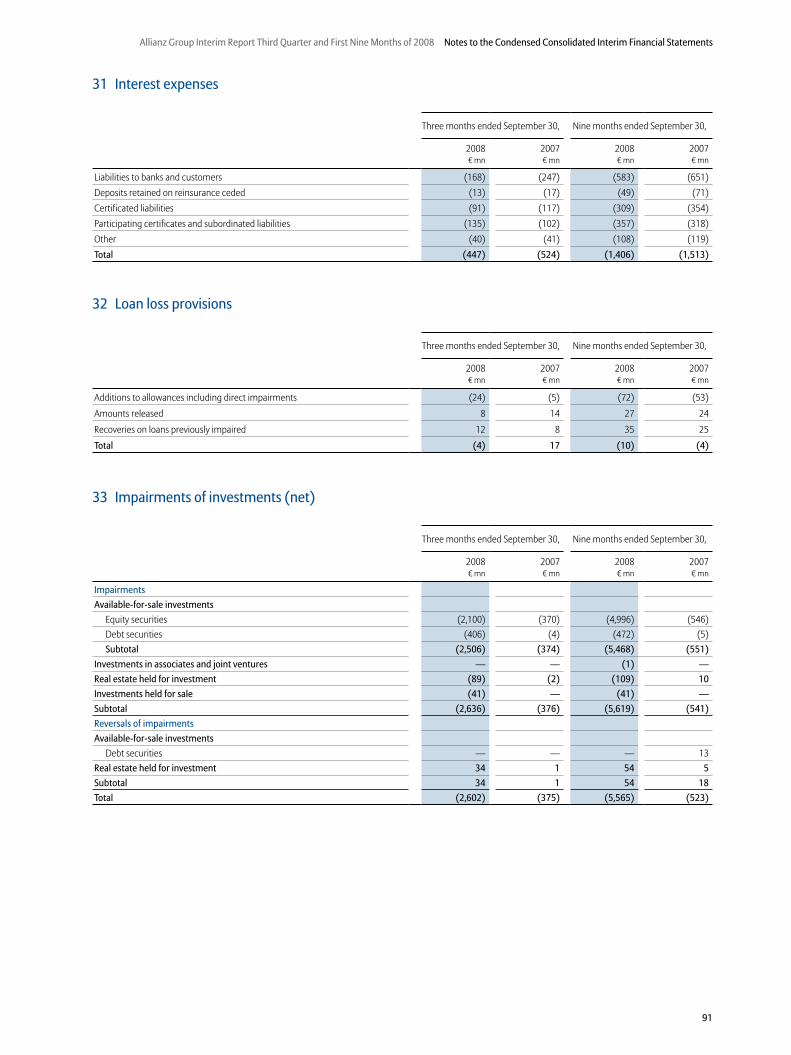
91
Allianz Group Interim Report Third Quarter and First Nine Months of 2008 Notes to the Condensed Consolidated Interim Financial Statements
33 Impairments of investments (net)
Three months ended September 30, Nine months ended September 30,
2008 2007 2008 2007� mn � mn � mn � mn
Impairments
Available-for-sale investments
Equity securities (2,100) (370) (4,996) (546)Debt securities (406) (4) (472) (5)Subtotal (2,506) (374) (5,468) (551)
Investments in associates and joint ventures — — (1) —
Real estate held for investment (89) (2) (109) 10
Investments held for sale (41) — (41) —
Subtotal (2,636) (376) (5,619) (541)
Reversals of impairments
Available-for-sale investments
Debt securities — — — 13Real estate held for investment 34 1 54 5
Subtotal 34 1 54 18
Total (2,602) (375) (5,565) (523)
31 Interest expenses
Three months ended September 30, Nine months ended September 30,
2008 2007 2008 2007� mn � mn � mn � mn
Liabilities to banks and customers (168) (247) (583) (651)Deposits retained on reinsurance ceded (13) (17) (49) (71)Certificated liabilities (91) (117) (309) (354)Participating certificates and subordinated liabilities (135) (102) (357) (318)Other (40) (41) (108) (119)Total (447) (524) (1,406) (1,513)
32 Loan loss provisions
Three months ended September 30, Nine months ended September 30,
2008 2007 2008 2007� mn � mn � mn � mn
Additions to allowances including direct impairments (24) (5) (72) (53)
Amounts released 8 14 27 24
Recoveries on loans previously impaired 12 8 35 25
Total (4) 17 (10) (4)
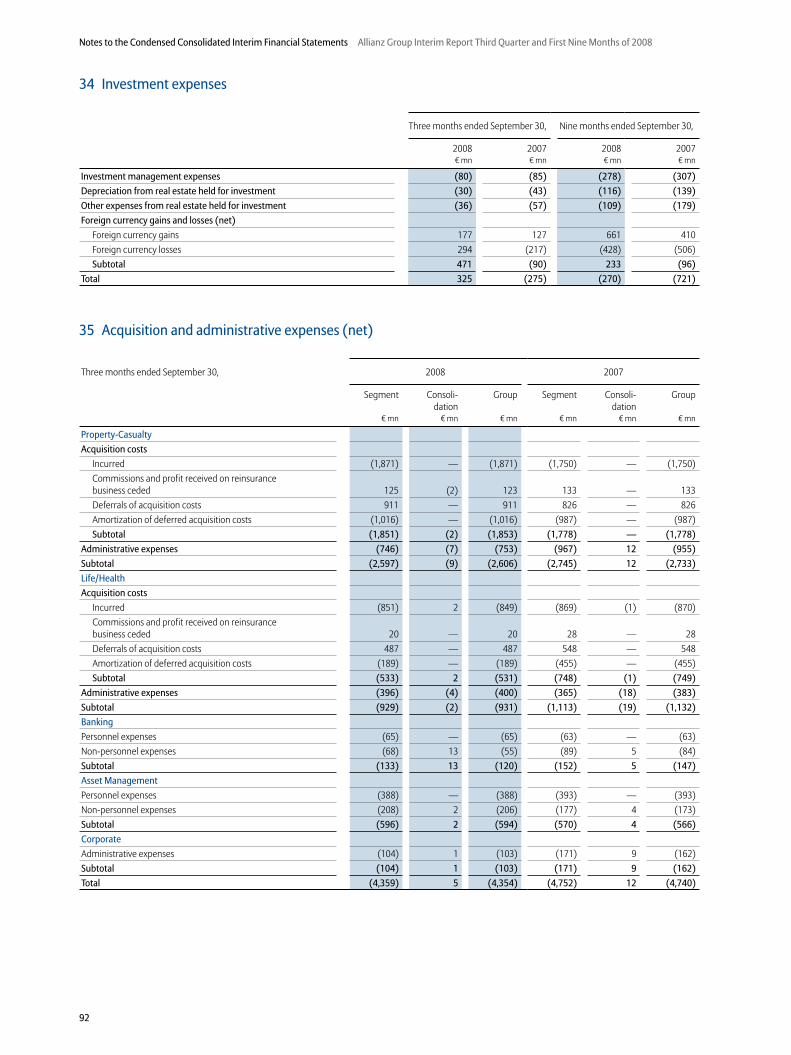
92
Notes to the Condensed Consolidated Interim Financial Statements Allianz Group Interim Report Third Quarter and First Nine Months of 2008
34 Investment expenses
Three months ended September 30, Nine months ended September 30,
2008 2007 2008 2007� mn � mn � mn � mn
Investment management expenses (80) (85) (278) (307)
Depreciation from real estate held for investment (30) (43) (116) (139)
Other expenses from real estate held for investment (36) (57) (109) (179)
Foreign currency gains and losses (net)
Foreign currency gains 177 127 661 410Foreign currency losses 294 (217) (428) (506)Subtotal 471 (90) 233 (96)
Total 325 (275) (270) (721)
35 Acquisition and administrative expenses (net)
Three months ended September 30, 2008 2007
Segment Consoli-dation
Group Segment Consoli-dation
Group
� mn � mn � mn � mn � mn � mn
Property-Casualty
Acquisition costs
Incurred (1,871) — (1,871) (1,750) — (1,750)Commissions and profit received on reinsurance business ceded 125 (2) 123 133 — 133Deferrals of acquisition costs 911 — 911 826 — 826Amortization of deferred acquisition costs (1,016) — (1,016) (987) — (987)Subtotal (1,851) (2) (1,853) (1,778) — (1,778)
Administrative expenses (746) (7) (753) (967) 12 (955)
Subtotal (2,597) (9) (2,606) (2,745) 12 (2,733)
Life/Health
Acquisition costs
Incurred (851) 2 (849) (869) (1) (870)Commissions and profit received on reinsurance business ceded 20 — 20 28 — 28Deferrals of acquisition costs 487 — 487 548 — 548Amortization of deferred acquisition costs (189) — (189) (455) — (455)Subtotal (533) 2 (531) (748) (1) (749)
Administrative expenses (396) (4) (400) (365) (18) (383)
Subtotal (929) (2) (931) (1,113) (19) (1,132)
Banking
Personnel expenses (65) — (65) (63) — (63)Non-personnel expenses (68) 13 (55) (89) 5 (84)Subtotal (133) 13 (120) (152) 5 (147)
Asset Management
Personnel expenses (388) — (388) (393) — (393)Non-personnel expenses (208) 2 (206) (177) 4 (173)Subtotal (596) 2 (594) (570) 4 (566)
Corporate
Administrative expenses (104) 1 (103) (171) 9 (162)Subtotal (104) 1 (103) (171) 9 (162)
Total (4,359) 5 (4,354) (4,752) 12 (4,740)
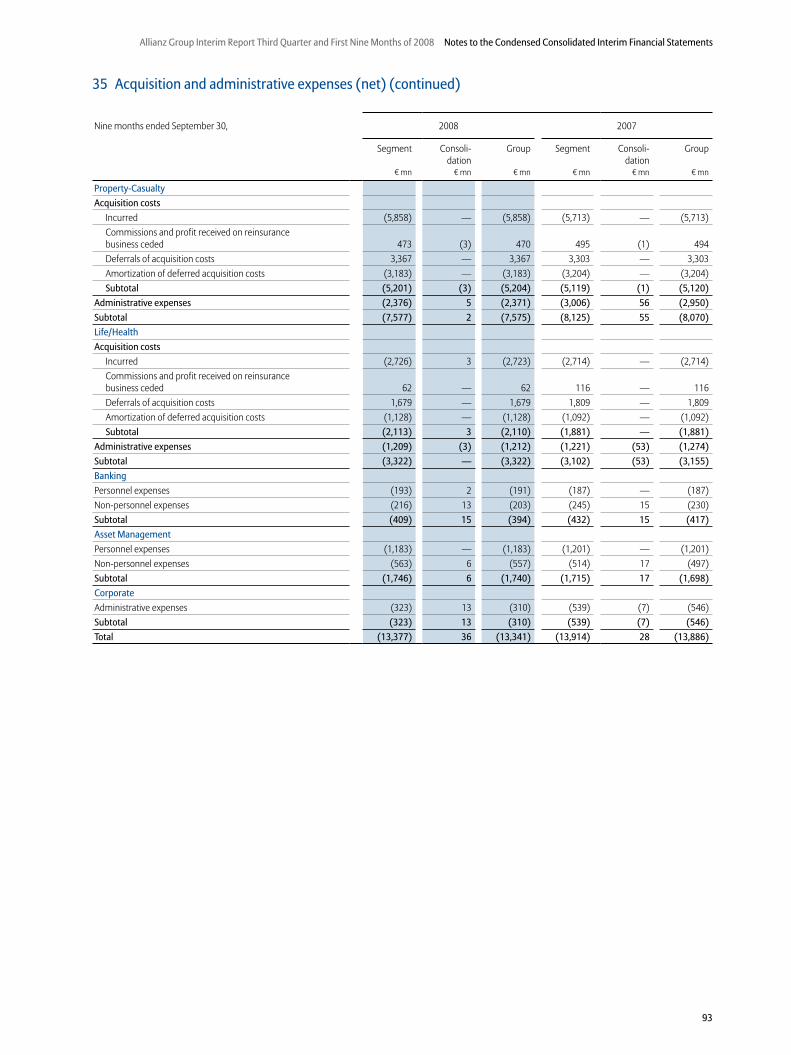
93
Allianz Group Interim Report Third Quarter and First Nine Months of 2008 Notes to the Condensed Consolidated Interim Financial Statements
35 Acquisition and administrative expenses (net) (continued)
Nine months ended September 30, 2008 2007
Segment Consoli-dation
Group Segment Consoli-dation
Group
� mn � mn � mn � mn � mn � mn
Property-Casualty
Acquisition costs
Incurred (5,858) — (5,858) (5,713) — (5,713)Commissions and profit received on reinsurance business ceded 473 (3) 470 495 (1) 494Deferrals of acquisition costs 3,367 — 3,367 3,303 — 3,303Amortization of deferred acquisition costs (3,183) — (3,183) (3,204) — (3,204)Subtotal (5,201) (3) (5,204) (5,119) (1) (5,120)
Administrative expenses (2,376) 5 (2,371) (3,006) 56 (2,950)
Subtotal (7,577) 2 (7,575) (8,125) 55 (8,070)
Life/Health
Acquisition costs
Incurred (2,726) 3 (2,723) (2,714) — (2,714)Commissions and profit received on reinsurance business ceded 62 — 62 116 — 116Deferrals of acquisition costs 1,679 — 1,679 1,809 — 1,809Amortization of deferred acquisition costs (1,128) — (1,128) (1,092) — (1,092)Subtotal (2,113) 3 (2,110) (1,881) — (1,881)
Administrative expenses (1,209) (3) (1,212) (1,221) (53) (1,274)
Subtotal (3,322) — (3,322) (3,102) (53) (3,155)
Banking
Personnel expenses (193) 2 (191) (187) — (187)Non-personnel expenses (216) 13 (203) (245) 15 (230)Subtotal (409) 15 (394) (432) 15 (417)
Asset Management
Personnel expenses (1,183) — (1,183) (1,201) — (1,201)Non-personnel expenses (563) 6 (557) (514) 17 (497)Subtotal (1,746) 6 (1,740) (1,715) 17 (1,698)
Corporate
Administrative expenses (323) 13 (310) (539) (7) (546)Subtotal (323) 13 (310) (539) (7) (546)
Total (13,377) 36 (13,341) (13,914) 28 (13,886)
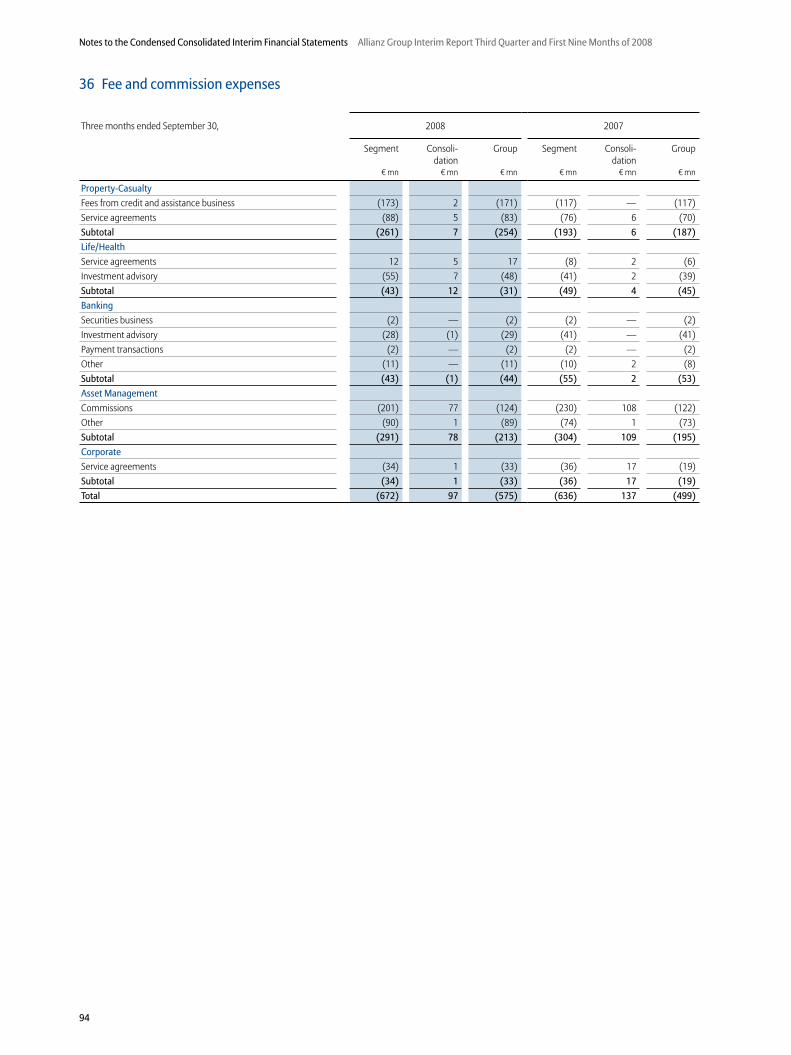
94
Notes to the Condensed Consolidated Interim Financial Statements Allianz Group Interim Report Third Quarter and First Nine Months of 2008
36 Fee and commission expenses
Three months ended September 30, 2008 2007
Segment Consoli-dation
Group Segment Consoli-dation
Group
� mn � mn � mn � mn � mn � mn
Property-Casualty
Fees from credit and assistance business (173) 2 (171) (117) — (117)Service agreements (88) 5 (83) (76) 6 (70)Subtotal (261) 7 (254) (193) 6 (187)
Life/Health
Service agreements 12 5 17 (8) 2 (6)Investment advisory (55) 7 (48) (41) 2 (39)Subtotal (43) 12 (31) (49) 4 (45)
Banking
Securities business (2) — (2) (2) — (2)Investment advisory (28) (1) (29) (41) — (41)Payment transactions (2) — (2) (2) — (2)Other (11) — (11) (10) 2 (8)Subtotal (43) (1) (44) (55) 2 (53)
Asset Management
Commissions (201) 77 (124) (230) 108 (122)Other (90) 1 (89) (74) 1 (73)Subtotal (291) 78 (213) (304) 109 (195)
Corporate
Service agreements (34) 1 (33) (36) 17 (19)Subtotal (34) 1 (33) (36) 17 (19)
Total (672) 97 (575) (636) 137 (499)
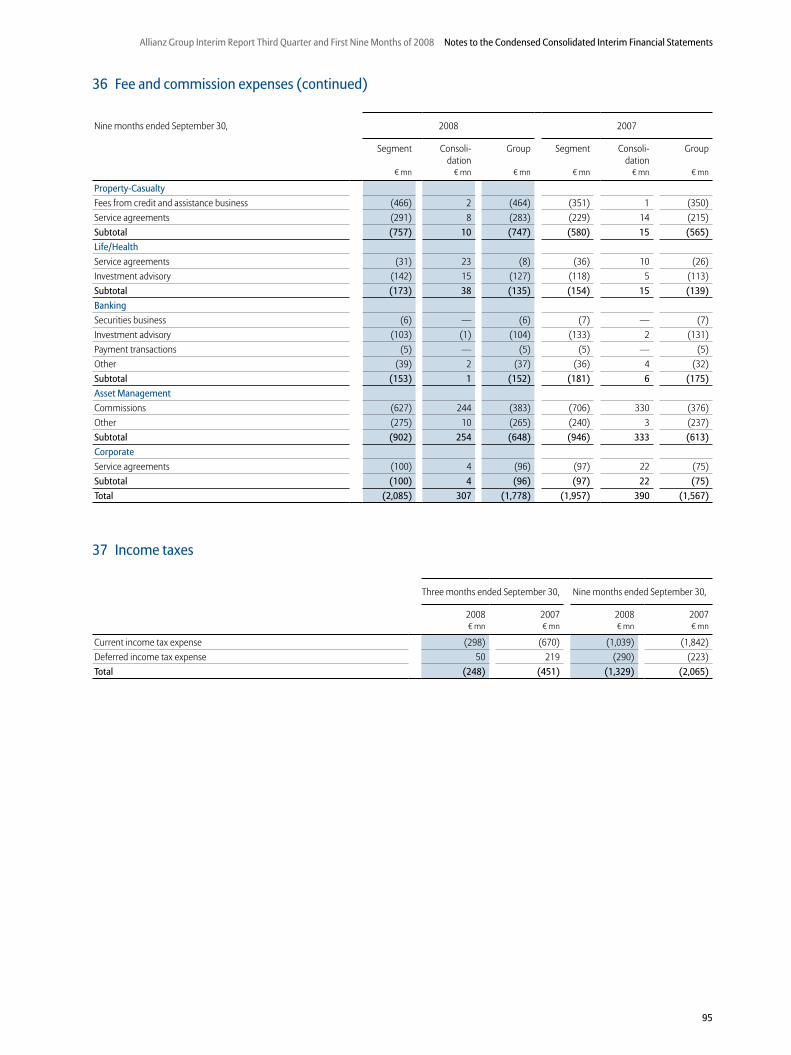
95
Allianz Group Interim Report Third Quarter and First Nine Months of 2008 Notes to the Condensed Consolidated Interim Financial Statements
37 Income taxes
Three months ended September 30, Nine months ended September 30,
2008 2007 2008 2007� mn � mn � mn � mn
Current income tax expense (298) (670) (1,039) (1,842)Deferred income tax expense 50 219 (290) (223)Total (248) (451) (1,329) (2,065)
36 Fee and commission expenses (continued)
Nine months ended September 30, 2008 2007
Segment Consoli-dation
Group Segment Consoli-dation
Group
� mn � mn � mn � mn � mn � mn
Property-Casualty
Fees from credit and assistance business (466) 2 (464) (351) 1 (350)Service agreements (291) 8 (283) (229) 14 (215)Subtotal (757) 10 (747) (580) 15 (565)
Life/Health
Service agreements (31) 23 (8) (36) 10 (26)Investment advisory (142) 15 (127) (118) 5 (113)Subtotal (173) 38 (135) (154) 15 (139)
Banking
Securities business (6) — (6) (7) — (7)Investment advisory (103) (1) (104) (133) 2 (131)Payment transactions (5) — (5) (5) — (5)Other (39) 2 (37) (36) 4 (32)Subtotal (153) 1 (152) (181) 6 (175)
Asset Management
Commissions (627) 244 (383) (706) 330 (376)Other (275) 10 (265) (240) 3 (237)Subtotal (902) 254 (648) (946) 333 (613)
Corporate
Service agreements (100) 4 (96) (97) 22 (75)Subtotal (100) 4 (96) (97) 22 (75)
Total (2,085) 307 (1,778) (1,957) 390 (1,567)
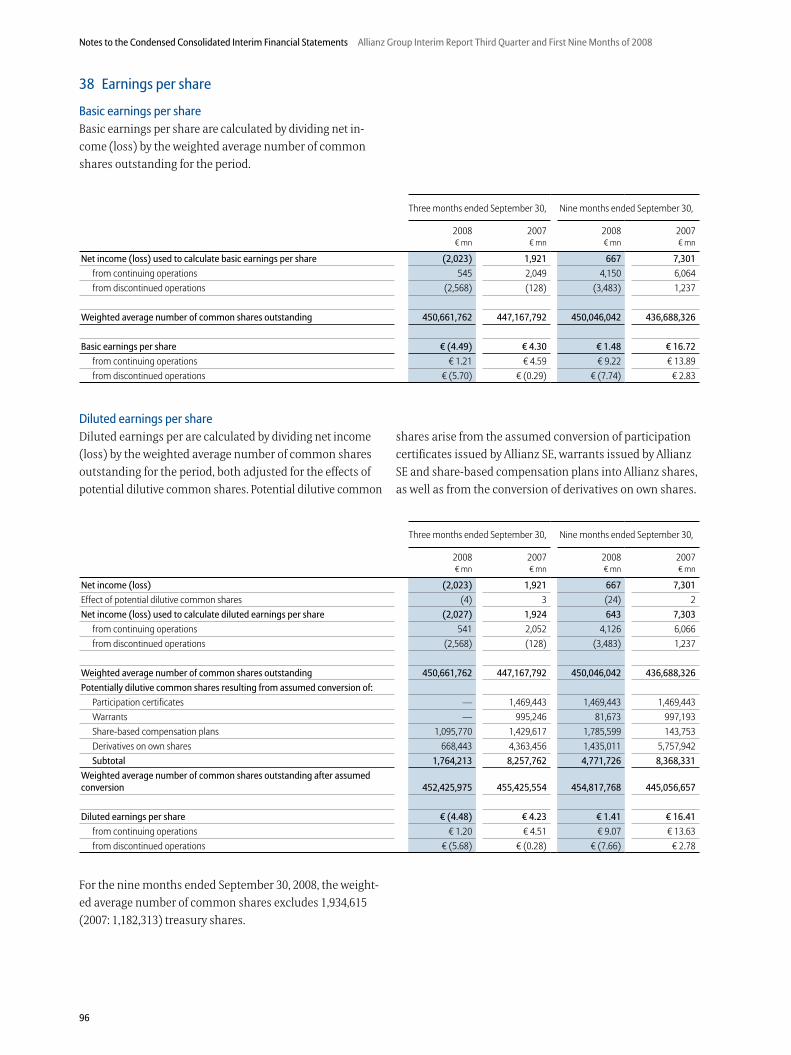
96
Notes to the Condensed Consolidated Interim Financial Statements Allianz Group Interim Report Third Quarter and First Nine Months of 2008
38 Earnings per share
Basic earnings per share
Basic earnings per share are calculated by dividing net in-
come (loss) by the weighted average number of common
shares outstanding for the period.
Three months ended September 30, Nine months ended September 30,
2008 2007 2008 2007� mn � mn � mn � mn
Net income (loss) used to calculate basic earnings per share (2,023) 1,921 667 7,301
from continuing operations 545 2,049 4,150 6,064from discontinued operations (2,568) (128) (3,483) 1,237
Weighted average number of common shares outstanding 450,661,762 447,167,792 450,046,042 436,688,326
Basic earnings per share � (4.49) � 4.30 � 1.48 � 16.72
from continuing operations � 1.21 � 4.59 � 9.22 � 13.89from discontinued operations � (5.70) � (0.29) � (7.74) � 2.83
Diluted earnings per share
Diluted earnings per are calculated by dividing net income
(loss) by the weighted average number of common shares
outstanding for the period, both adjusted for the effects of
potential dilutive common shares. Potential dilutive common
shares arise from the assumed conversion of participation
certificates issued by Allianz SE, warrants issued by Allianz
SE and share-based compensation plans into Allianz shares,
as well as from the conversion of derivatives on own shares.
Three months ended September 30, Nine months ended September 30,
2008 2007 2008 2007� mn � mn � mn � mn
Net income (loss) (2,023) 1,921 667 7,301
Effect of potential dilutive common shares (4) 3 (24) 2Net income (loss) used to calculate diluted earnings per share (2,027) 1,924 643 7,303
from continuing operations 541 2,052 4,126 6,066from discontinued operations (2,568) (128) (3,483) 1,237
Weighted average number of common shares outstanding 450,661,762 447,167,792 450,046,042 436,688,326
Potentially dilutive common shares resulting from assumed conversion of:
Participation certificates — 1,469,443 1,469,443 1,469,443Warrants — 995,246 81,673 997,193Share-based compensation plans 1,095,770 1,429,617 1,785,599 143,753Derivatives on own shares 668,443 4,363,456 1,435,011 5,757,942Subtotal 1,764,213 8,257,762 4,771,726 8,368,331
Weighted average number of common shares outstanding after assumed conversion 452,425,975 455,425,554 454,817,768 445,056,657
Diluted earnings per share � (4.48) � 4.23 � 1.41 � 16.41
from continuing operations � 1.20 � 4.51 � 9.07 � 13.63from discontinued operations � (5.68) � (0.28) � (7.66) � 2.78
For the nine months ended September 30, 2008, the weight-
ed average number of common shares excludes 1,934,615
(2007: 1,182,313) treasury shares.

97
Allianz Group Interim Report Third Quarter and First Nine Months of 2008 Notes to the Condensed Consolidated Interim Financial Statements
40 Other information
Number of employees
As of September 30,
2008
As of December 31,
2007
Germany 71,822 72,063Other countries 110,349 109,144Total 182,171 181,207
39 Supplemental information on the condensed consolidated statements of cash flows
Nine months ended September 30, 2008 2007� mn � mn
Income taxes paid (2,383) (1,788)Dividends received 1,671 2,165Interest received 17,175 16,826Interest paid (4,718) (4,985)Significant non-cash transactions:
Settlement of exchangeable bonds issued by Allianz Finance II B.V. for shares:
Available-for-sale investments (450) (812)Certificated liabilities (450) (812)
Novation of quota share reinsurance agreement:
Reinsurance assets (29) (1,226)Deferred acquisition costs 1 71Payables from reinsurance contracts (28) (1,155)
Effects from buy-out of AGF minorities:
Revenue reserves — (1,843)Unrealized gains and losses (net) — 146Minority interests — (1,068)Paid-in capital — 2,765
Effects from first consolidation of K2:
Financial assets held for trading 107 —Financial assets designated at fair value through income 8,665 —Loans and advances to banks and customers 1,714 —Other assets 51 —Financial liabilities held for trading 497 —Financial liabilities designated at fair value through income 8,889 —Liabilities to banks and customers 1,076 —Other liabilities 75 —
On July 21, 2008, the Allianz Group increased its investment
in the non-life insurer Koç Allianz Sigorta AŞ and the life-
insurance and pension company Koç Allianz Hayat ve
Emeklilik AŞ from 37.1 % to 84.2 % and from 38.0 % to 89.0 %,
respectively. The purchase price was � 373 mn. The impact
of the acquisition, net of cash acquired, on the condensed
consolidated statement of cash flows for the nine months
ended September 30, 2008 was:
As ofSeptember 30,
2008� mn
Intangible assets (247)Other assets (914)Other liabilities 870Minority interests 38Less: previous investment in Koç 101Acquisition of subsidiary, net of cash acquired (152)
98
Notes to the Condensed Consolidated Interim Financial Statements Allianz Group Interim Report Third Quarter and First Nine Months of 2008
41 Subsequent events
Capital investment in The Hartford
On October 6, 2008, the Allianz SE announced a binding
agreement providing for a capital investment of U.S. $ 2.5 bn
in The Hartford.
Allianz SE has purchased, for a consideration of U.S. $ 2.5 bn,
24 mn of preferred shares convertible to common stock
after receipt of applicable approvals, warrants for 69 mn of
Hartford shares and junior subordinated debentures with a
nominal value of U.S. $ 1.75 bn and a 10 % interest coupon.
Munich, November 7, 2008
Allianz SE
The Board of Management
99
Allianz Group Interim Report Third Quarter and First Nine Months of 2008 Review report
Review report
To Allianz SE, Munich
We have reviewed the condensed interim consolidated
financial statements of the Allianz SE, Munich – comprising
balance sheet, income statement, condensed cash flow
statement, statement of changes in equity and selected
explanatory notes - together with the interim group man-
agement report of the Allianz SE, Munich for the period
from January 1 to September 30, 2008 that are part of the
quarterly financial report according to § 37 x WpHG
[„Wertpapierhandelsgesetz“: „German Securities Trading
Act“]. The preparation of the condensed interim consoli-
dated financial statements in accordance with those IFRS
applicable to interim financial reporting as adopted by the
EU and in accordance with the IFRS for interim financial
reporting as issued by the International Accounting Stan-
dards Board (IASB), and of the interim group management
report in accordance with the requirements of the WpHG
applicable to interim group management reports, is the
responsibility of the Company’s management. Our respon-
sibility is to issue a report on the condensed interim con-
solidated financial statements and on the interim group
management report based on our review.
We performed our review of the condensed interim consoli-
dated financial statements and the interim group manage-
ment report in accordance with the German generally ac-
cepted standards for the review of financial statements
promulgated by the Institut der Wirtschaftsprüfer (IDW).
Those standards require that we plan and perform the
review so that we can preclude through critical evaluation,
with a certain level of assurance, that the condensed in-
terim consolidated financial statements have not been
prepared, in material aspects, in accordance with the IFRS
applicable to interim financial reporting as adopted by the
EU and in accordance with the IFRS for interim financial
reporting as issued by the IASB, and that the interim group
management report has not been prepared, in material
aspects, in accordance with the requirements of the WpHG
applicable to interim group management reports. A review
is limited primarily to inquiries of company employees and
analytical assessments and therefore does not provide the
assurance attainable in a financial statement audit. Since,
in accordance with our engagement, we have not performed
a financial statement audit, we cannot issue an auditor’s
report.
Based on our review, no matters have come to our attention
that cause us to presume that the condensed interim con-
solidated financial statements have not been prepared, in
material respects, in accordance with the IFRS applicable to
interim financial reporting as adopted by the EU and in
accordance with the IFRS for interim financial reporting as
issued by the IASB, or that the interim group management
report has not been prepared, in all material respects, in
accordance with the requirements of the WpHG applicable
to interim group management reports.
Munich, November 10, 2008
KPMG AG
Wirtschaftsprüfungsgesellschaft
Johannes Pastor Dirk Hildebrand
Independent Auditor Independent Auditor

Allianz SEKöniginstraße 2880802 München
Telefon 089 38 00 0Telefax 089 38 00 [email protected]
This interim report is also available as an English version.