Condensed Interim Financial Statements for the Nine Months ...
62
Condensed Interim Financial Statements for the Nine Months Period Ended September 30, 2018 (Un-Audited) 324 Branches in 161 Cities
Transcript of Condensed Interim Financial Statements for the Nine Months ...

Condensed Interim Financial Statementsfor the Nine Months Period EndedSeptember 30, 2018 (Un-Audited)
324 Branches in 161 Cities


Table of Contents
Company Information 02
Directors’ Report to the Members 03
رپورٹ رز ٹ ر�ی
ئ10 ڈا�
Unconsolidated Condensed Interim Statement of Financial Position 11
Unconsolidated Condensed Interim Profit and Loss Account 12
Unconsolidated Condensed Interim Statement of Comprehensive Income 13
Unconsolidated Condensed Interim Statement of Changes in Equity 14
Unconsolidated Condensed Interim Cash Flow Statement 15
Notes to the Unconsolidated Condensed Interim Financial Statement 16
Consolidated Condensed Interim Statement of Financial Position 34
Consolidated Condensed Interim Profit and Loss Account 35
Consolidated Condensed Interim Statement of Comprehensive Income 36
Consolidated Condensed Interim Statement of Changes in Equity 37
Consolidated Condensed Interim Cash Flow Statement 38
Notes to the Consolidated Condensed Interim Financial Statement 39

4 JS Bank nine months period ended September 30, 2018
Company Information
Board of Directors
*Mr. Suleman LalaniChairman Mr. Adil MatcheswalaNon-Executive DirectorMr. Ashraf NawabiNon-Executive DirectorMr. G.M. SikanderIndependent Non-Executive DirectorMr. Kalim-ur-RahmanNon-Executive DirectorMr. Munawar Alam SiddiquiNon-Executive DirectorMs. Nargis GhalooIndependent Non-Executive DirectorMr. Shahab Anwar KhawajaIndependent Non-Executive DirectorMr. Basir ShamsiePresident & CEO
Audit CommitteeMr. Shahab Anwar Khawaja ChairmanMr. Adil Matcheswala MemberMr. G.M. Sikander Member
Chief Financial Officer Mr. Muhammad Yousuf Amanullah
Company SecretaryMr. Ashraf Shahzad
Auditors EY Ford Rhodes, Chartered Accountants(a Member firm of Ernst & Young Global Limited)
Legal Advisors Bawaney & Partners Haidermota BNRLiaquat Merchant Associates
Share Registrar Central Depository Company of Pakistan Limited CDC House, 99-B, Block ‘B’ S.M.C.H.S.,Main Shahra-e-Faisal, Karachi.
Registered officeJS Bank Limited Shaheen Commercial ComplexDr. Ziauddin Ahmed Road P.O. Box 4847 Karachi-74200, PakistanUAN: +92 21 111 JS Bank (572-265)0800-011-22 www.jsbl.com
*Mr. Suleman Lalani has been appointed as Director, w.e.f October 01, 2018. and Chairman w.e.f October 26, 2018

5JS Bank nine months period ended September 30, 2018
Directors’ Report To The Members
We are pleased to present the unaudited financial statements of JS Bank Limited (“JSBL”) along with the consolidated financial statements of its subsidiaries for the nine months period ended September 30, 2018.
The Economy
As the year progressed, Pakistan’s economic outlook remained challenging. Nearly all major macro indicators deteriorated during the period, including the consumer price index (CPI), fiscal debt-to-GDP ratio, benchmark interest rates and the exchange rate. An increase in the current account deficit (CAD) and rapidly depleting foreign exchange reserves during the period added to concerns on the external front.
Headline inflation, which remained relatively stable in the earlier months of the year began to pick up pace and consistently clocked in above 5 percent starting from June 2018. The reasons for this were the rise in crude oil prices and a weakening of the Pakistani Rupee (PKR). Signs of inflationary pressures prompted the State Bank of Pakistan (SBP) to raise the policy rate by a cumulative 275 basis points (bps) on four out of five monetary policy statements of the year. Inflationary trends look to continue for the remainder of the year owing to sustained pressure on the PKR and the recent hike in gas prices.
CAD worsened further during the first two months of the fiscal year 2019 (FY19), up by 10% year-on-year (YoY), reaching a staggering USD 2.7 billion. Although exports grew by 5% YoY during the same period, a growth of 11% YoY in imports negated the benefits of the increase in exports, pulling the trade deficit up to USD 5.9 billion, an increase of 16% YoY. During the first nine months of the calendar year 2018 a growth of 4.52% YoY in workers’ remittances helped to keep the CAD from declining any further.
Due to the absence of any significant inflows, coupled with debt servicing requirements, SBP’s foreign exchange reserves plunged to a 4 year low of USD 8.4 billion by the end of September 2018, while total foreign exchange reserves stood at USD 14.9 billion. At current reserves levels, the import cover is precariously low and barely enough to cover two months’ worth of imports.
Banking Sector Review
Continuing the monetary tightening cycle, the State Bank of Pakistan (SBP) increased the policy rate by 275 basis points (bps) during the first nine months of the calendar year 2018 (9MCY18). The policy rate now stands at 8.5%, up from 5.75% as at the end of 2017. Banking spreads during the same period sustained a declining trajectory, further sliding to an average of 4.82%, marking a 14 bps YoY drop. During 9MCY18, SBP data showed a 9% YoY increase in banking deposits, reaching PKR 13,032 billion. During the same period, advances depicted a higher growth rate of 22% YoY, reaching PKR 7,492 billion, while the advances-to-deposit ratio (ADR) for the industry jumped to 57% owing to a steady increase in project-financing and consumer loan demand. Growth in private sector credit off-take witnessed 18% YoY growth during the first eight months of CY2018 (8MCY18). Asset quality remained in check as non-performing loans (NPLs) for the industry stood at PKR 624 billion as of June 2018, keeping the infection ratio for the industry in the single-digits at 9%. Investments, however, decreased by 20% YoY to PKR 6,677 billion as the sector witnessed maturing investments and thin interest was shown in government paper auctions during the same period. As a result, the Investment-to-Deposit Ratio (IDR) further slid down to 51%.

6 JS Bank nine months period ended September 30, 2018
Directors’ Report To The Members
Financial Performance
During the period under review, the Bank earned profit before tax of PKR 1,227.2 million (profit after tax of 756.2 million) for the nine months period ended September 30, 2018 as compared to profit before tax of PKR 825.1 million (profit after tax of PKR 417.0 million) in the corresponding period last year. The increase in profit was mainly due to a healthy growth in advances and an increase in trade volumes, forex income as well as advisory services. Administrative expenses increased due to expansion of the branch network and embarking on new initiatives as compared to the corresponding period last year. The breakup value per share of the Bank as of September 30, 2018 after revaluation of assets was PKR 12.46
Deposits and advances increased from PKR 290.1 billion and PKR 184.1 billion to PKR 310.3 billion and PKR 231.8 billion respectively during the period, which reflects continued focus of the Bank on core business activities.
The basic and diluted earnings per share is PKR 0.46 for the nine months period ended September 30, 2018
Consolidated Financial Statements
In consolidated financial statements, the Group earned profit before tax of PKR 1,347.9 million (profit after tax of 798.6 million) for the nine months period ended September 30, 2018 as compared to profit before tax of PKR 1,055.7 million (profit after tax of PKR 529.6 million) in the corresponding period last year.
The basic and diluted earnings per share is PKR 0.48 for the nine months period ended September 30, 2018.
Business Overview
The Bank has embarked on several initiatives to strengthen its product line including variants of value-added current accounts to expand its deposit relationships in several segments including business accounts, employee banking, private banking, cash management relationships, corporate deposits and technology-based solutions.
On the assets side, there was increased focus on prudent expansion in advances with a holistic product range designed around customer needs, with diversified growth in lending to public sector (Government of Pakistan backed), corporate & commercial entities, small & medium enterprises (SME) and consumer banking. In addition to traditional lending segments, the Bank has enhanced its focus on the SME landscape through relationship lending model, operating through several SME hub branches. The secured consumer lending also picked up pace exponentially throughout 2018. The leasing segment also developed a healthy portfolio catering to most sectors of the economy. The Bank also grew its Prime Minister’s Youth Business Loans (PMYBL) portfolio by forming multiple alliances with Pakistan’s leading businesses in growing industries in order to promote self-employment within their value chains. JS Bank exceeded its SBP - assigned agriculture targets with a clean portfolio, paving the way for substantial expansion. The Bank continued to develop its gold finance portfolio and extended the proposition to its agri-based customers.

7JS Bank nine months period ended September 30, 2018
The Bank is making concerted efforts to optimize the revenue mix between interest and fee-based income via introduction of innovative products and solutions. In addition to growing traditional fee income streams, the Bank is continuing its increased focus on cross selling various fee-based products to existing and new customers along with improving internal processes to reduce costs and increase efficiency.
Credit Ratings
The Pakistan Credit Rating Agency Limited (PACRA) has assigned to the Bank a long-term rating of “AA-” (Double A Minus), and a short-term rating of “A1+” (A One Plus) which is the highest possible for this category.
Subsidiary Companies • JS Global Capital Limited
JS Global Capital Limited (“JS Global”) is one of the largest securities brokerage and investment banking firms in Pakistan with a leadership position in the domestic capital markets.
JS Global has shareholders’ equity of PKR 2,609 million as at September 30, 2018. It is listed on the Pakistan Stock Exchange. JS Bank has 67.16% ownership of the company
The Pakistan Credit Rating Agency (PACRA) has assigned long-term and short-term entity ratings to JS Global of “AA” (Double A) and “A1+” (A One plus), respectively. The ratings denote a very low expectation of credit risk emanating from very strong capacity for timely payment of financial commitments.
Summarized results of JS Global are set out below: PKR Million
Particulars For the nine months period ended September 30, 2018
For the nine months period ended September 30, 2017
(Un Audited) (Un Audited)Profit before tax 88.2 202.7Profit after tax 20.7 121.5EPS (Rupees) 0.55 3.20
Decrease in profits is mainly due to lower trading volumes in the equity market.
• JS Investments Limited
JS Investments is an Investment Adviser and Asset Management Company under the Non-Banking Finance Companies (Establishment and Regulation) Rules, 2003 (the NBFC Rules) and the Non-Banking Finance Companies and Notified Entities Regulations, 2008 (the NBFC Regulations). In addition, JS Investments is also a licensed Pension Fund Manager under the Voluntary Pension System Rules, 2005, to manage voluntary pension schemes.
Directors’ Report To The Members

8 JS Bank nine months period ended September 30, 2018
JS Investments had shareholders’ equity of PKR 2,306.2 million as at September 30, 2018. It is listed on the Pakistan Stock Exchange. JS Bank has 65.16% ownership of the company. JS Investments has a Management Quality Rating of “AM2, with stable outlook” assigned by JCR-VIS and long and short-term credit ratings of “A+” (A Plus) and A1 (A One) assigned by PACRA. Summarized results of JS Investments are set out below:
PKR MillionParticulars For the nine months period ended
September 30, 2018For the nine months period ended
September 30, 2017(Un Audited) (Un Audited)
Profit before tax 25.2 43.0Profit after tax 14.9 9.3EPS (Rupees) 0.19 0.12
Decrease in profits is mainly due to diminution in remunerations from funds under management and dividend income. Acknowledgments
On behalf of JS Bank, we would like to extend our gratitude to our customers and stakeholders for their patronage. we would also like to thank the Ministry of Finance, the State Bank of Pakistan, the Securities & Exchange Commission of Pakistan and other regulatory authorities for their support to our Bank. Finally, we extend our appreciation to the management team and staff for their persistent commitment to working together as a winning team.
On behalf of the Board
Basir Shamsie Adil MatcheswalaPresident & CEO Director
Karachi: October 26, 2018
Directors’ Report To The Members

9JS Bank nine months period ended September 30, 2018
&45¾æG
HEY
E!*M s PACRA 0+‚ ''AM2'' JCR-VIS $o54
ø
GHEH JS
º! "A1" &ÒøF "A+"
$o54
ø
GHEHās JS
�ƒ 201730 ƒ 201830 Y” ”
43.0 25.2 9.3 14.9 0.12 0.19
k,qƒ2¶¶L
Y+$L™ƒ®¬6,]¦/÷0*_5½3ð G
Gâ JS
$™6,÷Yx‚�™œ6, 0*Ì]t™**e÷
+$
¬¬¬¬ !!!!****FFFF]]]],,,, 6666,,,,mmmm,,,,iiii++++....$$$$
2018 ', 26 ™

10 JS Bank nine months period ended September 30, 2018
™™™™iiii++++&&&&44445555¾¾¾¾ææææGGGG
HHHHEEEEYYYY
EEEE
.sƒ "AA-" PACRA 0*™i+&Òø
Fº! "A1+"
....´4444555544445555ÿÿÿÿGGGGFFFF
GGGGHHHH JS
_5½3ð GG',™$o3ï
GHEH�'q4k5 GH´4545
ÿGF
GH54ø
GH„ (, 0* (''JS Global'') . JS
JS �t0*6âÅk5åHH�Ìb 2,609 .ƒ® JS 201830
r 67.16%
&ÒøF "A1+" . "AA" &45¾æ
G
HEY
E!*M .s JS PACRA 0*™i+º!t&45½ø
G
HEY
™i+‹**°',‰ªC™÷
.ās JS
�ƒ 201730 ƒ 201830 Y” ”
202.7 88.2 121.5 20.7 3.20 0.55
¶¶C
$$$$oooo55554444
øøøø
GGGGHHHHEEEEHHHH2008 +p²**eà"542.ç
GEHH
GEÉ4n.ç G
IEE 2003 $o54
ø
GHEH**² JS
$o54
ø
GHEHŸ:"54jè
FGEI
E]¼çGE JS +pÉ4n.ç GIEE�$o3ï
GHEHi+,$miï GH�c*"54j
èFG
EIEÁÌ 2005
"54jè
FGEI
E²
JS �t0*6âÅk5åHH�Ìb 2,306.2 $o54
ø
GHEHĨ JS 201830
r 65.16%

11JS Bank nine months period ended September 30, 2018
™™™™ �å 756.2 � 1,227.2 ƒ 201830 %æGLY,
�åŸ�;i+I{§ 417.0 � 825.1 ¦/‚¸ Ÿ†),Ãi+,Ÿ†÷÷¦/‚«',M6!*Š
0* 12.46 U*Šçˆ',q 201830 YŸ†ƒ
!*MŸ†ƒ�!* 231.8 310.3 184.1 290.1 0*Œ2¤/6,ªC™@*
0.46 ƒQ+ 201830
____5555444455554444
øøøø
HHHHGGGG
HHHHEEEEHHHH
�798.6 �ˆ 1,347.9 ƒ¤/ 201830 _5454
ø
HG
HEH�å 529.6 � 1,055.7 ¦/‚¦/‚
0.48 ƒQ+ 201830
!!!!****YYYY^,,,,), K6,–'h+™Š6,{;Ÿœ6,F™.$÷÷@*ā¼
6,f$&Ó4jè
GGI
Ef$0*6,F|c.çIEE0*&Ó4j
èGG
IE’ƒ
U*¢c*pƒ6,Yi+I½6,{ %÷÷ SME Œ£YïGL0*f$6,,
],6, SME ',+?ç
E
FEŒL* SME Y*Ÿ†ƒÓY¢c*™8),Ìq _5½3ð GG%Œ{§ 2018 'h+‚
K0+!*�0*c*+7m,Ÿ!*‚ ',„H0*Y+$º!Y JS Ì PMYBL 6,),
®)™i+@Ë‚™ŸƒL®Ÿ†YL®)5m,Ì'h+Ÿ†
].h+6,|c.çIEE™™†qƒŸ÷ JS
Ÿ$+2L�6C6,¼Ÿ6,�|#Y™Ÿ0+§6,K{;

12 JS Bank nine months period ended September 30, 2018
]]]],,,,U*” "JSBL" JS ƒ 201830 ‚
™÷
YYYY^,,,,%6, ‚(,J�$+2D„K0+„™½ãÓC
‚™.$.$ ŒÚƒ†âf$¶D CPI +Ÿ†ƒÃâ{],Û¡**�ªC™÷ CAD
c*(,„{ 5% 2018 ��‚Šƒ�‚0*e SBP Š¶�!*0* PKR Ÿ†0*
J(,J**7,0*6,!*',Œ�qŸ bps &4lç EGE 275 �0*_5454
ø
HG
HEH6,0*f$�**‚!*0+Ì',ŒT÷
%°J 2.7 ‚J(,™ 10% ™.$.$'h+t (FY19) 2019 ‚‚Ÿ†',ƒŸ 11% ‚JŸ†ƒ 5% H¤/p',
2018 ‚Ÿ†‚ 16% %°JH� 5.9 Z+bƒ),‚Ÿ†™.$.$'h+ƒU*"$ƒ 4.52% F,−
Je‚ 2018 ‡.™:ƒŒ�7¶0*!{],%°÷�{],R6,6, 14.9 %°J!{], 8.4 F,+R
™
YYYY^,,,,&4lç EGE 275 0*0*f$6, 9MCY18 2018 �‚',Œ„‚
JH¶$+2 8.5% å(,™ 5.75% 6, 2017 Ÿ†0*f$� bps 0*ð 2018 &4lç EGE‚6,‚ 14 ‰'h+ƒ™ 4.82% Y„t7,492 ‚‚ 22% ÷i+I 13,032 ‚Ÿ†ªC™@*t 9% 0*2018 JH‚ 57%ADR J/YŒŸ+7i+I0*
+7 2018 ‚Ÿ†c*U*XY‡;� 18% 6,f$Œ 8MCY18 6,677 ‚Jƒ™ 20% ;@*
$o54ø
GHEH
9% +7$©5½jè
EE
GI
E 624NPLs **6,Ã4,ƒH 51% 'h+ƒ™ IDR ƒ
$o54ø
GHEHƒ$o3ïGHEH0*

13JS Bank nine months period ended September 30, 2018
Unconsolidated Condensed Interim Statement of Financial PositionAs at September 30, 2018
Chairman President and Director Director Chief Financial Chief Executive Officer Officer
(Un-audited) (Audited) September 30, December 31,
2018 2017Note -------- Rupees in ‘000 --------
ASSETSCash and balances with treasury banks 17,066,263 17,333,788 Balances with other banks - net 405,479 1,034,266 Lendings to financial institutions - net 7 1,828,842 3,116,199 Investments - net 8 129,414,225 169,611,558 Advances - net 9 231,758,037 184,139,582 Operating fixed assets 10 8,178,501 7,112,821 Deferred tax assets - - Other assets - net 9,144,990 5,960,662
397,796,337 388,308,876
LIABILITIESBills payable 3,986,736 3,824,278 Borrowings 53,477,529 64,557,043 Deposits and other accounts 11 310,286,901 290,077,566 Sub-ordinated loans 4,997,800 4,998,800 Liabilities against assets subject to finance lease - - Deferred tax liabilities - net 12 63,685 796,803 Other liabilities 8,821,386 7,385,057
381,634,037 371,639,547 NET ASSETS 16,162,300 16,669,329
REPRESENTED BY:Share capital 13 12,974,643 10,724,643 Discount on issue of shares 13 (2,855,401) (2,105,401)Preference shares 13 - 1,500,000 Reserves 1,724,100 1,540,988 Unappropriated profit 4,953,622 4,518,820
16,796,964 16,179,050 (Deficit) / surplus on revaluation of assets - net of tax 14 (634,664) 490,279
16,162,300 16,669,329
CONTINGENCIES AND COMMITMENTS 15
The annexed notes from 1 to 23 form an integral part of these unconsolidated condensed interim financial statements.

14 JS Bank nine months period ended September 30, 2018
Unconsolidated Condensed Interim Profit and Loss Account (Un-audited)For the nine months period ended September 30, 2018
Chairman President and Director Director Chief Financial Chief Executive Officer Officer
Nine months period ended Quarter endedSeptember 30, September 30, September 30, September 30,
2018 2017 2018 2017Note ------------------------ Rupees in ‘000 ------------------------
Mark-up / return / interest earned 21,612,768 14,186,456 7,602,404 5,702,071 Mark-up / return / interest expensed 14,968,714 9,811,417 5,336,518 4,028,006 Net mark-up / interest income 6,644,054 4,375,039 2,265,886 1,674,065
Provision against non-performing loans and advances - net (173,703) (220,666) (49,836) (142,028)Reversal against diminution in the value of investments 191,116 - 159,463 - Bad debts written off directly - - - -
17,413 (220,666) 109,627 (142,028)
Net mark-up / return / interest income after provisions 6,661,467 4,154,373 2,375,513 1,532,037
NON MARK-UP / INTEREST INCOMEFee, commission and brokerage income 2,001,267 1,560,908 549,393 456,436 Dividend income 72,483 100,557 7,452 8,667 Income from dealing in foreign currencies 572,390 250,871 332,378 117,697 (Loss) / gain on sale of securities - net (523,509) 625,803 (481,134) 266,625 Unrealised (loss) / gain on revaluation of investments
classified as held-for-trading - net (7,673) 335 (6,782) (1,613)Other income / (loss) - net 9,317 108,941 (132,749) 45,572 Total non-mark-up / interest income 2,124,275 2,647,415 268,558 893,384
8,785,742 6,801,788 2,644,071 2,425,421
NON MARK-UP / INTEREST EXPENSESAdministrative expenses 7,476,200 5,947,118 2,532,107 2,217,144 Other provision - net 16 57,071 - (8,647) - Other charges 25,276 29,536 2,561 4,114 Total non mark-up / interest expenses 7,558,547 5,976,654 2,526,021 2,221,258
1,227,195 825,134 118,050 204,163 Extra ordinary / unusual items - - - -
PROFIT BEFORE TAXATION 1,227,195 825,134 118,050 204,163
Taxation- Current (540,626) (266,700) (108,519) (48,617)- Prior years - (115,944) - - - Deferred 69,601 (25,491) 62,344 (22,692)
17 (471,025) (408,135) (46,175) (71,309)
PROFIT AFTER TAXATION 756,170 416,999 71,875 132,854
--------------------------- Rupee ---------------------------
Basic earnings per share 18 0.46 0.22 0.06 0.12
Diluted earnings per share 18 0.46 0.22 0.06 0.10
The annexed notes from 1 to 23 form an integral part of these unconsolidated condensed interim financial statements.

15JS Bank nine months period ended September 30, 2018
Unconsolidated Condensed InterimStatement of Comprehensive Income (Un-audited)For the nine months period ended September 30, 2018
Chairman President and Director Director Chief Financial Chief Executive Officer Officer
Nine months period ended Quarter endedSeptember 30, September 30, September 30, September 30,
2018 2017 2018 2017 ------------------------ Rupees in ‘000 ------------------------
Profit after taxation 756,170 416,999 71,875 132,854
Other comprehensive income
Items that will not be reclassified to profit and loss - - - -
Items that are or may be reclassified to profit or lossin subsequent periods
Effect of translation of net investment in foreign branch 31,878 737 580 716
Comprehensive income transferred to equity 788,048 417,736 72,455 133,570
Components of comprehensive income not reflected in equity
Items that are or may be reclassified to profit or lossin subsequent periods
Deficit on revaluation of available-for-sale securities (2,306,693) (1,583,091) (902,667) (1,068,646)Related deferred tax asset 807,343 554,082 315,934 374,026
(1,499,350) (1,029,009) (586,733) (694,620)
Total comprehensive loss for the period - net of tax (711,302) (611,273) (514,278) (561,050)
Surplus on revaluation of ‘operating fixed assets - net of tax’ and ‘non-banking assets - net of tax’ is presented under a separate head below equity as ‘ surplus on revaluation of assets - net of tax’ in accordance with the disclosure format for quarterly/ interim financial statements of banks as prescribed by SBP vide BSD Circular Letter No. 2 of May 12, 2004 and Regulation for Debt Property Swap issued vide BPRD Circular No. 1 dated January 01, 2016.
The annexed notes from 1 to 23 form an integral part of these unconsolidated condensed interim financial statements.

16 JS Bank nine months period ended September 30, 2018
Unconsolidated Condensed InterimStatement of Changes in EquityFor the nine months period ended September 30, 2018
Chairman President and Director Director Chief Financial Chief Executive Officer Officer
Discount Reserves Share on issue of Preference Exchange Unappropriated capital shares shares * Statutory translation profit Total ----------------------------------------------- Rupees in ‘000 -----------------------------------------------
Balance as at January 01, 2017 (Audited) 10,724,643 (2,105,401) 1,500,000 1,334,139 (17) 3,973,341 15,426,705
Total comprehensive income for the nine months period ended September 30, 2017
Profit after taxation - - - - - 416,999 416,999 Other comprehensive income - - - - 737 - 737
- - - - 737 416,999 417,736
Transfer from surplus on revaluation of non-banking assets on account of incremental depreciation - net of tax - - - - - 161 161
Transaction with owners recorded directly in equity
Preference dividend paid for the year ended December 31, 2016 @ 12% p.a - - - - - (180,000) (180,000)
TransfersTransfer to statutory reserve - - - 83,400 - (83,400) -
Balance as at September 30, 2017 (Un-audited) 10,724,643 (2,105,401) 1,500,000 1,417,539 720 4,127,101 15,664,602
Total comprehensive incomefor the period ended December 31, 2017
Profit after taxation - - - - - 556,150 556,150 Other comprehensive Income / (loss) - - - - 11,499 (55,602) (44,103)
- - - - 11,499 500,548 512,047
Transfer from surplus on revaluation of operating fixed assets on account of incremental depreciation for the period - net of tax - - - - - 2,348 2,348
Transfer from surplus on revaluation of non-banking assets on account of incremental depreciation - net of tax - - - - - 53 53
TransfersTransfer to statutory reserve - - - 111,230 - (111,230) -
Balance as at December 31, 2017 (Audited) 10,724,64 3 (2,105,401) 1,500,000 1,528,769 12,219 4,518,820 16,179,050
Total comprehensive income for the nine months period ended September 30, 2018
Profit after taxation - - - - - 756,170 756,170 Other comprehensive income - - - - 31,878 - 31,878
- - - - 31,878 756,170 788,048 Transfer from surplus on revaluation of operating fixed assets on account of incremental 9,705 9,705 depreciation for the period - net of tax - - - - -
Transfer from surplus on revaluation of non-banking assets on account of incremental depreciation - net of tax - - - - - 161 161
Transaction with owners recorded directly in equity
Preference dividend paid for the year ended December 31, 2017 @ 12% p.a. - - - - - (180,000) (180,000)
Preference shares cancelled on conversion into ordinary shares during the period (note13) - - (1,500,000) - - - (1,500,000)
Issuance of ordinary shares on conversion of preference shares during the period (note13) 2,250,000 - - - - - 2,250,000
Discount on issue of ordinary shares during the period (note13) - (750,000) - - - - (750,000)
2,250,000 (750,000) - - - - 1,500,000 Transfers
Transfer to statutory reserve - - - 151,234 - (151,234) -
Balance as at September 30, 2018 (Un-audited) 12,974,643 (2,855,401) - 1,680,003 44,097 4,953,622 16,796,964
* This represents reserve created under Section 21(i)(a) of the Banking Companies Ordinance, 1962.
The annexed notes from 1 to 23 form an integral part of these unconsolidated condensed interim financial statements.

17JS Bank nine months period ended September 30, 2018
Unconsolidated Condensed InterimCash Flow Statement (Un-audited)For the nine months period ended September 30, 2018
Chairman President and Director Director Chief Financial Chief Executive Officer Officer
September 30, September 30,2018 2017
------ Rupees in ‘000 ------
CASH FLOWS FROM OPERATING ACTIVITIESProfit before taxation 1,227,195 825,134 Less: Dividend income (72,483) (100,557)
1,154,712 724,577 Adjustments:Depreciation 506,934 443,518 Depreciation on non-banking assets 975 975 Amortisation of intangibles 50,707 44,070 Charge for defined benefit plan 128,244 114,365 Unrealised loss / (gain) on revaluation of investments
classified as held-for-trading - net 7,673 (335)Provision against non-performing loans and advances - net 173,703 220,666 Reversal against diminution in the value of investments (191,116) - Other provision - net 57,071 - Unrealised gain on revaluation of derivative instruments 21,424 (30,199)Gain on sale of operating fixed assets (85,672) (55,477)Provision for Sindh Workers’ Welfare Fund 24,544 16,503
694,487 754,086 1,849,199 1,478,663
(Increase) / decrease in operating assetsLendings to financial institutions - net 1,285,591 5,056,068 Held-for-trading securities (528,868) 65,044,631 Advances (47,804,180) (56,971,736)Other assets (excluding advance taxation) (2,633,578) (2,728,578)
(49,681,035) 10,400,385 Increase in operating liabilitiesBills payable 162,458 1,541,923 Borrowings (11,019,735) 68,861,069 Deposits and other accounts 20,209,335 47,679,287 Other liabilities 1,458,658 1,594,204
10,810,716 119,676,483 (37,021,120) 131,555,531
Income tax paid (1,064,810) (536,640)Gratuity paid (175,118) (118,308)Net cash (used in) / flows from operating activities (38,261,048) 130,900,583
CASH FLOWS FROM INVESTING ACTIVITIESNet investment in available-for-sale securities 38,372,406 (85,302,716)Net investment in held-to maturity securities 319,210 (41,502,527)Investment in associated company (180,000) - Dividend received 71,576 98,047 Investments in operating fixed assets (1,135,557) (1,024,241)Proceeds from sale of operating fixed assets 126,009 79,120 Net cash flows from / (used in) investing activities 37,573,644 (127,652,317)
CASH FLOWS FROM FINANCING ACTIVITIESDividend paid on preference shares (180,000) (180,000)Sub-ordinated loans (1,000) (600)Net cash used in financing activities (181,000) (180,600)
Effect of translation of net investment in foreign branches 31,878 737
Increase in cash and cash equivalents (836,526) 3,068,403
Cash and cash equivalents at beginning of the period 18,169,058 16,221,150
Cash and cash equivalents at end of the period 17,332,532 19,289,553
The annexed notes from 1 to 23 form an integral part of these unconsolidated condensed interim financial statements.

18 JS Bank nine months period ended September 30, 2018
Notes to the Unconsolidated Condensed InterimFinancial StatementsFor the nine months period ended September 30, 2018
1. STATUS AND NATURE OF BUSINESS
1.1 JS Bank Limited (the Bank / JSBL), incorporated in Pakistan, is a scheduled bank, engaged in commercial banking and related services. The Bank’s ordinary shares are listed on Pakistan Stock Exchange Limited (PSX). The Bank is a subsidiary of Jahangir Siddiqui & Co. Ltd. (JSCL). The registered office of the Bank is situated at Shaheen Commercial Complex, Dr. Ziauddin Ahmed Road, Karachi. The Bank operates with 323 (December 31, 2017: 322) branches / sub-branches in Pakistan and one wholesale banking branch in Bahrain (December 31, 2017: one). The Pakistan Credit Rating Agency Limited (PACRA) has assigned the long-term entity rating of the Bank to ‘AA-’ (Double A Minus) and short-term entity rating at ‘A1+’ (A One Plus), which is the highest possible short-term rating. The ratings denote a very low expectation of credit risk and indicate very strong capacity for timely payment of financial commitments.
1.2 Jahangir Siddiqui Investment Bank Limited, JSIBL, (formerly Citicorp Investment Bank Limited which was acquired by JSCL on February 01, 1999), and its holding company, JSCL, entered into a Framework Agreement with American Express Bank Limited, New York (AMEX) on November 10, 2005 for acquisition of its American Express Bank Limited - Pakistan Branches, (AEBL). Consequently, a new banking company, JSBL was incorporated on March 15, 2006 and a restricted Banking License was issued by the State Bank of Pakistan (SBP) on May 23, 2006.
1.3 A Transfer Agreement was executed on June 24, 2006 between JSIBL and JSBL for the transfer of entire business and undertaking of JSIBL to JSBL and a separate Transfer Agreement was also executed on June 24, 2006, between AMEX and JSBL for the transfer of AEBL’s commercial banking business in Pakistan with all assets and liabilities (other than certain excluded assets and liabilities) (AEBL business). The shareholders of JSIBL and JSBL in their respective extra ordinary general meetings held on July 31, 200 6 approved a Scheme of Amalgamation (the Scheme) under Section 48 of the Banking Companies Ordinance, 1962. The Scheme was initially approved by the Securities and Exchange Commission of Pakistan (SECP) vide its letter No. SC/NBFC(J)-R/JSIBL/2006/517 dated September 28, 2006. Subsequently, the Scheme was sanctioned by the SBP vide its order dated December 02, 2006 and, in accordance therewith, the effective date of amalgamation was fixed at December 30, 2006.
2. STATEMENT OF COMPLIANCE
2.1 These unconsolidated condensed interim financial statements of the Bank have been prepared in accordance with the accounting and reporting standards as applicable in Pakistan for interim financial reporting. The accounting and reporting standards as applicable in Pakistan for interim financial reporting comprise of:
- International Accounting Standards (IAS) 34, Interim Financial Reporting, issued by the International Accounting Standards Board (IASB) as notified under the Companies Act, 2017;
- Provisions of and directives issued under the Banking Companies Ordinance, 1962 and the Companies Act, 2017; and
- Directives issued by the State Bank of Pakistan (SBP) and the Securities and Exchange Commission of Pakistan (SECP)
Whenever the requirements of the Banking Companies Ordinance, 1962, the Companies Act, 2017 or the directives issued by the SBP and the SECP differ with the requirements of IAS 34, the requirements of the Banking Companies Ordinance, 1962, the Companies Act, 2017 and the said directives, shall prevail.

19JS Bank nine months period ended September 30, 2018
Notes to the Unconsolidated Condensed InterimFinancial StatementsFor the nine months period ended September 30, 2018
2.2 The SBP vide BSD Circular No. 10, dated August 26, 2002 has deferred the applicability of International Accounting Standard 39, Financial Instruments: Recognition and Measurement and International Accounting Standard 40, Investment Property for Banking companies till further instructions. Further, according to the notification of the Securities and Exchange Commission of Pakistan (SECP) dated April 28, 2008, the IFRS - 7 “Financial Instruments: Disclosures” has not been made applicable for banks. Accordingly, the requirements of these standards have not been considered in the preparation of these unconsolidated condensed interim financial statements. However, investments have been classified and valued in accordance with the requirements of various circulars issued by the SBP.
2.3 IFRS 8, ‘Operating Segments’ is effective for the Bank’s accounting period beginning on or after January 01, 2009. All banking companies in Pakistan are required to prepare their annual financial statements in line with the format prescribed under BSD Circular No. 4 dated February 17, 2006, ‘Revised Forms of Annual Financial Statements’, effective from the accounting year ended December 31, 2006. The management of the Bank believes that as the SBP has defined the segment categorization in the above mentioned circular, the SBP’s requirements prevail over the requirements specified in IFRS 8. Accordingly, segment information disclosed in these unconsolidated condensed interim financial statements is based on the requirements laid down by the SBP.
2.4 IFRS10 “Consolidated Financial Statements” was made applicable from period beginning on or after January 01, 2015 vide S.R.O 633(I)/2014 dated July 10, 2014 by SECP. However, SECP has directed that the requirements of consolidation under section 237 of the Companies Ordinance 1984 and IFRS-10 “Consolidated Financial Statements” are not applicable in case of investment by companies in mutual funds established under trust structure, through S.R.O 56(I) /2016 dated January 28, 2016. Accordingly, the requirements of these standards have not been considered in the preparation of these unconsolidated condensed interim financial statements.
2.5 The disclosures made in these unconsolidated condensed interim financial statements have been limited based on the format prescribed by the SBP vide BSD Circular No. 2 dated May 12, 2004 and International Accounting Standard 34, ‘Interim Financial Reporting’ and do not include all the disclosures required in the annual financial statements. Accordingly, these unconsolidated condensed interim financial statements should be read in conjunction with the annual audited financial statements of the Bank for the year ended December 31, 2017.
3. BASIS OF MEASUREMENT
These unconsolidated condensed interim financial statements have been prepared under the historical cost convention except that certain assets are stated at revalued amounts / fair value as disclosed in the respective notes of the annual audited financial statements for the year ended December 31, 2017.
4. ACCOUNTING ESTIMATES AND JUDGMENTS
The estimates / judgments and associated assumptions used in the preparation of these unconsolidated condensed interim financial statements are consistent with those applied in the preparation of the annual financial statements of the Bank for the year ended December 31, 2017.

20 JS Bank nine months period ended September 30, 2018
Notes to the Unconsolidated Condensed InterimFinancial StatementsFor the nine months period ended September 30, 2018
5. SUMMARY OF SIGNIFICANT ACCOUNTING POLICIES
The accounting policies and the methods of computation adopted in the preparation of these unconsolidated condensed interim financial statements are the same as those applied in the preparation of the annual audited financial statements for the year ended December 31, 2017 except as below.
5.1 Surplus / Deficit on Revaluation of Operating Fixed Assets
The Companies Ordinance, 1984 (the repealed Ordinance) was repealed through the enactment of the Companies Act, 2017 on May 30, 2017. However, as directed by the Securities and Exchange Commission of Pakistan vide circular number 23 dated Oct 4, 2017, the financial reporting requirements of the Companies Act, 2017 were only made applicable for reporting periods starting from January 1, 2018.
The repealed Ordinance specified the accounting treatment for the surplus on revaluation on fixed assets, wherein, a deficit arising on revaluation of a particular property was to be adjusted against the total balance in the surplus account or, if no surplus existed, was to be charged to the profit and loss account as an impairment of the asset. However, the Companies Act, 2017 removed the specific provisions allowing the above treatment and hence, a deficit arising on revaluation of a particular property is now to be accounted for in accordance with applicable financial reporting standards, which requires that such deficit is to be taken to the profit and loss account as an impairment.
Consequently, the Bank has changed its policy for accounting for a deficit arising on revaluation of fixed assets and accordingly, any surplus/deficit arising on revaluation of owned property and non-banking assets acquired in satisfaction of claims is accounted for at individual assets level. The above change in accounting policy did not have any effect on these unconsolidated condensed interim financial statements.
5.2 Expected Credit Losses - IFRS 9
During the period, the Bank’s Bahrain Operations, in line with their locally applicable regulatory framework, has adopted IFRS 9 ‘Financial Instruments’. As permitted by the transitional provisions of IFRS 9, the Branch elected not to restate comparative figures. Any adjustments to the carrying amounts of financial assets and liabilities at the date of transition were recognised in the profit and loss account of the current period.
The financial effects due to the adoption of IFRS 9 by the Bahrain branch on these unconsolidated condensed interim financial statements are as follows:
(Un-audited) September 30,
2018Rupees in ‘000
General provision - under IFRS-9
Balances with other banks 6 Lendings to financial institutions 1,766 Investments 91,335 Advances 12,022
105,129 Related deferred tax asset (36,795)
68,334

21JS Bank nine months period ended September 30, 2018
Notes to the Unconsolidated Condensed InterimFinancial StatementsFor the nine months period ended September 30, 2018
5.3 New / Revised Standards, Interpretations and Amendments
There are certain new and amended standards and interpretations that are mandatory for the accounting periods beginning on or after January 1, 2018 but are considered not to be relevant on the Bank’s operations.
6. FINANCIAL RISK MANAGEMENT
The financial risk management objectives and policies applied during the period are consistent with those disclosed in the annual financial statements of the Bank for the year ended December 31, 2017.
(Un-audited) (Audited) September 30, December 31,
2018 2017
Note ----- Rupees in ‘000 ---- 7. LENDINGS TO FINANCIAL INSTITUTIONS - NET
Call money lendings - net of provision 7.1 1,828,842 3,003,443 Due against bills re-discounting - 112,756
1,828,842 3,116,199
7.1 The amount is net of general provision of Rs. 1.766 million (December 31, 2017: Rs. Nil) resulted from adoption of IFRS 9 by Bahrain Branch ( See note 5.2).

22 JS Bank nine months period ended September 30, 2018
Notes to the Unconsolidated Condensed InterimFinancial StatementsFor the nine months period ended September 30, 2018
8. INVESTMENTS - net (Unaudited) (Audited)
September 30, 2018 December 31, 2017 Held by Given as Held by Given as
Bank collateral Total Bank collateral Total Note --------------------------------- Rupees in ‘000 ---------------------------------
8.1 INVESTMENTS BY TYPES:
Held-for-trading securities
Market treasury bills 8,958,800 - 8,958,800 6,835,735 926,032 7,761,767 Pakistan investment bonds 39,219 - 39,219 709,872 - 709,872
8,998,019 - 8,998,019 7,545,607 926,032 8,471,639
Available-for-sale securities
Market treasury bills 1,490,953 - 1,490,953 11,501,193 2,991,504 14,492,697 Pakistan investment bonds 34,481,558 33,454,670 67,936,228 54,600,373 39,372,049 93,972,422 Ordinary shares of listed companies 8.1.1 3,017,398 - 3,017,398 3,681,463 - 3,681,463 Ordinary shares of unlisted companies 13,406 - 13,406 13,406 - 13,406 Preference shares of listed companies 136,589 - 136,589 136,589 - 136,589 Term finance certificates - listed 164,618 - 164,618 182,322 - 182,322 Term finance certificates - unlisted 8.1.2 579,168 - 579,168 575,596 - 575,596 Sukuk certificates - listed 529,000 - 529,000 - - - Sukuk certificates - unlisted 290,000 - 290,000 1,631,000 - 1,631,000 Foreign currency bonds 4,590,649 1,896,714 6,487,363 1,899,702 2,431,932 4,331,634
45,293,339 35,351,384 80,644,723 74,221,644 44,795,485 119,017,129 Held-to-maturity securities
Pakistan investment bonds 41,079,275 - 41,079,275 41,398,485 - 41,398,485
Investments in subsidiaries 1,919,121 - 1,919,121 1,919,121 - 1,919,121
Investments in associate 8.1.3 180,000 - 180,000 - - -
Total investments at cost 97,469,754 35,351,384 132,821,138 125,084,857 45,721,517 170,806,374
Less: Provision for diminution in thevalue of investments (880,735) - (880,735) (1,071,851) - (1,071,851)
Less: General provision - under IFRS-9 5.2 (91,335) - (91,335) - - -
Investments (net of provision) 96,497,684 35,351,384 131,849,068 124,013,006 45,721,517 169,734,523
Unrealised loss on revaluation ofinvestments classified as held-for-trading (7,673) - (7,673) (2,474) (14) (2,488)
(Deficit) / surplus on revaluation of available-for-sale securities (1,346,747) (1,080,423) (2,427,170) 75,006 (195,483) (120,477)
Total investments at market value 95,143,264 34,270,961 129,414,225 124,085,538 45,526,020 169,611,558
8.1.1 Included herein are the investments in related parties amounting to Rs. 1,897.183 million (December 31, 2017: Rs.1,763.581 million) having market value of Rs. 2,189.210 million (December 31, 2017: Rs.2,296.841 million).
8.1.2 Included herein is the investment of Rs. 65.022 million (December 31, 2017: Rs.65.022 million) in a related party at the rate of 6 months KIBOR + 1.75% maturing on December 04, 2017. Due to weak financial position of the investee the Bank has recognised full impairment loss on these Term Finance Certificates.
8.1.3 During the period, the Bank has invested in the shares of an associated company, a public unlisted company (9.6% shareholding). The Bank has classified the investment as an associate on account of it’s significant influence over the investee company.

23JS Bank nine months period ended September 30, 2018
Notes to the Unconsolidated Condensed InterimFinancial StatementsFor the nine months period ended September 30, 2018
9.1 Advances include Rs. 5,105.430 million (December 31, 2017: Rs.3,257.997 million) which have been placed under non-performing status as detailed below:
September 30, 2018 (Un-audited)
Domestic Overseas Total Provision required
Provision heldCategory of classification
------------------------------------ Rupees in ‘000 ------------------------------------Other assets especially mentioned 605,407 - 605,407 8,888 8,888 Substandard 1,302,239 - 1,302,239 57,309 57,309 Doubtful 289,899 - 289,899 60,751 60,751 Loss 2,907,885 - 2,907,885 2,632,549 2,632,549
5,105,430 - 5,105,430 2,759,497 2,759,497
December 31, 2017 (Audited)
Domestic Overseas Total Provision required
Provision heldCategory of classification
--------------------------------------- Rupees in ‘000 ---------------------------------------Other assets especially mentioned 5,222 - 5,222 - - Substandard 336,818 - 336,818 44,307 44,307 Doubtful 131,328 - 131,328 7,333 7,333 Loss 2,784,629 - 2,784,629 2,587,320 2,587,320
3,257,997 - 3,257,997 2,638,960 2,638,960
(Un-audited) (Audited) September 30, December 31,
2018 2017Note -------- Rupees in ‘000 --------
9. ADVANCES - net
Loans, cash credits, running finances, etc. In Pakistan 205,805,206 160,635,485 Outside Pakistan 1,639,492 702,934
207,444,698 161,338,419
Net investment in finance lease in Pakistan 17,548,593 13,781,334
Bills discounted and purchased (excluding treasury bills)Payable in Pakistan 6,208,755 6,174,461 Payable outside Pakistan 3,481,029 5,584,681
9,689,784 11,759,142
Advances - gross 234,683,075 186,878,895
Provision against non-performing advances - specific 9.1 (2,759,497) (2,638,960)Provision against advances - general (153,519) (100,353)General provision - under IFRS-9 5.2 (12,022) -
(2,925,038) (2,739,313)
Advances - net of provision 231,758,037 184,139,582

24 JS Bank nine months period ended September 30, 2018
Notes to the Unconsolidated Condensed InterimFinancial StatementsFor the nine months period ended September 30, 2018
10. OPERATING FIXED ASSETS
During the nine months period, the Bank has made additions of Rs.1,135.557 million (September 30, 2017: Rs.1,024.241 million) including capital work in progress of Rs.94.042 million (September 30, 2017: Rs.89.207 million) and deletions of Rs.259.573 million (September 30, 2017: Rs.113.960 million) having written down value of Rs. 40.337 million (September 30, 2017: Rs.23.642 million).
(Un-audited) (Audited) September 30, December 31,
2018 201711. DEPOSITS AND OTHER ACCOUNTS Note ----- Rupees in ‘000 -----
CustomersFixed deposits 128,622,103 131,902,422 Savings deposits 59,821,646 47,266,416 Current accounts 63,742,205 70,197,106 Margin accounts 4,095,776 3,967,204
256,281,730 253,333,148 Financial institutionsRemunerative deposits 53,216,835 35,724,471 Non-remunerative deposits 788,336 1,019,947
54,005,171 36,744,418
11.1 310,286,901 290,077,566 11.1 Particulars of deposits
In local currency 290,787,558 276,922,230 In foreign currencies 19,499,343 13,155,336
310,286,901 290,077,566 12. DEFERRED TAX LIABILITIES - net
Deferred tax (debits) arising from:
Provision against investments (57,149) (57,149)Provision against loans and advances (24,471) (3,523)Provision against other assets (853) (15,682)General provision - under IFRS-9 (36,795) - Unrealised (loss) / gain on revaluation of derivative instruments (3,650) 25,227 Unrealised loss on revaluation of investments
classified as held-for-trading (2,686) (871)Provision for Sindh Workers' Welfare Fund (26,145) (26,145)Deficit on revaluation of investments classified as
available-for-sale (849,510) (42,167) (1,001,259) (120,310)
Deferred tax credits arising due to:
Operating fixed assets 224,110 214,793 Goodwill 512,268 512,268 Surplus on revaluation of operating fixed assets 326,461 187,861 Surplus on revaluation of non-banking assets
acquired in satisfaction of claims 2,105 2,191 1,061,294 942,340
63,685 796,803

25JS Bank nine months period ended September 30, 2018
Notes to the Unconsolidated Condensed InterimFinancial StatementsFor the nine months period ended September 30, 2018
13. ISSUED, SUBSCRIBED AND PAID-UP CAPITAL
13.1 During the period, after having SBP approval vide its letter No. ‘BPRD/LD-01/602-AM&AoA/16933/2018-8446’, the shareholders of the Bank in their Annual General Meeting held on March 07, 2018 increased its authorised capital by Rs.5 billion, divided into 500 million ordinary shares of Rs.10 each.
13.2 On February 19, 2018, issued, subscribed and paid-up capital of the Bank has also increased by Rs. 2,250 million divided into 225 million ordinary shares of Rs. 10 each. The increase was on account of conversion of unlisted preference shares of Rs. 1,500 million divided into 150 million shares of Rs. 10 each at a conversion ratio of 1:1.5 (i.e. for every one preference share one and half ordinary shares were issued). The ordinary shares are issued at Rs. 6.67 per share i.e. at a discount of Rs. 3.33 per share as per the approvals of Securities and Exchange Commission of Pakistan vide its letter No. EMD/CI/102/2010 dated December 19, 2013 and State Bank of Pakistan vide its letter No. BPRD/BA&CA/649/19755/2013 dated December 30, 2013.
13.3 As at September 30, 2018, Jahangir Siddiqui & Co. Ltd. (the parent company) held 973,307,324 (December 31, 2017: 755,245,007) ordinary shares of Rs.10 each 75.02% holding (December 31, 2017: 70.42%).
(Un-audited) (Audited) September 30, December 31,
2018 2017Note ----- Rupees in ‘000 -----
14. (DEFICIT) / SURPLUS ON REVALUATIONOF ASSETS - net of tax
Available-for-sale securities (1,577,660) (78,310)Operating fixed assets 14.1 848,107 473,539 Non-banking assets acquired in satisfaction of claims 94,889 95,050
(634,664) 490,279
14.1 At June 30, 2018, the Bank has carried out the revaluation exercise by an independent valuer, which has resulted in additional surplus on leasehold lands and buildings of Rs.117.166 million and Rs.410.933 million over their written down value of Rs. 1,088.960 million and Rs.1,331.119 million, respectively.The fair values were determined with reference to market based evidence, based on active market prices and relevant enquiries and information as considered necessary, and adjusted for any difference in nature, location or condition of the specific properties.Had there been no revaluation, the carrying value of leasehold lands and buildings would have been lower by Rs.241.820 million and Rs. 932.749 million respectively, and net surplus on revaluation of fixed assets, deferred tax liability and depreciation would have been lower by Rs.848.106 million, Rs. 326.461 million and Rs. 14.931 million respectively.

26 JS Bank nine months period ended September 30, 2018
Notes to the Unconsolidated Condensed InterimFinancial StatementsFor the nine months period ended September 30, 2018
(Un-audited) (Audited) September 30, December 31,
2018 2017Note -------- Rupees in ‘000 --------
15. CONTINGENCIES AND COMMITMENTS
15.1 Transaction-related contingent liabilities
Includes performance bonds, bid bonds, warranties, advancepayment guarantees, shipping guarantees and standbyletters of credit related to particular transactions
i) Government 27,302,385 31,008,823 ii) Banking companies and other financial institutions 5,868,051 5,532,988 iii) Others 8,491,588 8,477,789
15.1.1 41,662,024 45,019,600
15.1.1 Included herein the outstanding guarantees of Rs.19.201 million (December 31, 2017: Rs.31.454 million) of related parties.
15.2 Trade-related contingent liabilities
Documentary credits 15.2.1 17,813,058 21,558,098
15.2.1 Included herein is an outstanding amount of Rs.25.414 million (December 31, 2017: Rs.44.016 million) of related parties.
15.3 Commitments in respect of forward lending
Forward commitment to extend credit 856,834 21,398,301
15.4 Commitments in respect of capital expenditures 107,349 94,975
15.5 Commitments in respect of derivative instruments
15.5.1 Forward exchange contracts
Purchase 14,876,919 6,689,099
Sale 6,876,784 4,960,361
15.5.2 Forward investment securities
15.5.2.1 Government securities
Purchase 3,997,208 1,496,072
Sale - 115,811
15.5.2.2 Foreign currency bonds
Sale 119,031 -
15.5.3 Cross currency swaps (notional principal) 4,732,880 4,223,400
15.5.4 Options (notional principal) 2,115,746 2,421,402

27JS Bank nine months period ended September 30, 2018
Notes to the Unconsolidated Condensed InterimFinancial StatementsFor the nine months period ended September 30, 2018
16. Other provision - net
This includes provision made during the period on account of adoption of IFRS 9 by Bahrain branch of the Bank (see note 5.2), and reversal of provision against other assets.
17. Income tax
During the period, the Additional Commissioner Inland Revenue (ACIR) has allowed the appeal effects of tax years 2008-2014, in the light of appeal orders given by Commissioner Inland Revenue – Appeals (the CIRA), as a result thereof effect of certain significant issues have been allowed (i.e. accrued markup income, repair and maintenance expense, provision against advances under Rule 1(c) of seventh schedule of the Income Tax Ordinance, 2001, dividend income and partial reliefs given in reversal of provision against advances and contract wages). Appeal effect of certain issues (amortisation of Goodwill and withholding tax on contract wages) for which appeals of the tax department are pending at higher appellate forums are kept pending and will be decided on outcome of such department appeals. Appeal effect order is pending in respect of tax year 2015.
For tax year 2008, ACIR has allowed the appeal effect after consideration of the CIRA decision that assessment in the year had become barred by time limitation and hence additions or disallowances made through the first amendment order had not legal effect. As a result of passing of appeal effect order, the income and tax liability have been reverted to position as per the return filed.
For tax year 2010-2014, the Bank has not accepted the appeal effects in which benefits are not allowed on the direction of the CIRA and filed further appeals with CIRA where ACIR is directed to re-examine the issues in the light of directions of predecessor CIRA’s decision and issue revise appeal effect orders after duly adjudicating as per law ensuring adequate opportunity of being heard to the Bank. Appeal is pending in respect of tax year 2015.
The management of Bank is confident that the appeals filed above and which are already pending at Appellate Tribunal on matters where relief has not been allowed at CIRA level will be decided in the Bank’s favor and accordingly no demand for payment would arise.
Nine months period ended Quarter endedSeptember 30, September 30, September 30, September 30,
2018 2017 2018 2017Note ------------------------ Rupees in '000 ------------------------
18. EARNINGS PER SHARE
Profit after taxation for the period - attributable to ordinary equity holders of theBank for diluted earnings 756,170 416,999 71,875 132,854
Preference dividend paid for the year ended December 31, 2017@ 12% p.a. (December 31, 2016: 12% p.a) (180,000) (180,000) - -
Profit attributable to ordinary equity holders of the Bank for basic earnings 576,170 236,999 71,875 132,854
Weighted average number of outstanding --------------------------- Numbers ---------------------------ordinary shares during the period for basic earnings 1,257,079,647 1,072,464,262 1,297,464,262 1,072,464,262
Weighted average number of outstanding ordinary shares during the period for diluted earnings 1,257,079,647 1,072,464,262 1,297,464,262 1,297,464,262
--------------------------- Rupee ---------------------------
Basic earnings per share 18.1 0.46 0.22 0.06 0.12
Diluted earnings per share 18.1 0.46 0.22 0.06 0.10

28 JS Bank nine months period ended September 30, 2018
Notes to the Unconsolidated Condensed InterimFinancial StatementsFor the nine months period ended September 30, 2018
18.1 The diluted earnings per share increased for the nine months period ended when taking the convertible preference shares into account, therefore the convertible preference shares are anti-dilutive and are excluded from the weighted average number of ordinary shares for the purpose of diluted earnings per share. Further, no impact of dilution has been taken for the quarter ended September 30, 2018, due to conversions of preference shares as disclosed in note 13 of these unconsolidated condensed interim financial statements.
19. FAIR VALUE OF FINANCIAL INSTRUMENTS
IFRS 13 "Fair Value Measurement" defines fair value as the price that would be received to sell an asset or paid to transfer a liability in an orderly transaction between market participants at the measurement date.
The fair value of quoted securities other than those classified as held to maturity, is based on quoted market price. Fair value of fixed term loans, other assets, other liabilities and fixed term deposits cannot be calculated with sufficient reliability due to absence of current and active market for these assets and liabilities and reliable data regarding market rates for similar instruments. The provision for impairment of loans and advances has been calculated in accordance with the Bank's accounting policy as stated in note 6.9 to the annual audited financial statements for the year ended December 31, 2017.
Management is of the view that the fair value of the remaining financial assets and financial liabilities are not significantly different from their carrying values since assets and liabilities are either short term in nature or in the case of customer loans and deposits are frequently repriced.
Fair value hierarchy
IFRS 13 requires the Bank to classify fair value measurement using a fair value hierarchy that reflects the significance of the inputs used in making the measurements. The fair value hierarchy has following levels:
Level 1: Quoted prices (unadjusted) in active markets for identical assets or liabilities that the entity can access at the measurement date.
Level 2: Inputs other than quoted prices included within Level 1 that are observable for the asset or liability, either directly or indirectly.
Level 3: Unobservable inputs for the asset or liability.
19.1 Valuation techniques used in determination of fair values
Item Valuation approach and input used
Shares of listed companies Fair values of investments in listed equity securities are valued on the basis of closing quoted market prices available at the Pakistan Stock Exchange.
Units of mutual funds Fair values of investments in units of mutual funds are determined based on redemption prices disclosed at the Mutual Funds Association of Pakistan (MUFAP) as at the close of the business days.
Pakistan Investment Bonds / Market Treasury Bills
Fair values of Pakistan Investment Bonds and Market Treasury Bills are derived using PKRV rates (Reuters page).
Term Finance Certificates and Bonds
Investments in debt securities (comprising term finance certificates, bonds and any other security issued by a company or a body corporate for the purpose of raising funds in the form of redeemable capital) are valued on the basis of the rates announced by the Mutual Funds Association of Pakistan (MUFAP) and Bloomberg in case of foreign bonds, in accordance with the methodology prescribed by the Securities and Exchange Commission of Pakistan.
Derivatives The fair values of derivatives which are not quoted in active markets are determined by using valuation techniques. The valuation techniques take into account the relevant underlying parameters including foreign currencies involved, interest rates, yield curves, volatilities, contracts duration, etc.

29JS Bank nine months period ended September 30, 2018
Notes to the Unconsolidated Condensed InterimFinancial StatementsFor the nine months period ended September 30, 2018
19.2 The following table provides an analysis of financial instruments that are measured subsequent to initial recognition at fair value, grouped into Level 1 to Level 3 based on the degree to which the fair value is observable.
September 30, 2018 (Un-audited)Level 1 Level 2 Level 3 Total
--------------------- Rupees in ‘000 ----------------------
On balance sheet financial instruments
Financial assets classified as ‘held-for-trading’ securities
Market treasury bills - 8,951,656 - 8,951,656 Pakistan investment bonds - 38,690 - 38,690
- 8,990,346 - 8,990,346 Financial assets classified as ‘available-for-sale’ securities
Market treasury bills - 1,490,206 - 1,490,206 Pakistan investment bonds - 65,744,074 - 65,744,074 Ordinary shares of listed companies 2,798,202 - - 2,798,202 Sukuk certificates - 528,736 - 528,736 Foreign currency bonds - 6,107,908 - 6,107,908
2,798,202 73,870,924 - 76,669,126 2,798,202 82,861,270 - 85,659,472
Non-Financial Assets
Revalued operating fixed assets - - 2,929,635 2,929,635 Non-banking assets acquired in satisfaction of claims - - 202,364 202,364
- - 3,131,999 3,131,999 2,798,202 82,861,270 3,131,999 88,791,471
Off balance sheet financial instruments
Forward government securities
Purchase - 3,998,339 - 3,998,339
Foreign currency bonds
Sale - 118,947 - 118,947
Forward exchange contracts
Purchase - 14,824,976 - 14,824,976
Sale - 6,863,230 - 6,863,230
Cross currency swaps (notional principal) - 5,607,461 - 5,607,461
Options (notional principal) - 2,123,358 - 2,123,358

30 JS Bank nine months period ended September 30, 2018
Notes to the Unconsolidated Condensed InterimFinancial StatementsFor the nine months period ended September 30, 2018
December 31, 2017 (Audited)Level 1 Level 2 Level 3 Total--------------------- Rupees in ‘000 ---------------------
On balance sheet financial instruments
Financial assets classified as ‘held-for-trading’ securities
Market Treasury Bills - 7,761,553 - 7,761,553 Pakistan Investment Bonds - 707,598 - 707,598
- 8,469,151 - 8,469,151 Financial assets classified as ‘available-for-sale’ securities
Market Treasury Bills - 14,492,712 - 14,492,712 Pakistan Investment Bonds - 93,429,759 - 93,429,759 Ordinary shares of listed companies 3,546,572 - - 3,546,572 Foreign currency bonds - 4,350,638 - 4,350,638
3,546,572 112,273,109 - 115,819,681 3,546,572 120,742,260 - 124,288,832
Non-Financial Assets
Operating fixed assets - - 2,439,249 2,439,249 Non banking asset under satisfaction of claims - - 203,339 203,339
- - 2,642,588 2,642,588 3,546,572 120,742,260 2,642,588 126,931,420
Off balance sheet financial instruments
Forward exchange contracts
Purchase - 1,495,823 - 1,495,823
Sale - 116,000 - 116,000
Forward government securities
Purchase - 6,851,332 - 6,851,332
Sale - 5,061,071 - 5,061,071
Cross currency swaps (notional principal) - 4,489,958 - 4,489,958
Options (notional principal) - 2,426,276 - 2,426,276

31JS Bank nine months period ended September 30, 2018
Notes to the Unconsolidated Condensed InterimFinancial StatementsFor the nine months period ended September 30, 2018
20. SEGMENT DETAILS WITH RESPECT TO BUSINESS ACTIVITIES
The segment analysis with respect to business activity is as follows:
2018
Corporate finance
Tradingand
sales Retail
banking Commercial
banking
Paymentand
settlement Others Total -------------------------------------------------- Rupees in ‘000 --------------------------------------------------
September 30, 2018 (Un-audited)Total income - external 332,101 7,726,298 5,268,114 10,134,876 189,982 85,672 23,737,043 Inter-segment revenues - net - (4,222,509) 7,263,886 (3,041,377) - - - Total income 332,101 3,503,789 12,532,000 7,093,499 189,982 85,672 23,737,043 Total expenses (81,333) (4,278,558) (11,216,301) (6,287,903) (80,418) (525,677) (22,470,190)Provisions / impairments - 23,091 (337,104) 231,987 - 42,368 (39,658)Current taxation - - - - - (540,626) (540,626)Prior year taxation - - - - - - - Deferred taxation - - - - - 69,601 69,601 Net income / (loss) 250,768 (751,678) 978,595 1,037,583 109,564 (868,662) 756,170
September 30, 2018 (Un-audited)Segment assets (gross) - 145,128,064 71,882,445 167,374,517 - 17,323,490 401,708,516 Segment non performing assets - 880,735 1,443,335 3,662,095 - 13,299 5,999,464 Segment provision required - (973,842) (489,728) (2,435,310) - (13,299) (3,912,179)Segment liabilities - 43,545,755 218,504,340 106,712,135 3,986,736 8,885,071 381,634,037
2017
Corporate finance
Tradingand
sales Retail
banking Commercial
banking
Paymentand
settlement Others Total --------------------------------------------- Rupees in ‘000 ---------------------------------------------
September 30, 2017 (Un-audited)Total income - external 393,307 8,280,910 3,041,616 4,930,459 132,104 55,475 16,833,871 Inter-segment revenues - net - (6,702,207) 6,177,891 524,316 - - - Total income 393,307 1,578,703 9,219,507 5,454,775 132,104 55,475 16,833,871 Total expenses (46,574) (1,177,063) (8,875,648) (5,299,753) (72,091) (316,942) (15,788,071)Provisions / impairments - - (166,767) (53,899) - - (220,666)Current taxation - - - - - (266,700) (266,700)Prior year taxation - - - - - (115,944) (115,944)Deferred taxation - - - - - (25,491) (25,491)Net income / (loss) 346,733 401,640 177,092 101,123 60,013 (669,602) 416,999
December 31, 2017 (Audited)Segment assets (gross) - 187,440,326 82,645,783 108,870,958 - 13,118,287 392,075,354 Segment non-performing assets - 1,622,691 613,448 2,644,549 - 10,861 4,891,549 Segment provision required - (1,071,851) (283,887) (2,355,075) - (55,665) (3,766,478)Segment liabilities - 57,126,105 219,370,286 83,137,017 3,824,278 8,181,861 371,639,547

32 JS Bank nine months period ended September 30, 2018
Notes to the Unconsolidated Condensed InterimFinancial StatementsFor the nine months period ended September 30, 2018
21.
RELA
TED
PART
Y TRA
NSAC
TIONS
The B
ank h
as re
lated
party
relat
ionsh
ips w
ith its
asso
ciates
, pare
nt, su
bsidia
ries,
comp
anies
havin
g com
mon d
irecto
rs, co
mpan
ies in
whic
h pare
nt ho
lds m
ore th
an 20
% sh
ares,
emplo
yee b
enefi
t plan
s, an
d its
key m
anag
emen
t pers
onne
l (inclu
ding t
heir a
ssoc
iates
).
Contr
ibutio
ns to
the a
ccou
nts in
respe
ct of
staff r
etirem
ent b
enefit
s are
made
in ac
corda
nce w
ith te
rms o
f the c
ontrib
ution
plan
s. Re
mune
ration
of th
e key
mana
geme
nt pe
rsonn
el are
in acc
ordan
ce w
ith th
e term
s of th
eir em
ploym
ent. O
ther tr
ansac
tions
are c
arried
out a
s per
agree
d term
s.
The d
etails
of tra
nsac
tions
with
relat
ed pa
rties,
other
than t
hose
whic
h hav
e bee
n spe
cifica
lly dis
close
d else
where
in th
ese fi
nanc
ial sta
temen
ts are
as fo
llows:
Key m
anag
emen
t pers
onne
lSu
bsidia
ry co
mpan
iesCo
mpan
ies in
whic
h pare
nt co
mpan
y hold
s 20%
or m
ore“C
ompa
nies h
aving
co
mmon
direc
torsh
ip”Ot
her re
lated
partie
s(U
n-aud
ited)
(Audit
ed)
(Un-a
udite
d)(Au
dited
)(U
n-aud
ited)
(Audit
ed)
(Un-a
udite
d)(Au
dited
)(U
n-aud
ited)
(Audit
ed)
Septe
mber
30,
Dece
mber
31,
Septe
mber
30,
Dece
mber
31,
Septe
mber
30,
Dece
mber
31,
Septe
mber
30,
Dece
mber
31,
Septe
mber
30,
Dece
mber
31,
2018
2017
2018
2017
2018
2017
2018
2017
2018
2017
Adva
nces
------
------
------
------
------
------
------
------
------
------
------
------
------
------
------
---- (R
upee
s in ‘0
00) --
------
------
------
------
------
------
------
------
------
------
------
------
------
------
------
--
Open
ing ba
lance
708,3
67
478,0
64
- -
179,6
75
437,5
64
3,39
7 5,
673
1,93
7,128
1,
300,2
23
Disbu
rseme
nts 42
9,466
42
6,791
-
1,60
0,000
2,
070,7
74
1,23
0,400
-
- 2,
559,9
71
4,12
0,420
Re
paym
ents
(320
,455)
(196
,488)
- (1
,600,0
00)
(1,74
0,199
) (1
,488,2
89)
(977
) (2
,276)
(2,18
7,113
) (3
,483,5
15)
Closin
g bala
nce
817,3
78
708,3
67
- -
510,2
50
179,6
75
2,42
0 3,
397
2,30
9,986
1,
937,1
28
Disbu
rseme
nts m
ade d
uring
the n
ine
mon
ths pe
riod e
nded
Septe
mber
30, 2
017
288,0
68
1,60
0,000
27
7,872
-
2,63
6,636
Repa
ymen
ts ma
de du
ring t
he ni
ne m
onths
perio
d end
ed Se
ptemb
er 30
, 201
7 (1
35,53
0) (1
,600,0
00)
(360
,066)
(963
) (2
,609,8
99)
Mark-
up / r
eturn
/ inter
est e
arned
for th
e nine
mon
ths pe
riod e
nded
Septe
mber
30, (U
n-aud
ited)
26,91
6 25
,662
- 99
9 36
,693
9,06
7 90
13
0 16
8,198
78
,750
Paren
tKe
y man
agem
ent p
erson
nel
Subs
idiary
comp
anies
Comp
anies
in w
hich p
arent
comp
any h
olds 2
0% or
more
Comp
anies
havin
g co
mmon
direc
torsh
ipOt
her re
lated
partie
s(U
n-aud
ited)
(Audit
ed)
(Un-a
udite
d)(Au
dited
)(U
n-aud
ited)
(Audit
ed)
(Un-a
udite
d)(Au
dited
)(U
n-aud
ited)
(Audit
ed)
(Un-a
udite
d)(Au
dited
)Se
ptemb
er 30
,De
cemb
er 31
,Se
ptemb
er 30
,De
cemb
er 31
,Se
ptemb
er 30
,De
cemb
er 31
,Se
ptemb
er 30
,De
cemb
er 31
,Se
ptemb
er 30
,De
cemb
er 31
,Se
ptemb
er 30
,De
cemb
er 31
,20
1820
1720
1820
1720
1820
1720
1820
1720
1820
1720
1820
17De
posit
s---
------
------
------
------
------
------
------
------
------
------
------
------
------
------
------
- (Rup
ees in
‘000
) -----
------
------
------
------
------
------
------
------
------
------
------
------
------
------
-----
Open
ing ba
lance
1,
502,5
78
767,2
43
67,60
7 56
,583
1,71
2,553
1,
094,2
76
3,83
4,390
3,
617,5
57
4,67
3,999
95
6,255
2,
793,9
91
3,43
8,466
De
posit
s duri
ng th
e peri
od 6,
661,1
97
6,10
9,040
1,
837,5
36
1,23
5,286
30
3,783
,089
633,3
23,67
8 74
,054,4
59
69,32
6,794
42
,937,2
39
36,18
9,984
22
,079,4
47
30,18
7,288
Wi
thdraw
als du
ring t
he pe
riod
(7,04
4,398
) (5
,373,7
05)
(1,77
2,796
) (1
,224,2
62)
(304,5
35,80
0) (6
32,70
5,401
) (6
2,611
,823)
(69,1
09,96
1) (4
5,566
,087)
(32,4
72,24
0) (2
2,647
,698)
(30,8
31,76
3)
Closin
g bala
nce
1,11
9,377
1,
502,5
78
132,3
47
67,60
7 95
9,842
1,
712,5
53
15,27
7,026
3,
834,3
90
2,04
5,151
4,
673,9
99
2,22
5,740
2,
793,9
91
Depo
sits m
ade d
uring
the n
ine m
onths
peri
od en
ded S
eptem
ber 3
0, 20
17 5,
646,5
11
907,8
06
443,3
28,54
6 58
,555,5
92
24,07
8,616
24
,666,2
47
Withd
rawals
mad
e duri
ng th
e nine
mon
ths p
eriod
ende
d Sep
tembe
r 30,
2017
(3,35
0,534
) (8
75,99
3) (4
41,84
0,786
) (5
9,372
,054)
(22,5
39,57
5) (2
3,819
,588)
Mark-
up / r
eturn
/ inter
est e
xpen
se fo
r the n
ine m
onths
p
eriod
ende
d Sep
tembe
r 30,
(Un-au
dited
) 90
,716
62,19
3 2,
843
1,49
6 71
,416
87,47
8 17
9,446
15
3,708
25
8,174
72
,485
120,5
99
166,5
46

33JS Bank nine months period ended September 30, 2018
Notes to the Unconsolidated Condensed InterimFinancial StatementsFor the nine months period ended September 30, 2018
Lendings to financial institutions Borrowings
(Un-audited) (Audited) (Un-audited) (Audited) September 30, December 31, September 30, December 31,
2018 2017 2018 2017
Companies in which parentcompany holds 20% or more
Opening balance - - 4,000,000 - Disbursements 1,600,000 - 184,700,000 110,840,000 Repayments (1,600,000) - (188,700,000) (106,840,000)Closing balance - - - 4,000,000
Disbursements made during the nine months period ended September 30, 2017 - 23,500,000
Repayments made during the nine monthsperiod ended September 30, 2017 - (23,500,000)
Mark-up / return / interest earned / expensed for the nine months period ended September 30, (Un-audited) 929 - 71,457 15,464
Un-auditedParent companySeptember 30,
2018 2017 ----- (Rupees in ‘000) -----
Nature of transactionsIssuance of ordinary shares
on conversion of preference shares 2,180,623 - Rent expense paid / accrued 1,275 1,134 Reimbursement of expenses 5,039 3,741 Preference dividend paid 174,450 174,450
(Un-audited)
Subsidiary companiesCompanies having
common directorship
Companies in which parent company holds 20%
or more Other related parties September 30, September 30, September 30, September 30,
2018 2017 2018 2017 2018 2017 2018 2017---------------------------------------------------- (Rupees in ‘000) ----------------------------------------------------
Nature of transactions
Sale of government securities 21,621 30,486 - - 151,966,478 37,092,619 6,165,807 10,471,063 Purchase of government securities - - - - 16,633,158 520,213 286,948 605,630 Sale of Sukuk - - - - - - - - Investment made in associate company - - - - - - 180,000 - Sale of forward foreign exchange contracts - - - - 5,696,679 7,502,930 - - Purchase of forward foreign exchange contracts - - - - 4,208,284 5,188,918 - - Rent received / receivable 2,784 2,518 - - - - - - Rent expense paid / accrued 5,208 3,976 - - - - - - Letter of credits - - 61,458 57,955 - - 71,387 94,245 Letter of guarantees - - - - 9,000 - 15,000 - Reimbursement of expenses 1,419 1,988 - - - - 500 2,770 Payment to staff benefit plan - - - - - - 175,118 118,308 Payment to staff contribution plan - - - - - - 132,896 100,818 Remuneration to
key management personnel - - - - - - 465,138 375,522 Director fees and allowances - - - - - - 9,250 9,600 Insurance claim received - - - - 10,701 17,184 - - Insurance premium paid - - - - 192,894 152,088 71,649 49,821 Expenses incurred on behalf of 786 863 - - - - - - Services rendered 3,150 3,150 - - - - - - Commission paid / accrued 1,098 1,995 - - - - - - Commission income - 4,057 123 23,457 110,802 64,831 129,089 94 Dividend Income - 26,118 - - 12,703 14,239 - 37,467 Advisory Income 21,000 - - - - - 4,850 - Advisory fee - - - - - - 39,000 35,000 Trustee fee - - - - 1,500 - - Issuance of ordinary shares on conversion of preference shares - - - - - - 18,491 - Preference dividend paid - - - - - - 1,479 1,479 Services received - - - - - - 803 587

34 JS Bank nine months period ended September 30, 2018
Notes to the Unconsolidated Condensed InterimFinancial StatementsFor the nine months period ended September 30, 2018
22. GENERAL
The figures in these unconsolidated condensed interim financial statements have been rounded off to the nearest thousand.
23. DATE OF AUTHORISATION FOR ISSUE
These unconsolidated condensed interim financial statements were authorised for issue by the Board of Directors of the Bank in their meeting held on October 26, 2018.
Chairman President and Director Director Chief Financial Chief Executive Officer Officer

33JS Bank nine months period ended September 30, 2018
Consolidated Condensed InterimFinancial Statements

34 JS Bank nine months period ended September 30, 2018
Consolidated Condensed Interim Statement of Financial Position As at September 30, 2018
Chairman President and Director Director Chief Financial Chief Executive Officer Officer
(Un-audited) (Audited) September 30, December 31,
2018 2017Note -------- Rupees in ‘000 --------
ASSETSCash and balances with treasury banks 17,066,653 17,334,111 Balances with other banks - net 415,467 1,049,496 Lendings to financial institutions - net 8 1,828,842 3,116,199 Investments - net 9 130,758,168 170,288,835 Advances - net 10 232,108,076 184,161,175 Operating fixed assets 11 8,837,847 7,589,702 Deferred tax assets - net 13 58,749 - Other assets - net 10,334,952 7,414,358
401,408,754 390,953,876
LIABILITIESBills payable 3,986,736 3,824,278 Borrowings 53,477,529 64,557,043 Deposits and other accounts 12 309,327,060 288,365,014 Sub-ordinated loans 4,997,800 4,998,800 Liabilities against assets subject to finance lease 51,003 5,032 Deferred tax liabilities - net 13 - 686,941 Other liabilities 10,432,279 8,848,854
382,272,407 371,285,962
NET ASSETS 19,136,347 19,667,914
REPRESENTED BY:Share capital 14 12,974,643 10,724,643 Discount on issue of shares 14 (2,855,401) (2,105,401)Preference shares 14 - 1,500,000 Reserves 1,724,099 1,540,987 Unappropriated profit 5,932,413 5,463,357
17,775,754 17,123,586 Non-controlling interest 1,478,469 1,463,454
19,254,223 18,587,040 (Deficit) / surplus on revaluation of assets - net of tax 15 (117,876) 1,080,874
19,136,347 19,667,914
CONTINGENCIES AND COMMITMENTS 16
The annexed notes from 1 to 24 form an integral part of these consolidated condensed interim financial statements.

35JS Bank nine months period ended September 30, 2018
Consolidated Condensed InterimProfit And Loss Account (Un-audited)For the nine months period ended September 30, 2018
Chairman President and Director Director Chief Financial Chief Executive Officer Officer
Nine months period ended Quarter endedSeptember 30, September 30, September 30, September 30,
2018 2017 2018 2017Note ------------------------ Rupees in ‘000 ------------------------
Mark-up / return / interest earned 21,668,456 14,275,398 7,622,799 5,723,499 Mark-up / return / interest expensed 14,908,481 9,767,018 5,325,455 4,000,506 Net mark-up / interest income 6,759,975 4,508,380 2,297,344 1,722,993
Provision against non-performing loans and advances - net (173,703) (220,666) (49,836) (142,028)Reversal against diminution in the value of investments - net 231,857 8,505 174,009 - Bad debts written off directly - - - -
58,154 (212,161) 124,173 (142,028)Net mark-up / return / interest income after provisions 6,818,129 4,296,219 2,421,517 1,580,965
NON MARK-UP / INTEREST INCOMEFee, commission and brokerage income 2,509,199 2,167,536 696,963 610,450 Dividend income 124,028 154,509 27,021 24,951 Income from dealing in foreign currencies 572,416 250,861 332,378 117,687 (Loss) / gain on sale of securities - net (402,507) 733,010 (436,018) 278,212 Unrealised (loss) / gain on revaluation of investments
classified as held-for-trading - net (24,336) (6,710) (35,548) 1,718 Share of profit from associate 4,982 - 796 - Other income - net 55,031 139,287 (100,270) 48,602 Total non-mark-up / interest income 2,838,813 3,438,493 485,322 1,081,620
9,656,942 7,734,712 2,906,839 2,662,585 NON MARK-UP / INTEREST EXPENSESAdministrative expenses 8,224,357 6,645,005 2,781,411 2,444,589 Other provision / (reversal) - net 17 57,071 - (8,647) - Other charges 27,637 34,039 2,814 3,645 Total non-mark-up / interest expenses 8,309,065 6,679,044 2,775,578 2,448,234
1,347,877 1,055,668 131,261 214,351 Extra ordinary / unusual items - - - -
PROFIT BEFORE TAXATION 1,347,877 1,055,668 131,261 214,351
Taxation- Current (614,282) (394,702) (116,519) (81,108)- Prior years (14,883) (115,944) - - - Deferred 79,852 (15,444) 59,842 (14,930)
18 (549,313) (526,090) (56,677) (96,038)PROFIT AFTER TAXATION 798,564 529,578 74,584 118,313
Attributable to:Equity holders of the Bank 785,944 483,685 73,953 123,475 Non-controlling interest 12,620 45,893 631 (5,162)
798,564 529,578 74,584 118,313
--------------------------- Rupee ---------------------------
Basic earnings per share 19 0.48 0.28 0.06 0.12
Diluted earnings per share 19 0.48 0.28 0.06 0.10
The annexed notes from 1 to 24 form an integral part of these consolidated condensed interim financial statements.

36 JS Bank nine months period ended September 30, 2018
Consolidated Condensed Interim Statement of Comprehensive Income (Un-Audited)For the nine months period ended September 30, 2018
Chairman President and Director Director Chief Financial Chief Executive Officer Officer
Nine months period ended Quarter endedSeptember 30, September 30, September 30, September 30,
2018 2017 2018 2017 ------------------- Rupees in ‘000 -------------------
Profit after taxation 798,564 529,578 74,584 118,313
Other comprehensive income
Items that will not be reclassified to profit and loss - -
Items that are or may be reclassified to profit or lossin subsequent periods
Effect of translation of net investment in foreign branch 31,878 737 580 716
Comprehensive income transferred to equity 830,442 530,315 75,164 119,029
Components of comprehensive income not reflected in equity
Items that are or may be reclassified to profit or lossin subsequent periods
Deficit on revaluation of available-for-sale securities (2,375,945) (1,811,915) (972,261) (1,292,428)Related deferred tax asset 809,663 591,236 318,920 398,083
(1,566,282) (1,220,679) (653,341) (894,345)
Total comprehensive (loss) / income for thethe period - net of tax (735,840) (690,364) (578,177) (775,316)
Attributable to:
Equity holders of the Bank (651,883) (668,926) (554,955) (700,718)Non-controlling interest (83,957) (21,438) (23,222) (74,598)
(735,840) (690,364) (578,177) (775,316)
Surplus on revaluation of ‘operating fixed assets - net of tax’ and ‘non-banking assets - net of tax’ is presented under a separate head below equity as ‘ surplus on revaluation of assets - net of tax’ in accordance with the disclosure format for quarterly/ interim financial statements of banks as prescribed by SBP vide BSD Circular Letter No. 2 of May 12, 2004 and Regulation for Debt Property Swap issued vide BPRD Circular No. 1 dated January 01, 2016.
The annexed notes from 1 to 24 form an integral part of these consolidated condensed interim financial statements.

37JS Bank nine months period ended September 30, 2018
Consolidated Condensed Interim Statement of Changes In Equity For the nine months period ended September 30, 2018
Chairman President and Director Director Chief Financial Chief Executive Officer Officer
Attributable to shareholders of the Bank
Share capital
Discount on issue of
shares Preference
Shares
Reserves Unappropr iated profit Sub total
Non-controlling
interest Total Statutory * Exchange translation
---------------------------------------------------------------- Rupees in ‘000 ------------------------------------------------------------------- Balance as at
January 01, 2017 (Audited) 10,724,643 (2,105,401) 1,500,000 1,334,138 (17) 4,858,613 16,311,976 1,434,391 17,746,367 Total comprehensive income for the nine
months period ended September 30, 2017
Profit after taxation - - - - - 483,685 483,685 45,893 529,578 Other comprehensive income - net of tax - - - - 737 - 737 - 737
- - - - 737 483,685 484,422 45,893 530,315 Transfer from surplus on revaluation
of non-banking assets on account of incremental depreciation for the period - net of tax - - - - - 161 161 - 161
Transaction with owners recorded directly in equity
Preference dividend for the period ended December 31, 2016 @ 12% p.a - - - - - (180,000) (180,000) - (180,000)
Dividend paid to non controlling interest for theyear ended December 31, 2016 @ Rs.0.5 - - - - - - - (13,965) (13,965)
TransfersTransfer to statutory reserve - - - 83,400 - (83,400) - - -
Balance as at September 30, 2017 (Un-audited) 10,724,643 (2,105,401) 1,500,000 1,417,538 720 5,079,059 16,616,559 1,466,319 18,082,878 Total comprehensive income for the
period ended December 31, 2017
Profit after taxation - - - - - 543,154 543,154 (5,846) 537,308 Other comprehensive Income / (loss) - - - - 11,499 (55,602) (44,103) - (44,103)
- - - - 11,499 487,552 499,051 (5,846) 493,205 Transfer from surplus on revaluation
of operating fixed assets on account of incrementaldepreciation for the period - net of tax - - - - - 7,923 7,923 2,981 10,904
Transfer from surplus on revaluation of non-banking assets on account of incremental depreciation for the period - net of tax - - - - - 53 53 - 53
TransfersTransfer to statutory reserve - - - 111,230 - (111,230) - - -
Balance as at December 31, 2017 (Audited) 10,724,643 (2,105,401) 1,500,000 1,528,768 12,219 5,463,357 17,123,586 1,463,454 18,587,040 Total comprehensive income for the nine
months period ended September 30, 2018Profit after taxation - - - - - 785,944 785,944 12,620 798,564 Other comprehensive income - - - - 31,878 - 31,878 - 31,878
- - - - 31,878 785,944 817,822 12,620 830,442 Transfer from surplus on revaluation
of operating fixed assets on account of incrementaldepreciation for the period - net of tax - - - - - 14,185 14,185 2,395 16,580
Transfer from surplus on revaluation of non-banking assets on account of incremental depreciation for the period - net of tax - - - - - 161 161 - 161
Transaction with owners recordeddirectly in equity
Preference dividend paid for the year ended December 31, 2017 @ 12% p.a. - - - - - (180,000) (180,000) - (180,000)
Preference shares cancelled on conversioninto ordinary shares during the period (note14) - - (1,500,000) - - - (1,500,000) - (1,500,000)
Issuance of ordinary shares on conversionof preference shares during the period (note14) 2,250,000 - - - - - 2,250,000 - 2,250,000
Discount on issue of ordinary sharesduring the period (note14) - (750,000) - - - - (750,000) - (750,000)
2,250,000 (750,000) - - - - 1,500,000 - 1,500,000 TransfersTransfer to statutory reserve - - - 151,234 - (151,234) - - -
Balance as at September 30, 2018 (Un-audited) 12,974,643 (2,855,401) - 1,680,002 44,097 5,932,413 17,775,754 1,478,469 19,254,223
* This represents reserve created under Section 21(i)(a) of the Banking Companies Ordinance, 1962.
The annexed notes from 1 to 24 form an integral part of these consolidated condensed interim financial statements.

38 JS Bank nine months period ended September 30, 2018
Consolidated Condensed Interim Cash Flow Statement (Un-audited)For the nine months period ended September 30, 2018
Chairman President and Director Director Chief Financial Chief Executive Officer Officer
September 30, September 30,2018 2017
-------- Rupees in ‘000 -------- CASH FLOW FROM OPERATING ACTIVITIESProfit before taxation 1,332,994 1,055,668 Less: Dividend income (124,028) (154,509)
Share of profit from associate (4,982) - 1,203,984 901,159
Adjustments:Depreciation 551,946 476,930 Depreciation on non-banking assets 975 975 Amortisation of intangibles 53,182 46,572 Charge for defined benefit plan 128,244 114,365 Unrealised loss on revaluation of investments classified as held-for-trading 7,673 6,710 Provision against non-performing loans and advances - net 173,703 220,666 Reversal for diminution in the value of investments - net (191,116) (8,505)Other reversals 62,761 - Unrealised gain on revaluation of derivative instruments 35,659 (38,084)Gain on disposal of operating fixed assets (97,040) (56,168)Finance cost 6,116 - Provision for Sindh Workers’ Welfare Fund 26,905 21,006
759,008 784,467 1,962,992 1,685,626
(Increase) / decrease in operating assetsLendings to financial institutions 1,285,591 5,056,068 Investment in held-for-trading securities - net (1,244,630) 64,977,448 Advances - net (48,132,626) (56,974,576)Other assets (excluding advance taxation) (2,345,966) (1,436,446)
(50,437,631) 11,622,494 Increase in operating liabilitiesBills payable 162,458 1,541,923 Borrowings (11,019,735) 69,853,352 Deposits and other accounts 20,962,046 46,191,528 Other liabilities 1,603,392 828,567
11,708,161 118,415,370 (36,766,478) 131,723,490
Income tax paid (1,170,481) (674,555)Gratuity paid (175,118) (118,308)Finance cost paid (6,116) - Net cash flows / (used in) from operating activities (38,118,193) 130,930,627
CASH FLOW FROM INVESTING ACTIVITIESNet investment in available-for-sale securities 38,357,232 (85,283,764)Net investment in held-to maturity securities 319,210 (41,502,527)Investment in associated company (180,000) - Dividend received 111,333 135,395 Investment in operating fixed assets (1,329,947) (1,085,972)Sale proceeds from disposal of operating fixed assets 140,854 81,103 Net cash flows from / (used in) investing activities 37,418,682 (127,655,765)
CASH FLOW FROM FINANCING ACTIVITIESSub-ordinated loans (1,000) (600)Preference dividend paid (180,000) (180,000)Capital repayment of finance lease obligations 6,931 - Dividend paid to non-controlling interest - (13,965)Net cash used in financing activities (174,069) (194,565)
Effect of translation of net investment in foreign branches 31,878 737
Increase in cash and cash equivalents (841,702) 3,081,034
Cash and cash equivalents at beginning of the period 18,184,611 16,236,482
Cash and cash equivalents at end of the period 17,342,909 19,317,516
The annexed notes from 1 to 24 form an integral part of these consolidated condensed interim financial statements.

39JS Bank nine months period ended September 30, 2018
Notes to the Consolidated Condensed Interim Financial Statements For the nine months period ended September 30, 2018
1. STATUS AND NATURE OF BUSINESS
1.1 The “Group” consists of:
1.1.1 Holding Company
JS Bank Limited (the Bank / JSBL), incorporated in Pakistan, is a scheduled bank, engaged in commercial banking and related services. The Bank’s ordinary shares are listed on Pakistan Stock Exchange Limited (PSX). The Bank is a subsidiary of Jahangir Siddiqui & Co. Ltd. (JSCL). The registered office of the Bank is situated at Shaheen Commercial Complex, Dr. Ziauddin Ahmed Road, Karachi. The Bank operates with 323 (December 31, 2017: 322) branches / sub-branches in Pakistan and one wholesale banking branch in Bahrain (December 31, 2017: one). The Pakistan Credit Rating Agency Limited (PACRA) has assigned the long-term entity rating of the Bank to ‘AA-’ (Double A Minus) and short-term entity rating at ‘A1+’ (A One Plus), which is the highest possible short-term rating. The ratings denote a very low expectation of credit risk and indicate very strong capacity for timely payment of financial commitments.
Jahangir Siddiqui Investment Bank Limited, JSIBL, (formerly Citicorp Investment Bank Limited which was acquired by JSCL on February 01, 1999), and its holding company, JSCL, entered into a Framework Agreement with American Express Bank Limited, New York (AMEX) on November 10, 2005 for acquisition of its American Express Bank Limited - Pakistan Branches, (AEBL). Consequently, a new banking company, JSBL was incorporated on March 15, 2006 and a restricted Banking License was issued by the State Bank of Pakistan (SBP) on May 23, 2006.
A Transfer Agreement was executed on June 24, 2006 between JSIBL and JSBL for the transfer of entire business and undertaking of JSIBL to JSBL and a separate Transfer Agreement was also executed on June 24, 2006, between AMEX and JSBL for the transfer of AEBL’s commercial banking business in Pakistan with all assets and liabilities (other than certain excluded assets and liabilities) (AEBL business). The shareholders of JSIBL and JSBL in their respective extra ordinary general meetings held on July 31, 2006 approved a Scheme of Amalgamation (the Scheme) under Section 48 of the Banking Companies Ordinance, 1962. The Scheme was initially approved by the Securities and Exchange Commission of Pakistan (SECP) vide its letter No. SC/NBFC(J)-R/JSIBL/2006/517 dated September 28, 2006. Subsequently, the Scheme was sanctioned by the SBP vide its order dated December 02, 2006 and, in accordance therewith, the effective date of amalgamation was fixed at December 30, 2006.

40 JS Bank nine months period ended September 30, 2018
Notes to the Consolidated Condensed Interim Financial Statements For the nine months period ended September 30, 2018
1.1.2 Subsidiary companies
JS Global Capital Limited (JSGCL)
JS Global Capital Limited, JSGCL, is principally owned by the Bank, holding 67.16% of its equity interest. The Bank acquired effective controlling interest in JSGCL on December 21, 2011 and April 15, 2016 of 51.05% and 16.11% respectively. The ownership interest has increased by 16.11%, without any change in the cost of investment, due to the fact that JSGCL has bought back its 11,993,000 ordinary shares out of its 50 million ordinary shares in 2016. JSGCL is a public listed company incorporated in Pakistan under the Companies Act, 2017. The shares of the JSGCL are listed on Pakistan Stock Exchange (PSX). Further, the JSGCL is a corporate member of PSX and member of Pakistan Mercantile Exchange. The principal business of the JSGCL is to carry out share brokerage, money market, forex and commodity brokerage, advisory and consultancy services. Other activities include investment in a mix of listed and unlisted equity and debt securities and reverse repurchase transactions. The registered office of the JSGCL is situated at 6th floor, Faysal House, Shahra-e-Faisal, Karachi, Pakistan.
JS Investments Limited (JSIL)
JS Investments Limited, JSIL, is principally owned by the Bank, holding 65.16% of its equity interest. The Bank acquired effective controlling interest in JSIL on November 01, 2012 and December 22, 2015 of 52.24% and 12.92% respectively. The ownership interest has increased by 12.92%, without any change in the cost of investment, due to the fact that JSIL has bought back its 19,828,182 ordinary shares out of its 100 million ordinary shares in 2016. JSIL is a public listed company incorporated in Pakistan on February 22, 1995 under the Companies Act, 2017. The shares of the JSIL are listed on the Pakistan Stock Exchange (PSX), formerly since April 24, 2007. The registered office of the JSIL is situated at 7th Floor, ‘The Forum’, Khayaban-e-Jami, Clifton, Karachi.The JSIL has obtained the license of an “Investment Advisor” and “Asset Management Company” (AMC) under the Non-Banking Finance Companies (Establishment and Regulation) Rules, 2003 (the NBFC Rules) and the Non-Banking Finance Companies and Notified Entities Regulations, 2008 (the NBFC Regulations). In addition, the Company has also obtained registration to act as Pension Fund Manager under the Voluntary Pension System Rules, 2005.
- At period end, JSIL is an asset management company of the following funds:
Open ended funds:
- JS Value Fund- JS Growth Fund- Unit Trust of Pakistan- JS Income Fund- JS Islamic Fund- JS Fund of Funds
Pension fund
- JS Pension Savings Fund
These funds have been treated as related parties in these consolidated condensed interim financial statements.
- JS Islamic Income Fund- JS Cash Fund- JS Large Cap. Fund- JS Capital Protected Fund V- JS Islamic Hybrid Fund of Funds - (JS IHFOF)- JS Islamic Hybrid Fund of Funds-2 (JS IHFOF-2)- JS Islamic Dedicated Equity Fund
- JS Islamic Pension Savings Fund

41JS Bank nine months period ended September 30, 2018
Notes to the Consolidated Condensed Interim Financial Statements For the nine months period ended September 30, 2018
JS ABAMCO Commodities Limited (JSACL)
JS Bank owns JS ABAMCO Commodities Limited, JSACL, indirectly through its subsidiary JS Investment Limited (JSIL) which has 100% holding in JSACL. JSACL was incorporated on September 25, 2007 as a public unlisted company under the Companies Act, 2017 and is a wholly owned subsidiary company of JSIL (a subsidiary of Holding Company). The principal activities of JSACL are to deal and effectuate commodity contracts; to become member of commodity exchange including National Commodity Exchange Limited (NCEL) and to carry on the business as brokers, advisory and consultancy services, dealers and representative of all kinds of commodity contracts and commodity backed securities. The registered office of the Company is situated at 7th Floor, ‘The Forum’, Khayaban-e-Jami, Clifton, Karachi. The Company has not commenced its commercial operations up to the balance sheet date.
2. BASIS OF CONSOLIDATION
The basis of consolidation adopted in the preparation of these consolidated condensed interim financial statements are the same as those applied in the preparation of annual consolidated financial statements for the year ended December 31, 2017.
3. STATEMENT OF COMPLIANCE
3.1 These consolidated condensed interim financial statements of the Group have been prepared in accordance with the accounting and reporting standards as applicable in Pakistan for interim financial reporting. The accounting and reporting standards as applicable in Pakistan for interim financial reporting comprise of:- International Accounting Standards (IAS) 34, Interim Financial Reporting, issued by
the International Accounting Standards Board (IASB) as notified under the Companies Act, 2017;
- Provisions of and directives issued under the Banking Companies Ordinance, 1962 and the Companies Act, 2017; and
- Directives issued by the State Bank of Pakistan (SBP) and the Securities and Exchange Commission of Pakistan (SECP).
Whenever the requirements of the Banking Companies Ordinance, 1962, The Companies Act, 2017 or the directives issued by the SBP and the SECP differ with the requirements of IAS 34, the requirements of the Banking Companies Ordinance, 1962, The Companies Act, 2017 and the said directives, shall prevail.”
3.2 The SBP vide BSD Circular No. 10, dated August 26, 2002 has deferred the applicability of International Accounting Standard 39, Financial Instruments: Recognition and Measurement and International Accounting Standard 40, Investment Property for Banking companies till further instructions. Further, according to the notification of the Securities and Exchange Commission of Pakistan (SECP) dated April 28, 2008, the IFRS - 7 “Financial Instruments: Disclosures” has not been made applicable for banks. Accordingly, the requirements of these standards have not been considered in the preparation of these consolidated condensed interim financial statements. However, investments have been classified and valued in accordance with the requirements of various circulars issued by the SBP.

42 JS Bank nine months period ended September 30, 2018
3.3 IFRS 8, ‘Operating Segments’ is effective for the Bank’s accounting period beginning on or after January 01, 2009. All banking companies in Pakistan are required to prepare their annual financial statements in line with the format prescribed under BSD Circular No. 4 dated February 17, 2006, ‘Revised Forms of Annual Financial Statements’, effective from the accounting year ended December 31, 2006. The management of the Bank believes that as the SBP has defined the segment categorization in the above mentioned circular, the SBP’s requirements prevail over the requirements specified in IFRS 8. Accordingly, segment information disclosed in these consolidated condensed interim financial statements is based on the requirements laid down by the SBP.
3.4 IFRS10 “Consolidated Financial Statements” was made applicable from period beginning on or after January 01, 2015 vide S.R.O 633(I)/2014 dated July 10, 2014 by SECP. However, SECP has directed that the requirements of consolidation under section 228 of the Companies Act, 2017 and IFRS-10 “Consolidated Financial Statements” are not applicable in case of investment by companies in mutual funds established under trust structure, through S.R.O 56(I) /2016 dated January 28, 2016. Accordingly, the requirements of these standards have not been considered in the preparation of these consolidated condensed interim financial statements.
3.5 The disclosures made in these consolidated condensed interim financial statements have been limited based on the format prescribed by the SBP vide BSD Circular No. 2 dated May 12, 2004 and International Accounting Standard 34, ‘Interim Financial Reporting’ and do not include all the disclosures required in the annual financial statements. Accordingly, these consolidated condensed interim financial statements should be read in conjunction with the annual audited financial statements of the Group for the year ended December 31, 2017.
4. BASIS OF MEASUREMENT
These consolidated condensed interim financial statements have been prepared under the historical cost convention except that certain assets are stated at revalued amounts / fair value as disclosed in the respective notes of the annual audited financial statements for the year ended December 31, 2017.
5. ACCOUNTING ESTIMATES AND JUDGMENTS
The estimates / judgments and associated assumptions used in the preparation of these consolidated condensed interim financial statements are consistent with those applied in the preparation of the consolidated annual financial statements of the Group for the year ended December 31, 2017.
6. SUMMARY OF SIGNIFICANT ACCOUNTING POLICIES
The accounting policies and the methods of computation adopted in the preparation of these consolidated condensed interim financial statements are the same as those applied in the preparation of the consolidated annual audited financial statements of the Group for the year ended December 31, 2017.
Notes to the Consolidated Condensed Interim Financial Statements For the nine months period ended September 30, 2018

43JS Bank nine months period ended September 30, 2018
6.1 Surplus / Deficit on Revaluation of Operating Fixed Assets
The Companies Ordinance, 1984 (the repealed Ordinance) was repealed through the enactment of the Companies Act, 2017 on May 30, 2017. However, as directed by the Securities and Exchange Commission of Pakistan vide circular No. 23 dated Oct 4, 2017, the financial reporting requirements of the Companies Act, 2017 were only made applicable for reporting periods starting from January 1, 2018.
The repealed Ordinance specified the accounting treatment for the surplus on revaluation on fixed assets, wherein, a deficit arising on revaluation of a particular property was to be adjusted against the total balance in the surplus account or, if no surplus existed, was to be charged to the profit and loss account as an impairment of the asset. However, the Companies Act, 2017 removed the specific provisions allowing the above treatment and hence, a deficit arising on revaluation of a particular property is now to be accounted for in accordance with applicable financial reporting standards, which requires that such deficit is to be taken to the profit and loss account as an impairment.
Consequently, the Bank has changed its policy for accounting for a deficit arising on revaluation of fixed assets and accordingly, any surplus/deficit arising on revaluation of owned property and non-banking assets acquired in satisfaction of claims is accounted for at individual assets level. The above change in accounting policy did not have any effect on these consolidated condensed interim financial statements.
6.2 Expected Credit Losses - IFRS 9
During the current period, the Bank’s Bahrain Operations, in line with their locally applicable regulatory framework, has adopted IFRS 9 ‘Financial Instruments’. As permitted by the transitional provisions of IFRS 9, the Branch elected not to restate comparative figures. Any adjustments to the carrying amounts of financial assets and liabilities at the date of transition were recognised in the profit and loss account of the current period.
The financial effects due to the adoption of IFRS 9 by the Bahrain branch on these consolidated condensed interim financial statements are as follows:
(Un-audited) September 30,
2018Rupees in ‘000
General provision - under IFRS-9
Balances with other banks 6 Lendings to financial institutions 1,766 Investments 91,335 Advances 12,022 Decrease in profit before tax 105,129 Related deferred tax asset (36,795)Decrease in profit after tax 68,334
Notes to the Consolidated Condensed Interim Financial Statements For the nine months period ended September 30, 2018

44 JS Bank nine months period ended September 30, 2018
6.3 New / Revised Standards, Interpretations and Amendments
There are certain new and amended standards and interpretations that are mandatory for the accounting periods beginning on or after January 1, 2018 but are considered not to be relevant on the Group’s operations.
7. FINANCIAL RISK MANAGEMENT
The financial risk management objectives and policies applied during the period are consistent with those disclosed in the consolidated annual financial statements of the Group for the year ended December 31, 2017.
(Un-audited) (Audited) September 30, December 31,
2018 2017Note ----- Rupees in ‘000 -----
8. LENDINGS TO FINANCIAL INSTITUTIONS - NET
Call money lendings - net of provision 8.1 1,828,842 3,003,443 Due against bills re-discounting - 112,756
1,828,842 3,116,199
8.1 The amount is net of general provision of Rs. 1.766 million (December 31, 2017: Rs. Nil) resulted from adoption of IFRS 9 by Bahrain Branch (See note 6.2).
Notes to the Consolidated Condensed Interim Financial Statements For the nine months period ended September 30, 2018
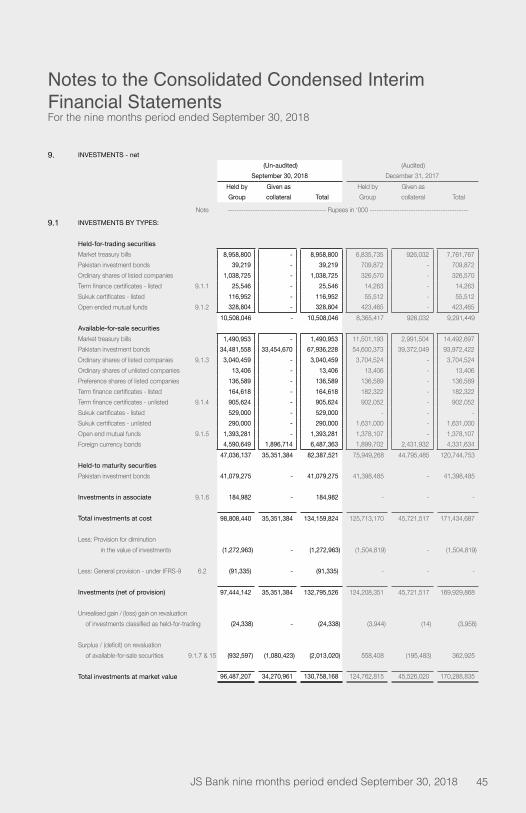
45JS Bank nine months period ended September 30, 2018
9. INVESTMENTS - net (Un-audited) (Audited)
September 30, 2018 December 31, 2017 Held by Given as Held by Given as Group collateral Total Group collateral Total
Note ------------------------------------------- Rupees in ‘000 -------------------------------------------
9.1 INVESTMENTS BY TYPES:
Held-for-trading securitiesMarket treasury bills 8,958,800 - 8,958,800 6,835,735 926,032 7,761,767 Pakistan investment bonds 39,219 - 39,219 709,872 - 709,872 Ordinary shares of listed companies 1,038,725 - 1,038,725 326,570 - 326,570 Term finance certificates - listed 9.1.1 25,546 - 25,546 14,263 - 14,263 Sukuk certificates - listed 116,952 - 116,952 55,512 - 55,512 Open ended mutual funds 9.1.2 328,804 - 328,804 423,465 - 423,465
10,508,046 - 10,508,046 8,365,417 926,032 9,291,449 Available-for-sale securitiesMarket treasury bills 1,490,953 - 1,490,953 11,501,193 2,991,504 14,492,697 Pakistan investment bonds 34,481,558 33,454,670 67,936,228 54,600,373 39,372,049 93,972,422 Ordinary shares of listed companies 9.1.3 3,040,459 - 3,040,459 3,704,524 - 3,704,524 Ordinary shares of unlisted companies 13,406 - 13,406 13,406 - 13,406 Preference shares of listed companies 136,589 - 136,589 136,589 - 136,589 Term finance certificates - listed 164,618 - 164,618 182,322 - 182,322 Term finance certificates - unlisted 9.1.4 905,624 - 905,624 902,052 - 902,052 Sukuk certificates - listed 529,000 - 529,000 - - - Sukuk certificates - unlisted 290,000 - 290,000 1,631,000 - 1,631,000 Open end mutual funds 9.1.5 1,393,281 - 1,393,281 1,378,107 - 1,378,107 Foreign currency bonds 4,590,649 1,896,714 6,487,363 1,899,702 2,431,932 4,331,634
47,036,137 35,351,384 82,387,521 75,949,268 44,795,485 120,744,753 Held-to maturity securitiesPakistan investment bonds 41,079,275 - 41,079,275 41,398,485 - 41,398,485
Investments in associate 9.1.6 184,982 - 184,982 - - -
Total investments at cost 98,808,440 35,351,384 134,159,824 125,713,170 45,721,517 171,434,687
Less: Provision for diminutionin the value of investments (1,272,963) - (1,272,963) (1,504,819) - (1,504,819)
Less: General provision - under IFRS-9 6.2 (91,335) - (91,335) - - -
Investments (net of provision) 97,444,142 35,351,384 132,795,526 124,208,351 45,721,517 169,929,868
Unrealised gain / (loss) gain on revaluationof investments classified as held-for-trading (24,338) - (24,338) (3,944) (14) (3,958)
Surplus / (deficit) on revaluation of available-for-sale securities 9.1.7 & 15 (932,597) (1,080,423) (2,013,020) 558,408 (195,483) 362,925
Total investments at market value 96,487,207 34,270,961 130,758,168 124,762,815 45,526,020 170,288,835
Notes to the Consolidated Condensed Interim Financial Statements For the nine months period ended September 30, 2018

46 JS Bank nine months period ended September 30, 2018
9.1.1 Included herein is an investment in a related party amounting to Rs. 25.546 million (December 31, 2017: Rs.14.263 million) having a market value of Rs. 25.568 million (December 31, 2017: Rs.14.307 million).
9.1.2 Included herein is an investment in a related party amounting to Rs. 228.804 million (December 31, 2017: Rs.198.465 million) having a market value of Rs. 227.198 million (December 31, 2017: Rs.201.250 million).
9.1.3 Included herein are the investments in related parties amounting to Rs. 1,897.183 million (December 31, 2017: Rs.1,763.581 million) and having market value of Rs. 2,189.210 million (December 31, 2017: Rs.2,296.841 million)
9.1.4 Included herein are the investments in a related party, of Rs. 391.478 million (December 31, 2017: Rs.391.478 million) at the rate of 6 months KIBOR ask rate + 1.75% to 11% p.a maturing between December 04, 2017 to October 19, 2020. Due to weak financial position of the company the Group has recognised full impairment loss on these term finance certificates.
9.1.5 Included herein is an investment in a related party amounting to Rs. 1,393.281 million (December 31, 2017: Rs.1,378.107 million) having a market value of Rs. 1,794.870 million (December 31, 2017: Rs.1,728.710 million).
9.1.6 During the period, the Bank has invested in the shares of an associated company, a public unlisted company (9.6% shareholding). The Bank has classified the investment as an associate on account of it’s significant influence over the investee company.
9.1.7 This includes surplus on revaluation of available for sale investments of subsidiaries amounting to Rs. 80.378 million (December 31, 2017: Rs.80.378 million) which represents the pre-acquisition surplus and has been included here only for meeting with requirement of the prescribed format of Banks / DFIs issued by the State Bank of Pakistan.
Notes to the Consolidated Condensed Interim Financial Statements For the nine months period ended September 30, 2018
(Un-audited) (Audited) September 30, December 31,
2018 2017Note ----- Rupees in ‘000 -----
10. ADVANCES - net
Loans, cash credits, running finances, etc.In Pakistan 206,155,245 160,657,078 Outside Pakistan 1,639,492 702,934
207,794,737 161,360,012
Net investment in finance lease in Pakistan 17,548,593 13,781,334
Bills discounted and purchased (excluding market treasury bills)Payable in Pakistan 6,208,755 6,174,461 Payable outside Pakistan 3,481,029 5,584,681
9,689,784 11,759,142
Advances - gross 235,033,114 186,900,488
Provision against non-performing advances - specific 10.1 (2,759,497) (2,638,960)Provision against advances - general (153,519) (100,353)General provision - under IFRS-9 6.2 (12,022) -
(2,925,038) (2,739,313)
Advances - net of provision 232,108,076 184,161,175

47JS Bank nine months period ended September 30, 2018
Notes to the Consolidated Condensed Interim Financial Statements For the nine months period ended September 30, 2018
10.1 Advances include Rs. 5,105.430 million (December 31, 2017: Rs.3,257.997 million) which have been placed under non-performing status as detailed below:
September 30, 2018 (Un-audited)
Domestic Overseas TotalProvision required
Provision held
------------------------------- Rupees in ‘000 -------------------------------Category of classificationOther assets especially mentioned 605,407 - 605,407 8,888 8,888 Substandard 1,302,239 - 1,302,239 57,309 57,309 Doubtful 289,899 - 289,899 60,751 60,751 Loss 2,907,885 - 2,907,885 2,632,549 2,632,549
5,105,430 - 5,105,430 2,759,497 2,759,497
December 31, 2017 (Audited)
Domestic Overseas TotalProvision required
Provisionheld
------------------------------- Rupees in ‘000 -------------------------------Category of classificationOther assets especially mentioned 5,222 - 5,222 - - Substandard 336,818 - 336,818 44,307 44,307 Doubtful 131,328 - 131,328 7,333 7,333 Loss 2,784,629 - 2,784,629 2,587,320 2,587,320
3,257,997 - 3,257,997 2,638,960 2,638,960
11. OPERATING FIXED ASSETS
11.1 During the nine months period, the Group made additions of Rs.1,329.947 million (September 30, 2017: Rs.1,085.972 million) including capital work in progress of Rs. 94.042 million (September 30, 2017: Rs. 89.207 million) and deletions of Rs. 276.022 million (September 30, 2017: Rs.116.666 million) having written down value of Rs. 43.814 million (September 30, 2017: Rs. 24.934 million).
(Un-audited) (Audited) September 30, December 31,
2018 201712. DEPOSITS AND OTHER ACCOUNTS Note -------- Rupees in ‘000 --------
CustomersFixed deposits 128,622,103 131,902,422 Savings deposits 59,821,646 47,266,416 Current accounts 63,742,205 70,197,106 Margin accounts 4,095,776 3,967,204
256,281,730 253,333,148 Financial institutionsRemunerative deposits 52,257,238 34,012,154 Non-remunerative deposits 788,092 1,019,712
53,045,330 35,031,866 12.1 309,327,060 288,365,014

48 JS Bank nine months period ended September 30, 2018
Notes to the Consolidated Condensed Interim Financial Statements For the nine months period ended September 30, 2018
(Un-audited) (Audited) September 30, December 31,
2018 2017 -------- Rupees in ‘000 --------
12.1 Particulars of deposits
In local currency 289,827,717 275,209,678 In foreign currencies 19,499,343 13,155,336
309,327,060 288,365,014
13. DEFERRED TAX ASSETS / (LIABILLITIES) - net
Deferred tax debits arising from:
Unused tax losses 47,046 48,043 Provision against investments 57,149 57,149 Provision against loans, advances and trade debts 141,434 124,518 Unrealized loss on revaluation of investment
classified as held-for-trading 2,990 620 Unrealised loss / (gain) on revaluation of derivative instruments 3,650 (25,227)Provision against other assets 853 15,682 General provision - under IFRS-9 36,795 - Provision for donation 79 197 Surplus on revaluation of investment classified as available-for-sale 856,342 46,941 Provision for Sindh Workers' Welfare Fund 43,049 46,332
1,189,387 314,255 Deferred tax (credits) arising due to:
Operating fixed assets (226,728) (220,463)Goodwill (512,268) (512,268)Surplus on revaluation of operating fixed assets (389,537) (266,274)Surplus on revaluation of non-banking assets
acquired In satisfaction of claims (2,105) (2,191) (1,130,638) (1,001,196)
58,749 (686,941)
14. ISSUED, SUBSCRIBED AND PAID-UP CAPITAL
14.1 During the period, after having SBP approval vide its letter No. ‘BPRD/LD-01/602-AM&AoA/16933/2018-8446’, the shareholders of the Bank in their Annual General Meeting held on March 07, 2018 increased its authorised capital by Rs.5 billion, divided into 500 million ordinary shares of Rs.10 each.
14.2 On February 19, 2018, issued, subscribed and paid-up capital of the Bank has also increased by Rs. 2,250 million divided into 225 million ordinary shares of Rs. 10 each. The increase was on account of conversion of unlisted preference shares of Rs. 1,500 million divided into 150 million shares of Rs. 10 each at a conversion ratio of 1:1.5 (i.e. for every one preference share one and half ordinary shares were issued). The ordinary shares are issued at Rs. 6.67 per share i.e. at a discount of Rs. 3.33 per share as per the approvals of Securities and Exchange Commission of Pakistan vide its letter No. EMD/CI/102/2010 dated December 19, 2013 and State Bank of Pakistan vide its letter No. BPRD/BA&CA/649/19755/2013 dated December 30, 2013.

49JS Bank nine months period ended September 30, 2018
Notes to the Consolidated Condensed Interim Financial Statements For the nine months period ended September 30, 2018
14.2 As at September 30, 2018, Jahangir Siddiqui & Co. Ltd. (the parent company) held 973,307,324 (December 31, 2017: 755,245,007) ordinary shares of Rs.10 each 75.02% holding (December 31, 2017: 70.42%).
(Un-audited) (Audited) September 30, December 31,
2018 2017 -------- Rupees in ‘000 --------
15. (DEFICIT) / SURPLUS ON REVALUATION OF ASSETS - net of tax
Available-for-sale securities (1,237,056) 329,226 Operating fixed assets 1,024,291 656,598 Non-banking assets acquired in satisfaction of claims 94,889 95,050
(117,876) 1,080,874
Group’s share (297,652) 804,521 Non-controlling interest 179,776 276,353
(117,876) 1,080,874
15.1 At the June 30, 2018 the Bank has carried out the revaluation exercise by an independent valuer, which has resulted in additional surplus on leasehold lands and buildings of Rs.117.166 million and Rs.410.933 million over their existing written down value of Rs. 1,088.960 million and Rs.1,627.694 million, respectively.
The fair values were determined with reference to market based evidence, based on active market prices and relevant enquiries and information as considered necessary, and adjusted for any difference in nature, location or condition of the specific properties.
Had there been no revaluation, the carrying value of leasehold lands and buildings would have been lower by Rs.241.820 million and Rs. 1,185.053 million respectively, and net surplus on revaluation of fixed assets, deferred tax liability and increamental depreciation would have been lower by Rs.1,024.291 million, Rs. 402.582 million and Rs. 24.098 million respectively.
(Un-audited) (Audited) September 30, December 31,
2018 2017Note -------- Rupees in ‘000 --------
16. CONTINGENCIES AND COMMITMENTS
16.1 Transaction-related contingent liabilities
Includes performance bonds, bid bonds, warranties, advance payment guarantees, shipping guarantees andstandby letters of credit related to particular transactions.
i) Government 27,302,385 31,008,823 ii) Banking companies and other financial institutions 5,868,051 5,532,988 iii) Others 16.1.1 8,491,588 8,477,789
41,662,024 45,019,600
16.1.1 Included herein the outstanding guarantees of Rs. 19.201 million (December 31, 2017: Rs.31.454 million) of related parties.
16.2 Trade-related contingent liabilities
Documentary credits 16.2.1 17,813,058 21,558,098

50 JS Bank nine months period ended September 30, 2018
16.2.1 Included herein is an outstanding amount of Rs. 25.414 million (December 31, 2017: Rs.44.016 million) of related parties.
(Un-audited) (Audited) September 30, December 31,
2018 2017 -------- Rupees in ‘000 --------
16.3 Commitments in respect of forward lending
Forward commitment to extend credit 856,834 21,398,301
16.4 Commitment in respect of capital expenditure 107,349 94,975
16.5 Commitments in respect of derivatives instruments
16.5.1 Forward exchange contracts
Purchase 14,876,919 6,689,099
Sale 6,876,784 4,960,361
16.5.2 Forward investment securities
16.5.2.1 Government and equity securities
Purchase 3,997,208 1,496,072
Sale 1,019,384 439,443
16.5.2.2 Foreign currency bonds
Purchase 119,031 -
16.5.3 Cross currency swaps (notional principal) 4,732,880 4,223,400
16.5.4 Options (notional principal) 2,115,746 2,421,402
16.6 Bank Guarantee from a commercial Bank in favorof National Clearing Company of Pakistan Limited 400,000 400,000
16.7 Outstanding (purchase) / sale against margin 39,253 4,529 financing contracts - net
17. Other provision - net
This includes provision made during the period on account of adoption of IFRS 9 by Bahrain branch of the Bank (see note 6.2), and reversal of provision against other assets.
18 Taxation
18.1 JS Bank Limited
During the period, the Additional Commissioner Inland Revenue (ACIR) has allowed the appeal effects of tax years 2008-2014, in the light of appeal orders given by Commissioner Inland Revenue – Appeals (the CIRA), as a result thereof effect of certain significant issues have been allowed (i.e. accrued markup income, repair and maintenance expense, provision against advances under Rule 1(c) of seventh schedule of the Income Tax Ordinance, 2001, dividend income and partial reliefs given in reversal of provision against advances and contract wages). Appeal effect of certain issues (amortisation of Goodwill and withholding tax on contract wages) for which appeals of the tax department are pending at higher appellate forums are kept pending and will be decided on outcome of such department appeals. Appeal effect order is pending in respect of tax year 2015.
Notes to the Consolidated Condensed Interim Financial Statements For the nine months period ended September 30, 2018

51JS Bank nine months period ended September 30, 2018
For tax year 2008, ACIR has allowed the appeal effect after consideration of the CIRA decision that assessment in the year had become barred by time limitation and hence additions or disallowances made through the first amendment order had not legal effect. As a result of passing of appeal effect order, the income and tax liability have been reverted to position as per the return filed.
For tax year 2010-2014, the Bank has not accepted the appeal effects in which benefits are not allowed on the direction of the CIRA and filed further appeals with CIRA where ACIR is directed to re-examine the issues in the light of directions of predecessor CIRA’s decision and issue revise appeal effect orders after duly adjudicating as per law ensuring adequate opportunity of being heard to the Bank. Appeal is pending in respect of tax year 2015.
The management of Bank is confident that the appeals filed above and which are already pending at Appellate Tribunal on matters where relief has not been allowed at CIRA level will be decided in the Bank’s favor and accordingly no demand for payment would arise.
Nine months period ended Quarter endedSeptember 30, September 30, September 30, September 30,
2018 2017 2018 2017Note ------------------------------ Rupees in '000 ------------------------------
19. EARNINGS PER SHARE
Profit after taxation for the period - attributable to ordinaryequity holders of the Holding Company for diluted earnings 785,944 483,685 73,953 123,475
Preference dividend paid for the year ended December 31, 2017 @ 12% p.a. (December 31, 2016: 12% p.a) (180,000) (180,000) - -
Profit attributable to ordinary equity holders of the Holding Company for basic earnings 605,944 303,685 73,953 123,475
------------------------------ Numbers ------------------------------ Weighted average number of outstanding ordinary shares
during the period for basic and diluted earnings 1,257,079,647 1,072,464,262 1,297,464,262 1,072,464,262
Weighted average number of outstanding ordinary sharesduring the period for basic and diluted earnings 1,257,079,647 1,072,464,262 1,297,464,262 1,297,464,262
------------------------------ Rupee ------------------------------
Basic earnings per share 19.1 0.48 0.28 0.06 0.12
Diluted earnings per share 19.1 0.48 0.28 0.06 0.10
19.1 The diluted earnings per share increased for the nine months period ended when taking the convertible preference shares into account, therefore the convertible preference shares are anti-dilutive and are excluded from the weighted average number of ordinary shares for the purpose of diluted earnings per share. Further, no impact of dilution has been taken for the quarter ended September 30, 2018, due to conversions of preference shares as disclosed in note14 of these consolidated condensed interim financial statements.
20 FAIR VALUE OF FINANCIAL INSTRUMENTS
IFRS 13 “Fair Value Measurement” defines fair value as the price that would be received to sell an asset or paid to transfer a liability in an orderly transaction between market participants at the measurement date.
Notes to the Consolidated Condensed Interim Financial Statements For the nine months period ended September 30, 2018

52 JS Bank nine months period ended September 30, 2018
The fair value of quoted securities other than those classified as held to maturity, is based on quoted market price. Fair value of fixed term loans, other assets, other liabilities and fixed term deposits cannot be calculated with sufficient reliability due to absence of current and active market for assets and liabilities and reliable data regarding market rates for similar instruments. The provision for impairment of loans and advances has been calculated in accordance with the Bank’s accounting policy as stated in note 7.10 to the consolidated annual audited financial statements for the year ended December 31, 2017.
Management is of the view that the fair value of the remaining financial assets and liabilities are not significantly different from their carrying values since assets and liabilities are either short term in nature or in the case of customer loans and deposits are frequently repriced.
Fair value hierarchy
IFRS 13 requires the Group to classify fair value measurement using a fair value hierarchy that reflects the significance of the inputs used in making the measurements. The fair value hierarchy has following levels:
Level 1: Quoted prices (unadjusted) in active markets for identical assets or liabilities that the entity can access at the measurement date.
Level 2: Inputs other than quoted prices included within Level 1 that are observable for the asset or liability, either directly or indirectly.
Level 3: Unobservable inputs for the asset or liability.
20.1 Valuation techniques used in determination of fair values
Item Valuation approach and input used
Units of mutual funds Fair values of investments in units of mutual funds are determined based on redemption prices disclosed at the Mutual Funds Association of Pakistan (MUFAP) as at the close of the business days.
Shares of listed companies Fair values of investments in listed equity securities are valued on the basis of closing quoted market prices available at the Pakistan Stock Exchange.
Pakistan Investment Bonds / Market Treasury Bills
Fair values of Pakistan Investment Bonds and Market Treasury Bills are derived using PKRV rates (Reuters page).
Term Finance Certificates and Bonds
Investments in debt securities (comprising Term Finance Certificates, Bonds and any other security issued by a company or a body corporate for the purpose of raising funds in the form of redeemable capital) are valued on the basis of the rates announced by the Mutual Funds Association of Pakistan (MUFAP) in accordance with the methodology prescribed by the SECP.
Derivatives The fair values of derivatives which are not quoted in active markets are determined by using valuation techniques. The valuation techniques take into account the relevant underlying parameters including foreign currencies involved, interest rates, yield curves, volatilities, contracts duration, etc.
Notes to the Consolidated Condensed Interim Financial Statements For the nine months period ended September 30, 2018

53JS Bank nine months period ended September 30, 2018
20.2 The following table provides an analysis of financial instruments that are measured subsequent to initial recognition at fair value, grouped into Levels 1 to 3 based on the degree to which the fair value is observable.
September 30, 2018 (Un-audited)Level 1 Level 2 Level 3 Total
----------------------- Rupees in ‘000 -----------------------On balance sheet financial instruments
Financial assets classified as ‘held-for-trading securities’Market treasury bills - 8,951,656 - 8,951,656 Pakistan investment bonds - 38,690 - 38,690 Ordinary shares of listed companies 1,023,364 - - 1,023,364 Open end mutual funds - 327,198 - 327,198 Sukuk certificates - listed - 117,231 - 117,231 Term finance certificates - listed - 25,568 - 25,568
1,023,364 9,460,343 - 10,483,707
Financial assets classified as ‘available-for-sale securities’Market treasury bills - 1,490,206 - 1,490,206 Pakistan investment bonds - 65,744,074 - 65,744,074 Ordinary shares of listed companies 2,833,824 - - 2,833,824 Sukuk certificates - 528,736 - 528,736 Open end mutual funds - 1,729,098 - 1,729,098 Foreign currency bonds - 6,107,908 - 6,107,908
2,833,824 75,600,022 - 78,433,846 3,857,188 85,060,365 - 88,917,553
Non-Financial AssetsOperating fixed assets (Lease hold lands and buildings) - - 3,226,210 3,226,210 Non banking asset under satisfaction of claims - - 202,364 202,364
- - 3,428,574 3,428,574 3,857,188 85,060,365 3,428,574 92,346,127
Off balance sheet financial instruments
Forward government and equity securitiesPurchase - 3,998,339 - 3,998,339 Sale 1,107,712 - - 1,107,712
Foreign currency bondsPurchase - 118,947 - 118,947
Forward exchange contractsPurchase - 14,824,976 - 14,824,976 Sale - 6,863,230 - 6,863,230
Cross currency swaps (notional principal) - 5,607,461 - 5,607,461
Options (notional principal) - 3,002,639 - 3,002,639
Notes to the Consolidated Condensed Interim Financial Statements For the nine months period ended September 30, 2018

54 JS Bank nine months period ended September 30, 2018
As at December 31, 2017 (Audited)Level 1 Level 2 Level 3 Total
----------------------- Rupees in ‘000 -----------------------On balance sheet financial instruments
Financial assets classified as held-for-trading securities Market treasury bills - 7,761,553 - 7,761,553 Pakistan investment bonds - 707,598 - 707,598 Ordinary shares of listed companies 322,414 - - 322,414 Sukuk certificates - listed - 69,678 - 69,678 Open end mutual funds - 426,249 - 426,249
322,414 8,965,078 - 9,287,492
Financial assets classified as available-for-sale securitiesMarket treasury bills - 14,492,712 - 14,492,712 Pakistan investment bonds - 93,429,759 - 93,429,759 Ordinary shares of listed companies 3,595,918 - - 3,595,918 Open end mutual funds - 1,728,711 - 1,728,711 Foreign currency bonds - 4,350,638 - 4,350,638
3,595,918 114,001,820 - 117,597,738 3,918,332 122,966,898 - 126,885,230
Non-Financial AssetsOperating fixed assets (Lease hold lands and buildings) - - 2,745,141 2,745,141 Non banking asset under satisfaction of claims - - 203,339 203,339
- - 2,948,480 2,948,480 3,918,332 122,966,898 2,948,480 129,833,710
Off balance sheet financial instruments
Forward exchange contractsPurchase - 6,851,332 - 6,851,332 Sale - 5,061,071 - 5,061,071
Forward government and equity securitiesPurchase - 1,495,823 - 1,495,823 Sale 323,632 116,000 - 439,632
Cross currency swaps (notional principal) - 4,489,958 - 4,489,958
Options (notional principal) - 2,123,358 - 2,123,358
Notes to the Consolidated Condensed Interim Financial Statements For the nine months period ended September 30, 2018

55JS Bank nine months period ended September 30, 2018
21. SEGMENT DETAILS WITH RESPECT TO BUSINESS ACTIVITIES
The segment analysis with respect to business activities are as follows:2018
Corporate Trading and Retail Commercial Payment and Asset finance sales banking banking settlement Brokerage Management Others Total
----------------------------------------------------------------- Rupees in ‘000 -----------------------------------------------------------------
September 30, 2018 (un-audited)
Total income -external 332,101 7,726,298 5,268,114 10,074,643 189,982 565,252 260,225 90,654 24,507,269 Inter-segment revenues - net - (4,222,509) 7,263,886 (3,041,377) - - - - -
Total income 332,101 3,503,789 12,532,000 7,033,266 189,982 565,252 260,225 90,654 24,507,269 Total expenses (81,333) (4,256,250) (11,211,093) (6,287,903) (80,418) (440,393) (277,408) (525,677) (23,160,475)(Provisions) / reversal - 23,091 (337,104) 231,987 - - 40,741 42,368 1,083 Current taxation - - - - - - - (614,282) (614,282)Prior year taxation - - - - - - - (14,883) (14,883)Deferred taxation - - - - - - - 79,852 79,852 Net income / (loss) 250,768 (729,370) 983,803 977,350 109,564 124,859 23,558 (941,968) 798,564
Attributable to:Equity holders of the Bank 785,944 Non-controlling interest 12,620
798,564 September 30, 2018 (un-audited)
Segment assets (gross) - 145,128,064 71,882,445 165,450,437 - 3,754,138 2,652,618 17,264,787 406,132,489 Segment non performing assets - 880,735 1,443,335 3,662,095 - 745,784 65,772 13,299 6,811,020 Segment provision required - (973,842) (489,728) (2,435,310) - (745,784) (65,772) (13,299) 4,723,735Segment liabilities - 43,545,755 218,504,340 105,738,111 3,986,736 1,333,610 278,779 8,885,076 382,272,407
2017Corporate Trading and Retail Commercial Payment and Asset
finance sales banking banking settlement Brokerage Management Others Total ----------------------------------------------------------------- Rupees in ‘000 -----------------------------------------------------------------
September 30, 2017 (unaudited)
Total income -external 393,307 8,254,792 3,041,616 4,930,459 132,104 643,692 262,446 55,475 17,713,891 Inter-segment revenues - net - (6,702,207) 6,177,891 524,316 - - - - -
Total income 393,307 1,552,585 9,219,507 5,454,775 132,104 643,692 262,446 55,475 17,713,891 Total expenses (46,574) (1,089,003) (8,875,648) (5,299,753) (72,091) (524,122) (221,929) (316,942) (16,446,062)Provisions / impairments - - (166,767) (53,899) - - 8,505 - (212,161)Current taxation - - - - - - - (394,702) (394,702)Prior year taxation - - - - - - - (115,944) (115,944)Deferred taxation - - - - - - - (15,444) (15,444)Net income / (loss) 346,733 463,582 177,092 101,123 60,013 119,570 49,022 (787,557) 529,578
Attributable to:Equity holders of the Bank 483,685 Non-controlling interest 45,893
529,578 December 31, 2017 (audited)
Segment assets (gross) - 185,483,705 82,645,783 108,870,958 - 2,710,777 2,743,142 13,118,285 395,572,650 Segment non performing loans
and Impaired Investments - 1,622,691 613,448 2,644,549 - 745,784 106,512 10,861 5,743,845 Segment provision required - (1,071,851) (283,887) (2,355,075) - (745,784) (106,512) (55,665) (4,618,774)Segment liabilities - 57,126,105 219,370,286 83,137,017 3,824,278 (636,426) 233,340 8,231,362 371,285,962
Notes to the Consolidated Condensed Interim Financial Statements For the nine months period ended September 30, 2018

56 JS Bank nine months period ended September 30, 2018
22.
RELA
TED
PART
Y TR
ANSA
CTIO
NS
The
Grou
p ha
s re
lated
par
ty re
lation
ship
with
its
asso
ciate
s, pa
rent
, com
panie
s ha
ving
com
mon
dire
ctor
s, co
mpa
nies
in wh
ich p
aren
t hold
s m
ore
than
20%
sha
res,
emplo
yee
bene
fit pla
ns, a
nd it
s ke
y m
anag
emen
t pe
rson
nel (i
nclud
ing th
eir a
ssoc
iates
).
Cont
ribut
ions t
o th
e acc
ount
s in r
espe
ct o
f sta
ff ret
irem
ent b
enefi
ts ar
e mad
e in a
ccor
danc
e with
term
s of t
he co
ntrib
ution
plan
s. Re
mun
erat
ion o
f the
key m
anag
emen
t per
sonn
el ar
e in a
ccor
danc
e with
the t
erm
s of t
heir
emplo
ymen
t. Ot
her t
rans
actio
ns a
re c
arrie
d ou
t as p
er a
gree
d te
rms.
The
deta
ils o
f tra
nsac
tions
with
relat
ed p
artie
s, ot
her t
han
thos
e wh
ich h
ave
been
spec
ificall
y disc
lose
d els
ewhe
re in
the
finan
cial in
form
atio
n is
as fo
llows
:
Key m
anag
emen
t per
sonn
elCo
mpa
nies i
n wh
ich p
aren
t co
mpa
ny h
olds 2
0% o
r mor
eCo
mpa
nies h
aving
co
mm
on d
irect
orsh
ipOt
her r
elate
d pa
rties
(Un-
audi
ted)
(A
udite
d)(U
n-au
dite
d)
(Aud
ited)
(Un-
audi
ted)
(A
udite
d)(U
n-au
dite
d)
(Aud
ited)
Sept
embe
r 30
, 201
8De
cem
ber
31, 2
017
Sept
embe
r 30
, 201
8De
cem
ber
31, 2
017
Sept
embe
r 30
, 201
8De
cem
ber
31, 2
017
Sept
embe
r 30
, 201
8De
cem
ber
31, 2
017
Adva
nces
------
------
------
------
------
------
------
------
------
--- (R
upee
s in
‘000
) ----
------
------
------
------
------
------
------
------
-----
Open
ing b
alanc
e 7
10,3
31
479
,860
1
79,6
75
437
,564
3
,397
5
,673
1
,989
,259
1
,303
,405
Di
sbur
sem
ents
523
,972
6
76,0
82
2,0
70,7
74
1,2
30,4
00
- -
2,5
59,9
71
3,5
02,9
47
Repa
ymen
ts (4
15,2
20)
(445
,611
) (1
,740
,199
) (1
,488
,289
) (9
77)
(2,2
76)
(2,1
87,1
13)
(2,8
17,0
93)
Clos
ing b
alanc
e 8
19,0
83
710
,331
5
10,2
50
179
,675
2
,420
3
,397
2
,362
,117
1
,989
,259
Disb
urse
men
ts m
ade
durin
g nin
e m
onth
spe
riod
ende
d Se
ptem
ber 3
0, 2
017
292
,178
2
77,8
72
- 2
,636
,636
Repa
ymen
t mad
e du
ring
nine
mon
ths
perio
d en
ded
Sept
embe
r 30,
201
7 (1
36,8
00)
(360
,066
) (9
63)
(2,6
09,8
99)
Mar
k-up
/ re
turn
/ int
eres
t ear
ned
for t
he n
inem
onth
s per
iod e
nded
Sep
tem
ber 3
0 (un
-aud
ited)
26,
916
25,
662
36,
693
9,0
67
90
130
1
68,1
98
78,
750
Pare
ntKe
y man
agem
ent p
erso
nnel
Com
panie
s in
which
par
ent
com
pany
hold
s 20%
or m
ore
Com
panie
s hav
ing
com
mon
dire
ctor
ship
Othe
r rela
ted
parti
es
(Un-
audi
ted)
(A
udite
d)(U
n-au
dite
d)
(Aud
ited)
(Un-
audi
ted)
(A
udite
d)(U
n-au
dite
d)
(Aud
ited)
(Un-
audi
ted)
(A
udite
d)Se
ptem
ber
30, 2
018
Dece
mbe
r 31
, 201
7Se
ptem
ber
30, 2
018
Dece
mbe
r 31
, 201
7Se
ptem
ber
30, 2
018
Dece
mbe
r 31
, 201
7Se
ptem
ber
30, 2
018
Dece
mbe
r 31
, 201
7Se
ptem
ber
30, 2
018
Dece
mbe
r 31
, 201
7De
posit
s---
------
------
------
------
------
------
------
------
------
------
------
--- (R
upee
s in
‘000
) ----
------
------
------
------
------
------
------
------
------
------
------
--
Open
ing b
alanc
e 1
,502
,578
7
67,2
43
36,
632
56,
583
3,8
34,3
90
3,6
17,5
57
4,6
73,9
99
956
,255
2
,793
,991
3
,438
,466
De
posit
s dur
ing th
e pe
riod
6,6
61,1
97
6,1
09,0
40
1,8
37,5
36
1,2
13,8
60
74,
054,
459
69,
326,
794
42,
937,
239
36,
189,
984
22,
079,
447
30,
187,
288
With
draw
als d
uring
the
perio
d (7
,044
,398
) (5
,373
,705
) (1
,772
,796
) (1
,233
,811
)(6
2,61
1,82
3)(6
9,10
9,96
1)(4
5,56
6,08
7)(3
2,47
2,24
0)(2
2,64
7,69
8)(3
0,83
1,76
3)Cl
osing
bala
nce
1,1
19,3
77
1,5
02,5
78
101
,372
3
6,63
2 1
5,27
7,02
6 3
,834
,390
2
,045
,151
4
,673
,999
2
,225
,740
2
,793
,991
Depo
sits m
ade
durin
g nin
e m
onth
s
perio
d en
ded
Sept
embe
r 30,
201
7 5
,646
,511
9
07,8
06
58,
555,
592
24,
078,
616
24,
666,
247
With
draw
als m
ade
durin
g nin
e m
onth
spe
riod
ende
d Se
ptem
ber 3
0, 2
017
(3,3
50,5
34)
(875
,993
)(5
9,37
2,05
4)(2
2,53
9,57
5)(2
3,81
9,58
8)
Mar
k-up
/ re
turn
/ int
eres
t exp
ense
d fo
r the
nine
mon
ths p
eriod
end
ed S
epte
mbe
r 30
(un-a
udite
d) 9
0,71
6 6
2,19
3 2
,843
1,4
96 1
79,4
46 1
53,7
08 2
58,1
74 7
2,48
5 1
20,5
99 1
66,5
46
Notes to the Consolidated Condensed Interim Financial Statements For the nine months period ended September 30, 2018

57JS Bank nine months period ended September 30, 2018
Lendings to financial institutions Borrowings
(Un-audited) (Audited) (Un-audited) (Audited)September 30, December 31, September 30, December 31,
2018 2017 2018 2017--------------------- (Rupees in '000) ---------------------
Companies in which parent company holds 20% or moreOpening balance - - 4,000,000 - Disbursements 1,600,000 - 184,700,000 110,840,000 Repayments (1,600,000) - (188,700,000) (106,840,000)Closing balance - - - 4,000,000
Disbursements made during the nine monthsperiod ended September 30, 2017 - 23,500,000
Repayments made during the nine monthsperiod ended September 30, 2017 - (23,500,000)
Mark-up / return / interest earned for the nine monthsperiod ended September 30, (Un-audited) 929 - 71,457 15,464
Material transactions with related parties are given below:
Companies having common directorship
Companies in which parent company holds 20% or more Other related parties
September 30, September 30, September 30,2018 2017 2018 2017 2018 2017-------------------------------------------------- (Unaudited) --------------------------------------------------
--------------------------------------- (Rupees in '000) ---------------------------------------Nature of transactions
Sale of Government Securities - - 151,966,478 37,092,619 6,165,807 10,471,063 Purchase of Government Securities - - 16,633,158 520,213 286,948 605,630 Purchase of Term Finance Certificate - - - - 15,000 - Investment made in associate company - - - - 180,000 - Sale of Sukuk / Ijara Sukuk - - - - 387,473 - Sale of shares / units - - - - 844,757 429,708 Purchase of shares / units - - - - 604,828 352,512 Purchase of forward
foreign exchange contracts - - 4,208,284 5,188,918 - - Sale of forward
foreign exchange contracts - - 5,696,679 7,502,930 - - Letter of credits 61,458 57,955 - - 71,387 94,245 Letter of guarantees - 9,000 15,000 - Payment to staff contribution plan - - - - 150,453 115,752 Payment to staff benefit plan - - - - 175,118 118,308 Remuneration of
key management personnel - - - - 534,480 431,760 Director fees and allowances - - - - 11,200 11,375 Insurance claim received - - 10,701 17,184 - - Insurance premium paid - - 197,825 152,088 81,555 54,041 Rent income received / receivable 993 1,185 - - 10,866 10,565 Expenses incurred on behalf 561 716 - - 35,747 17,969 Reimbursement of expenses 608 766 - - 30,029 18,413 Commission income 123 23,457 123,532 75,164 136,637 12,956 Dividend income - - 12,703 14,239 3,882 78,213 Advisory Income - - - - 4,850 - Advisory fee - - - - 39,000 35,000 Trustee fee - - 1,500 - - - Royalty expenses - - - - 10,000 - Remunerative income - - - - 145,285 154,487 Issuance of ordinary shares - - - - 18,491 - Preference dividend paid - - - - 1,479 1,479 Services received - - - - 803 587
Parent companySeptember 30,
2018 2017Un-audited
----- (Rupees in '000) ----- Nature of transactionsIssuance of ordinary shares 2,180,623 - Preference dividend 174,450 174,450 Principal received on term finance certificates 3,750 - Markup Received on term finance certificates 1,158 - Rent and utilities expense paid / accrued 44,483 38,651 Reimbursement of expenses 5,064 3,811 Advisory fee 12,021 - Commission income 735 2,517 Expenses incurred on behalf 38 46
Notes to the Consolidated Condensed Interim Financial Statements For the nine months period ended September 30, 2018

58 JS Bank nine months period ended September 30, 2018
Chairman President and Director Director Chief Financial Chief Executive Officer Officer
23. GENERAL
23.1 The figures in these consolidated condensed interim financial statements have been rounded off to the nearest thousand.
24. DATE OF AUTHORISATION FOR ISSUE
These consolidated condensed interim financial statements were authorised for issue by the Board of Directors of the Bank in their meeting held on October 26, 2018.
Notes to the Consolidated Condensed Interim Financial Statements For the nine months period ended September 30, 2018