Interim Report 中期業績報告 2016 (Incorporated in Bermuda with ... · Photo by Larry Yeung....
81
We are Li & Fung 中期業績報告 2016 Interim Report (Incorporated in Bermuda with limited liability) Stock Code: 494
Transcript of Interim Report 中期業績報告 2016 (Incorporated in Bermuda with ... · Photo by Larry Yeung....

We are Li & Fung
中期業績報告2016Interim Report (Incorporated in Bermuda with limited liability)
Stock Code: 494

2 Corporate information
3 Highlights
4 A letter from our Chairman
8 A letter from our CEO
12 Our performance
32 Our commitment to good governance
34 Our senior management team
36 Directors’ interests
40 Substantial shareholders’ interests
41 Other information
42 Information for investors
43 Independent review report
44 Condensed interim financial information
77 Glossary
Contents
On our cover:
Meet our innovators
Back row (from left to right):
Ong Yi Hoo, Chris Okazaki, Margot Brent
Front row (from left to right):
Alison Tai, Reto Matter, Brian Chan
Photo by Larry Yeung

Corporate information
AuditorPricewaterhouseCoopers
Certified Public Accountants
22nd Floor, Prince’s Building
Central, Hong Kong
Principal BankersThe Hongkong and Shanghai Banking Corporation Limited
Citibank, N.A.
JPMorgan Chase Bank, N.A.
Standard Chartered Bank (Hong Kong) Limited
Legal AdvisorsMayer Brown JSM
16th-19th Floors, Prince’s Building
10 Chater Road, Central, Hong Kong
Registered OfficeCanon’s Court, 22 Victoria Street
Hamilton HM 12, Bermuda
Hong Kong Office11th Floor, LiFung Tower
888 Cheung Sha Wan Road
Kowloon, Hong Kong
Executive DirectorsWilliam Fung Kwok Lun
Spencer Theodore Fung
Marc Robert Compagnon
Non-executive DirectorsVictor Fung Kwok King
Paul Edward Selway-Swift*
Allan Wong Chi Yun*
Margaret Leung Ko May Yee*
Martin Tang Yue Nien*
* Independent Non-executive Directors
Chief Financial OfficerEdward Lam Sung Lai
Group Chief Compliance and Risk Management OfficerJason Yeung Chi Wai
Company SecretaryTerry Wan Mei Chow
LI & FUNG LIMITEDINTERIM REPORT 2016 3
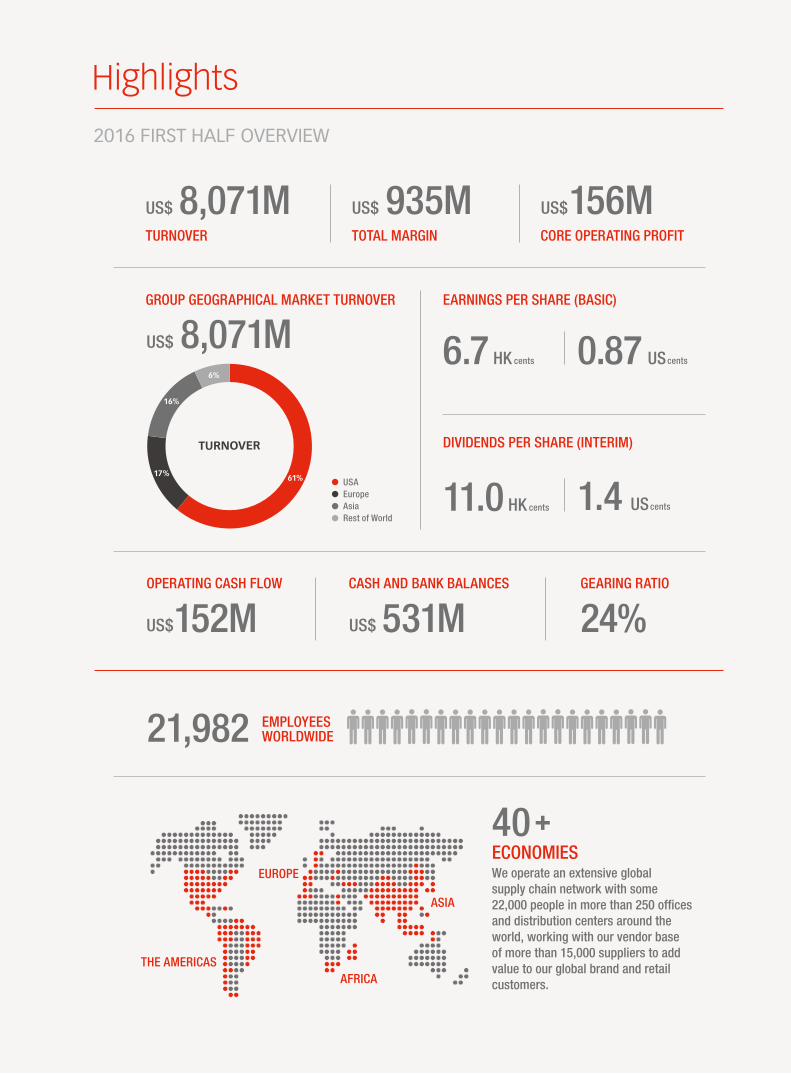
Highlights
OPERATING CASH FLOW CASH AND BANK BALANCES GEARING RATIO
TURNOVER CORE OPERATING PROFIT
2016 FIRST HALF OVERVIEW
US$152M US$ 531M 24%
US$ 8,071MTOTAL MARGIN
US$ 935M US$156M
EMPLOYEESWORLDWIDE21,982
61%17%
16%
6%
GROUP GEOGRAPHICAL MARKET TURNOVER
USA
Europe
Asia
Rest of World
US$ 8,071M
TURNOVER DIVIDENDS PER SHARE (INTERIM)
11.0 HK cents
EARNINGS PER SHARE (BASIC)
HK cents6.7 UScents0.87
UScents1.4
THE AMERICAS
EUROPE
AFRICA
ASIA
40 +ECONOMIESWe operate an extensive global
supply chain network with some
22,000 people in more than 250 offices
and distribution centers around the
world, working with our vendor base
of more than 15,000 suppliers to add
value to our global brand and retail
customers.

LI & FUNG LIMITEDINTERIM REPORT 20164
A letter from our Chairman
William FungGroup Chairman
Dear Shareholders,
As we traversed the first six months of 2016, global economies remained soft and consumer
spending generally cautious. We continued to be negatively affected by a persistently
deflationary environment, increased geopolitical uncertainties and weak European and Asian
currencies. Nevertheless, despite macroeconomic headwinds, we continue to focus on building
a sustainable enterprise for long-term growth.
During the first half of the year, we successfully divested our Asia consumer and healthcare
distribution business, which is a non-core business for us. This divestment re-aligns our strategic
focus on our core trading and logistics businesses and allows us to better focus our resources
and management attention.
The Impact of BrexitAlthough the full impact is unknown at this point, the recent Brexit referendum is leading
to additional global economic uncertainties. As a result, Europe’s consumer confidence,
employment and foreign investments are expected to be affected. UK brands and retailers face
immediate rising overseas input prices due to the weaker British Pound, while soft consumer
sentiment makes it difficult to pass on these costs to consumers. In the meantime, European
brands and retailers also suffer similar negative impact as a result of Brexit which may weaken
the Euro and add to uncertainty across the Eurozone.
A more subdued European economic outlook will exacerbate the already-sluggish demand in
Asian exports, which may also be disadvantaged if there is a relative appreciation of the Asian
currencies against the British Pound and Euro. Over the longer run, free-trade agreement (FTA)
negotiations between China and the EU are likely to be more difficult without the advocacy
and involvement of the UK, who has played an instrumental role in promoting deeper China-EU
ties. Production countries that are currently benefiting from preferential tariff treatments under
the EU’s Generalized Scheme of Preferences are set to lose such privileges when exporting to

LI & FUNG LIMITEDINTERIM REPORT 2016 5
A letter from our Chairman (continued)
the UK and would need to re-negotiate new FTAs. Separation of the UK from the EU is likely to
lessen the bargaining power of a reduced EU in future trade negotiations. All of these potential
effects are expected to add uncertainty and extra complexity to the sourcing landscape.
E-commerce Brings about Huge Sourcing and Logistics OpportunitiesThe advent of e-commerce and the increase in competitive pressure it brings continue to disrupt
retail markets. However, the need for supply chains to be digitized to work with the increasingly
digitized consumer market will bring a lot of opportunities for Li & Fung.
At the retail level, there is an influx of online retailers entering the market, fighting for market
share and competing largely on price. Brick-and-mortar retailers continue to invest in omni-
channel capabilities to compete for the online consumer. An increasingly larger proportion
of the goods we supply to our brick-and-mortar retail customers is being sold by them online
under the omni-channel model. This has greatly intensified price competition which coupled
with a generally weak consumption market has resulted in a persistently highly-promotional
marketplace. At the same time, many online retailers are also launching their own private label
lines. With our deep expertise in developing private labels, we are already helping some online
retailers source their private label collections. We feel this move to private label will be a major
trend with the pure play online retailers and will present significant opportunities for Li & Fung.
In addition, e-commerce players also compete heavily on their logistics capabilities. With our
leadership in e-logistics in Asia, we are becoming the trusted logistics partner for both pure
online retailers and traditional retailers’ online business. We were early investors in logistics
capabilities to pick-and-pack by the piece and expedite in small packages to consumers.
This requires a thorough integration of IT systems with those of our customers and last-mile
transportation companies. We are now reaping the fruits of these early investments.

LI & FUNG LIMITEDINTERIM REPORT 20166
A letter from our Chairman (continued)
China Remains to be an Important Sourcing BaseChina has remained an important sourcing hub due to its abundance of highly skilled labor,
strong production expertise, efficient infrastructural support and a relatively stable political and
social situation. Its labor costs, which rose dramatically in its last Five-Year Plan, have stabilized.
Coupled with low raw material prices and a lower RMB exchange rate, China has regained
some of its competitiveness. Recent geopolitical unrest and disruptions in other parts of the
world have also accentuated the importance of working with an experienced and stable supply
country, like China, despite a higher cost.
As a result, there is a slowdown in the decanting of production out of China. Furthermore,
China’s one-belt-one-road initiative is expected to reinforce China’s dominance and importance
in the global supply chain, as it continues to explore opportunities with its neighbors to connect
production and consumers across the region.
Continual Focus on Value Added ServicesOur Vendor Support Services (VSS) business, which serves our vendor base by increasing their
sustainability and competitiveness, has continued to make progress in the first half of the
year. Following from our efforts in 2015, VSS continued to track ahead of plans and improve
profitability and we expect VSS to contribute over 5% of COP in 2016.
Building a Sustainable Enterprise in a Volatile MarketUnder the current market conditions, there is little sign of any meaningful turnaround in
consumer demand and trade flows for the remainder of 2016. We expect the next six months
to continue to be overshadowed by uncertainties. While the US market continues to recover
and shows growth, this growth is subdued and muted. The outcome of the upcoming US
presidential election will set the tone for the country’s economic direction. In Europe, it will take
some time to resolve the issues arising from Brexit before it can restart its growth momentum.
In the meantime, we expect Asian growth to be lackluster given the slowdown of the Chinese
economy and the impact from Europe.

LI & FUNG LIMITEDINTERIM REPORT 2016 7
A letter from our Chairman (continued)
Major brands and retailers will increasingly need to rely on reputable supply chain managers to increase their competitiveness.
“
For Li & Fung, the difficult macro and retail environment may lead to volume and margin
pressures for our trading business in the near term. Nonetheless, we will focus on productivity
and cost efficiency improvements while continuing to execute our strategies for our key product
verticals. Our VSS program is growing as expected and is contributing positively to profitability.
I remain upbeat on the prospects of our VSS program and I am confident that it will become
one of our important profit contributors. In addition, I expect our logistics business will sustain
its robust growth through increasing business with existing customers, geographical expansion,
new contracts and broader service offerings.
We have commenced the planning of our next Three-Year Plan for the period of 2017 to 2019,
which will focus on maintaining our global leadership position in the consumer goods supply
chain. We will develop and maintain our excellence by leveraging on our deep product expertise
and diverse sourcing base, while helping our customers to stay competitive. In the future, we
foresee a proliferation of FTAs, increasingly on a bilateral, rather than a multilateral, basis that
will shift the dynamics of global sourcing, increasing the complexity of the sourcing landscape
to Li & Fung’s advantage. In such a sourcing world, major brands and retailers will increasingly
need to rely on reputable supply chain managers who have strong product expertise and a
flexible global footprint to minimize supply disruption risks while increasing competitiveness.
We believe Li & Fung is in a prime position to fulfill that role in the coming years.
I would like to extend my gratitude to our colleagues for their dedication and hard work, amid
challenging market conditions, in driving our resilient performance during the past six months.
Yours sincerely,
William Fung Kwok Lun
Group Chairman
LI & FUNG LIMITEDINTERIM REPORT 20168
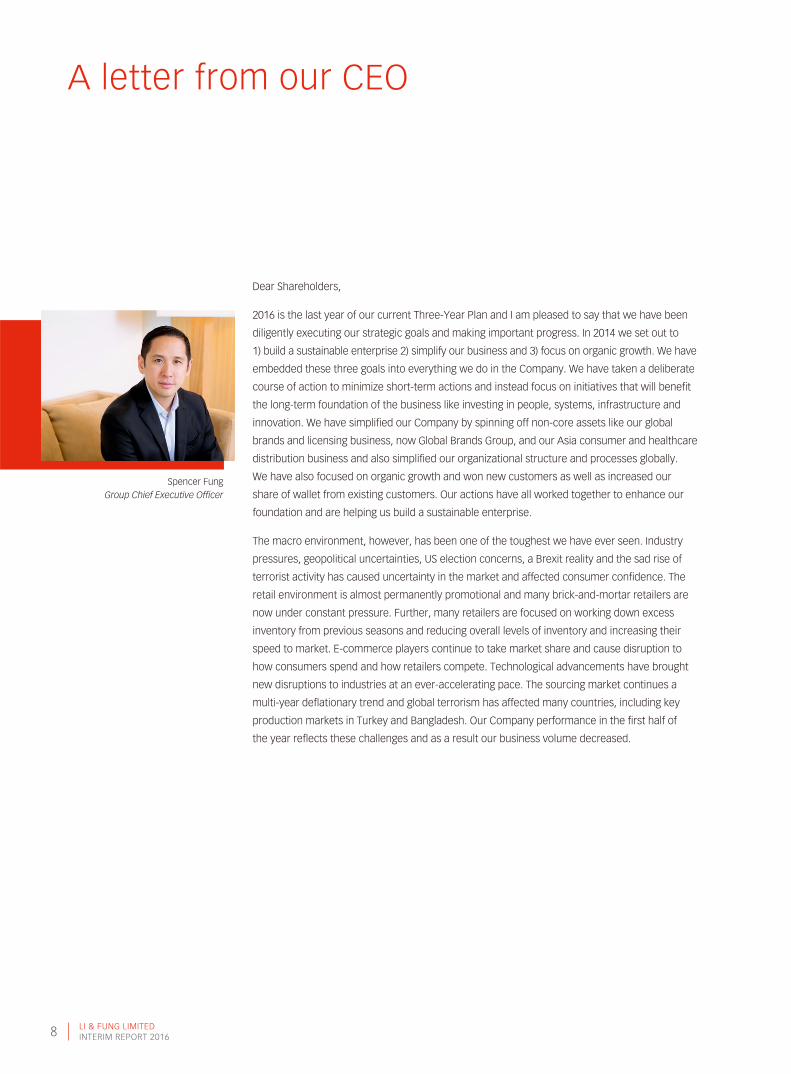
A letter from our CEO
Dear Shareholders,
2016 is the last year of our current Three-Year Plan and I am pleased to say that we have been
diligently executing our strategic goals and making important progress. In 2014 we set out to
1) build a sustainable enterprise 2) simplify our business and 3) focus on organic growth. We have
embedded these three goals into everything we do in the Company. We have taken a deliberate
course of action to minimize short-term actions and instead focus on initiatives that will benefit
the long-term foundation of the business like investing in people, systems, infrastructure and
innovation. We have simplified our Company by spinning off non-core assets like our global
brands and licensing business, now Global Brands Group, and our Asia consumer and healthcare
distribution business and also simplified our organizational structure and processes globally.
We have also focused on organic growth and won new customers as well as increased our
share of wallet from existing customers. Our actions have all worked together to enhance our
foundation and are helping us build a sustainable enterprise.
The macro environment, however, has been one of the toughest we have ever seen. Industry
pressures, geopolitical uncertainties, US election concerns, a Brexit reality and the sad rise of
terrorist activity has caused uncertainty in the market and affected consumer confidence. The
retail environment is almost permanently promotional and many brick-and-mortar retailers are
now under constant pressure. Further, many retailers are focused on working down excess
inventory from previous seasons and reducing overall levels of inventory and increasing their
speed to market. E-commerce players continue to take market share and cause disruption to
how consumers spend and how retailers compete. Technological advancements have brought
new disruptions to industries at an ever-accelerating pace. The sourcing market continues a
multi-year deflationary trend and global terrorism has affected many countries, including key
production markets in Turkey and Bangladesh. Our Company performance in the first half of
the year reflects these challenges and as a result our business volume decreased.
Spencer FungGroup Chief Executive Officer

LI & FUNG LIMITEDINTERIM REPORT 2016 9
A letter from our CEO (continued)
During these turbulent times, our business foundation remains solid. Our Three-Year Plan goals
have helped us focus on our core business and solidify our multi-channel sourcing strategy such
that more of our customers now use our entire end-to-end supply chain services. While the
overall business has been under pressure, we continue to convert our strong pipeline of new
customers every few months and to help more e-commerce customers with their private label
strategies. Our reorganization last year to focus more on our core customers enabled us
to increase our share of wallet. Additionally, our three product vertical groups are now deeper
into their supply chains, creating asset-light ecosystems focused on technology and innovation.
Our logistics business continues a multi-year double-digit growth pattern with in-country logistics
and global freight and within that e-logistics is growing even faster and capitalizing on the
explosive growth of e-commerce in China and around Asia. Our new Silicon Valley office has
also been bringing new innovative ideas, exploring new partnerships in technology and leading
our advanced data analytics strategy. Finally, our Vendor Support Services has also grown very
well from a low base and we are forecasting it to exceed our goal of 5% core operating profit
this year.
We expect the second half of 2016 to remain challenging and we will continue implementing our
margin enhancement and cost control measures to counteract the effects of the environment
and mitigate pressure to our business. We continue working on process reengineering and
investing in software and automation to increase our efficiency. Meanwhile, we have already
begun planning for our next Three-Year Plan for 2017-2019. Although we are still early in the
process, we are quite excited to be working across some key themes such as speed, innovation
and digitalization of the supply chain, which we believe will play an integral part of our strategy.
I am very encouraged by the passion the whole team has shown so far and am looking forward
to announcing next year how we are planning to make further progress in building a long-term
sustainable future for Li & Fung.
Yours sincerely,
Spencer Fung
Group CEO
We are excited to be working on speed, innovation and digitalization of the supply chain.
“
LI & FUNG LIMITEDINTERIM REPORT 201610
Our performance (continued)

LI & FUNG LIMITEDINTERIM REPORT 2016 11
Our performance (continued)
LI & FUNG LIMITEDINTERIM REPORT 201612
Our performance
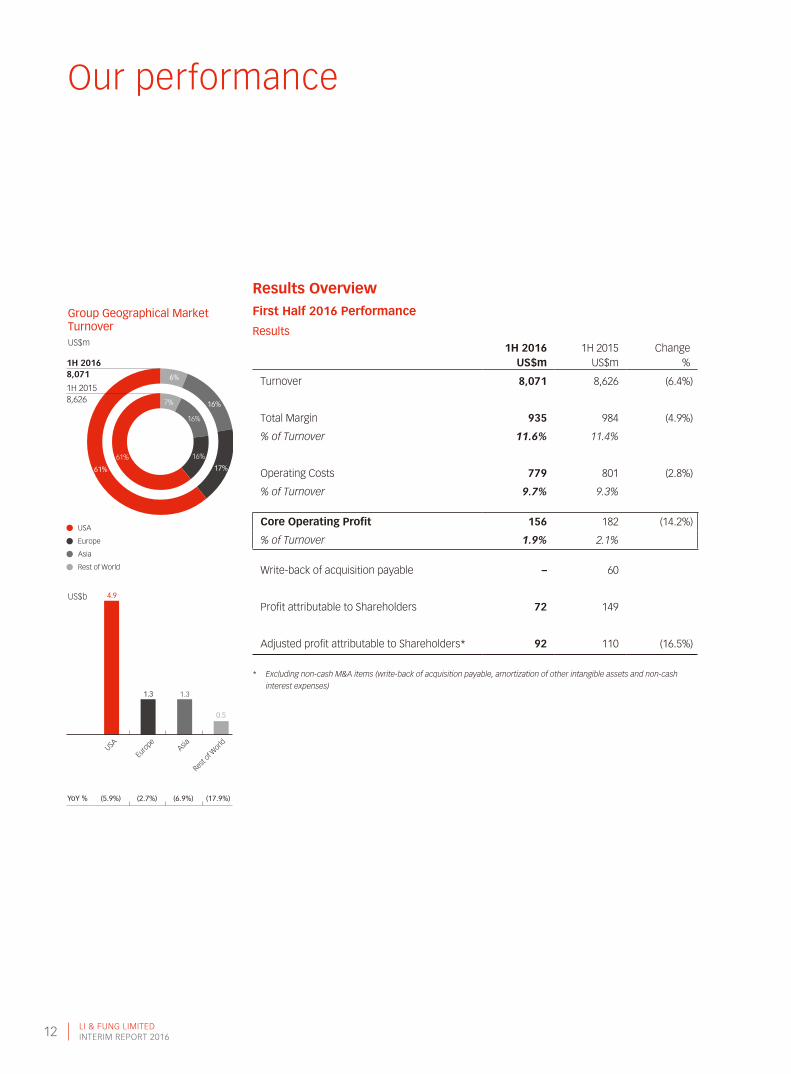
Results OverviewFirst Half 2016 Performance
Results1H 2016 1H 2015 Change
US$m US$m %
Turnover 8,071 8,626 (6.4%)
Total Margin 935 984 (4.9%)
% of Turnover 11.6% 11.4%
Operating Costs 779 801 (2.8%)
% of Turnover 9.7% 9.3%
Core Operating Profit 156 182 (14.2%)
% of Turnover 1.9% 2.1%
Write-back of acquisition payable – 60
Profit attributable to Shareholders 72 149
Adjusted profit attributable to Shareholders* 92 110 (16.5%)
* Excluding non-cash M&A items (write-back of acquisition payable, amortization of other intangible assets and non-cash
interest expenses)
Group Geographical Market TurnoverUS$m
USA
Euro
peAsia
Rest o
f World
4.9
1.3 1.3
0.5
YoY % (5.9%) (2.7%) (6.9%) (17.9%)
USA
Europe
Asia
Rest of World
6%
61% 17%
16%7%
16%
61% 16%
1H 20168,071
1H 20158,626
US$b

LI & FUNG LIMITEDINTERIM REPORT 2016 13
Our performance (continued)
The first six months of the year was the toughest retail and trading period we have operated
in since the global financial crisis in 2008. The global retail industry continued to be severely
challenged by weak economies, soft consumer sentiment and a highly promotional environment.
Our brand and retail customers were affected by subdued consumer demand and inventory
build-up. They have therefore been increasingly cautious in placing new orders so as to reduce
inventory level, which negatively impacted our top-line turnover.
However, the tough operating environment did not slow down our pace in executing strategic
goals outlined in our Three-Year Plan: building a long-term sustainable enterprise, simplifying
the business and focusing on organic growth. We successfully completed the divestment of
our Asia consumer and healthcare distribution business in June 2016 as part of our strategic
goal to focus resources on the core trading and logistics business. This divestment reinforced
the Group’s strong cash flow and solid balance sheet, and provided additional flexibility for
our capital structure to fund future growth. Our Logistics Network continued to sustain growth
momentum and generated double-digit organic growth in core operating profit. In addition, our
Vendor Support Services (VSS), which leverages our extensive relationship with our vendors and
converts them into a new group of customers, continued to stay ahead of plan. We have also
continued to reposition our customer base and developed our product vertical expertise; our
new customer pipeline remains strong. Additionally, we have focused on increasing productivity,
which is helping support our margins and profitability. In particular, with our digitized sourcing
platform, we have been able to streamline our cost base and improve operating leverage. It also
opens up opportunities to capitalize on the vast amount of data processed through our platform.
Speed, innovation and digitalization will play a crucial part in our next Three-Year Plan.
LI & FUNG LIMITEDINTERIM REPORT 201614
Our performance (continued)
TURNOVER
Our turnover in the first half decreased by 6.4% year-on-year to US$8.1 billion due mainly to the
continued deflationary environment and reduced orders from customers as a result of uncertain
consumer demand. Reduced orders were exacerbated by customers placing orders closer to
the key sales periods as well as their objectives in keeping a lower inventory level on an ongoing
basis. From a geographical perspective, the US and Europe remained the largest contributors to
our total turnover, contributing 61% and 17%, respectively. Turnover from the Trading Network,
representing 95% of our total turnover, declined by 6.2% while turnover from the Logistics
Network declined by 10.5%. The continued sharp decline in global freight rates contributed to
the overall reduction in turnover from the Logistics Network despite increased business from
new and existing customers.
During the period, both our trading and logistics businesses were exposed to considerable
volatility in exchange rates, particularly to the British Pound which fluctuated significantly
as a result of the Brexit vote. Overall, the weaker European and Asian currencies against the
US dollar contributed to lower translated turnover for both our Trading and Logistics Networks.
TOTAL MARGIN
Total margin decreased by 4.9% to US$935 million during the first half of 2016, mainly due to the
decline in total turnover. We improved our total margin percentage from 11.4% to 11.6% during
the period, supported by an increase in the Logistics Network’s total margin percentage due to
a better customer mix, more efficient freight procurement, and increased sales of value-added
services in our global freight management business.

LI & FUNG LIMITEDINTERIM REPORT 2016 15
Our performance (continued)
OPERATING COSTS
Operating costs decreased by 2.8% to US$779 million as a result of our sustained efforts
to improve operating efficiency and productivity through the use of technology. This was
particularly evident in our Trading Network in which operating costs declined by 5.2%. In the
meantime, our Logistics Network continued to make investments with 13.3% increase in
operating costs in order to support its geographical expansion and organic growth.
CORE OPERATING PROFIT
Core operating profit decreased by 14.2% year-on-year to US$156 million due to a lower
contribution from our Trading Network. The decline in Trading Network turnover dragged down
the Trading Network’s core operating profit by 19.1%. This was offset by the 20.8% surge in the
Logistics Network’s core operating profit.
PROFIT ATTRIBUTABLE TO SHAREHOLDERS
Since the profit attributable to Shareholders of US$72 million as reported in first half of 2016
did not include any write-back of consideration payable, our reported profit attributable
to Shareholders decreased by 51.4% year-on-year, as prior year’s profit attributable to
Shareholders incorporated US$60 million of write-back of consideration payable. Excluding
write-back of consideration payable, as well as other non-cash M&A items, such as amortization
of M&A related intangible assets and non-cash interest expenses, the adjusted profit attributable
to Shareholders declined by 16.5% when compared to the same period last year.
LI & FUNG LIMITEDINTERIM REPORT 201616
Our performance (continued)
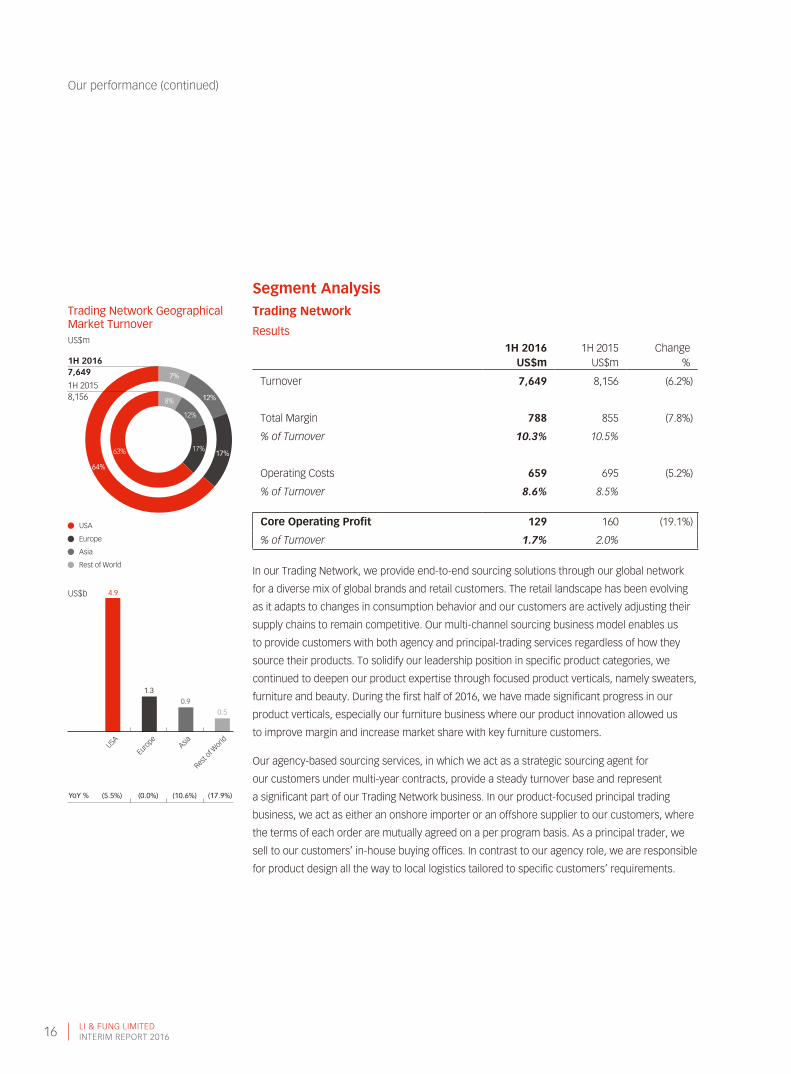
Segment AnalysisTrading Network
Results1H 2016 1H 2015 Change
US$m US$m %
Turnover 7,649 8,156 (6.2%)
Total Margin 788 855 (7.8%)
% of Turnover 10.3% 10.5%
Operating Costs 659 695 (5.2%)
% of Turnover 8.6% 8.5%
Core Operating Profit 129 160 (19.1%)
% of Turnover 1.7% 2.0%
In our Trading Network, we provide end-to-end sourcing solutions through our global network
for a diverse mix of global brands and retail customers. The retail landscape has been evolving
as it adapts to changes in consumption behavior and our customers are actively adjusting their
supply chains to remain competitive. Our multi-channel sourcing business model enables us
to provide customers with both agency and principal-trading services regardless of how they
source their products. To solidify our leadership position in specific product categories, we
continued to deepen our product expertise through focused product verticals, namely sweaters,
furniture and beauty. During the first half of 2016, we have made significant progress in our
product verticals, especially our furniture business where our product innovation allowed us
to improve margin and increase market share with key furniture customers.
Our agency-based sourcing services, in which we act as a strategic sourcing agent for
our customers under multi-year contracts, provide a steady turnover base and represent
a significant part of our Trading Network business. In our product-focused principal trading
business, we act as either an onshore importer or an offshore supplier to our customers, where
the terms of each order are mutually agreed on a per program basis. As a principal trader, we
sell to our customers’ in-house buying offices. In contrast to our agency role, we are responsible
for product design all the way to local logistics tailored to specific customers’ requirements.
Trading Network Geographical Market TurnoverUS$m
USA
Europe
Asia
Rest of World
7%
12%
17%
64%
8%
17%63%
12%
YoY % (5.5%) (0.0%) (10.6%) (17.9%)
USA
Euro
peAsia
Rest o
f World
4.9
1.3
0.90.5
1H 20167,649
1H 20158,156
US$b

LI & FUNG LIMITEDINTERIM REPORT 2016 17
Our performance (continued)
TURNOVER
Turnover of the Trading Network, comprising 64% soft goods and 36% hard goods, decreased
by 6.2% to US$7.6 billion during the first half of 2016. Our agency business, which contributed
approximately two-third of the total Trading Network turnover, continued to be adversely
affected by ongoing deflationary input prices. For our principal business, selling prices remained
under pressure due to soft retail demand and the highly promotional retail environment. The
slowdown in the retail environment, high inventory level and uncertain consumer demand
caused our brand and retail customers to be more cautious in placing orders. The emergence
of e-commerce and our customers’ desires to reduce overall inventory level had led to a shorter
order cycle. This adversely impacted volume placement for both our agency and principal
businesses. We expect this destocking cycle will continue to impact us until the supply chain
order cycle is totally adjusted.
European and Asian currencies continued to be volatile in the first half. The brief stabilization
of these currencies in the first quarter was quickly interrupted by the UK Brexit vote, which led to
further weakness. The relative strength of the US dollar led to an unfavorable translation impact
for our non-US dollar denominated transactions.
Product Mix
Soft Goods
Hard GoodsTurnover 64% 36%
LI & FUNG LIMITEDINTERIM REPORT 201618
Our performance (continued)
Despite the challenging operating environment in our Trading Network, we continue to serve
a diversified group of customers globally, ranging from brands, department stores, specialty
stores, clubs, hypermarkets, and pure-play e-commerce. We continued to reposition our
customer base and expand our turnover proportionate percentage in brands, clubs, off-price
discount stores, and e-commerce players. In addition, our prospective customer pipeline
remained strong across various product verticals and business units. Pure e-commerce players
are also accelerating the development of their own private label strategies and we are well
placed to service them.
Turnover from our US business, which is predominantly agency-based, decreased by 5.5%
year-on-year to US$4.9 billion, as a result of deflationary prices and lower unit volumes.
The lower unit volumes were mainly driven by our customers’ lower retail sales volumes.
Our customers are buying more cautiously, reflecting ongoing weak consumer demand and high
inventory levels.
Our European business remained flat year-on-year at US$1.3 billion as supported by our
increased market share in our core European customers despite the unfavorable foreign
exchange translation, as well as volatile macro environment and uncertain political conditions.
Our European trading business is predominantly principal-based with orders transacted in local
currencies. The depreciation of European currencies against the US$, our reporting currency,
had a significant adverse translation impact on our reported European business turnover.
Turnover in Asia decreased by 10.6% year-on-year to US$0.9 billion, of which approximately
US$569 million was attributed to our Asia consumer and healthcare distribution business which
was divested on 30 June 2016, as part of the strategic re-alignment of Li & Fung. As a result of
this strategic divestment, the financial results of our Asia consumer and healthcare distribution
business will no longer contribute to the Trading Network going forward. Turnover in Asia
was negatively impacted by the subdued economic environment across Asia, particularly in
China, and the depreciation of Asian currencies against the US$. Turnover in the Rest of
World decreased by 17.9% year-on-year to US$0.5 billion due mainly to the negative foreign
currency impact.

LI & FUNG LIMITEDINTERIM REPORT 2016 19
Our performance (continued)
TOTAL MARGIN
Total margin across the Trading Network decreased by 7.8% year-on-year to US$788 million
as a result of turnover decline and the continued margin pressure on our principal business.
The negative foreign exchange impact on turnover had a direct corresponding impact on total
margin. Total margin percentage decreased from 10.5% to 10.3% during the first half of 2016
as compared to the corresponding period in 2015. The continued margin pressure was driven
by our brand and retail customers, who faced their own pricing pressures in the challenging
retail environment. In response to such margin pressure, we continued to work closely with our
customers to optimize their supply chains as well as to provide differentiated, innovative and
well-designed products to support higher margins.
OPERATING COSTS
Operating costs in our Trading Network declined by 5.2% to US$659 million as we continued
to streamline our operations and look for process efficiency to reduce operating costs amid
the challenging market conditions. We also increased provision in accounts receivable to
cover the credit risk with a customer in the Chapter 11 process in the US. From the overall
operating efficiency perspective, we were able to use technology to realize productivity gains
and improve operating leverage. We continued to invest prudently to fuel our growth in new
customer accounts and deepen our product expertise. In particular, we invested in the required
infrastructure and resources for our VSS unit to scale.
CORE OPERATING PROFIT
Core operating profit decreased by 19.1% year-on-year to US$129 million during the first half
of 2016, due to a decline in turnover of 6.2% and total margin of 7.8% despite a 5.2% reduction
in operating costs.
Correspondingly, core operating profit margin decreased from 2.0% in the first half of 2015
to 1.7% in 2016 as a result of total margin percentage decreased from 10.5% to 10.3% and
operating costs percentage increased from 8.5% to 8.6%.
LI & FUNG LIMITEDINTERIM REPORT 201620
Our performance (continued)
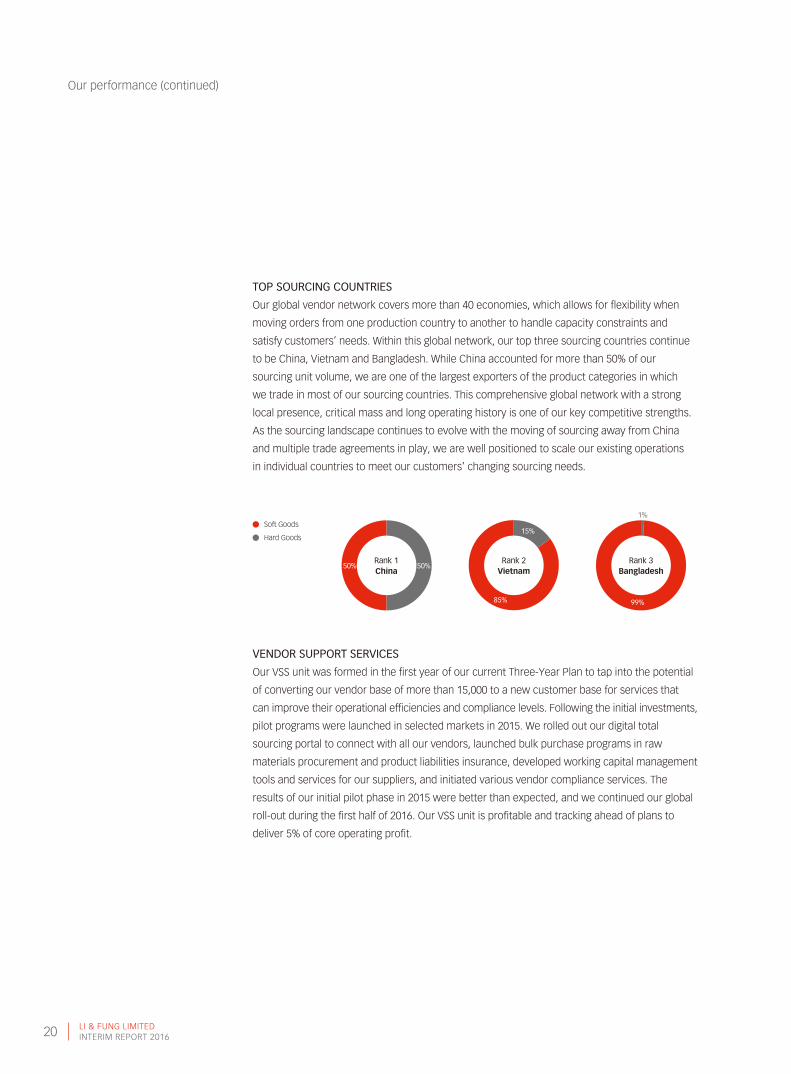
TOP SOURCING COUNTRIES
Our global vendor network covers more than 40 economies, which allows for flexibility when
moving orders from one production country to another to handle capacity constraints and
satisfy customers’ needs. Within this global network, our top three sourcing countries continue
to be China, Vietnam and Bangladesh. While China accounted for more than 50% of our
sourcing unit volume, we are one of the largest exporters of the product categories in which
we trade in most of our sourcing countries. This comprehensive global network with a strong
local presence, critical mass and long operating history is one of our key competitive strengths.
As the sourcing landscape continues to evolve with the moving of sourcing away from China
and multiple trade agreements in play, we are well positioned to scale our existing operations
in individual countries to meet our customers’ changing sourcing needs.
Rank 1China
Rank 2Vietnam
Rank 3Bangladesh
Soft Goods
Hard Goods
50% 50%
85%
15%
99%
1%
VENDOR SUPPORT SERVICES
Our VSS unit was formed in the first year of our current Three-Year Plan to tap into the potential
of converting our vendor base of more than 15,000 to a new customer base for services that
can improve their operational efficiencies and compliance levels. Following the initial investments,
pilot programs were launched in selected markets in 2015. We rolled out our digital total
sourcing portal to connect with all our vendors, launched bulk purchase programs in raw
materials procurement and product liabilities insurance, developed working capital management
tools and services for our suppliers, and initiated various vendor compliance services. The
results of our initial pilot phase in 2015 were better than expected, and we continued our global
roll-out during the first half of 2016. Our VSS unit is profitable and tracking ahead of plans to
deliver 5% of core operating profit.
LI & FUNG LIMITEDINTERIM REPORT 2016 21
Our performance (continued)
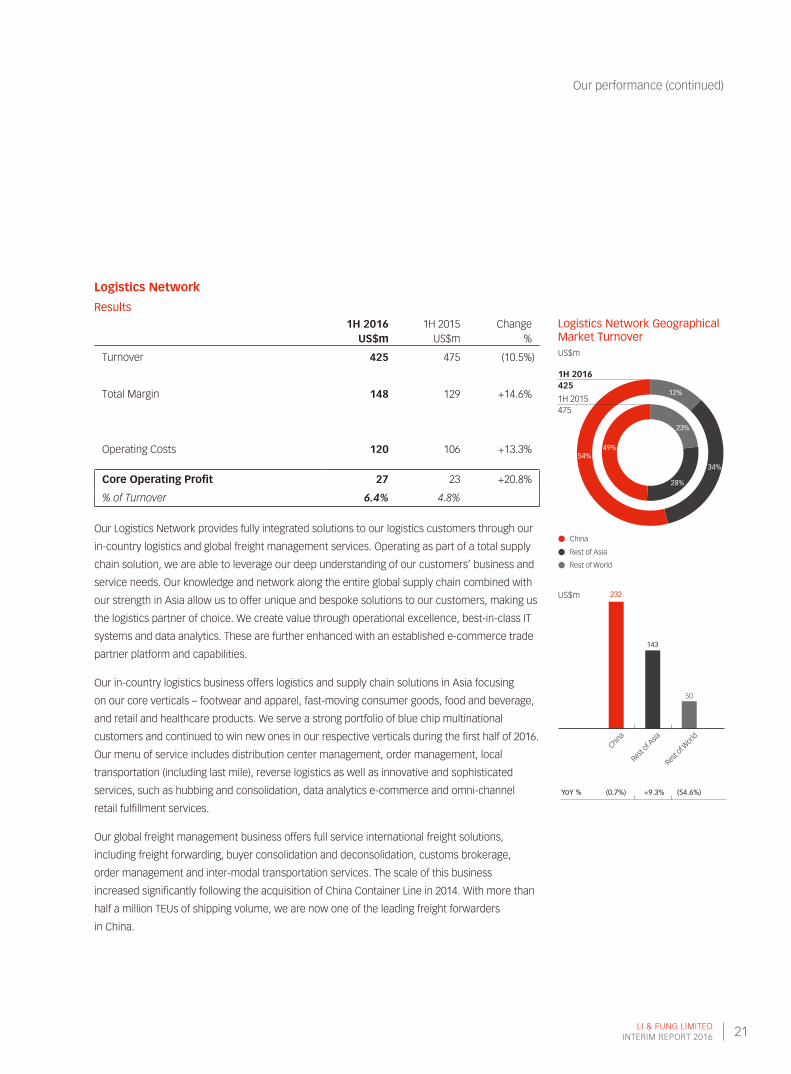
Logistics Network
Results1H 2016 1H 2015 Change
US$m US$m %
Turnover 425 475 (10.5%)
Total Margin 148 129 +14.6%
Operating Costs 120 106 +13.3%
Core Operating Profit 27 23 +20.8%
% of Turnover 6.4% 4.8%
Our Logistics Network provides fully integrated solutions to our logistics customers through our
in-country logistics and global freight management services. Operating as part of a total supply
chain solution, we are able to leverage our deep understanding of our customers’ business and
service needs. Our knowledge and network along the entire global supply chain combined with
our strength in Asia allow us to offer unique and bespoke solutions to our customers, making us
the logistics partner of choice. We create value through operational excellence, best-in-class IT
systems and data analytics. These are further enhanced with an established e-commerce trade
partner platform and capabilities.
Our in-country logistics business offers logistics and supply chain solutions in Asia focusing
on our core verticals – footwear and apparel, fast-moving consumer goods, food and beverage,
and retail and healthcare products. We serve a strong portfolio of blue chip multinational
customers and continued to win new ones in our respective verticals during the first half of 2016.
Our menu of service includes distribution center management, order management, local
transportation (including last mile), reverse logistics as well as innovative and sophisticated
services, such as hubbing and consolidation, data analytics e-commerce and omni-channel
retail fulfillment services.
Our global freight management business offers full service international freight solutions,
including freight forwarding, buyer consolidation and deconsolidation, customs brokerage,
order management and inter-modal transportation services. The scale of this business
increased significantly following the acquisition of China Container Line in 2014. With more than
half a million TEUs of shipping volume, we are now one of the leading freight forwarders
in China.
Logistics Network Geographical Market TurnoverUS$m
China
Rest of Asia
Rest of World
12%
54%
34%
23%
49%
28%
YoY % (0.7%) +9.3% (54.6%)
143
50
China
Rest o
f Asia
Rest o
f World
232US$m
1H 2016425
1H 2015475
LI & FUNG LIMITEDINTERIM REPORT 201622
Our performance (continued)
TURNOVER
Turnover of our Logistics Network decreased by 10.5% year-on-year to US$425 million,
mainly attributable to the substantial drop in global freight rates, improved customer mix,
and unfavorable foreign currency translation. As more than 80% of our Logistics Network
turnover was generated in Asia in local currencies, our reported turnover was also exposed
to currency volatility.
Our in-country logistics business maintained its strong organic growth momentum especially
at the core operating profit level, driven by new customer wins, wallet share gains from existing
customers and the increasing trend toward the fast growing e-commerce market where we
possess leadership capabilities. We also improved our customer mix by focusing on higher
margin customers and exiting unprofitable ones. The first half of 2016 also witnessed our
expansion into Korea and Japan, and the inauguration of our state-of-the-art distribution hub
in Singapore.
Global freight rates in the first half of 2016 continued to be under pressure across all routes and
were below the average rates observed in the same period in 2015. Nevertheless, our global
freight management business continued to focus on gaining market share through geographical
expansion and cross-selling of our freight services to both in-country logistics and Trading
Network’s customers. To mitigate margin impact from low freight rates, we undertook proactive
measures including prudent freight procurement, active contract management, and value-added
services such as buyer consolidation solutions to drive core operating profit growth.
CORE OPERATING PROFIT
Core operating profit increased by 20.8% year-on-year to US$27 million despite a decrease
in turnover, largely as a result of an improvement in core operating profit margin from 4.8%
to 6.4% during the first half of 2016. The higher margin in in-country logistics business was mainly
due to our increased scale, continued focus on optimizing our customer portfolio and enhanced
productivity through improved operating efficiency of our distribution centers. Prudent freight
procurement, active contract management, and value-added services also allowed us to
improve our margin in the global freight management business.
LI & FUNG LIMITEDINTERIM REPORT 2016 23
Our performance (continued)
Balance Sheet and Capital StructureStrong Cash Position
Li & Fung has a strong and stable cash flow conversion business which, together with cash on
hand carried forward from the previous year, more than adequately funded our working capital,
dividends, interest expenses and capital expenditure in the first half of 2016.
• Operating cash flow of US$152 million is in line with core operating profit after working capital
and depreciation adjustments and tax payments
• Capital expenditures of US$44 million and payments for consideration payable for previous
acquisitions of US$14 million
• Net cash proceeds of US$301 million from the disposal of the Asia consumer and healthcare
distribution business
• Dividends paid of US$163 million
• Net interest expenses paid of US$39 million, and distribution to perpetual capital securities
holders of US$15 million
In terms of future commitments, the remaining balance of total purchase consideration payable
for acquisitions was reduced to US$229 million by the end of June 2016, of which US$169 million
are earn-out payments to be paid over the course of the next three years. We remain asset-
light and our on-going total capital expenditures are mainly comprised of upgrade of IT systems,
expansion of our logistics business and ongoing maintenance capital expenditures.
LI & FUNG LIMITEDINTERIM REPORT 201624
Our performance (continued)
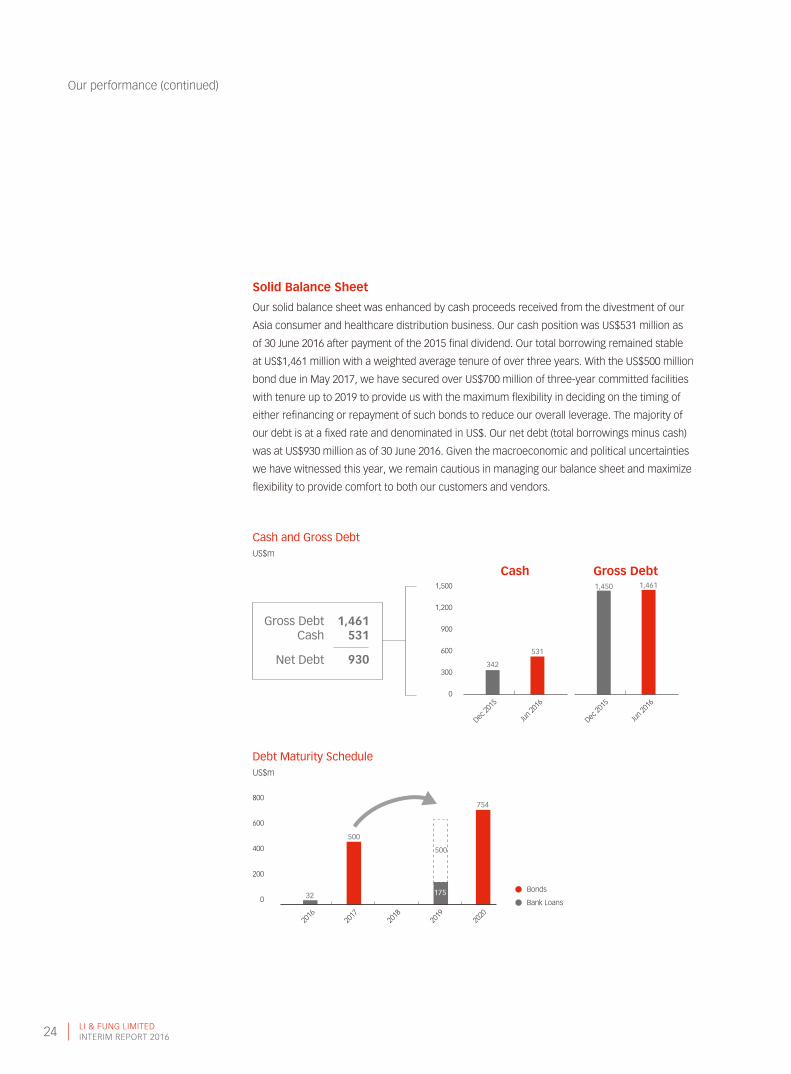
Solid Balance Sheet
Our solid balance sheet was enhanced by cash proceeds received from the divestment of our
Asia consumer and healthcare distribution business. Our cash position was US$531 million as
of 30 June 2016 after payment of the 2015 final dividend. Our total borrowing remained stable
at US$1,461 million with a weighted average tenure of over three years. With the US$500 million
bond due in May 2017, we have secured over US$700 million of three-year committed facilities
with tenure up to 2019 to provide us with the maximum flexibility in deciding on the timing of
either refinancing or repayment of such bonds to reduce our overall leverage. The majority of
our debt is at a fixed rate and denominated in US$. Our net debt (total borrowings minus cash)
was at US$930 million as of 30 June 2016. Given the macroeconomic and political uncertainties
we have witnessed this year, we remain cautious in managing our balance sheet and maximize
flexibility to provide comfort to both our customers and vendors.
0
600
300
900
1,200
1,500
342
531
1,450 1,461
Cash Gross Debt
Jun 20
16
Jun 20
16
Dec 20
15
Dec 20
15
1,461531
930
Gross DebtCash
Net Debt
Cash and Gross DebtUS$m
Debt Maturity ScheduleUS$m
0
200
400
600
800
500
175
754
500
32
2019
2020
2017
2016
2018
Bonds
Bank Loans

LI & FUNG LIMITEDINTERIM REPORT 2016 25
Our performance (continued)
Dec 20
15
Jun 20
16
InternalGuideline
35%
24%
27%
Moody’sBaa1
Stable Outlook
S&PBBB+
Stable Outlook
Net Gearing and Net Current Assets
Our net gearing ratio as stated in the unaudited consolidated balance sheet was 24% as of
30 June 2016 (31 December 2015: 27%).
We continued to adopt a conservative approach in managing our balance sheet and capital
structure. As at 30 June 2016, our credit ratings from Moody’s is Baa1 (stable outlook) and
Standard & Poor’s is BBB+ (stable outlook). We are committed to maintaining a solid balance
sheet, healthy cash flow and strong credit ratios, with the overall long-term target of retaining
an investment grade rating to support our growth.
We have three-year unused committed facilities up to 2019 which allow us to have maximum
flexibility to determine the exact refinancing timing and amount of our US$500 million bond due
in May 2017. Excluding this bond, our pro-forma current ratio would be 1.1 as at 30 June 2016.
Credit Rating
Net Gearing Ratio
LI & FUNG LIMITEDINTERIM REPORT 201626
Our performance (continued)
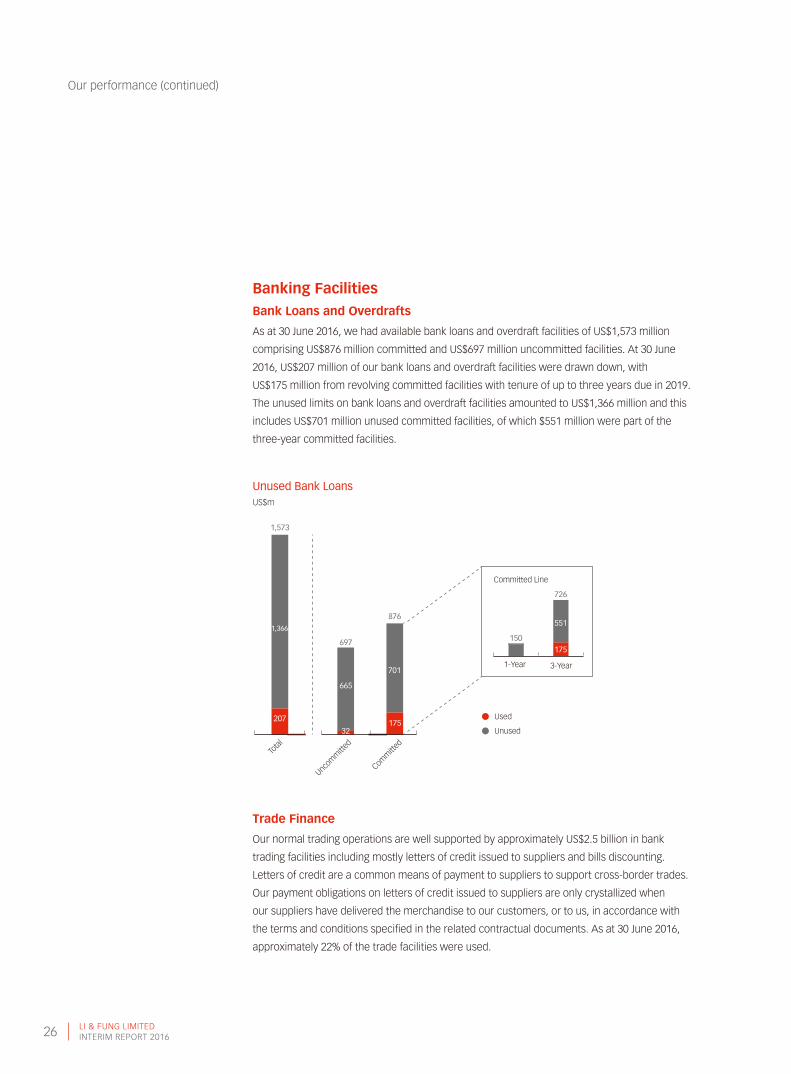
Banking FacilitiesBank Loans and Overdrafts
As at 30 June 2016, we had available bank loans and overdraft facilities of US$1,573 million
comprising US$876 million committed and US$697 million uncommitted facilities. At 30 June
2016, US$207 million of our bank loans and overdraft facilities were drawn down, with
US$175 million from revolving committed facilities with tenure of up to three years due in 2019.
The unused limits on bank loans and overdraft facilities amounted to US$1,366 million and this
includes US$701 million unused committed facilities, of which $551 million were part of the
three-year committed facilities.
Unused Bank LoansUS$m
Comm
itted
Uncom
mitt
ed
1,366
207
665
697
32
876
701
175Used
Unused
Total
1,366
1,573
207
Committed Line
150
726
551
175
1-Year 3-Year
Trade Finance
Our normal trading operations are well supported by approximately US$2.5 billion in bank
trading facilities including mostly letters of credit issued to suppliers and bills discounting.
Letters of credit are a common means of payment to suppliers to support cross-border trades.
Our payment obligations on letters of credit issued to suppliers are only crystallized when
our suppliers have delivered the merchandise to our customers, or to us, in accordance with
the terms and conditions specified in the related contractual documents. As at 30 June 2016,
approximately 22% of the trade facilities were used.

LI & FUNG LIMITEDINTERIM REPORT 2016 27
Our performance (continued)
Contingent Liabilities and GoodwillAdjustments to Purchase Consideration Payables
Given the unique nature of our acquired businesses, which are private enterprises relying on
their respective entrepreneurs’ commercial skills to drive their success, we generally structure
our acquisitions with incentive schemes and contingent payments on purchase consideration
payables linking to the future performance of the acquired businesses.
We follow a stringent internal financial and accounting policy in evaluating potential adjustment
to the estimated fair value of purchase consideration payable in accordance with the accounting
standard HKFRS 3 (Revised) “Business Combination”.
Our contingent consideration payables are performance-based payments in the form of
“earn-out” and “earn-up” payments depending on a set of predetermined performance targets
mutually agreed with the entrepreneurs in accordance with the sale & purchase agreement.
Earn-out payments are generally payable within three to four years upon completion of
a transaction.
Earn-up payments have a high performance target threshold and are typically payable over
a period of up to five to six years upon completion of a transaction if earned.
While many of our acquired businesses remain profitable and are growing, we may still be
required to make a downward fair value adjustment to certain consideration payable should the
acquired businesses be unable to achieve the predetermined performance threshold within the
specific timeframe as stipulated in the sale & purchase agreement. Given that the contingent
consideration entitlement is usually contractual in nature and is based on a specific formula
linking to a particular threshold, the underlying business performance of the acquired businesses
could continue to perform and grow, yet we may still be required to adjust the consideration
payable, especially if the high performance thresholds of earn-ups are not reached. For the half
year ended 30 June 2016, there was no write-back of contingent consideration.
Goodwill Impairment Tests
We performed goodwill impairment tests based on the cash generating units (CGU) which
manage the acquired businesses in accordance with HKAS 36. Based on our assessment of all
of the CGUs under the current operating structure, we have determined that there is no goodwill
impairment as of 30 June 2016, as the recoverable amount of each CGU was in excess of its
respective carrying value of the goodwill. We will continue to perform goodwill impairment tests
on an on-going basis.
LI & FUNG LIMITEDINTERIM REPORT 201628
Our performance (continued)
Risk ManagementWe have strict policies governing accounting control, credit and foreign exchange risk and
treasury management.
Credit Risk Management
Credit risk mainly arises from trade and other receivables. Our principal trading business
carries a higher credit risk profile given we are acting as a supplier and we therefore take full
counterparty risk of our customers in terms of accounts receivable and inventory. With the
increased insolvency risk among global brands and retail customers, we have deployed a global
credit risk management framework with tightened risk profile, and applied prudent policies to
manage our credit risk with such receivables, which include, but are not limited to, the measures
set out below:
• We select customers in a cautious manner. Our credit control team has implemented
a risk assessment system to evaluate the financial strength of individual customers prior
to agreeing on trade terms. It is not uncommon for us to require securities (such as standby
or commercial letters of credit, or bank guarantees) from customers who fall short of the
required minimum score under our risk assessment system
• A significant portion of trade receivable balances are covered by trade credit insurance
or factored to external financial institutions on a non-recourse basis
• A credit risk system with a dedicated team and tightened policies has been established
to ensure on-time recoveries from trade debtors
• Rigid internal policies which govern provisions made for both inventories and receivables
are in place to motivate business managers to step up their efforts in these two areas and
to avoid any significant impact on their financial performance
With the increased credit risk profile of selected customers, we have taken a cautious approach
in our provision in accounts receivable, and we will continue to monitor closely the development
of the Chapter 11 bankruptcy proceedings of one of our key customers, which continues to
conduct business as usual during the Chapter 11 process while completing its financial and
operational reorganization.

LI & FUNG LIMITEDINTERIM REPORT 2016 29
Our performance (continued)
Foreign Exchange Risk Management
Most of our cash balances are deposits in HK$ and US$ with major global financial institutions,
and most of our borrowings are denominated in US$.
Our revenues and payments are predominantly transacted in US$. Therefore, we do not believe
there is significant risk exposure in relation to foreign exchange rate fluctuations. There are
small portions of sales and purchases transacted in different currencies for which we arrange
hedging by means of foreign exchange forward contracts.
For transactions subject to foreign exchange risk, we fully hedge our foreign currency exposure
once we receive confirmed orders or enter into customer transactions. To mitigate the impact
from changes in foreign exchange rates, we regularly review our operations in these selected
countries and make necessary hedging arrangements in certain currencies against the US$.
However, we do not enter into foreign currency hedges with respect to the local financial
results and long-term equity investments of our non-US$ foreign operations for both our income
statements and balance sheet reporting purposes. Since our functional currency is in US$,
we are subject to exchange rate exposure from translation of foreign operations’ local results to
US$ at average rate for the period for group consolidation. Our net equity investments in non-US$
denominated businesses are also subject to unrealized translation gain or loss on consolidation.
Fluctuation of relevant currencies against the US$ will result in unrealized gain or loss from time
to time, which is reflected as movement in exchange reserve in the consolidated statement of
changes in equity.
From a medium to long-term perspective, we manage our operations in the most cost effective
way possible within our global network. We strictly prohibit any financial derivative arrangement
merely for speculation.
LI & FUNG LIMITEDINTERIM REPORT 201630
Our performance (continued)
PeopleAs an asset light business, our success is overwhelmingly dependent on our people. We are
very proud of and grateful for their expertise, dedication and hard work. As at 30 June 2016,
we have a total workforce of 21,982, of which 6,377 are warehouse related employees for our
logistics and distribution businesses. In terms of geography, 3,490 of our people were based
in Hong Kong, 8,740 were based in Mainland China and 9,752 were based overseas.
Total manpower costs for the first half of 2016 were US$504 million, compared with US$495
million for the first half of 2015, with the majority of the increase due to increase in direct
labor cost associated with warehouse related employees as well as full period financial impact
resulting from the adoption of new share award scheme in May 2015.
OutlookWe expect the rest of 2016 to remain challenging. The global retail market continues to struggle
with soft consumer demand and geopolitical instability will weigh on consumer sentiment.
We expect highly promotional activities and the deflationary environment to continue, and our
trading volume will be under pressure given brands and retailers are transitioning through
a destocking cycle. In the meantime, we are focused on new areas of growth such as focused
product verticals, logistics and VSS, as well as on increasing our turnover mix in high-growth
segments such as e-commerce and off-price retailers, to counteract these headwinds.
In addition, we will continue targeting the expansion of our customer base and converting our
strong customer pipeline. As a global leader in supply chain management, we continue to be
prudent in managing customer credit risks as we continue to expand our customer base.
The more challenging environment will also provide VSS with more opportunities to help our
global vendor network.

LI & FUNG LIMITEDINTERIM REPORT 2016 31
Our performance (continued)
Building a sustainable business for the long term remains a key theme. The long-term
investments in IT and backend infrastructure will provide our business with the runway
to improve our productivity by automating processes and workflow. As a result, we expect to
reap the benefits of this productivity and operating leverage in the coming years.
As we approach the end of the current Three-Year Plan, we are on track in meeting our strategic
goals. We are in the process of developing our next Three-Year Plan for 2017-2019, which will
be announced early next year. Speed, innovation and digitalization of our business will be a
key theme. For example, our presence in Silicon Valley, established to encourage and facilitate
partnerships and collaboration in innovation initiatives, has expanded to data analytics which is
a crucial part of our supply chain digitalization efforts. These initial efforts will ramp up over time
and we are excited about the related potential new business opportunities on the horizon.
LI & FUNG LIMITEDINTERIM REPORT 201632
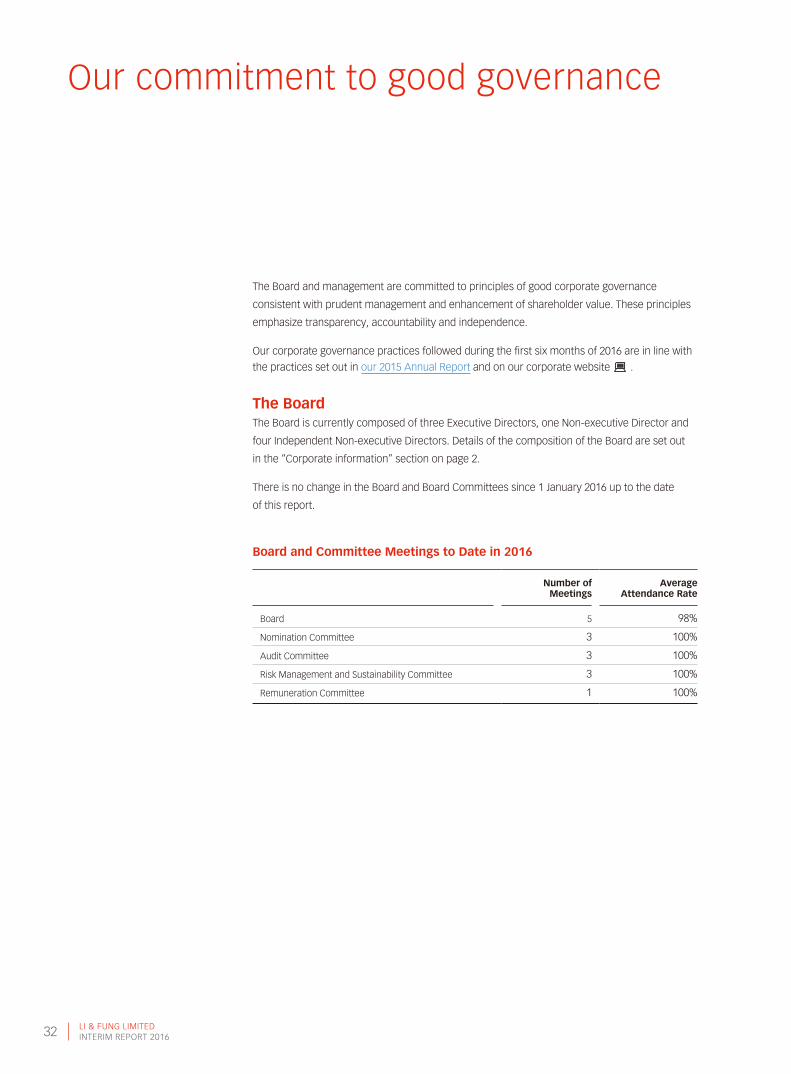
Our commitment to good governance
The Board and management are committed to principles of good corporate governance
consistent with prudent management and enhancement of shareholder value. These principles
emphasize transparency, accountability and independence.
Our corporate governance practices followed during the first six months of 2016 are in line with
the practices set out in our 2015 Annual Report and on our corporate website .
The BoardThe Board is currently composed of three Executive Directors, one Non-executive Director and
four Independent Non-executive Directors. Details of the composition of the Board are set out
in the “Corporate information” section on page 2.
There is no change in the Board and Board Committees since 1 January 2016 up to the date
of this report.
Board and Committee Meetings to Date in 2016
Number of Meetings
Average Attendance Rate
Board 5 98%
Nomination Committee 3 100%
Audit Committee 3 100%
Risk Management and Sustainability Committee 3 100%
Remuneration Committee 1 100%

LI & FUNG LIMITEDINTERIM REPORT 2016 33
Our commitment to good governance (continued)
Review of Interim Financial InformationThe Audit Committee has reviewed the interim financial information for the six months ended
30 June 2016 for the Board’s approval.
Risk Management and Internal ControlOur risk management and internal control processes remain in line with the practices set out
in the “Our approach to risk management” section on pages 52 to 59 of our 2015 Annual Report,
a copy of which is available on our corporate website .
Based on the respective assessments made by management and the Corporate Governance
team responsible for internal audit activities, the Audit Committee considered that for the first
six months of 2016:
• The risk management and internal controls and accounting systems of the Group remain in
place and functioning effectively, and were designed to provide reasonable but not absolute
assurance that material assets are protected, business risks attributable to the Group
were identified and monitored, material transactions were executed in accordance with
management’s authorization and the interim financial information were reliable for publication
• An ongoing process is in place for identifying, evaluating and managing the significant risks
faced by the Group
Compliance with the Corporate Governance CodeThe Board reviewed the Company’s corporate governance practices for the first six months of
2016 and is satisfied that it has been in full compliance with all of the applicable code provisions
set out in the Corporate Governance Code and Corporate Governance Report (with the
amendments came into effect on 1 January 2016) contained in Appendix 14 of the Listing Rules.
Directors’ and Relevant Employees’ Securities TransactionsThe Company has adopted stringent procedures governing Directors’ securities transactions
in compliance with the Model Code. Relevant employees who are likely to be in possession
of unpublished price-sensitive information (“Inside Information”) of the Group are also subject
to compliance with written guidelines in line with the Model Code. Specific confirmation of
compliance has been obtained from each Director for the interim reporting period. No incident
of non-compliance by Directors and relevant employees was noted.
We continue to comply with our policy on Inside Information in compliance with our obligations
under the SFO and Listing Rules.

Our Senior Management TeamFrom left to right: Henry Chan, Mannel Fernandez, Marc Compagnon, Wai Ping Leung, Lâle Kesebi, Spencer Fung, Joseph Phi, William Fung, Emily Mak, Victor Fung, Richard Darling, Stephen Lister, Gerard Raymond and Edward Lam

LI & FUNG LIMITEDINTERIM REPORT 201636
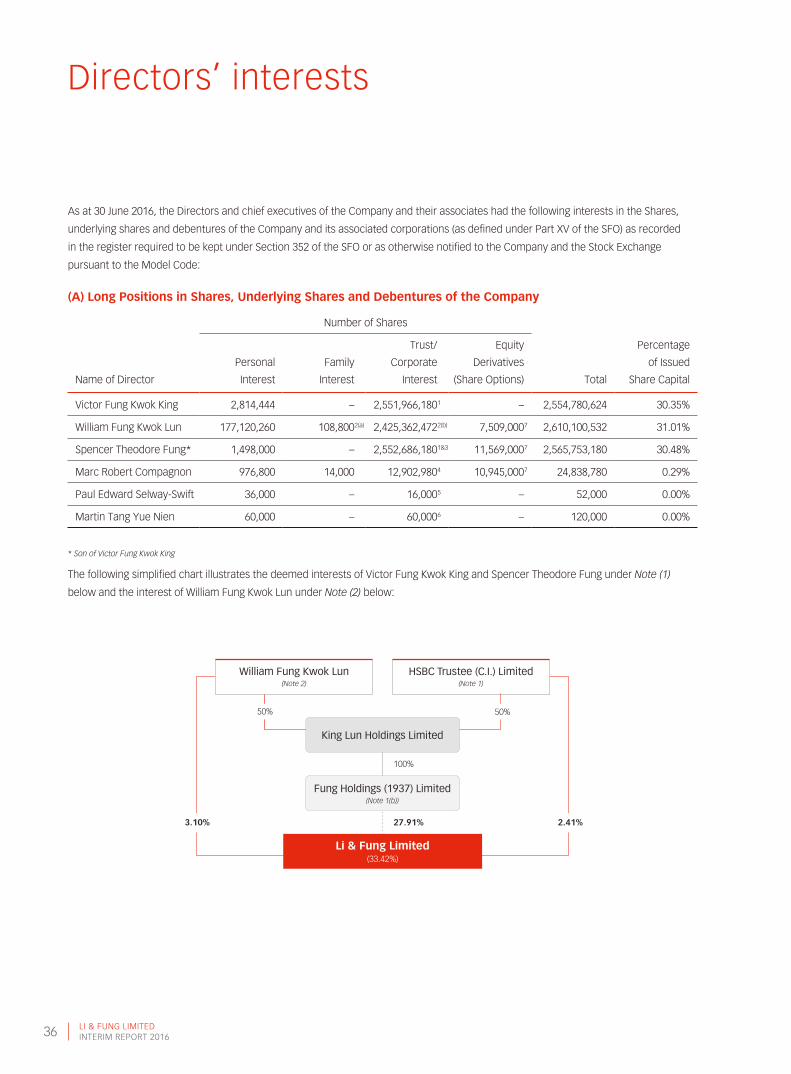
Directors’ interests
As at 30 June 2016, the Directors and chief executives of the Company and their associates had the following interests in the Shares,
underlying shares and debentures of the Company and its associated corporations (as defined under Part XV of the SFO) as recorded
in the register required to be kept under Section 352 of the SFO or as otherwise notified to the Company and the Stock Exchange
pursuant to the Model Code:
(A) Long Positions in Shares, Underlying Shares and Debentures of the Company
Number of Shares
Name of Director
Personal
Interest
Family
Interest
Trust/
Corporate
Interest
Equity
Derivatives
(Share Options) Total
Percentage
of Issued
Share Capital
Victor Fung Kwok King 2,814,444 – 2,551,966,180
1 – 2,554,780,624 30.35%
William Fung Kwok Lun 177,120,260 108,800
2(a) 2,425,362,472
2(b) 7,509,000
7 2,610,100,532 31.01%
Spencer Theodore Fung* 1,498,000 – 2,552,686,180
1&3 11,569,000
7 2,565,753,180 30.48%
Marc Robert Compagnon 976,800 14,000 12,902,980
4 10,945,000
7 24,838,780 0.29%
Paul Edward Selway-Swift 36,000 – 16,000
5 – 52,000 0.00%
Martin Tang Yue Nien 60,000 – 60,000
6 – 120,000 0.00%
* Son of Victor Fung Kwok King
The following simplified chart illustrates the deemed interests of Victor Fung Kwok King and Spencer Theodore Fung under Note (1)
below and the interest of William Fung Kwok Lun under Note (2) below:
William Fung Kwok Lun(Note 2)
HSBC Trustee (C.I.) Limited(Note 1)
King Lun Holdings Limited
Fung Holdings (1937) Limited(Note 1(b))
Li & Fung Limited(33.42%)
50% 50%
27.91%
100%
3.10% 2.41%
LI & FUNG LIMITEDINTERIM REPORT 2016 37
Directors’ interests (continued)
NOTES:As at 30 June 2016,
(1) Victor Fung Kwok King and Spencer Theodore Fung were each deemed to have interests in 2,551,966,180 Shares held in the following manner:
(a) 203,012,308 Shares were indirectly held by HSBC Trustee (C.I.) Limited through its wholly-owned subsidiary, First Island Developments Limited. HSBC Trustee is the trustee
of a trust established for the benefit of the family members of Victor Fung Kwok King (the “Trust”); and
(b) 2,195,727,908 Shares were directly held by Fung Holdings (1937) Limited, a wholly-owned subsidiary of King Lun Holdings Limited, and 153,225,964 Shares were indirectly
held by FH (1937) through its wholly-owned subsidiary, Fung Distribution International Limited. King Lun is a company owned 50% by HSBC Trustee as trustee of the Trust
and 50% by William Fung Kwok Lun.
(2) (a) Apart from 108,800 Shares, the spouse of William Fung Kwok Lun held US$2,000,000 of the perpetual subordinated capital securities of the Company.
(b) Out of 2,425,362,472 Shares, 26,114,400 Shares and 50,294,200 Shares were held by Golden Step Limited and Step Dragon Enterprise Limited respectively and both companies
are beneficially owned by William Fung Kwok Lun. The balance of 2,348,953,872 Shares were indirectly held by King Lun as mentioned in Note (1)(b) above.
(3) Out of 2,552,686,180 Shares, 720,000 Shares represented the interests in Award Shares granted by the Company and remained unvested. Details on such Award Shares are
set out in Share Award Scheme section stated below. The balance of 2,551,966,180 Shares represented the deemed interests of Spencer Theodore Fung as mentioned in
Note (1) above.
(4) Out of 12,902,980 Shares, 613,200 Shares represented the interests in Award Shares granted by the Company and remained unvested. Details on such Award Shares are
set out in Share Award Scheme section stated below. The balance of 12,289,780 Shares were held by Profit Snow Holdings Limited, a company beneficially owned by
Marc Robert Compagnon.
(5) 16,000 Shares were held by a trust of which Paul Edward Selway-Swift is a beneficiary.
(6) 60,000 Shares were held by a trust of which Martin Tang Yue Nien is a beneficiary.
(7) These interests represented the interests in underlying shares in respect of Share Options granted by the Company to these Directors as beneficial owners, the details
of which are set out in the Share Option Schemes section stated below.
(B) Short Positions in Shares, Underlying Shares and Debentures of the Company
As at 30 June 2016, none of the Directors and chief executives of the Company or their associates had any short positions in the
Shares, underlying shares and debentures of the Company or any of its associated corporations (as defined under Part XV of the SFO)
as recorded in the register required to be kept under Section 352 of the SFO or as otherwise notified to the Company and the
Stock Exchange pursuant to the Model Code.
(C) Share Options and Award Shares
The interests of the Directors and chief executives in the Share Options (being regarded as unlisted physically settled equity derivatives)
and Award Shares are detailed in the Long-term Incentive Schemes section stated below.
Save as disclosed above, at no time during the period did the Directors and chief executives (including their spouses and children
under 18 years of age) have any interest in, or were granted, or exercised, any rights to subscribe for Shares (or warrants or debentures,
if applicable) in the Company or its associated corporations, as required to be disclosed pursuant to the SFO.

LI & FUNG LIMITEDINTERIM REPORT 201638
Directors’ interests (continued)
Long-term Incentive Schemes(A) Share Option Schemes
2003 OPTION SCHEME
Pursuant to the terms of the 2003 Option Scheme, the 2003 Option Scheme is valid and effective for a period of 10 years commencing
on the adoption date and expiring on the tenth anniversary of the adoption date. Accordingly, the 2003 Option Scheme expired on
11 May 2013 and no further options could thereafter be granted under the 2003 Option Scheme. However, all remaining provisions remain
in full force and effect to govern the exercise of all the Share Options granted under the 2003 Option Scheme prior to its expiration.
As at 30 June 2016, there were Share Options relating to 14,000,000 Shares granted by the Company representing 0.17% of the issued
Shares as at the date of this Report pursuant to the 2003 Option Scheme which were valid and outstanding.
2014 OPTION SCHEME
The 2014 Option Scheme was adopted by the Shareholders at the annual general meeting of the Company held on 15 May 2014. As at
30 June 2016, there were Share Options relating to 89,788,000 Shares granted by the Company representing 1.07% of the issued Shares
as at the date of this Report pursuant to the 2014 Option Scheme which were valid and outstanding.
Details of the Share Options granted under the 2003 Option Scheme and the 2014 Option Scheme that remain outstanding as at
30 June 2016 are as follows:
Number of Share Options
Grant Date
Exercise
Price
HK$ Grantees
As at
1/1/2016 Granted Lapsed
As at
30/6/2016 Exercisable Period
2003 Option Scheme
22/12/2011 12.12
1 Spencer Theodore Fung 8,000,000 – (1,000,000) 7,000,000 Exercisable in seven equal tranches
during the period from 1/5/2015 to
30/4/2023 with each tranche having
an exercisable period of two years
Marc Robert Compagnon 8,000,000 – (1,000,000) 7,000,000
2014 Option Scheme
21/5/2015 7.49
2 William Fung Kwok Lun 7,509,000 – – 7,509,000 Exercisable in three tranches
during the period from 1/1/2016 to
31/12/2019 with each tranche having
an exercisable period of two years
Spencer Theodore Fung 4,569,000 – – 4,569,000
Marc Robert Compagnon 3,945,000 – – 3,945,000
Continuous Contract
Employees
72,272,000 – – 72,272,000
16/11/2015 5.81
3 Continuous Contract
Employees
889,000 – – 889,000 Exercisable in two tranches
during the period from 1/1/2017 to
31/12/2019 with each tranche having
an exercisable period of two years
19/5/2016 4.27
4 Continuous Contract
Employees
– 604,000 – 604,000 Exercisable during the period from
1/1/2018 to 31/12/2019
Total 105,184,000 604,000 (2,000,000) 103,788,000
LI & FUNG LIMITEDINTERIM REPORT 2016 39
Directors’ interests (continued)
NOTES:(1) Following the spin-off and separate listing of Global Brands, the exercise price applicable to the Share Options outstanding on the record date for the distribution in specie
(i.e. 7 July 2014) was adjusted from HK$14.50 to HK$12.12 with effect from 31 August 2014.
(2) The closing market price per Share as at the date preceding the date on which the Share Options were granted and stated in the Stock Exchange’s daily quotation sheet
on 20 May 2015 was HK$7.29.
(3) The closing market price per Share as at the date preceding the date on which the Share Options were granted and stated in the Stock Exchange’s daily quotation sheet
on 13 November 2015 was HK$5.58.
(4) The closing market price per Share as at the date preceding the date on which the Share Options were granted and stated in the Stock Exchange’s daily quotation sheet
on 18 May 2016 was HK$4.25.
(5) Details of Share Options granted by the Company are set out in Note 12 to the condensed interim financial information.
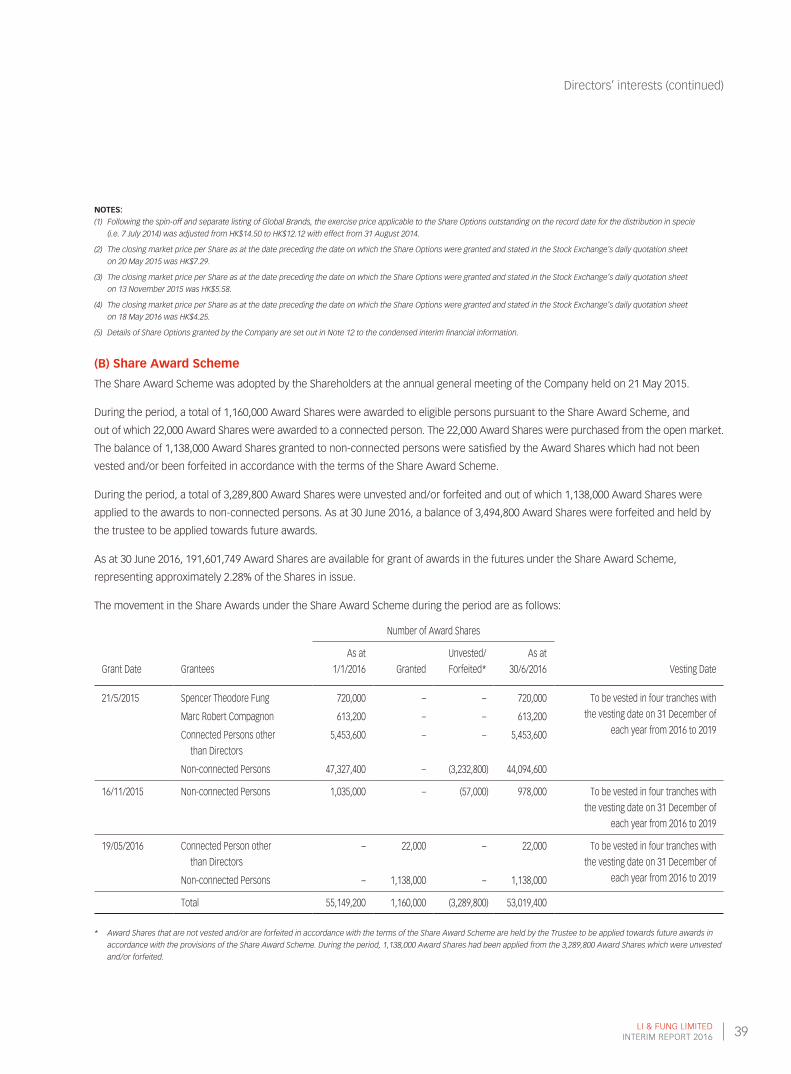
(B) Share Award Scheme
The Share Award Scheme was adopted by the Shareholders at the annual general meeting of the Company held on 21 May 2015.
During the period, a total of 1,160,000 Award Shares were awarded to eligible persons pursuant to the Share Award Scheme, and
out of which 22,000 Award Shares were awarded to a connected person. The 22,000 Award Shares were purchased from the open market.
The balance of 1,138,000 Award Shares granted to non-connected persons were satisfied by the Award Shares which had not been
vested and/or been forfeited in accordance with the terms of the Share Award Scheme.
During the period, a total of 3,289,800 Award Shares were unvested and/or forfeited and out of which 1,138,000 Award Shares were
applied to the awards to non-connected persons. As at 30 June 2016, a balance of 3,494,800 Award Shares were forfeited and held by
the trustee to be applied towards future awards.
As at 30 June 2016, 191,601,749 Award Shares are available for grant of awards in the futures under the Share Award Scheme,
representing approximately 2.28% of the Shares in issue.
The movement in the Share Awards under the Share Award Scheme during the period are as follows:
Number of Award Shares
Grant Date Grantees
As at
1/1/2016 Granted
Unvested/
Forfeited*
As at
30/6/2016 Vesting Date
21/5/2015 Spencer Theodore Fung 720,000 – – 720,000 To be vested in four tranches with
the vesting date on 31 December of
each year from 2016 to 2019Marc Robert Compagnon 613,200 – – 613,200
Connected Persons other
than Directors
5,453,600 – – 5,453,600
Non-connected Persons 47,327,400 – (3,232,800) 44,094,600
16/11/2015 Non-connected Persons 1,035,000 – (57,000) 978,000 To be vested in four tranches with
the vesting date on 31 December of
each year from 2016 to 2019
19/05/2016 Connected Person other
than Directors
– 22,000 – 22,000 To be vested in four tranches with
the vesting date on 31 December of
each year from 2016 to 2019Non-connected Persons – 1,138,000 – 1,138,000
Total 55,149,200 1,160,000 (3,289,800) 53,019,400
* Award Shares that are not vested and/or are forfeited in accordance with the terms of the Share Award Scheme are held by the Trustee to be applied towards future awards in
accordance with the provisions of the Share Award Scheme. During the period, 1,138,000 Award Shares had been applied from the 3,289,800 Award Shares which were unvested
and/or forfeited.
LI & FUNG LIMITEDINTERIM REPORT 201640
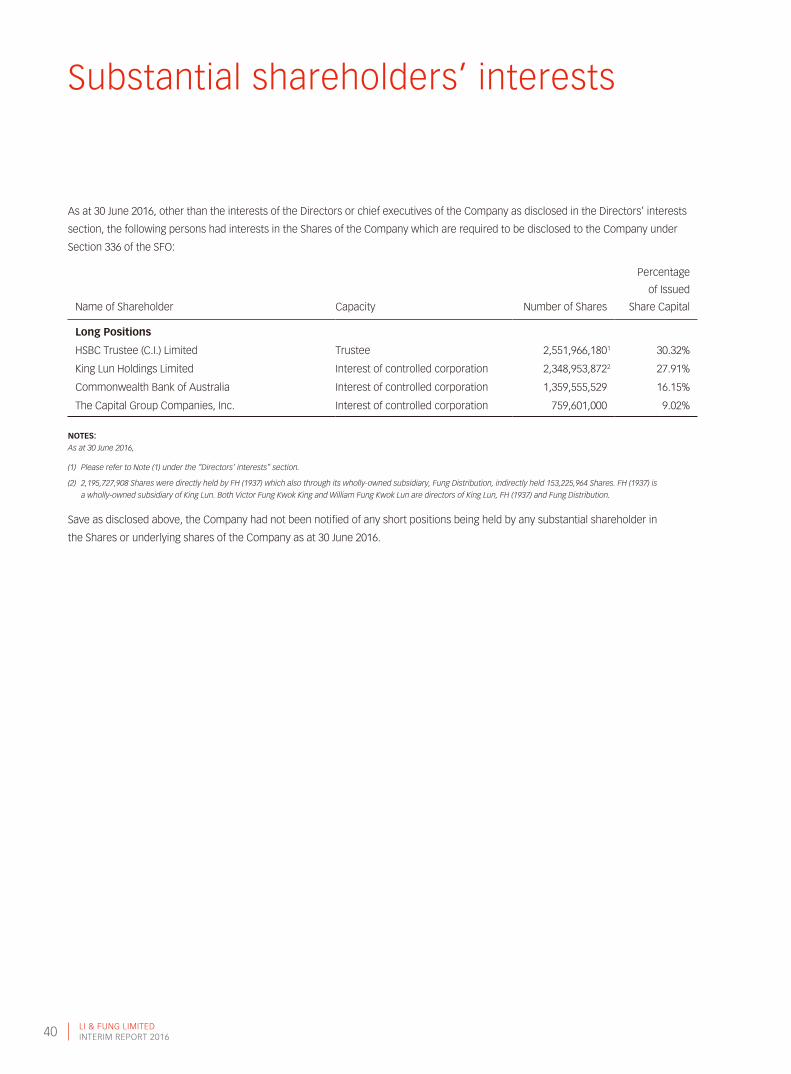
Substantial shareholders’ interests
As at 30 June 2016, other than the interests of the Directors or chief executives of the Company as disclosed in the Directors’ interests
section, the following persons had interests in the Shares of the Company which are required to be disclosed to the Company under
Section 336 of the SFO:
Name of Shareholder Capacity Number of Shares
Percentage
of Issued
Share Capital
Long Positions
HSBC Trustee (C.I.) Limited Trustee 2,551,966,180
1 30.32%
King Lun Holdings Limited Interest of controlled corporation 2,348,953,872
2 27.91%
Commonwealth Bank of Australia Interest of controlled corporation 1,359,555,529 16.15%
The Capital Group Companies, Inc. Interest of controlled corporation 759,601,000 9.02%
NOTES:As at 30 June 2016,
(1) Please refer to Note (1) under the “Directors’ interests” section.
(2) 2,195,727,908 Shares were directly held by FH (1937) which also through its wholly-owned subsidiary, Fung Distribution, indirectly held 153,225,964 Shares. FH (1937) is
a wholly-owned subsidiary of King Lun. Both Victor Fung Kwok King and William Fung Kwok Lun are directors of King Lun, FH (1937) and Fung Distribution.
Save as disclosed above, the Company had not been notified of any short positions being held by any substantial shareholder in
the Shares or underlying shares of the Company as at 30 June 2016.
LI & FUNG LIMITEDINTERIM REPORT 2016 41
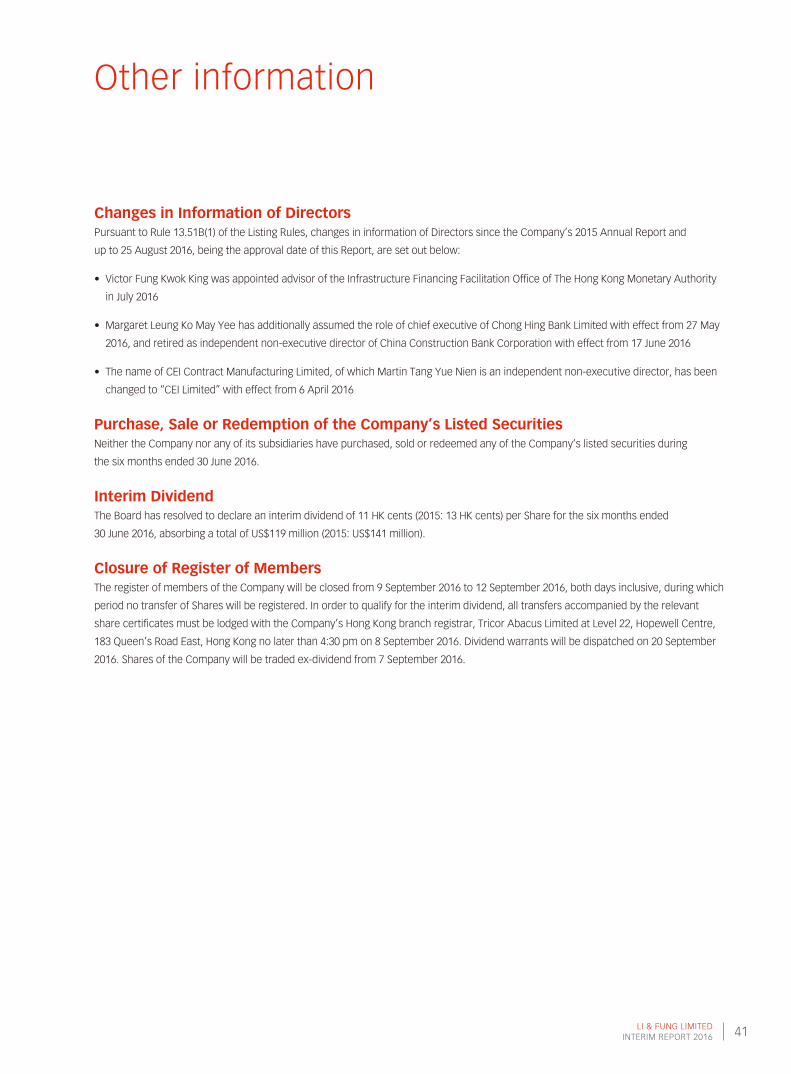
Other information
Changes in Information of DirectorsPursuant to Rule 13.51B(1) of the Listing Rules, changes in information of Directors since the Company’s 2015 Annual Report and
up to 25 August 2016, being the approval date of this Report, are set out below:
• Victor Fung Kwok King was appointed advisor of the Infrastructure Financing Facilitation Office of The Hong Kong Monetary Authority
in July 2016
• Margaret Leung Ko May Yee has additionally assumed the role of chief executive of Chong Hing Bank Limited with effect from 27 May
2016, and retired as independent non-executive director of China Construction Bank Corporation with effect from 17 June 2016
• The name of CEI Contract Manufacturing Limited, of which Martin Tang Yue Nien is an independent non-executive director, has been
changed to “CEI Limited” with effect from 6 April 2016
Purchase, Sale or Redemption of the Company’s Listed SecuritiesNeither the Company nor any of its subsidiaries have purchased, sold or redeemed any of the Company’s listed securities during
the six months ended 30 June 2016.
Interim DividendThe Board has resolved to declare an interim dividend of 11 HK cents (2015: 13 HK cents) per Share for the six months ended
30 June 2016, absorbing a total of US$119 million (2015: US$141 million).
Closure of Register of MembersThe register of members of the Company will be closed from 9 September 2016 to 12 September 2016, both days inclusive, during which
period no transfer of Shares will be registered. In order to qualify for the interim dividend, all transfers accompanied by the relevant
share certificates must be lodged with the Company’s Hong Kong branch registrar, Tricor Abacus Limited at Level 22, Hopewell Centre,
183 Queen’s Road East, Hong Kong no later than 4:30 pm on 8 September 2016. Dividend warrants will be dispatched on 20 September
2016. Shares of the Company will be traded ex-dividend from 7 September 2016.

LI & FUNG LIMITEDINTERIM REPORT 201642
Information for investors
A Chinese version of this Report can be downloaded from the Company’s website and
can be obtained from the Company’s Hong Kong branch share registrar, Tricor Abacus
Limited. In the event of any difference, the English version prevails.
本報告中文版可從本公司網站下載,及向本公司於香港之股份過戶登記處卓佳雅柏勤有
限公司索取。如中英版本有任何差異,請以英文版本為準。
Listing InformationListing: The Stock Exchange of Hong Kong Limited
Stock Code: 494
Ticker Symbol
Reuters: 0494.HK
Bloomberg: 494 HK Equity
Index RecognitionHang Seng Index
Hang Seng High Dividend Yield Index
MSCI Index Series
MSCI Global Sustainability Indexes
FTSE4Good Index Series
Hang Seng Corporate Sustainability Index Series
Key Dates25 Aug 2016 Announcement of the 2016 Interim Results
7 Sep 2016 Dividend Ex-entitlement for Shares
9-12 Sep 2016 (both days inclusive) Closure of
Register of Shareholders
20 Sep 2016 Payment of 2016 Interim Dividend
Registrar & Transfer OfficesPrincipal
Estera Management (Bermuda) Limited
Canon’s Court, 22 Victoria Street
Hamilton HM 12, Bermuda
Hong Kong Branch
Tricor Abacus Limited
Level 22, Hopewell Centre
183 Queen’s Road East, Hong Kong
Telephone: (852) 2980 1333
Share InformationBoard Lot Size: 2,000 Shares
Shares outstanding as at 30 June 2016
8,415,447,306 Shares
Market capitalization as at 30 June 2016
HK$31,473,772,924
Basic earnings per Share for 2016
Interim 0.87 US cents
Dividend per Share for 2016
Interim 11 HK cents
EnquiriesInstitutional investors and securities analysts:
Investor Relations | [email protected]
Media and potential business partners:
Corporate Communications | [email protected]
Shareholders addressed to the Board:
Company Secretariat | [email protected]
Li & Fung Limited
11th Floor, LiFung Tower
888 Cheung Sha Wan Road
Kowloon, Hong Kong
Telephone: (852) 2300 2300
Websiteswww.lifung.com | www.irasia.com/listco/hk/lifung

LI & FUNG LIMITEDINTERIM REPORT 2016 43
Independent review report
REPORT ON REVIEW OF INTERIM FINANCIAL INFORMATION
TO THE BOARD OF DIRECTORS OF LI & FUNG LIMITED
(incorporated in Bermuda with limited liability)
IntroductionWe have reviewed the interim financial information set out on pages 45 to 76, which comprises the consolidated balance sheet
of Li & Fung Limited (the “Company”) and its subsidiaries (together, the “Group”) as at 30 June 2016 and the related consolidated profit
and loss account, consolidated statement of comprehensive income, consolidated statement of changes in equity and condensed
consolidated cash flow statement for the six-month period then ended, and a summary of significant accounting policies and other
explanatory notes. The Rules Governing the Listing of Securities on The Stock Exchange of Hong Kong Limited require the preparation
of a report on interim financial information to be in compliance with the relevant provisions thereof and Hong Kong Accounting Standard
34 “Interim Financial Reporting” issued by the Hong Kong Institute of Certified Public Accountants. The directors of the Company are
responsible for the preparation and presentation of this interim financial information in accordance with Hong Kong Accounting Standard
34 “Interim Financial Reporting”. Our responsibility is to express a conclusion on this interim financial information based on our review
and to report our conclusion solely to you, as a body, in accordance with our agreed terms of engagement and for no other purpose.
We do not assume responsibility towards or accept liability to any other person for the contents of this report.
Scope of ReviewWe conducted our review in accordance with Hong Kong Standard on Review Engagements 2410, “Review of Interim Financial
Information Performed by the Independent Auditor of the Entity” issued by the Hong Kong Institute of Certified Public Accountants.
A review of interim financial information consists of making inquiries, primarily of persons responsible for financial and accounting matters,
and applying analytical and other review procedures. A review is substantially less in scope than an audit conducted in accordance
with Hong Kong Standards on Auditing and consequently does not enable us to obtain assurance that we would become aware of all
significant matters that might be identified in an audit. Accordingly, we do not express an audit opinion.
ConclusionBased on our review, nothing has come to our attention that causes us to believe that the interim financial information is not prepared,
in all material respects, in accordance with Hong Kong Accounting Standard 34 “Interim Financial Reporting”.
PricewaterhouseCoopers
Certified Public Accountants
Hong Kong, 25 August 2016
PricewaterhouseCoopers, 22/F Prince’s Building, Central, Hong Kong
T: +852 2289 8888, F: +852 2810 9888, www.pwchk.com
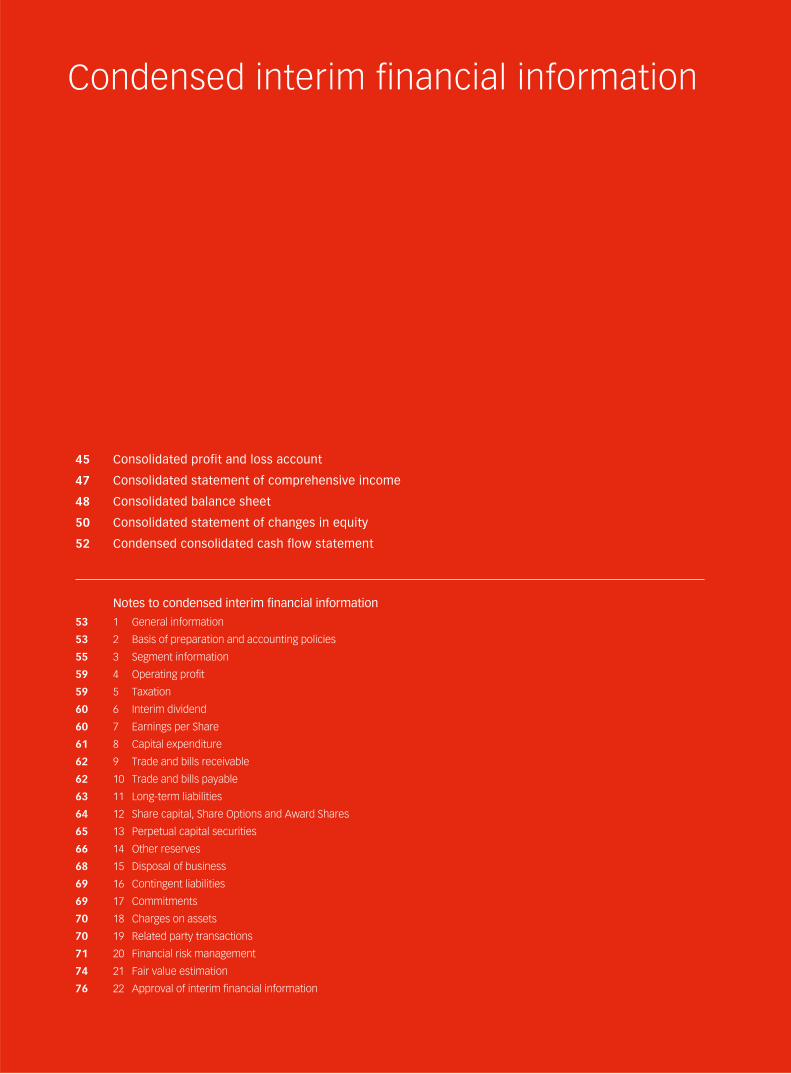
Condensed interim financial information
45 Consolidated profit and loss account
47 Consolidated statement of comprehensive income
48 Consolidated balance sheet
50 Consolidated statement of changes in equity
52 Condensed consolidated cash flow statement
Notes to condensed interim financial information
53 1 General information
53 2 Basis of preparation and accounting policies
55 3 Segment information
59 4 Operating profit
59 5 Taxation
60 6 Interim dividend
60 7 Earnings per Share
61 8 Capital expenditure
62 9 Trade and bills receivable
62 10 Trade and bills payable
63 11 Long-term liabilities
64 12 Share capital, Share Options and Award Shares
65 13 Perpetual capital securities
66 14 Other reserves
68 15 Disposal of business
69 16 Contingent liabilities
69 17 Commitments
70 18 Charges on assets
70 19 Related party transactions
71 20 Financial risk management
74 21 Fair value estimation
76 22 Approval of interim financial information

LI & FUNG LIMITEDINTERIM REPORT 2016 45
Consolidated profit and loss account
UnauditedSix months ended 30 June
2016 2015Note US$’000 US$’000
Turnover 3 8,070,733 8,625,611
Cost of sales (7,150,033) (7,664,676)
Gross profit 920,700 960,935
Other income 14,776 22,616
Total margin 935,476 983,551
Selling and distribution expenses (290,945) (315,139)
Merchandising and administrative expenses (488,093) (486,142)
Core operating profit 3 156,438 182,270
Gain on remeasurement of contingent consideration payable 4 – 60,151
Amortization of other intangible assets 4 (17,337) (17,742)
Gain on disposal of business 4&15(c) 7,871 –
One-off reorganization costs 4 (5,863) –
Operating profit 3&4 141,109 224,679
Interest income 5,611 2,971
Interest expenses
Non-cash interest expenses (2,247) (3,750)
Cash interest expenses (44,732) (44,916)
(46,979) (48,666)
Share of profits less losses of associated companies 1,582 1,475
Profit before taxation 101,323 180,459
Taxation 5 (14,595) (17,866)
Net profit for the period 86,728 162,593
Attributable to:
Shareholders of the Company 72,315 148,685
Holders of perpetual capital securities 15,000 15,000
Non-controlling interests (587) (1,092)
86,728 162,593

LI & FUNG LIMITEDINTERIM REPORT 201646
Consolidated profit and loss account (continued)
UnauditedSix months ended 30 June
2016 2015Note US$’000 US$’000
Earnings per share for profit attributable to the Shareholders
of the Company during the period 7
– Basic 6.7 HK cents 13.8 HK cents
(equivalent to) 0.87 US cents 1.78 US cents
– Diluted 6.7 HK cents 13.8 HK cents
(equivalent to) 0.86 US cents 1.78 US cents
Details of dividends to Shareholders of the Company are set out in Note 6. The notes on pages 53 to 76 form an integral part
of this interim financial information.

LI & FUNG LIMITEDINTERIM REPORT 2016 47
Consolidated statement of comprehensive income
The notes on pages 53 to 76 form an integral part of this interim financial information.
UnauditedSix months ended 30 June
2016 2015US$’000 US$’000
Net Profit for the Period 86,728 162,593
Other Comprehensive Income/(Expense):
Items that will not be reclassified to profit or loss
Remeasurements from post-employment benefits recognized in reserve, net of tax 1 2
Total Items that will not be Reclassified to Profit or Loss 1 2
Items that may be reclassified subsequently to profit or loss
Currency translation differences* (56,287) 7,052
Net fair value gains/(losses) on cash flow hedges, net of tax 2,066 (8,322)
Net fair value gains on available-for-sale financial assets, net of tax 86 76
Total Items that may be Reclassified Subsequently to Profit or Loss (54,135) (1,194)
Total Other Comprehensive Expense for the Period, Net of Tax (54,134) (1,192)
Total Comprehensive Income for the Period 32,594 161,401
Attributable to:
Shareholders of the Company 18,676 149,017
Holders of perpetual capital securities 15,000 15,000
Non-controlling interests (1,082) (2,616)
Total Comprehensive Income for the Period 32,594 161,401
* Exchange differences resulting from translation of the results and financial positions of the Group entities with functional currencies other than the Group’s presentation currency.

LI & FUNG LIMITEDINTERIM REPORT 201648
Consolidated balance sheet
Unaudited 30 June 2016
Audited 31 December 2015
Note US$’000 US$’000
Non-current Assets
Intangible assets 8 3,955,857 4,266,863
Property, plant and equipment 8 213,027 241,626
Prepaid premium for land leases 132 1,942
Associated companies 11,502 10,070
Joint venture 925 313
Available-for-sale financial assets 3,940 3,854
Other receivables, prepayments and deposits 30,291 26,217
Deferred tax assets 29,912 36,527
4,245,586 4,587,412
Current Assets
Inventories 385,753 566,002
Due from related companies 588,163 486,939
Trade and bills receivable 9 1,268,472 1,689,413
Other receivables, prepayments and deposits 242,606 256,818
Derivative financial instruments 3,100 4,272
Cash and bank balances 530,958 342,243
3,019,052 3,345,687
Current Liabilities
Due to related companies 1,767 1,038
Trade and bills payable 10 2,144,447 2,464,785
Accrued charges and sundry payables 408,271 601,129
Purchase consideration payable for acquisitions 11 74,772 86,266
Taxation 45,136 56,463
Bank advances for discounted bills 9 31,313 33,681
Short-term bank loans 32,093 95,819
Current portion of long-term notes 11 499,578 –
3,237,377 3,339,181
Net Current (Liabilities)/Assets (218,325) 6,506
Total Assets Less Current Liabilities 4,027,261 4,593,918
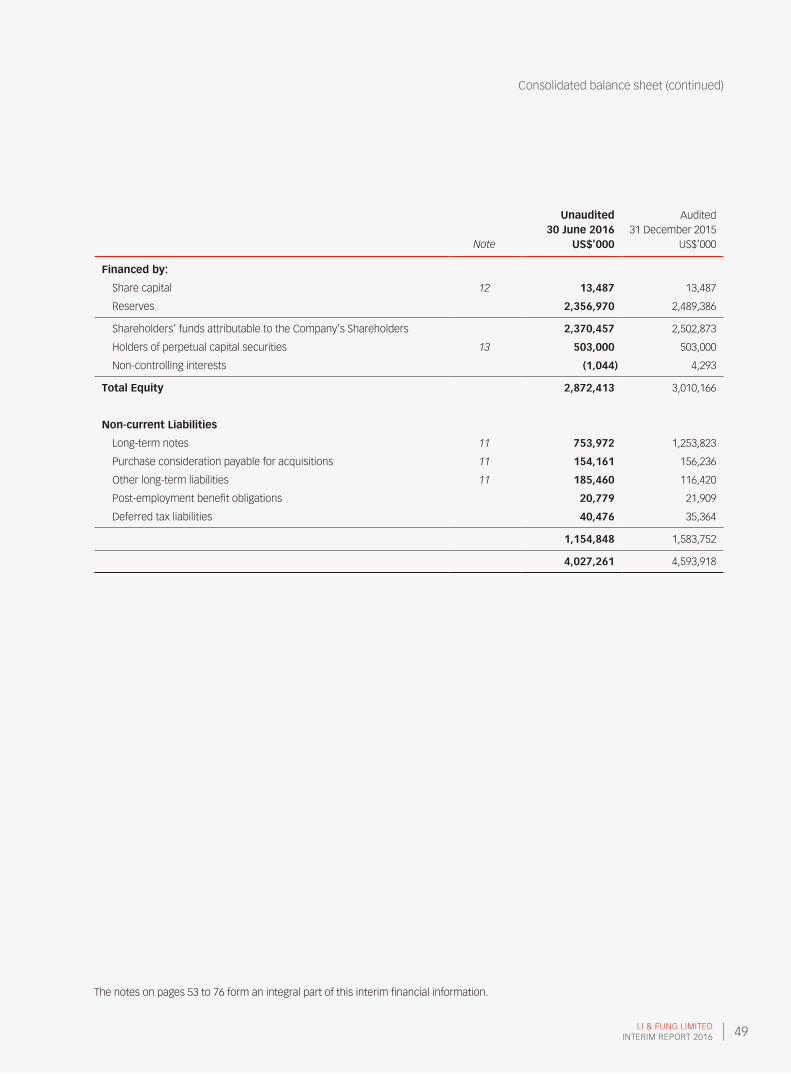
LI & FUNG LIMITEDINTERIM REPORT 2016 49
Consolidated balance sheet (continued)
The notes on pages 53 to 76 form an integral part of this interim financial information.
Unaudited 30 June 2016
Audited 31 December 2015
Note US$’000 US$’000
Financed by:
Share capital 12 13,487 13,487
Reserves 2,356,970 2,489,386
Shareholders’ funds attributable to the Company’s Shareholders 2,370,457 2,502,873
Holders of perpetual capital securities 13 503,000 503,000
Non-controlling interests (1,044) 4,293
Total Equity 2,872,413 3,010,166
Non-current Liabilities
Long-term notes 11 753,972 1,253,823
Purchase consideration payable for acquisitions 11 154,161 156,236
Other long-term liabilities 11 185,460 116,420
Post-employment benefit obligations 20,779 21,909
Deferred tax liabilities 40,476 35,364
1,154,848 1,583,752
4,027,261 4,593,918

LI & FUNG LIMITEDINTERIM REPORT 201650
Consolidated statement of changes in equity
Unaudited
Attributable to Shareholders of the CompanyHolders of Perpetual
Capital Securities
Non-controlling
InterestsTotal
Equity
Share Capital
Share Premium
Other Reserves
Retained Earnings Total
US$’000 US$’000 US$’000 US$’000 US$’000 US$’000 US$’000 US$’000(Note 12) (Note 14) (Note 13)
Balance at 1 January 2016 13,487 704,618 554,903 1,229,865 2,502,873 503,000 4,293 3,010,166
Comprehensive Income/(Expense)
Profit or loss – – – 72,315 72,315 15,000 (587) 86,728
Other Comprehensive (Expense)/Income
Currency translation differences – – (55,792) – (55,792) – (495) (56,287)
Net fair value gains on available-for-sale financial assets, net of tax – – 86 – 86 – – 86
Net fair value gains on cash flow hedges, net of tax – – 2,066 – 2,066 – – 2,066
Remeasurements from post-employment benefits recognized in reserve, net of tax – – 1 – 1 – – 1
Total other comprehensive expense, net of tax – – (53,639) – (53,639) – (495) (54,134)
Total Comprehensive (Expense)/Income – – (53,639) 72,315 18,676 15,000 (1,082) 32,594
Transactions with Owners in their Capacity as Owners
Purchase of shares for Share Award Scheme – – (12) – (12) – – (12)
Employee Share Option and Share Award Scheme:
– value of employee services – – 11,590 – 11,590 – – 11,590
Distribution to holders of perpetual capital securities – – – – – (15,000) – (15,000)
Transfer to capital reserve – – 61 (61) – – – –
2015 final dividends paid – – – (162,670) (162,670) – – (162,670)
Disposal of business – – – – – – (4,255) (4,255)
Total Transactions with Owners in their Capacity as Owners – – 11,639 (162,731) (151,092) (15,000) (4,255) (170,347)
Balance at 30 June 2016 13,487 704,618 512,903 1,139,449 2,370,457 503,000 (1,044) 2,872,413

LI & FUNG LIMITEDINTERIM REPORT 2016 51
Consolidated statement of changes in equity (continued)
Unaudited
Attributable to Shareholders of the CompanyHolders of Perpetual
Capital Securities
Non-controlling
InterestsTotal
Equity
Share Capital
Share Premium
Other Reserves
Retained Earnings Total
US$’000 US$’000 US$’000 US$’000 US$’000 US$’000 US$’000 US$’000(Note 12) (Note 14) (Note 13)
Balance at 1 January 2015 13,398 699,476 634,098 1,251,512 2,598,484 503,000 8,594 3,110,078
Comprehensive Income/(Expense)
Profit or loss – – – 148,685 148,685 15,000 (1,092) 162,593
Other Comprehensive Income/(Expense)
Currency translation differences – – 8,576 – 8,576 – (1,524) 7,052
Net fair value gains on available-for-sale
financial assets, net of tax – – 76 – 76 – – 76
Net fair value losses on cash flow hedges, net
of tax – – (8,322) – (8,322) – – (8,322)
Remeasurements from post-employment
benefits recognized in reserve, net of tax – – 2 – 2 – – 2
Total other comprehensive income/(expense),
net of tax – – 332 – 332 – (1,524) (1,192)
Total Comprehensive Income/(Expense) – – 332 148,685 149,017 15,000 (2,616) 161,401
Transactions with Owners in their
Capacity as Owners
Issue of shares for Share Award Scheme 89 – (89) – – – – –
Purchase of shares for Share Award Scheme – – (7,300) – (7,300) – – (7,300)
Employee Share Option and Share Award
Scheme:
– value of employee services – – 4,164 – 4,164 – – 4,164
Distribution to holders of perpetual capital
securities – – – – – (15,000) – (15,000)
Transfer to capital reserve – – 92 (92) – – – –
2014 final and special dividends paid – – – (303,388) (303,388) – – (303,388)
Total Transactions with Owners in their
Capacity as Owners 89 – (3,133) (303,480) (306,524) (15,000) – (321,524)
Balance at 30 June 2015 13,487 699,476 631,297 1,096,717 2,440,977 503,000 5,978 2,949,955
The notes on pages 53 to 76 form an integral part of this interim financial information.

LI & FUNG LIMITEDINTERIM REPORT 201652
Condensed consolidated cash flow statement
UnauditedSix months ended 30 June
2016 2015Note US$’000 US$’000
Operating Activities
Operating profit before working capital changes 204,868 227,905
Changes in working capital (24,076) (19,330)
Net cash inflow generated from operations 180,792 208,575
Profits tax paid (29,174) (28,596)
Net Cash Inflow from Operating Activities 151,618 179,979
Investing Activities
Settlement of consideration payable for prior years acquisitions of businesses (13,607) (15,941)
Disposal of business 15(b) 301,169 –
Capital expenditure (43,865) (37,288)
Other investing activities 5,255 4,004
Net Cash Inflow/(Outflow) from Investing Activities 248,952 (49,225)
Net Cash Inflow before Financing Activities 400,570 130,754
Financing Activities
Interest paid (44,732) (44,916)
Distribution made to holders of perpetual capital securities (15,000) (15,000)
Dividends paid (162,670) (303,388)
Purchase of shares for Share Award Scheme (12) (7,300)
Other financing activities 11,274 13,012
Net Cash Outflow from Financing Activities (211,140) (357,592)
Increase/(Decrease) in Cash and Cash Equivalents 189,430 (226,838)
Cash and cash equivalents at 1 January 342,243 538,529
Effect of foreign exchange rate changes (715) 3,343
Cash and Cash Equivalents at 30 June 530,958 315,034
Analysis of the balances of cash and cash equivalents
Cash and bank balances 530,958 315,034
The notes on pages 53 to 76 form an integral part of this interim financial information.
LI & FUNG LIMITEDINTERIM REPORT 2016 53
Notes to condensed interim financial information
1 General InformationLi & Fung Limited and its subsidiaries are principally engaged in managing the supply chain for retailers and brands worldwide
with more than 250 offices across 40 economies.
The Company is a limited liability company incorporated in Bermuda. The address of its registered office is Canon’s Court,
22 Victoria Street, Hamilton HM12, Bermuda.
The Company’s shares are listed on the Stock Exchange.
This condensed interim financial information is presented in US dollars, unless otherwise stated. This condensed interim financial
information was approved for issue on 25 August 2016.
2 Basis of Preparation and Accounting PoliciesThe unaudited condensed interim financial information (the “interim financial information”) has been reviewed by the Company’s
audit committee and, in accordance with Hong Kong Standard on Review Engagements 2410 “Review of Interim Financial
Information Performed by the Independent Auditor of the Entity” issued by the Hong Kong Institute of Certified Public Accountants
(“HKICPA”), by the Company’s auditor, PricewaterhouseCoopers.
This interim financial information has been prepared in accordance with Hong Kong Accounting Standard (“HKAS”) 34, “Interim
Financial Reporting” issued by the HKICPA and Appendix 16 of the Listing Rules. This interim financial information should be read
in conjunction with the annual financial statements for the year ended 31 December 2015, which were prepared in accordance
with Hong Kong Financial Reporting Standards (“HKFRSs”).
As at 30 June 2016, the Group recorded net current liabilities of US$218,325,000 (31 December 2015: net current assets of
US$6,506,000) which was primarily due to the long-term notes of US$500 million which will become due in May 2017. The Group
has secured over US$700 million in committed facilities with tenure of three years up to 2019, in which US$551 million are unutilized,
to provide the Group with the maximum flexibility in deciding on the timing of either refinancing or repayment of the long-term notes
to reduce the Group’s overall leverage.
Management of the Company has considered internally generated funds and financial resources available to the Group in adoption
of going concern basis in the preparation of the interim financial information.
Except as described in (a) below, the accounting policies applied are consistent with those of the annual financial statements for
the year ended 31 December 2015, as described in those annual financial statements.
Taxes on income in the interim periods are accrued using the tax rates that would be applicable to expected total annual earnings.
LI & FUNG LIMITEDINTERIM REPORT 201654
Notes to condensed interim financial information (continued)
2 Basis of Preparation and Accounting Policies (continued)
(a) New Standards and Amendments to Existing Standards Adopted by the GroupThe following new standards and amendments to existing standards are mandatory for accounting periods beginning on or
after 1 January 2016:
HKAS 1 Amendment Disclosure Initiative
HKAS 16 and HKAS 38 Amendment Clarification of Acceptable Methods of Depreciation and Amortisation
HKAS 16 and HKAS 41 Amendment Agriculture: Bearer Plants
HKAS 27 Amendment Equity Method in Separate Financial Statements
HKFRS 10, HKFRS 12 and HKAS 28 Amendment Investment Entities: Applying the Consolidation Exception
HKFRS 11 Amendment Accounting for Acquisitions of Interests in Joint Operations
HKFRS 14 Regulatory Deferral Accounts
Annual Improvements Project Annual Improvements 2012-2014 Cycle
The application of the above new standards and amendments to existing standards in the current interim period has had no
material effect on the amounts reported in the interim financial information and/or disclosures set out in the interim financial
information.
(b) New Standards and Amendments to Existing Standards that have been Issued but are not yet Effective and have not been Early Adopted by the GroupThe following new standards and amendments to existing standards have been issued and are mandatory for the Group’s
accounting periods beginning on or after 1 January 2017 or later periods, but the Group has not early adopted them:
HKAS 7 Amendment Disclosure Initiative1
HKAS 12 Amendment Recognition of Deferred Tax Assets for Unrealised Losses1
HKFRS 9 Financial Instruments2
HKFRS 10 and HKAS 28 Amendment Sale or Contribution of Assets between an Investor and its Associate
or Joint Venture4
HKFRS 15 Revenue from Contracts with Customers2
HKFRS 16 Leases3
Notes:1 Effective for financial periods beginning on or after 1 January 2017
2 Effective for financial periods beginning on or after 1 January 2018
3 Effective for financial periods beginning on or after 1 January 2019
4 Effective date to be determined

LI & FUNG LIMITEDINTERIM REPORT 2016 55
Notes to condensed interim financial information (continued)
3 Segment InformationThe Company is domiciled in Bermuda. The Group is principally engaged in managing the supply chain for retailers and brands
worldwide with more than 250 offices across 40 economies spanning across the Americas, Europe, Africa and Asia Pacific.
Turnover represents revenue generated from sales and services rendered at invoiced value to customers outside the Group
less discounts and returns.
The Group’s management (chief operating decision-maker) considers the business principally from the perspective of two global
Networks, namely the Trading Network and the Logistics Network. The Trading Network focuses on provision of the global sourcing
services via multiple channels, such as buying agent, trading-as-principal for private label merchandise and on-shore wholesale
business. The Logistics Network focuses on provision of logistics solutions and freight forwarding services.
The Group’s management assesses the performance of the operating segments based on a measure of operating profit, referred
to as core operating profit. This measurement basis includes profit of the operating segments before share of results of associated
companies, interest income, interest expenses, tax, material gains or losses which are of capital nature or non-operational
related, acquisition related cost. This also excludes any gain or loss on remeasurement of contingent consideration payable
and amortization of other intangible assets which are non-cash items. Other information provided to the Group’s management
is measured in a manner consistent with that in the financial statements.
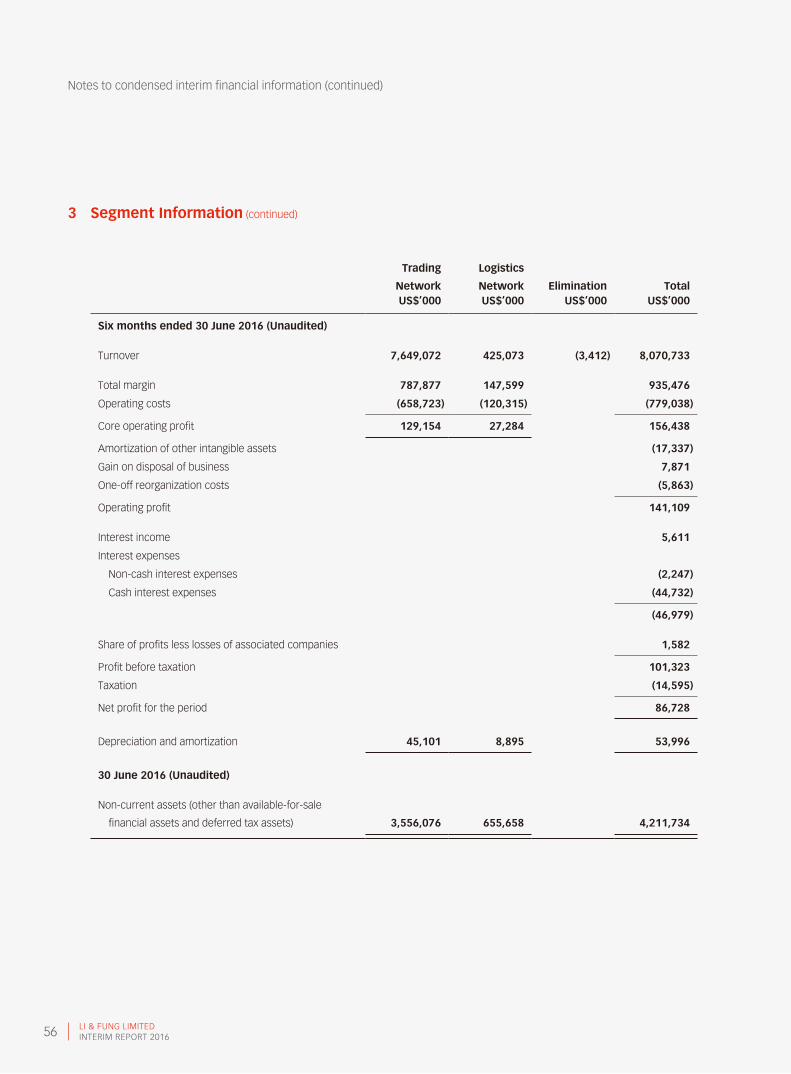
LI & FUNG LIMITEDINTERIM REPORT 201656
Notes to condensed interim financial information (continued)
3 Segment Information (continued)
Trading
Network
Logistics
Network Elimination TotalUS$’000 US$’000 US$’000 US$’000
Six months ended 30 June 2016 (Unaudited)
Turnover 7,649,072 425,073 (3,412) 8,070,733
Total margin 787,877 147,599 935,476
Operating costs (658,723) (120,315) (779,038)
Core operating profit 129,154 27,284 156,438
Amortization of other intangible assets (17,337)
Gain on disposal of business 7,871
One-off reorganization costs (5,863)
Operating profit 141,109
Interest income 5,611
Interest expenses
Non-cash interest expenses (2,247)
Cash interest expenses (44,732)
(46,979)
Share of profits less losses of associated companies 1,582
Profit before taxation 101,323
Taxation (14,595)
Net profit for the period 86,728
Depreciation and amortization 45,101 8,895 53,996
30 June 2016 (Unaudited)
Non-current assets (other than available-for-sale
financial assets and deferred tax assets) 3,556,076 655,658 4,211,734

LI & FUNG LIMITEDINTERIM REPORT 2016 57
Notes to condensed interim financial information (continued)
3 Segment Information (continued)
Trading Network
Logistics Network Elimination Total
US$’000 US$’000 US$’000 US$’000
Six months ended 30 June 2015 (Unaudited)
Turnover 8,155,545 474,969 (4,903) 8,625,611
Total margin 854,756 128,795 983,551
Operating costs (695,063) (106,218) (801,281)
Core operating profit 159,693 22,577 182,270
Gain on remeasurement of contingent
consideration payable 60,151
Amortization of other intangible assets (17,742)
Operating profit 224,679
Interest income 2,971
Interest expenses
Non-cash interest expenses (3,750)
Cash interest expenses (44,916)
(48,666)
Share of profits less losses of associated companies 1,475
Profit before taxation 180,459
Taxation (17,866)
Net profit for the period 162,593
Depreciation and amortization 48,575 8,301 56,876
31 December 2015 (Audited)
Non-current assets (other than available-for-sale
financial assets and deferred tax assets) 3,890,628 656,403 4,547,031
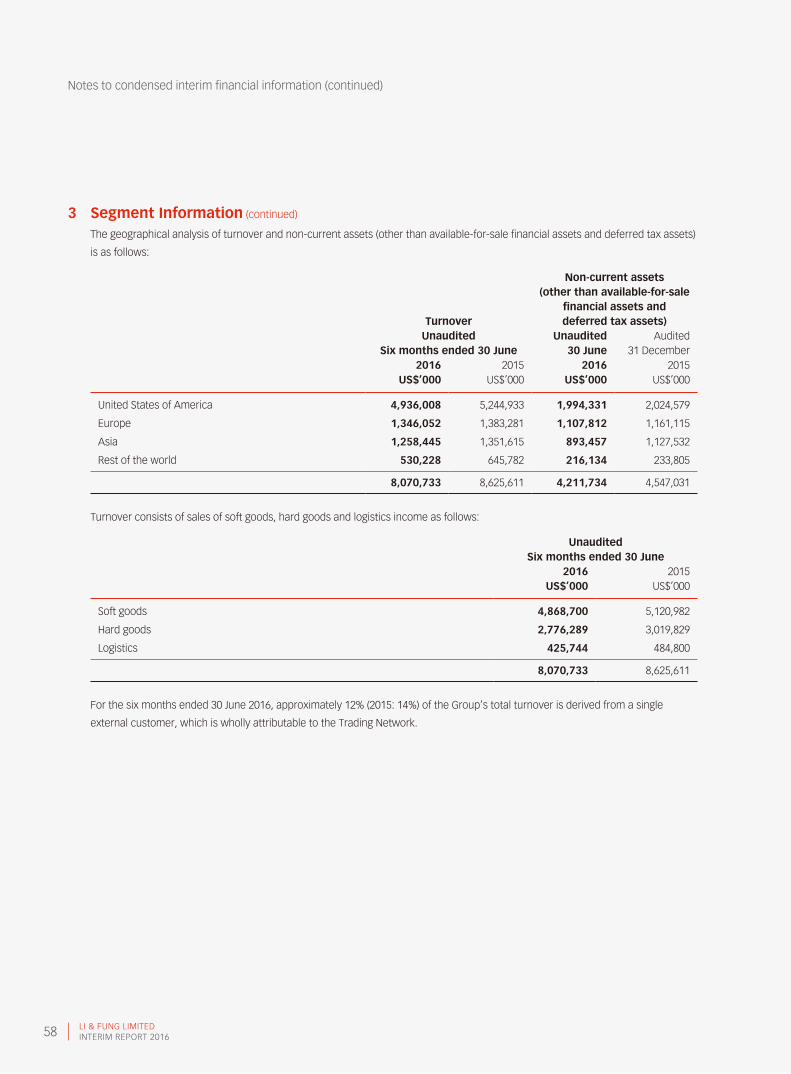
LI & FUNG LIMITEDINTERIM REPORT 201658
Notes to condensed interim financial information (continued)
3 Segment Information (continued)
The geographical analysis of turnover and non-current assets (other than available-for-sale financial assets and deferred tax assets)
is as follows:
Turnover
Non-current assets (other than available-for-sale
financial assets and deferred tax assets)
Unaudited Unaudited AuditedSix months ended 30 June 30 June 31 December
2016 2015 2016 2015US$’000 US$’000 US$’000 US$’000
United States of America 4,936,008 5,244,933 1,994,331 2,024,579
Europe 1,346,052 1,383,281 1,107,812 1,161,115
Asia 1,258,445 1,351,615 893,457 1,127,532
Rest of the world 530,228 645,782 216,134 233,805
8,070,733 8,625,611 4,211,734 4,547,031
Turnover consists of sales of soft goods, hard goods and logistics income as follows:
UnauditedSix months ended 30 June
2016 2015US$’000 US$’000
Soft goods 4,868,700 5,120,982
Hard goods 2,776,289 3,019,829
Logistics 425,744 484,800
8,070,733 8,625,611
For the six months ended 30 June 2016, approximately 12% (2015: 14%) of the Group’s total turnover is derived from a single
external customer, which is wholly attributable to the Trading Network.

LI & FUNG LIMITEDINTERIM REPORT 2016 59
Notes to condensed interim financial information (continued)
4 Operating ProfitOperating profit is stated after crediting and charging the following:
UnauditedSix months ended 30 June
2016 2015US$’000 US$’000
Crediting
Gain on remeasurement of contingent consideration payable* – 60,151
Gain on disposal of business* 7,871 –
Charging
Staff costs including directors’ emoluments 504,189 494,577
One-off reorganization costs* 5,863 –
Amortization of system development, software and other license costs 6,515 7,516
Amortization of other intangible assets* 17,337 17,742
Amortization of prepaid premium for land leases 57 64
Depreciation of property, plant and equipment 30,087 31,554
Net loss on disposal of property, plant and equipment 4,553 2,311
* Excluded from the core operating profit
5 TaxationHong Kong profits tax has been provided at the rate of 16.5% (2015: 16.5%) on the estimated assessable profits for the period.
Taxation on overseas profits has been calculated on the estimated assessable profits for the period at the rates of taxation
prevailing in the countries in which the Group operates.
The amount of taxation charged to the consolidated profit and loss account represents:
UnauditedSix months ended 30 June
2016 2015US$’000 US$’000
Current taxation
– Hong Kong profits tax 1,275 5,895
– Overseas taxation 16,085 13,645
Deferred taxation (2,765) (1,674)
14,595 17,866

LI & FUNG LIMITEDINTERIM REPORT 201660
Notes to condensed interim financial information (continued)
6 Interim Dividend
UnauditedSix months ended 30 June
2016 2015US$’000 US$’000
Proposed, of HK$0.11 (equivalent to US$0.014)
(2015: HK$0.13 (equivalent to US$0.017)) per ordinary share (Note) 119,291 140,980
Note:Final dividend of US$162,670,000 proposed for the year ended 31 December 2015 were paid in June 2016 (2015: final and special dividends of US$227,541,000 and
US$75,847,000 respectively).
7 Earnings per ShareThe calculation of basic earnings per share is based on the Group’s profit attributable to Shareholders of US$72,315,000 (2015:
US$148,685,000) and on the weighted average number of 8,354,869,000 (2015: 8,354,612,000) shares in issue during the period.
The diluted earnings per share for the six months ended 30 June 2016 was calculated by adjusting the weighted average number
of 8,354,869,000 (2015: 8,354,612,000) ordinary shares in issue by 56,502,000 (2015: 13,871,000) to assume conversion of all dilutive
potential ordinary shares granted under the Company’s Share Option and Share Award Scheme. For the determination of dilutive
potential ordinary share granted under the Company, a calculation is done to determine the number of shares that could have
been acquired at fair value (determined as the average annual market share price of the Company’s shares) based on the monetary
value of the subscription rights attached to outstanding Share Options. The number of shares calculated as above is compared with
the number of shares that would have been issued assuming the exercise of the Share Options and Award Shares.
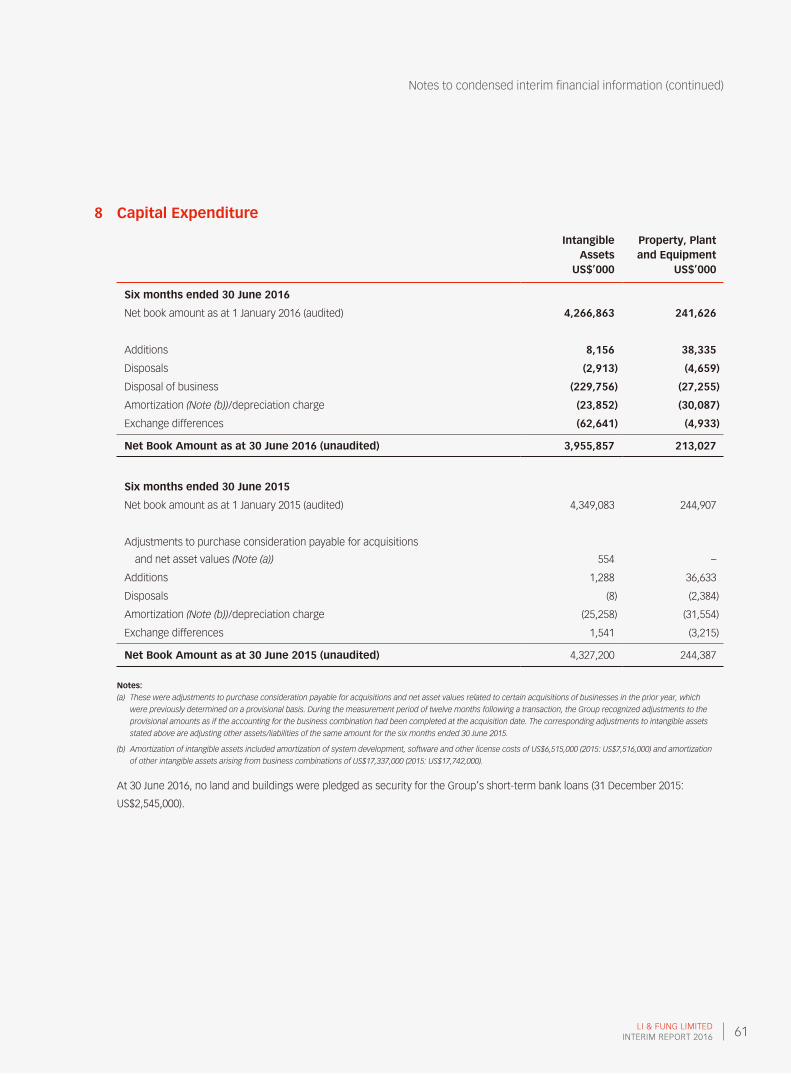
LI & FUNG LIMITEDINTERIM REPORT 2016 61
Notes to condensed interim financial information (continued)
8 Capital Expenditure
Intangible Assets
Property, Plant and Equipment
US$’000 US$’000
Six months ended 30 June 2016
Net book amount as at 1 January 2016 (audited) 4,266,863 241,626
Additions 8,156 38,335
Disposals (2,913) (4,659)
Disposal of business (229,756) (27,255)
Amortization (Note (b))/depreciation charge (23,852) (30,087)
Exchange differences (62,641) (4,933)
Net Book Amount as at 30 June 2016 (unaudited) 3,955,857 213,027
Six months ended 30 June 2015
Net book amount as at 1 January 2015 (audited) 4,349,083 244,907
Adjustments to purchase consideration payable for acquisitions
and net asset values (Note (a)) 554 –
Additions 1,288 36,633
Disposals (8) (2,384)
Amortization (Note (b))/depreciation charge (25,258) (31,554)
Exchange differences 1,541 (3,215)
Net Book Amount as at 30 June 2015 (unaudited) 4,327,200 244,387
Notes:(a) These were adjustments to purchase consideration payable for acquisitions and net asset values related to certain acquisitions of businesses in the prior year, which
were previously determined on a provisional basis. During the measurement period of twelve months following a transaction, the Group recognized adjustments to the
provisional amounts as if the accounting for the business combination had been completed at the acquisition date. The corresponding adjustments to intangible assets
stated above are adjusting other assets/liabilities of the same amount for the six months ended 30 June 2015.
(b) Amortization of intangible assets included amortization of system development, software and other license costs of US$6,515,000 (2015: US$7,516,000) and amortization
of other intangible assets arising from business combinations of US$17,337,000 (2015: US$17,742,000).
At 30 June 2016, no land and buildings were pledged as security for the Group’s short-term bank loans (31 December 2015:
US$2,545,000).

LI & FUNG LIMITEDINTERIM REPORT 201662
Notes to condensed interim financial information (continued)
9 Trade and Bills ReceivableThe ageing of trade and bills receivable based on invoice date is as follows:
Current to 90 Days
91 to 180 Days
181 to 360 Days
Over 360 Days Total
US$’000 US$’000 US$’000 US$’000 US$’000
Balance at 30 June 2016
(unaudited) 1,207,181 52,292 8,184 815 1,268,472
Balance at 31 December 2015
(audited) 1,595,433 83,376 7,900 2,704 1,689,413
All trade and bills receivable are either repayable within one year or on demand. Accordingly, the fair values of the Group’s trade
and bills receivable were approximately the same as their carrying values as at 30 June 2016. The fair value of the Group’s trade and
bills receivable balance as at 30 June 2016 has taken into account a provision of US$15.6 million for a particular customer under the
Trading Network, which had filed Chapter 11 bankruptcy.
A significant portion of the Group’s business is on sight letter of credit, usance letter of credit up to a tenor of 120 days, documents
against payment or customers’ letter of credit to suppliers. The balance of the business is on open account terms which are often
covered by customers’ standby letters of credit, bank guarantees, credit insurance or under a back-to-back payment arrangement
with suppliers.
There is no concentration of credit risk with respect to trade receivables, as the Group has a large number of customers
internationally dispersed.
Certain subsidiaries of the Group transferred bills receivable balances amounting to US$31,313,000 (31 December 2015:
US$33,681,000) to banks in exchange for cash as at 30 June 2016. The transactions have been accounted for as collateralized
bank advances.
10 Trade and Bills PayableThe ageing of trade and bills payable based on invoice date is as follows:
Current to 90 Days
91 to 180 Days
181 to 360 Days
Over 360 Days Total
US$’000 US$’000 US$’000 US$’000 US$’000
Balance at 30 June 2016
(unaudited) 2,101,523 30,780 4,128 8,016 2,144,447
Balance at 31 December 2015
(audited) 2,365,315 80,822 2,885 15,763 2,464,785
The fair values of the Group’s trade and bills payable were approximately the same as their carrying values as at 30 June 2016.
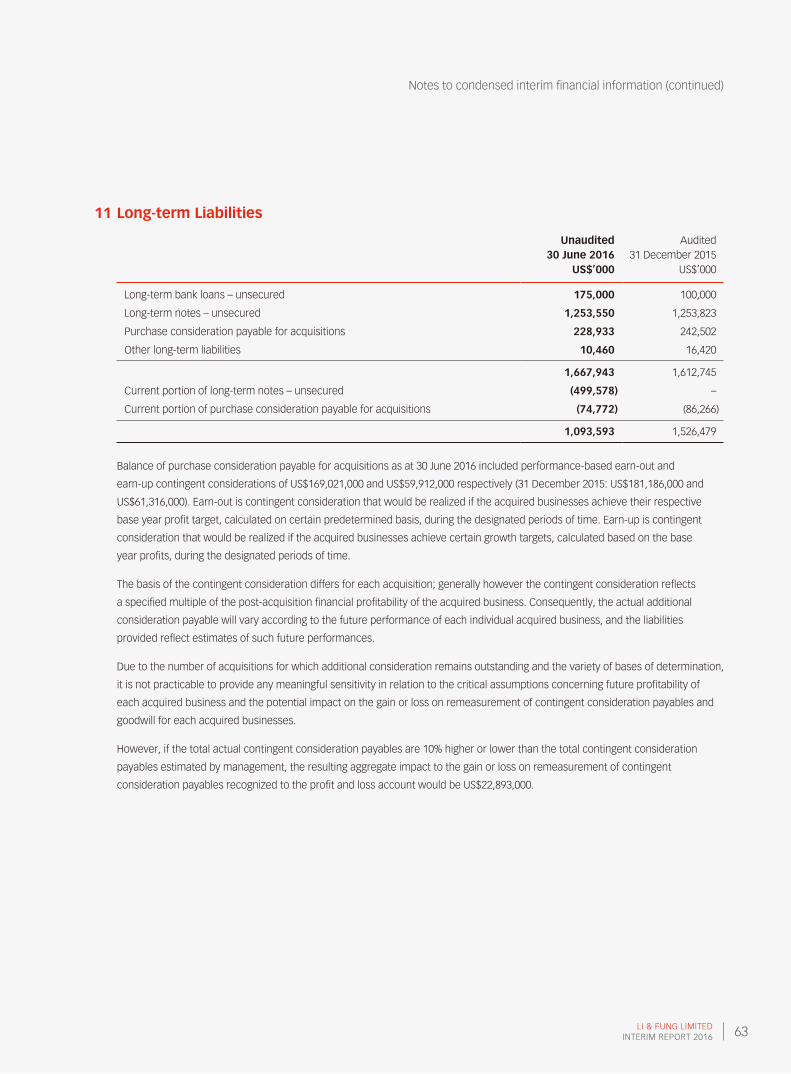
LI & FUNG LIMITEDINTERIM REPORT 2016 63
Notes to condensed interim financial information (continued)
11 Long-term Liabilities
Unaudited 30 June 2016
Audited 31 December 2015
US$’000 US$’000
Long-term bank loans – unsecured 175,000 100,000
Long-term notes – unsecured 1,253,550 1,253,823
Purchase consideration payable for acquisitions 228,933 242,502
Other long-term liabilities 10,460 16,420
1,667,943 1,612,745
Current portion of long-term notes – unsecured (499,578) –
Current portion of purchase consideration payable for acquisitions (74,772) (86,266)
1,093,593 1,526,479
Balance of purchase consideration payable for acquisitions as at 30 June 2016 included performance-based earn-out and
earn-up contingent considerations of US$169,021,000 and US$59,912,000 respectively (31 December 2015: US$181,186,000 and
US$61,316,000). Earn-out is contingent consideration that would be realized if the acquired businesses achieve their respective
base year profit target, calculated on certain predetermined basis, during the designated periods of time. Earn-up is contingent
consideration that would be realized if the acquired businesses achieve certain growth targets, calculated based on the base
year profits, during the designated periods of time.
The basis of the contingent consideration differs for each acquisition; generally however the contingent consideration reflects
a specified multiple of the post-acquisition financial profitability of the acquired business. Consequently, the actual additional
consideration payable will vary according to the future performance of each individual acquired business, and the liabilities
provided reflect estimates of such future performances.
Due to the number of acquisitions for which additional consideration remains outstanding and the variety of bases of determination,
it is not practicable to provide any meaningful sensitivity in relation to the critical assumptions concerning future profitability of
each acquired business and the potential impact on the gain or loss on remeasurement of contingent consideration payables and
goodwill for each acquired businesses.
However, if the total actual contingent consideration payables are 10% higher or lower than the total contingent consideration
payables estimated by management, the resulting aggregate impact to the gain or loss on remeasurement of contingent
consideration payables recognized to the profit and loss account would be US$22,893,000.

LI & FUNG LIMITEDINTERIM REPORT 201664
Notes to condensed interim financial information (continued)
12 Share Capital, Share Options and Award Shares
Number of Shares Equivalent to
(in thousand) HK$’000 US$’000
Authorized
At 1 January 2016, ordinary shares of HK$0.0125 each 12,000,000 150,000 19,231
At 30 June 2016, ordinary shares of HK$0.0125 each 12,000,000 150,000 19,231
Issued and Fully Paid
At 1 January 2016, ordinary shares of HK$0.0125 each 8,415,447 105,193 13,487
At 30 June 2016, ordinary shares of HK$0.0125 each 8,415,447 105,193 13,487
Details of Share Options granted by the Company pursuant to the 2003 Option Scheme and 2014 Option Scheme and outstanding
at 30 June 2016 are as follows:
Grant Date
Exercise Price HK$ Exercisable Period
Number of Share Options
As at 1/1/2016 Granted Lapsed
As at 30/06/2016
22/12/2011 12.121 1/5/2014–30/4/2016 2,000,000 – (2,000,000) –
22/12/2011 12.121 1/5/2015–30/4/2017 2,000,000 – – 2,000,000
22/12/2011 12.121 1/5/2016–30/4/2018 2,000,000 – – 2,000,000
22/12/2011 12.121 1/5/2017–30/4/2019 2,000,000 – – 2,000,000
22/12/2011 12.121 1/5/2018–30/4/2020 2,000,000 – – 2,000,000
22/12/2011 12.121 1/5/2019–30/4/2021 2,000,000 – – 2,000,000
22/12/2011 12.121 1/5/2020–30/4/2022 2,000,000 – – 2,000,000
22/12/2011 12.121 1/5/2021–30/4/2023 2,000,000 – – 2,000,000
21/5/2015 7.49 1/1/2016–31/12/2017 28,274,000 – – 28,274,000
21/5/2015 7.49 1/1/2017–31/12/2018 29,935,000 – – 29,935,000
21/5/2015 7.49 1/1/2018–31/12/2019 30,086,000 – – 30,086,000
16/11/2015 5.81 1/1/2017–31/12/2018 285,000 – – 285,000
16/11/2015 5.81 1/1/2018–31/12/2019 604,000 – – 604,000
19/05/2016 4.27 1/1/2018–31/12/2019 – 604,000 – 604,000
Total 105,184,000 604,000 (2,000,000) 103,788,000
NOTE:(1) Following the spin-off and separate listing of Global Brands, the exercise price applicable to the Share Options outstanding on the record date for the distribution in specie
(i.e. 7 July 2014) was adjusted from HK$14.50 to HK$12.12 with effect from 31 August 2014.
Subsequent to 30 June 2016, no Shares have been allotted and issued under the Share Option Scheme.
The Share Options outstanding at 30 June 2016 had a weighted average remaining contractual life of 2.71 years (31 December 2015:
3.15 years).

LI & FUNG LIMITEDINTERIM REPORT 2016 65
Notes to condensed interim financial information (continued)
12 Share Capital, Share Options and Award Shares (continued)
Details of Award Shares granted by the Company pursuant to the Share Award Scheme and outstanding at 30 June 2016 are
as follows:
Grant Date
Fair Value per Share
HK$ Vesting Date
Number of Award Shares
As at 1/1/2016 Granted
Unvested/ Forfeited
As at 30/06/2016
21/5/2015 7.49 31/12/2016 13,108,100 – (779,300) 12,328,800
21/5/2015 7.49 31/12/2017 20,097,500 – (1,198,100) 18,899,400
21/5/2015 7.49 31/12/2018 13,914,300 – (836,100) 13,078,200
21/5/2015 7.49 31/12/2019 6,994,300 – (419,300) 6,575,000
16/11/2015 5.33 31/12/2016 100,600 – (5,800) 94,800
16/11/2015 5.33 31/12/2017 346,400 – (19,200) 327,200
16/11/2015 5.33 31/12/2018 342,100 – (18,800) 323,300
16/11/2015 5.33 31/12/2019 245,900 – (13,200) 232,700
19/5/2016 4.27 31/12/2016 – 10,400 – 10,400
19/5/2016 4.27 31/12/2017 – 394,500 – 394,500
19/5/2016 4.27 31/12/2018 – 381,700 – 381,700
19/5/2016 4.27 31/12/2019 – 373,400 – 373,400
Total 55,149,200 1,160,000 (3,289,800) 53,019,400
The fair value of the Award Shares was calculated based on the market price of the Company’s shares at the respective grant date.
During the period, a total of 1,160,000 Award Shares were granted. 22,000 Award Shares granted to a connected person were
purchased from open market and 1,138,000 Award Shares granted to non-connected persons were applied from the 3,289,800
Award Shares which had not been vested and/or been forfeited in accordance with the terms of the Share Award Scheme.
13 Perpetual Capital SecuritiesOn 8 November 2012, the Company issued perpetual subordinated capital securities (the “Perpetual Capital Securities”) with an
aggregate principal amount of US$500 million. The Perpetual Capital Securities do not have maturity date and the distribution
payments can be deferred at the discretion of the Company. Therefore, the Perpetual Capital Securities are classified as equity
instruments and recorded in equity in the consolidated balance sheet. The amount as at 30 June 2016 included the accrued
distribution payments net off by the actual distribution to holders during the period. For the period ended 30 June 2016, the accrued
distribution payment was US$3,000,000 (31 December 2015: US$3,000,000) and the actual distribution to holders was US$15,000,000
(31 December 2015: US$30,000,000).
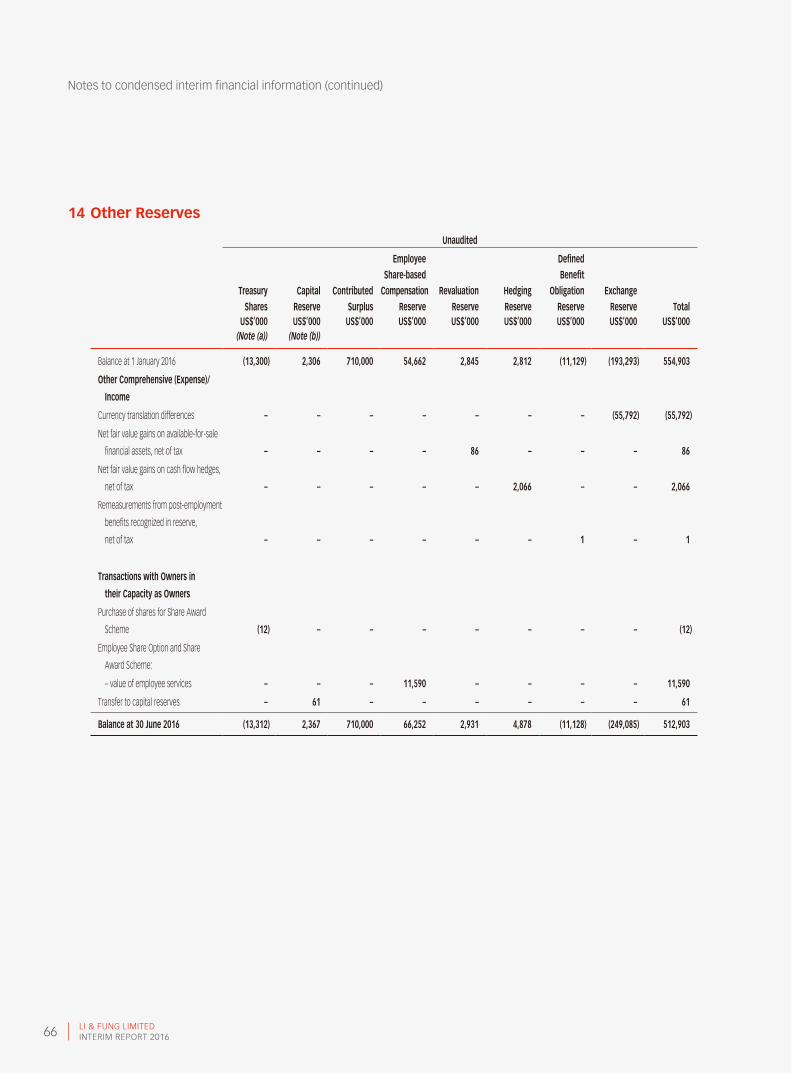
LI & FUNG LIMITEDINTERIM REPORT 201666
Notes to condensed interim financial information (continued)
14 Other Reserves
Unaudited
Treasury Shares
Capital Reserve
Contributed Surplus
Employee Share-based
Compensation Reserve
Revaluation Reserve
Hedging Reserve
Defined Benefit
Obligation Reserve
Exchange Reserve Total
US$’000 US$’000 US$’000 US$’000 US$’000 US$’000 US$’000 US$’000 US$’000(Note (a)) (Note (b))
Balance at 1 January 2016 (13,300) 2,306 710,000 54,662 2,845 2,812 (11,129) (193,293) 554,903
Other Comprehensive (Expense)/
Income
Currency translation differences – – – – – – – (55,792) (55,792)
Net fair value gains on available-for-sale
financial assets, net of tax – – – – 86 – – – 86
Net fair value gains on cash flow hedges,
net of tax – – – – – 2,066 – – 2,066
Remeasurements from post-employment
benefits recognized in reserve,
net of tax – – – – – – 1 – 1
Transactions with Owners in
their Capacity as Owners
Purchase of shares for Share Award
Scheme (12) – – – – – – – (12)
Employee Share Option and Share
Award Scheme:
– value of employee services – – – 11,590 – – – – 11,590
Transfer to capital reserves – 61 – – – – – – 61
Balance at 30 June 2016 (13,312) 2,367 710,000 66,252 2,931 4,878 (11,128) (249,085) 512,903

LI & FUNG LIMITEDINTERIM REPORT 2016 67
Notes to condensed interim financial information (continued)
14 Other Reserves (continued)
Unaudited
Treasury Shares
Capital Reserve
Contributed Surplus
Employee Share-based
Compensation Reserve
Revaluation Reserve
Hedging Reserve
Defined Benefit
Obligation Reserve
Exchange Reserve Total
US$’000 US$’000 US$’000 US$’000 US$’000 US$’000 US$’000 US$’000 US$’000(Note (a)) (Note (b))
Balance at 1 January 2015 (6,739) 3,922 710,000 37,049 2,719 8,889 (11,066) (110,676) 634,098
Other Comprehensive Income/
(Expense)
Currency translation differences – – – – – – – 8,576 8,576
Net fair value gains on available-for-sale
financial assets, net of tax – – – – 76 – – – 76
Net fair value losses on cash flow hedges,
net of tax – – – – – (8,322) – – (8,322)
Remeasurements from post-employment
benefits recognized in reserve,
net of tax – – – – – – 2 – 2
Transactions with Owners in
their Capacity as Owners
Issue of shares for Share Award Scheme (89) – – – – – – – (89)
Purchase of shares for Share
Award Scheme (7,300) – – – – – – – (7,300)
Employee Share Option and Share
Award Scheme:
– value of employee services – – – 4,164 – – – – 4,164
Transfer to capital reserves – 92 – – – – – – 92
Balance at 30 June 2015 (14,128) 4,014 710,000 41,213 2,795 567 (11,064) (102,100) 631,297
Notes:(a) Treasury shares represent the excess shares issued for settlement of consideration for certain prior year acquisitions held by escrow agent and shares issued and
purchased for Share Award Scheme held by the trustee.
(b) Capital reserve represents amount set aside from the profit of certain overseas subsidiaries of the Group in accordance with local statutory requirements.
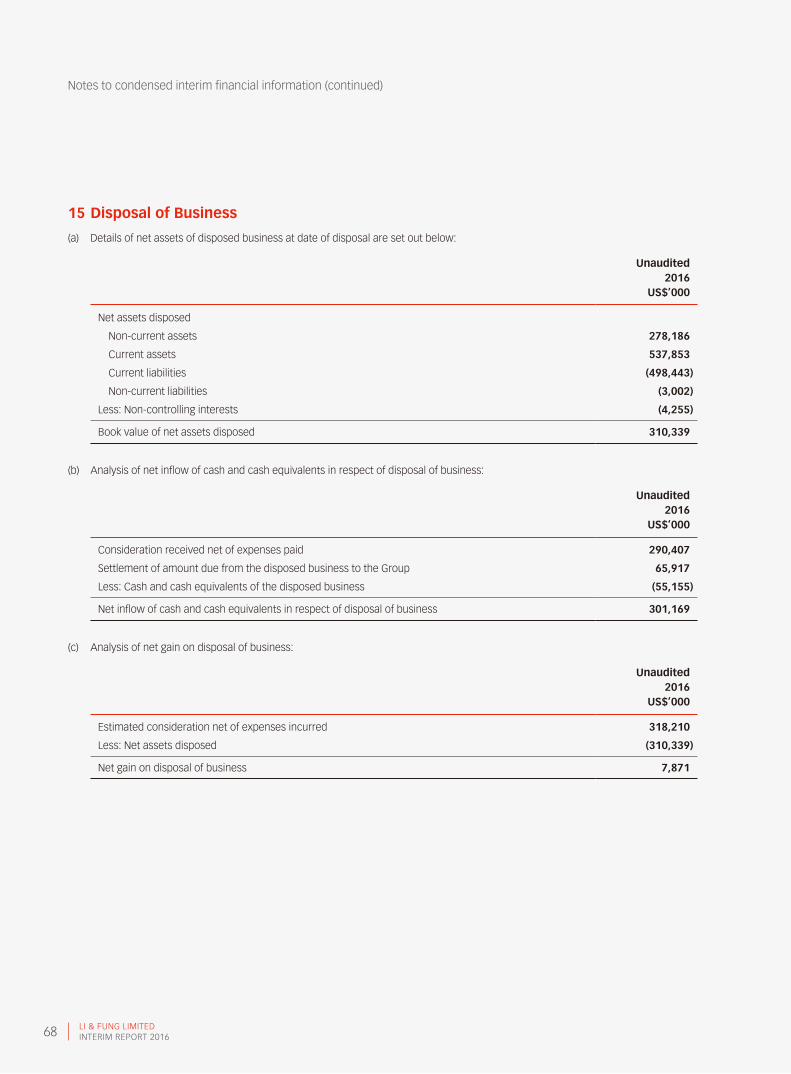
LI & FUNG LIMITEDINTERIM REPORT 201668
Notes to condensed interim financial information (continued)
15 Disposal of Business
(a) Details of net assets of disposed business at date of disposal are set out below:
Unaudited2016
US$’000
Net assets disposed
Non-current assets 278,186
Current assets 537,853
Current liabilities (498,443)
Non-current liabilities (3,002)
Less: Non-controlling interests (4,255)
Book value of net assets disposed 310,339
(b) Analysis of net inflow of cash and cash equivalents in respect of disposal of business:
Unaudited2016
US$’000
Consideration received net of expenses paid 290,407
Settlement of amount due from the disposed business to the Group 65,917
Less: Cash and cash equivalents of the disposed business (55,155)
Net inflow of cash and cash equivalents in respect of disposal of business 301,169
(c) Analysis of net gain on disposal of business:
Unaudited2016
US$’000
Estimated consideration net of expenses incurred 318,210
Less: Net assets disposed (310,339)
Net gain on disposal of business 7,871
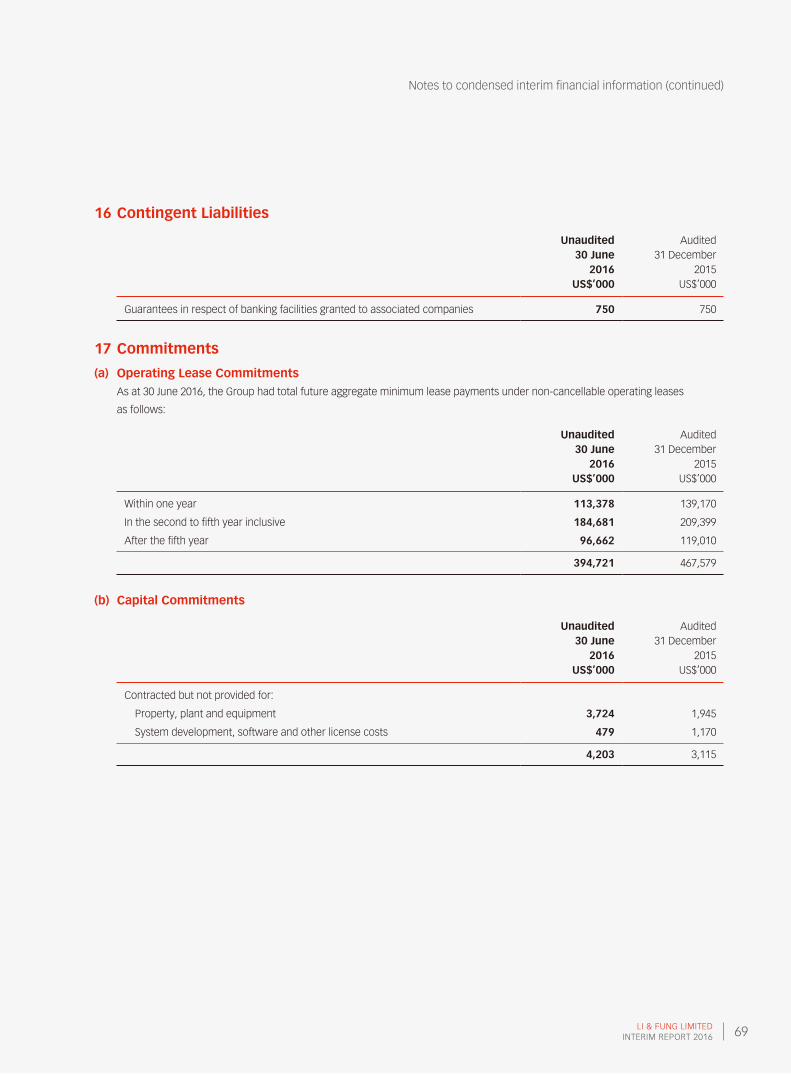
LI & FUNG LIMITEDINTERIM REPORT 2016 69
Notes to condensed interim financial information (continued)
16 Contingent Liabilities
Unaudited 30 June
Audited 31 December
2016 2015US$’000 US$’000
Guarantees in respect of banking facilities granted to associated companies 750 750
17 Commitments
(a) Operating Lease CommitmentsAs at 30 June 2016, the Group had total future aggregate minimum lease payments under non-cancellable operating leases
as follows:
Unaudited 30 June
Audited 31 December
2016 2015US$’000 US$’000
Within one year 113,378 139,170
In the second to fifth year inclusive 184,681 209,399
After the fifth year 96,662 119,010
394,721 467,579
(b) Capital Commitments
Unaudited 30 June
Audited 31 December
2016 2015US$’000 US$’000
Contracted but not provided for:
Property, plant and equipment 3,724 1,945
System development, software and other license costs 479 1,170
4,203 3,115

LI & FUNG LIMITEDINTERIM REPORT 201670
Notes to condensed interim financial information (continued)
18 Charges on AssetsSave as disclosed in Note 8, there were no charges on the Group’s assets as at 30 June 2016 and 31 December 2015.
19 Related Party TransactionsThe Group had the following material transactions with its related parties during the period ended 30 June 2016 and 2015:
Unaudited Six months ended 30 June
2016 2015Note US$’000 US$’000
Distribution and sales of goods (i) 11,124 10,945
Operating leases rental paid (ii) 13,276 12,845
Turnover on buying agency services provided (iii) 628,238 698,277
Rental and license fee paid (iv) 816 1,117
Rental and license fee received (iv) 1,518 1,801
Logistics related services income (v) 7,066 5,527
Notes:(i) Pursuant to the master distribution and sale of goods agreement entered into on 5 December 2014 with FH (1937) for a term of three years ending 31 December 2017,
certain distribution and sales of goods was made on mutually agreed normal commercial terms with FH (1937) and its associates.
(ii) Pursuant to the master agreement for leasing of properties dated 6 December 2013 entered into with FH (1937) for a term of three years ending 31 December 2016,
the Group had rental charge for certain properties leased from FH (1937) and its associates during the period based on mutually agreed normal commercial terms.
(iii) Pursuant to the buying agency agreement entered into with Global Brands Group on 24 June 2014, the Group provided buying agency services to Global Brands Group
and its associates for a term of three years from the listing date of Global Brands Group. For the six months ended 30 June 2016, the Group provided buying agency services
to Global Brands Group with an aggregate turnover of approximately US$628,238,000 (2015: US$698,277,000).
(iv) Pursuant to the master property agreement entered into with Global Brands Group on 24 June 2014, the Group and Global Brands Group had rental and license fee to
and from one another for certain properties and license offices, showroom and warehouse premises on mutually agreed terms from the listing date of Global Brands
Group to 31 December 2016. For the six months ended 30 June 2016, aggregate rental and license fee paid to and from one another approximated to US$2,334,000
(2015: US$2,918,000).
(v) Pursuant to the master agreement for provision of logistics-related services entered into on 20 August 2015, the Group provided certain logistics-related services to
FH (1937) and its associates during the period. The aggregate service income, excluding the passed-through costs for direct freight forwarding, approximated to US$7,066,000
(2015: US$5,527,000).
Save as above, the Group had no material related party transactions during the period.
LI & FUNG LIMITEDINTERIM REPORT 2016 71
Notes to condensed interim financial information (continued)
20 Financial Risk ManagementThe Group’s activities expose it to a variety of financial risks: market risk (including foreign exchange risk, fair value interest rate
risk, cash flow interest rate risk and price risk), credit risk, and liquidity risk. The Group’s overall risk management program focuses
on the unpredictability of financial markets and seeks to minimize potential adverse effects on the Group’s financial performance.
The Group uses derivative financial instruments to hedge certain risk exposures.
(a) Market Risk
(I) FOREIGN EXCHANGE RISK
Most of the Group’s cash balances were deposits in HK$ and US$ with major global financial institutions, and most of the
Group’s borrowings were denominated in US$.
The Group’s revenues and payments were transacted mainly in the same currency, predominantly in US$. Therefore,
it considers there to be no significant risk exposure in relation to foreign exchange rate fluctuations. There are small portions
of sales and purchases transacted in different currencies, for which the Group arranges hedging by means of foreign exchange
forward contracts.
While the Group’s net revenue is substantially in US$, the Group is exposed to currency fluctuation on operating costs
in sourcing countries such as China, Bangladesh, Vietnam, Korea and India to a certain extent. The Group manages such
foreign currency risks through the following measures:
(i) From a short-term perspective, the Group arranges foreign exchange forward contracts for hedging on operating costs
in individual countries as and when appropriate; and
(ii) From a medium-to-long-term perspective, the Group manages the operations in the most cost-effective way possible
within our global network.
The Group in general does not enter into foreign currency hedges in respect of its long-term equity investment. In particular,
the Group’s net equity investments in non-US dollar-denominated on-shore wholesale business under the Trading Network
are subject to unrealized translation gain or loss on consolidation. Fluctuation of relevant currencies against the US dollar will
result in unrealized gain or loss from time to time, which is reflected as movement in exchange reserve in the consolidated
statement of changes in equity.
The Group strictly prohibits any financial derivative arrangement merely for speculation.
LI & FUNG LIMITEDINTERIM REPORT 201672
Notes to condensed interim financial information (continued)
20 Financial Risk Management (continued)
(a) Market Risk (continued)
(II) PRICE RISK
The Group is exposed to price risk because of investments held by the Group and classified on the consolidated balance sheet
as available-for-sale financial assets. The Group maintains these investments for long-term strategic purposes and the Group’s
overall exposure to price risk is not significant.
At 30 June 2016 and up to the date of the Group’s interim financial information, the Group held no material financial derivative
instruments except for certain foreign exchange forward contracts entered into for hedging of foreign exchange risk exposure
on sales and purchases transacted in different currencies ((i) above). At 30 June 2016, fair value of foreign exchange forward
contracts entered into by the Group amounted to US$3,100,000 (31 December 2015: US$4,272,000), which has been reflected
in full in the Group’s consolidated balance sheet as derivative financial instruments assets.
(III) CASH FLOW AND FAIR VALUE INTEREST RATE RISK
As the Group has no significant interest-bearing assets, the Group’s income and operating cash flows are substantially
independent of changes in market interest rates.
The Group’s interest rate risk arises mainly from US dollar denominated bank borrowings and the US dollar denominated
long-term notes issued. Bank borrowings at variable rates expose the Group to cash flow interest rate risk. The Group’s policy
is to maintain a diversified mix of variable and fixed rate borrowings based on prevailing market conditions.

LI & FUNG LIMITEDINTERIM REPORT 2016 73
Notes to condensed interim financial information (continued)
20 Financial Risk Management (continued)
(b) Credit RiskCredit risk mainly arises from trade and other receivables. The Group has stringent policies in place to manage its credit risk with
such receivables, which include but are not limited to the measures set out below:
(i) The Group selects customers in a cautious manner. Its credit control team has implemented a risk assessment system to
evaluate its customers’ financial strengths prior to agreeing on the trade terms with individual customers. It is not uncommon
for the Group to require securities (such as standby or commercial letter of credit, or bank guarantee) from customers who fall
short of the required minimum score under its risk assessment system;
(ii) A significant portion of trade receivable balances are covered by trade credit insurance or factored to external financial
institutions on a non-recourse basis;
(iii) It has in place a system with a dedicated team and tighten policies to ensure on-time recoveries from its trade debtors; and
(iv) It has set up rigid policies internally on provisions made for both inventories and receivables to motivate its business managers
to step up their efforts in these two areas and to avoid any significant impact on their financial performance.
(c) Liquidity RiskPrudent liquidity risk management implies maintaining sufficient cash on hand and the availability of funding through an adequate
amount of committed credit facilities from the Group’s bankers.
Management monitors rolling forecasts of the Group’s liquidity reserve (comprises undrawn borrowing facility and cash and cash
equivalents) on the basis of expected cash flow.
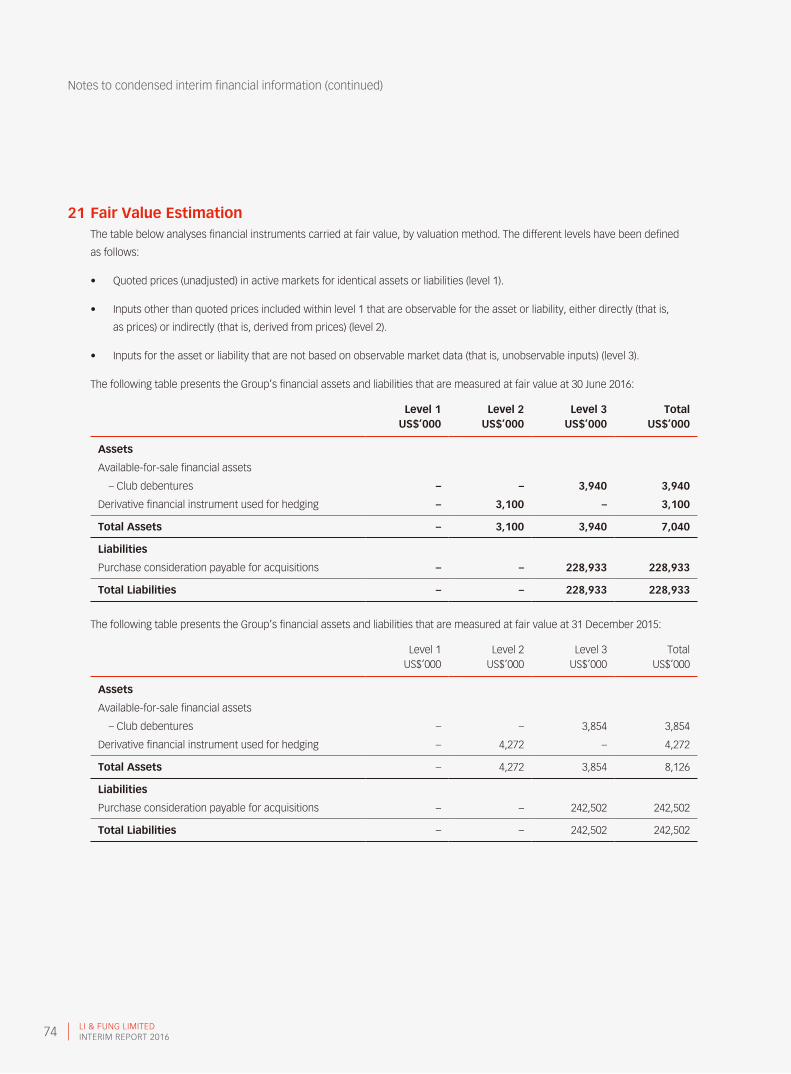
LI & FUNG LIMITEDINTERIM REPORT 201674
Notes to condensed interim financial information (continued)
21 Fair Value EstimationThe table below analyses financial instruments carried at fair value, by valuation method. The different levels have been defined
as follows:
• Quoted prices (unadjusted) in active markets for identical assets or liabilities (level 1).
• Inputs other than quoted prices included within level 1 that are observable for the asset or liability, either directly (that is,
as prices) or indirectly (that is, derived from prices) (level 2).
• Inputs for the asset or liability that are not based on observable market data (that is, unobservable inputs) (level 3).
The following table presents the Group’s financial assets and liabilities that are measured at fair value at 30 June 2016:
Level 1 Level 2 Level 3 TotalUS$’000 US$’000 US$’000 US$’000
Assets
Available-for-sale financial assets
– Club debentures – – 3,940 3,940
Derivative financial instrument used for hedging – 3,100 – 3,100
Total Assets – 3,100 3,940 7,040
Liabilities
Purchase consideration payable for acquisitions – – 228,933 228,933
Total Liabilities – – 228,933 228,933
The following table presents the Group’s financial assets and liabilities that are measured at fair value at 31 December 2015:
Level 1 Level 2 Level 3 TotalUS$’000 US$’000 US$’000 US$’000
Assets
Available-for-sale financial assets
– Club debentures – – 3,854 3,854
Derivative financial instrument used for hedging – 4,272 – 4,272
Total Assets – 4,272 3,854 8,126
Liabilities
Purchase consideration payable for acquisitions – – 242,502 242,502
Total Liabilities – – 242,502 242,502

LI & FUNG LIMITEDINTERIM REPORT 2016 75
Notes to condensed interim financial information (continued)
21 Fair Value Estimation (continued)
The fair values of financial instruments traded in active markets are based on quoted market prices at the balance sheet date.
A market is regarded as active if quoted prices are readily and regularly available from an exchange, dealer, broker, industry group,
pricing service, or regulatory agency, and those prices represent actual and regularly occurring market transactions on an arm’s
length basis. The quoted market price used for financial assets held by the Group is the current bid price. These instruments are
included in level 1.
The fair values of financial instruments that are not traded in an active market (for example, over-the-counter derivatives) are
determined by using valuation techniques. These valuation techniques maximize the use of observable market data where it is
available and rely as little as possible on entity specific estimates. If all significant inputs required to fair value an instrument are
observable, the instrument is included in level 2.
If one or more of the significant inputs is not based on observable market data, the instrument is included in level 3.
Specific valuation techniques used to value financial instruments include:
• Quoted market prices or dealer quotes for similar instruments.
• The fair value of forward foreign exchange contracts is determined using forward exchange rates at the balance sheet date,
with the resulting value discounted back to present value.
• Other techniques, such as discounted cash flow analysis, are used to determine fair value for the remaining financial
instruments.
There were no significant transfer of assets between level 1, level 2 and level 3 fair value hierarchy classifications during the period.
The following summarizes the major methods and assumptions used in estimating the fair values of the significant assets and
liabilities classified as level 2 or 3 and the valuation process for assets and liabilities classified as level 3:
DERIVATIVE FINANCIAL INSTRUMENTS USED FOR HEDGING
The Group relies on bank valuations to determine the fair value of financial assets/liabilities which in turn are determined using
discounted cash flow analysis. These valuations maximize the use of observable market data. Foreign currency exchange prices
are the key observable inputs in the valuation.
PURCHASE CONSIDERATION PAYABLE FOR ACQUISITIONS
The Group recognizes the fair value of those purchase considerations for acquisitions, as of their respective acquisition dates as
part of the consideration transferred in exchange for the acquired businesses. These fair value measurements require, among
other things, significant estimation of post-acquisition performance of the acquired businesses and significant judgment on time
value of money. These calculations use cash flow projections for post-acquisition performance. The discount rate used is based
on the prevailing incremental cost of borrowings of the Group from time to time ranging from 1.0% to 2.5%.
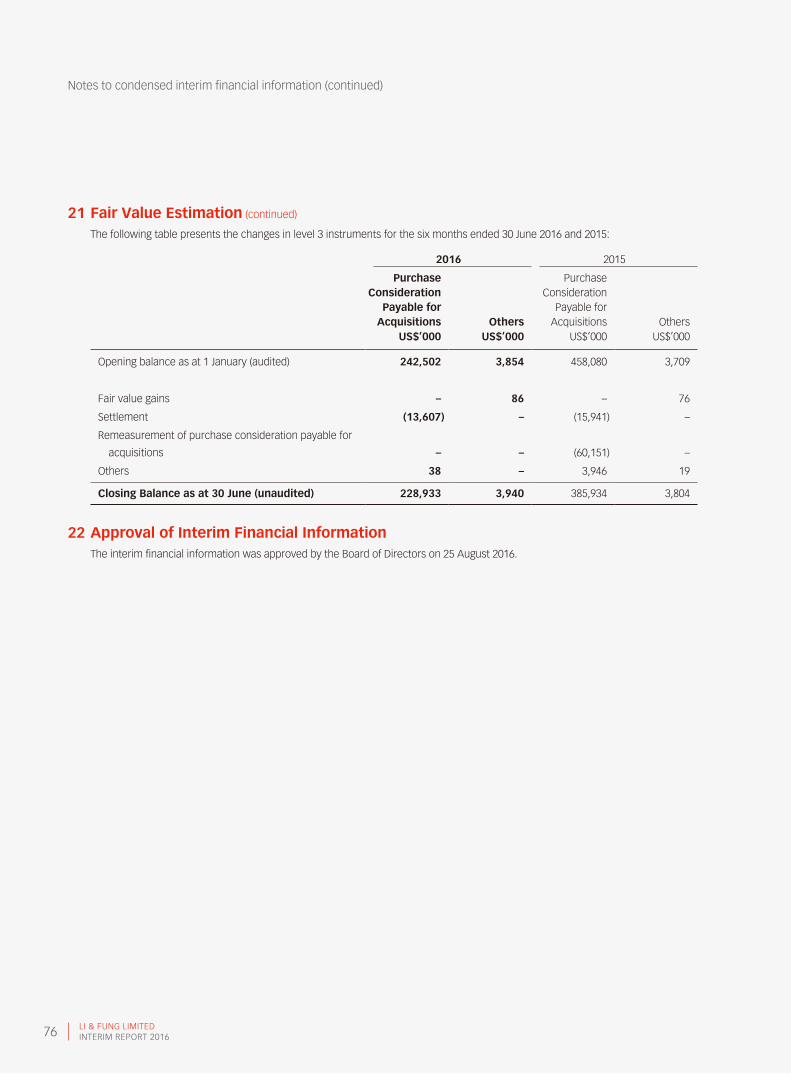
LI & FUNG LIMITEDINTERIM REPORT 201676
Notes to condensed interim financial information (continued)
21 Fair Value Estimation (continued)
The following table presents the changes in level 3 instruments for the six months ended 30 June 2016 and 2015:
2016 2015
Purchase Consideration
Payable for Acquisitions Others
Purchase Consideration
Payable for Acquisitions Others
US$’000 US$’000 US$’000 US$’000
Opening balance as at 1 January (audited) 242,502 3,854 458,080 3,709
Fair value gains – 86 – 76
Settlement (13,607) – (15,941) –
Remeasurement of purchase consideration payable for
acquisitions – – (60,151) –
Others 38 – 3,946 19
Closing Balance as at 30 June (unaudited) 228,933 3,940 385,934 3,804
22 Approval of Interim Financial InformationThe interim financial information was approved by the Board of Directors on 25 August 2016.

LI & FUNG LIMITEDINTERIM REPORT 2016 77
Glossary
In this Report, unless otherwise specified the following glossary applies.
2003 Option Scheme the share option scheme of the Company adopted by the Shareholders at the annual
general meeting of the Company held on 12 May 2003 which expired on 11 May 2013
2014 Option Scheme the share option scheme of the Company adopted by the Shareholders at the annual
general meeting of the Company held on 15 May 2014
associate(s), chief executive(s), connected person(s), substantial shareholder(s)
each has the meaning as described in the Listing Rules
Award Shares the Shares granted under the Share Award Scheme to an eligible person(s) approved
for participation in the Share Award Scheme
Board the board of Directors of the Company
Company, Li & Fung Li & Fung Limited, a company incorporated in Bermuda with limited liability, the shares
of which are listed on the Stock Exchange
Director(s) a director(s) of the Company
FH (1937) Fung Holdings (1937) Limited, a company incorporated in Hong Kong, which is a substantial
shareholder of the Company
Fung Distribution Fung Distribution International Limited, a company incorporated in the British Virgin Islands,
which is a wholly-owned subsidiary of FH (1937)
Global Brands Global Brands Group Holding Limited, a company incorporated in Bermuda with limited
liability, the shares of which are listed on the Stock Exchange
Global Brands Group Global Brands and its subsidiaries
Group the Company and its subsidiaries
HK$ Hong Kong dollar(s), the lawful currency of Hong Kong
Hong Kong the Hong Kong Special Administrative Region of PRC
HSBC Trustee HSBC Trustee (C.I.) Limited, acting in its capacity as the trustee of a trust established for
the benefit of the family members of Victor Fung Kwok King
King Lun King Lun Holdings Limited, a company incorporated in the British Virgin Islands owned 50%
by HSBC Trustee and 50% by William Fung Kwok Lun

LI & FUNG LIMITEDINTERIM REPORT 201678
Glossary (continued)
Listing Rules the Rules Governing the Listing of Securities on the Stock Exchange
Model Code Model Code for Securities Transactions by Directors of Listed Companies under
Appendix 10 of the Listing Rules
PRC the People’s Republic of China
Report the interim report of the Company for the half year ended 30 June 2016
SFO Securities and Futures Ordinance (Chapter 571 of the Laws of Hong Kong)
Share(s) ordinary share(s) of HK$0.0125 each in the share capital of the Company
Shareholder(s) holder(s) of the Share(s)
Share Award Scheme the share award scheme of the Company adopted by the Shareholders at
the annual general meeting of the Company held on 21 May 2015
Share Option(s) the outstanding option(s) granted under the 2003 Option Scheme and/or
2014 Option Scheme
Stock Exchange The Stock Exchange of Hong Kong Limited
US$ United States dollar(s), the lawful currency of the United States of America

LIFUNG TOWER888 Cheung Sha Wan RoadKowloon, Hong KongTel. (852) 2300 2300 www.lifung.com