Company announcement No. Interim financial report quarter 2020

DAMPSKIBSSELSKABET NORDEN A/S, 52, STRANDVEJEN, DK-2900 HELLERUP, DENMARK, WWW.DS-NORDEN.COM, CVR NO. 67758919 1/22
Interim report – first half-year 2011 Announcement no. 30
16 August 2011
Key figures and ratios
(USD million)
Highlights:
Second
quarter
2011
First
half-year
2011
Results in the first half-year were slightly ahead of expectations due to a stronger
than expected performance by the Tanker Department. The Dry Cargo
Department performed in line with expectations. Excluding non-recurring income,
operating earnings (EBITDA) in the second quarter were 8% higher than for the
first quarter of 2011. EBITDA
Group 40 88
EBITDA in Dry Cargo was USD 32 million in the second quarter, whereas EBITDA
in Tankers was USD 12 million.
EBITDA
Dry Cargo
Tankers
32
12
75
19
For the second quarter, NORDEN’s operating earnings (EBITDA) were USD 40
million compared to USD 100 million last year, which included non-recurring
income of USD 41 million. Operating earnings for the first half of the year were
USD 88 million against USD 179 million in the first half-year of 2010.
EBIT For the second quarter, the profit from operations (EBIT) was USD 21 million
(USD 86 million). Profit for the period was USD 10 million (USD 83 million) after
negative fair value adjustments of certain hedging instruments of USD 11 million.
Group
21 51
In the first half-year, NORDEN gained market shares in Dry Cargo with 40%
growth in transported volumes compared to the same period last year. In
comparison, estimated market growth was 5-6% (R.S. Platou), and at the same
time, COAs of 35 million tonnes of forward cargo have been secured.
Theoretical NAV Theoretical Net Asset Value was DKK 246 per share against DKK 275 per share at
the end of first quarter. This development is due to change in the USD/DKK rate
and decreased market value of vessels. DKK per
share
246
Coverage 2011 During the second quarter, the Dry Cargo Department increased coverage for
2011 to 94%, and therefore only has 1,317 open ship days for the rest of the
year. In Tankers, coverage for 2011 remained unchanged from the first quarter. Dry Cargo 94%
Tankers 37%
Outlook 2011 NORDEN maintains its expectations of an EBITDA of USD 135-175 million and an
EBIT of USD 55-95 million.
EBITDA
EBIT
135-175
55-95
President and CEO Carsten Mortensen says in a comment: "I am satisfied that,
despite very tough conditions, we performed a little better in the first half-year
than expected. I am especially pleased with Tankers’ nice contribution to
NORDEN’s bottom line and with the fact that the new strategy is well underway
with the creation of significant and solid growth in cargo volumes in Dry Cargo."
A telephone conference will be held today at 15:30 hours
(CET) where CEO Carsten Mortensen, CFO Michael Tønnes
Jørgensen and Senior Vice President Martin Badsted will
comment on the report. By 15:25 hours (CET) at the latest,
Danish participants should dial +45 3271 4767 while par-
ticipants from abroad should dial +44 (0) 208 817 9301 or
+1 718 354 1226. The telephone conference can be followed
live at www.ds-norden.com where the accompanying
presentation is also available.
Further information:
CEO Carsten Mortensen, tel. +45 3315 0451.
DAMPSKIBSSELSKABET NORDEN A/S, 52, STRANDVEJEN, DK-2900 HELLERUP, DENMARK, WWW.DS-NORDEN.COM, CVR NO. 67758919 2/22
INTERIM REPORT – FIRST HALF-YEAR 2011
Key figures and ratios for the Group
Key figures are in USD ’000 2011
1/1-30/6
2010
1/1-30/6
Change
first half
2010-2011
2010
1/1-31/12
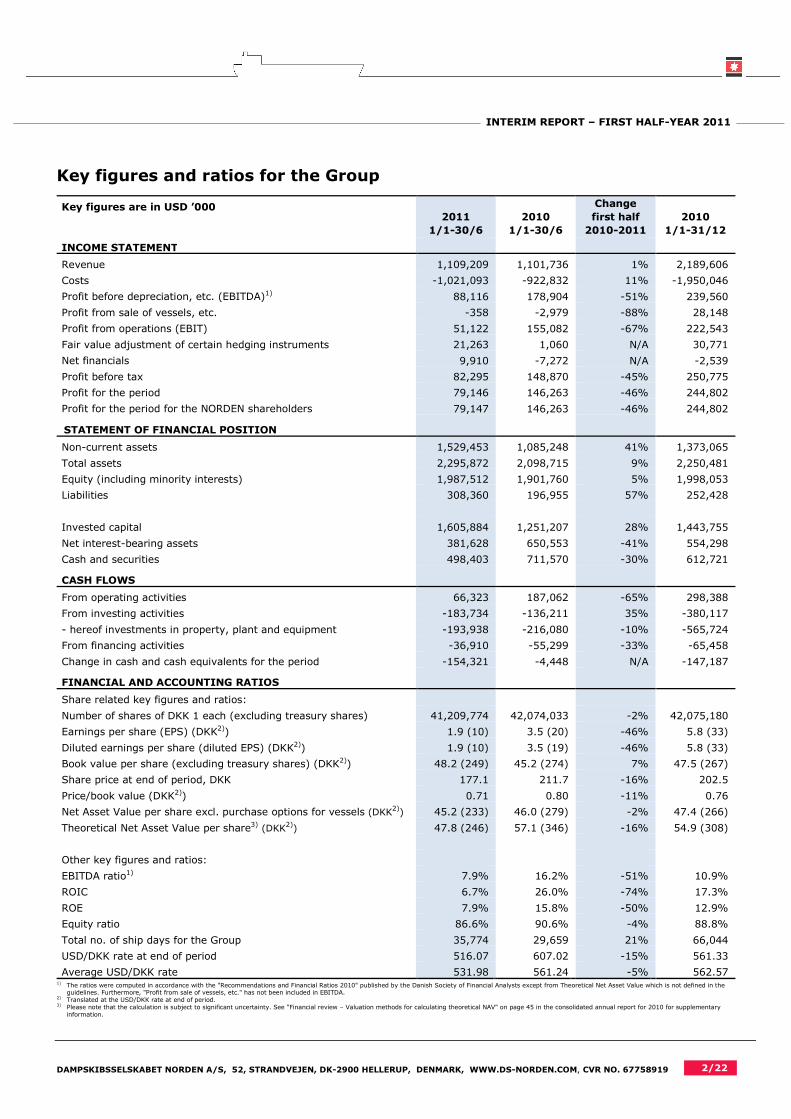
INCOME STATEMENT
Revenue 1,109,209 1,101,736 1% 2,189,606
Costs -1,021,093 -922,832 11% -1,950,046
Profit before depreciation, etc. (EBITDA)1) 88,116 178,904 -51% 239,560
Profit from sale of vessels, etc. -358 -2,979 -88% 28,148
Profit from operations (EBIT) 51,122 155,082 -67% 222,543
Fair value adjustment of certain hedging instruments 21,263 1,060 N/A 30,771
Net financials 9,910 -7,272 N/A -2,539
Profit before tax 82,295 148,870 -45% 250,775
Profit for the period 79,146 146,263 -46% 244,802
Profit for the period for the NORDEN shareholders 79,147 146,263 -46% 244,802
STATEMENT OF FINANCIAL POSITION
Non-current assets 1,529,453 1,085,248 41% 1,373,065
Total assets 2,295,872 2,098,715 9% 2,250,481
Equity (including minority interests) 1,987,512 1,901,760 5% 1,998,053
Liabilities 308,360 196,955 57% 252,428
Invested capital 1,605,884 1,251,207 28% 1,443,755
Net interest-bearing assets 381,628 650,553 -41% 554,298
Cash and securities 498,403 711,570 -30% 612,721
CASH FLOWS
From operating activities 66,323 187,062 -65% 298,388
From investing activities -183,734 -136,211 35% -380,117
- hereof investments in property, plant and equipment -193,938 -216,080 -10% -565,724
From financing activities -36,910 -55,299 -33% -65,458
Change in cash and cash equivalents for the period -154,321 -4,448 N/A -147,187
FINANCIAL AND ACCOUNTING RATIOS
Share related key figures and ratios:
Number of shares of DKK 1 each (excluding treasury shares) 41,209,774 42,074,033 -2% 42,075,180
Earnings per share (EPS) (DKK2)) 1.9 (10) 3.5 (20) -46% 5.8 (33)
Diluted earnings per share (diluted EPS) (DKK2)) 1.9 (10) 3.5 (19) -46% 5.8 (33)
Book value per share (excluding treasury shares) (DKK2)) 48.2 (249) 45.2 (274) 7% 47.5 (267)
Share price at end of period, DKK 177.1 211.7 -16% 202.5
Price/book value (DKK2)) 0.71 0.80 -11% 0.76
Net Asset Value per share excl. purchase options for vessels (DKK2)) 45.2 (233) 46.0 (279) -2% 47.4 (266)
Theoretical Net Asset Value per share3) (DKK2)) 47.8 (246) 57.1 (346) -16% 54.9 (308)
Other key figures and ratios:
EBITDA ratio1) 7.9% 16.2% -51% 10.9%
ROIC 6.7% 26.0% -74% 17.3%
ROE 7.9% 15.8% -50% 12.9%
Equity ratio 86.6% 90.6% -4% 88.8%
Total no. of ship days for the Group 35,774 29,659 21% 66,044
USD/DKK rate at end of period 516.07 607.02 -15% 561.33
Average USD/DKK rate 531.98 561.24 -5% 562.57
USD kurs ultimo 1) The ratios were computed in accordance with the "Recommendations and Financial Ratios 2010" published by the Danish Society of Financial Analysts except from Theoretical Net Asset Value which is not defined in the
guidelines. Furthermore, "Profit from sale of vessels, etc." has not been included in EBITDA. 2) Translated at the USD/DKK rate at end of period. 3) Please note that the calculation is subject to significant uncertainty. See "Financial review – Valuation methods for calculating theoretical NAV" on page 45 in the consolidated annual report for 2010 for supplementary
information.

DAMPSKIBSSELSKABET NORDEN A/S, 52, STRANDVEJEN, DK-2900 HELLERUP, DENMARK, WWW.DS-NORDEN.COM, CVR NO. 67758919 3/22
INTERIM REPORT – FIRST HALF-YEAR 2011
Strategy update
Strategy plan on track
Forward cargo bookings
of 35 million tonnes
According to the 2011-2013 strategy plan Long-term Growth in Challenging Times, NORDEN
aims to grow transported dry cargo volumes by 15% annually on average and increase its
market share with solid, global mining and commodity companies, energy producers,
construction groups, etc. Actual transported volumes in the first-half year grew by 40%
compared to the same period last year, while the dry cargo market is believed to have grown
by 5-6% (source: R.S. Platou), and NORDEN has consequently gained market shares.
NORDEN also strives to grow its contractually secured cargo volumes by 15% p.a. in 2011-
2013 through consistent focus on concluding new COAs. Since the turn of the year, NORDEN
has entered into a number of COAs, securing around 35 million tonnes of cargo vs. the full-
year target of 40 million tonnes. The most significant cargo contracts concluded in the first
half-year is a 5-year COA regarding coal from Indonesia (option South Africa) to India from
2012, a 10-year COA on salt from Chile to the U.S. commencing in 2013 and a 5-year COA
on coal from Svalbard to Northern Europe, where the first shipments took place in July 2011.
Volumes under these 3 contracts amount to more than 20 million tonnes resulting in
approximately 330 Handymax and Panamax shipments.
Close to full year target
of 15% growth in
forward cargo bookings
Tankers beating market
rates
In Tankers, the key strategic priorities for 2011-2013 are to continue beating market rates
and growing the owned product tanker fleet to more than 25 vessels. NORDEN’s daily
earnings in the first half-year were 9-10% above the 1-year T/C rates, while the acquisition
of 1 vessel and contracting of 4 newbuildings resulted in an owned product tanker fleet of 21
vessels, 17 of which on the water.
0
5
10
15
20
25
30
35
40
45
Jan 2011 Apr 2011 Jul 2011 Oct 2011
Million tonnes
Accumulated COA bookings, YTD Accumulated target (+15%)
Development in forward cargo bookings
DAMPSKIBSSELSKABET NORDEN A/S, 52, STRANDVEJEN, DK-2900 HELLERUP, DENMARK, WWW.DS-NORDEN.COM, CVR NO. 67758919 4/22
INTERIM REPORT – FIRST HALF-YEAR 2011
Comments on the development of the Group for the period
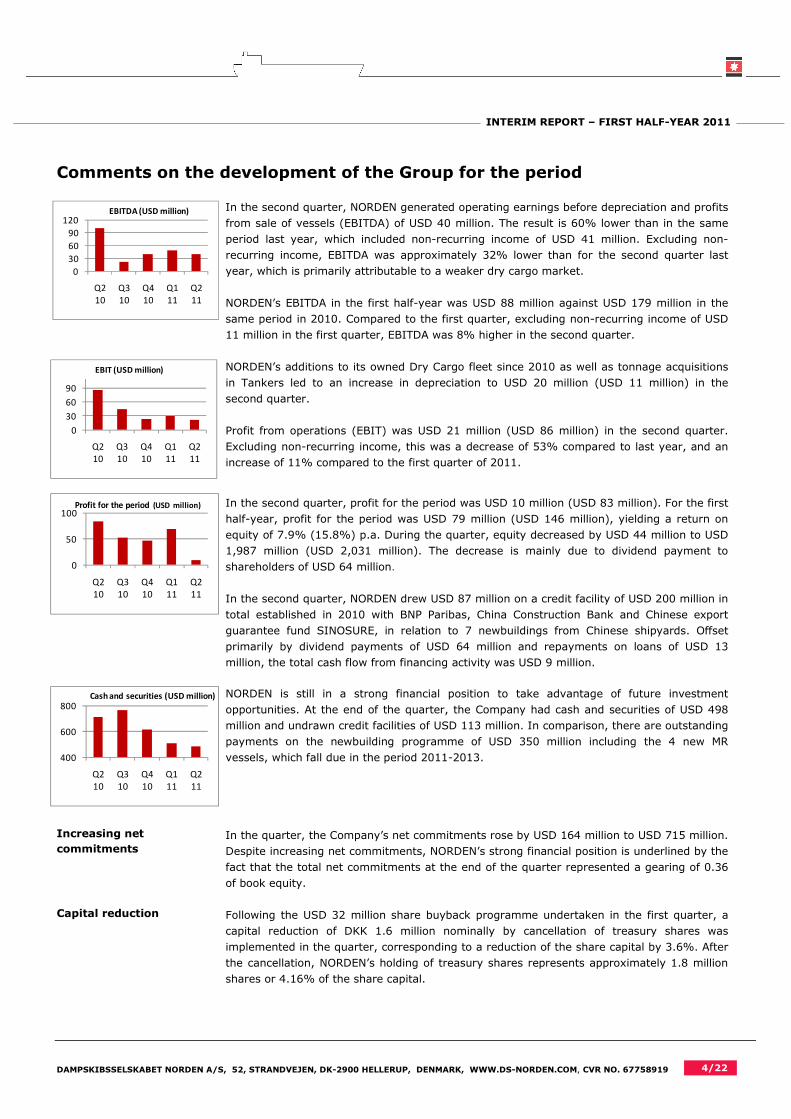
In the second quarter, NORDEN generated operating earnings before depreciation and profits
from sale of vessels (EBITDA) of USD 40 million. The result is 60% lower than in the same
period last year, which included non-recurring income of USD 41 million. Excluding non-
recurring income, EBITDA was approximately 32% lower than for the second quarter last
year, which is primarily attributable to a weaker dry cargo market.
NORDEN’s EBITDA in the first half-year was USD 88 million against USD 179 million in the
same period in 2010. Compared to the first quarter, excluding non-recurring income of USD
11 million in the first quarter, EBITDA was 8% higher in the second quarter.
NORDEN’s additions to its owned Dry Cargo fleet since 2010 as well as tonnage acquisitions
in Tankers led to an increase in depreciation to USD 20 million (USD 11 million) in the
second quarter.
Profit from operations (EBIT) was USD 21 million (USD 86 million) in the second quarter.
Excluding non-recurring income, this was a decrease of 53% compared to last year, and an
increase of 11% compared to the first quarter of 2011.
In the second quarter, profit for the period was USD 10 million (USD 83 million). For the first
half-year, profit for the period was USD 79 million (USD 146 million), yielding a return on
equity of 7.9% (15.8%) p.a. During the quarter, equity decreased by USD 44 million to USD
1,987 million (USD 2,031 million). The decrease is mainly due to dividend payment to
shareholders of USD 64 million.
In the second quarter, NORDEN drew USD 87 million on a credit facility of USD 200 million in
total established in 2010 with BNP Paribas, China Construction Bank and Chinese export
guarantee fund SINOSURE, in relation to 7 newbuildings from Chinese shipyards. Offset
primarily by dividend payments of USD 64 million and repayments on loans of USD 13
million, the total cash flow from financing activity was USD 9 million.
NORDEN is still in a strong financial position to take advantage of future investment
opportunities. At the end of the quarter, the Company had cash and securities of USD 498
million and undrawn credit facilities of USD 113 million. In comparison, there are outstanding
payments on the newbuilding programme of USD 350 million including the 4 new MR
vessels, which fall due in the period 2011-2013.
Increasing net
commitments
In the quarter, the Company’s net commitments rose by USD 164 million to USD 715 million.
Despite increasing net commitments, NORDEN’s strong financial position is underlined by the
fact that the total net commitments at the end of the quarter represented a gearing of 0.36
of book equity.
Capital reduction Following the USD 32 million share buyback programme undertaken in the first quarter, a
capital reduction of DKK 1.6 million nominally by cancellation of treasury shares was
implemented in the quarter, corresponding to a reduction of the share capital by 3.6%. After
the cancellation, NORDEN’s holding of treasury shares represents approximately 1.8 million
shares or 4.16% of the share capital.
0
30
60
90
Q2
10
Q3
10
Q4
10
Q1
11
Q2
11
EBIT (USD million)
0
30
60
90
120
Q2
10
Q3
10
Q4
10
Q1
11
Q2
11
EBITDA (USD million)
400
600
800
Q2
10
Q3
10
Q4
10
Q1
11
Q2
11
Cash and securities (USD million)
0
50
100
Q2
10
Q3
10
Q4
10
Q1
11
Q2
11
Profit for the period (USD million)

DAMPSKIBSSELSKABET NORDEN A/S, 52, STRANDVEJEN, DK-2900 HELLERUP, DENMARK, WWW.DS-NORDEN.COM, CVR NO. 67758919 5/22
INTERIM REPORT – FIRST HALF-YEAR 2011
Continued growth in
NORDEN’s active core
fleet
NORDEN’s total active fleet increased by 3 vessels during the quarter driven by an increase
in the core fleet of 8 vessels. The short-term chartered fleet, on the other hand, decreased
by 5 vessels. As a consequence, the total active fleet amounts to 210 vessels at the end of
the second quarter. Moreover, the order book consisted of 40 vessels at the end of the
period, of which 35 are for delivery to the core fleet (see note 8 to the financial statements
for an overview of deliveries to the core fleet).
The active Dry Cargo fleet increased by 1 vessel during the second quarter, totaling 171
units at the end of the quarter. The core fleet increased by 7 units during the quarter as
NORDEN took delivery of 3 owned Handysize vessels and 4 chartered vessels with purchase
option. During the quarter, the Tanker Department took delivery of 1 owned MR vessel,
increasing the core fleet to 26 vessels. The total active fleet in Tankers at the end of the
quarter amounted to 39 units.
Net Asset Value of DKK
233 per share
Theoretical Net Asset
Value of DKK 246 per
share
Based on assessments from 3 independent brokers, the market value of NORDEN’s owned
vessels and newbuildings (including vessels in joint ventures and vessels held for sale) was
estimated at USD 1,697 million at the end of the quarter. The value of owned vessels fell by
4% during the quarter, driven by a 6% drop in the value of NORDEN’s Dry Cargo vessels,
whereas the value of the Company’s Tanker vessels increased by 1%. The theoretical value
of NORDEN’s charter parties with purchase and extension option is estimated at USD 107
million at the end of the half-year, compared to USD 201 million at the end of the first
quarter. This is mainly driven by a drop in T/C rates in the major vessel types.
NORDEN’s total theoretical NAV is calculated at DKK 246 per share at the end of the second
quarter against DKK 275 per share at the end of the first quarter, corresponding to a
decrease of 11%. The decrease is due to a combination of a 2% lower USD/DKK exchange
rate and a lower value of the owned fleet and purchase options as a result of the weaker T/C
market.
The theoretical NAV is composed of book equity of DKK 249 per share, added value of owned
vessels and newbuildings based on estimates from 3 independent brokers of DKK -16 per
share, as well as the value of NORDEN’s 63 charter parties with purchase and extension
option of DKK 13 per share.
The value of the theoretical NAV is sensitive to changes in freight rates and vessels prices. In
a sensitivity analysis of +/- 10% in freight rates and vessel prices, the theoretical NAV
changes to DKK 290 and DKK 203 per share corresponding to a percentage-wise change of
+/- 18%.
No indication of
impairment
At the end of the second quarter, the net selling price of NORDEN’s fleet, excluding 2 vessels
in joint venture and vessels held for sale, was USD 126 million below the carrying amounts
and costs. This difference is divided between Dry Cargo and Tankers with USD -120 million
and USD -6 million, respectively. Consequently, an impairment test was carried out, and
based on this, there was no indication of impairment and thus no need for write-downs (see
note 1 "Significant accounting policies” in the consolidated annual report for 2010 for
additional information).
100
140
180
220
Q2
10
Q3
10
Q4
10
Q1
11
Q2
11
Active fleet
Dry Cargo Tankers
200
250
300
Q2
10
Q3
10
Q4
10
Q1
11
Q2
11
Net Asset Value per share (DKK)
200
250
300
350
Q2
10
Q3
10
Q4
10
Q1
11
Q2
11
Theoretical Net Asset Value per
share (DKK)

DAMPSKIBSSELSKABET NORDEN A/S, 52, STRANDVEJEN, DK-2900 HELLERUP, DENMARK, WWW.DS-NORDEN.COM, CVR NO. 67758919 6/22
INTERIM REPORT – FIRST HALF-YEAR 2011
Segment information
Second quarter 2011 Second quarter 2010
USD ’000
Dry Cargo
Tankers
Not
allocated
Total
Dry Cargo
Tankers
Not
allocated
Total
Revenue – services rendered 458,516 102,637 0 561,153 525,946 59,539 0 585,485
Voyage costs -185,142 -48,269 0 -233,411 -113,010 -20,552 0 -133,562
Contribution margin I 273,374 54,368 0 327,742 412,936 38,987 0 451,923
Other operating income, net 1,038 47 0 1,085 1,154 37 43 1,234
Vessel operating costs -233,399 -41,078 0 -274,477 -305,064 -36,855 0 -341,919
Costs -9,405 -1,625 -3,039 -14,069 -8,075 -1,303 -2,293 -11,671
Profit before depreciation,
etc. (EBITDA)
31,608
11,712
-3,039
40,281
100,951
866
-2,250
99,567
Profit from sale of vessels, etc. 19 -1 0 18 -2,218 0 0 -2,218
Depreciation and impairment -10,421 -8,263 -891 -19,575 -4,455 -5,730 -674 -10,859
Share of results of
joint ventures
-17
408
0
391
-18
-12
0
-30
Profit from operations
(EBIT)
21,189
3,856
-3,930
21,115
94,260
-4,876
-2,924
86,460
Fair value adjustment of
certain hedging instruments
-11,429
0
0
-11,429
1,947
0
0
1,947
Financial income 0 0 4,222 4,222 0 0 1,560 1,560
Financial costs 0 0 -2,367 -2,367 0 0 -5,288 -5,288
Tax for the period -1,369 -176 -1 -1,546 -1,109 -224 0 -1,333
Profit for the period 8,391 3,680 -2,076 9,995 95,098 -5,100 -6,652 83,346
First half-year 2011 First half-year 2010
USD ’000
Dry Cargo
Tankers
Not
allocated
Total
Dry Cargo
Tankers
Not
allocated
Total
Revenue – services rendered 940,543 168,666 0 1,109,209 983,396 118,340 0 1,101,736
Voyage costs -358,312 -62,780 0 -421,092 -239,326 -41,666 0 -280,992
Contribution margin I 582,231 105,886 0 688,117 744,070 76,674 0 820,744
Other operating income, net 2,227 88 0 2,315 1,722 84 43 1,849
Vessel operating costs -490,564 -84,097 0 -574,661 -547,567 -71,665 0 -619,232
Costs -18,455 -3,222 -5,978 -27,655 -16,354 -2,774 -5,329 -24,457
Profit before depreciation,
etc. (EBITDA)
75,439
18,655
-5,978
88,116
181,871
2,319
5,286
178,904
Profit from sale of vessels, etc. 79 -450 13 -358 -2,978 -3 2 -2,979
Depreciation and impairment -19,565 -15,532 -1,556 -36,653 -9,231 -10,169 -1,345 -20,745
Share of results of
joint ventures
-41
58
0
17
-53
-45
0
-98
Profit from operations
(EBIT)
55,912
2,731
-7,521
51,122
169,609
-7,898
-6,629
155,082
Fair value adjustment of
certain hedging instruments
21,263
0
0
21,263
1,060
0
0
1,060
Financial income 0 0 13,464 13,464 0 0 2,945 2,945
Financal costs 0 0 -3,554 -3,554 0 0 -10,217 -10,217
Tax for the period -2,680 -358 -111 -3,149 -2,174 -433 0 -2,607
Profit for the period 74,495 2,373 2,278 79,146 168,495 -8,331 -13,901 146,263

DAMPSKIBSSELSKABET NORDEN A/S, 52, STRANDVEJEN, DK-2900 HELLERUP, DENMARK, WWW.DS-NORDEN.COM, CVR NO. 67758919 7/22
INTERIM REPORT – FIRST HALF-YEAR 2011
First half-year 2011 First half-year 2010
USD ’000
Dry Cargo
Tankers
Not
allocated
Total
Dry Cargo
Tankers
Not
allocated
Total
Vessels 669,294 471,533 0 1,140,827 220,613 363,702 0 584,315
Prepayments on vessels and
newbuildings
239,416
59,221
0
298,637
364,498
47,919
0
412,417
Other tangible assets 1,436 0 54,078 55,514 1,627 0 55,219 56,846
Investments in joint ventures 31,264 3,211 0 34,475 27,174 4,496 0 31,670
Non-current assets 941,410 533,965 54,078 1,529,453 613,912 416,117 55,219 1,085,248
Current assets 227,262 40,754 498,403 766,419 279,142 22,755 711,570 1,013,467
- hereof tangible assets
held for sale
0
0
0
0
142,926
0
0
142,926
Total assets 1,168,672 574,719 552,481 2,295,872 893,054 438,872 766,789 2,098,715
DAMPSKIBSSELSKABET NORDEN A/S, 52, STRANDVEJEN, DK-2900 HELLERUP, DENMARK, WWW.DS-NORDEN.COM, CVR NO. 67758919 8/22
INTERIM REPORT – FIRST HALF-YEAR 2011
Dry Cargo
Earnings in line with
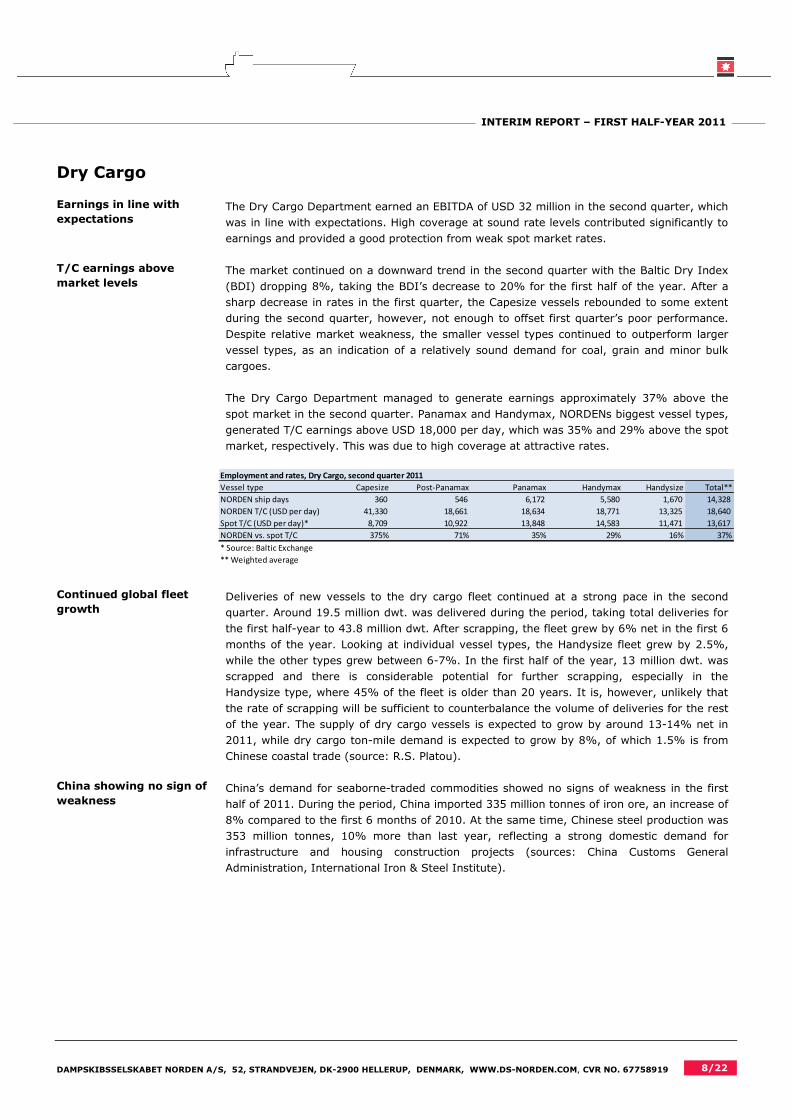
expectations The Dry Cargo Department earned an EBITDA of USD 32 million in the second quarter, which
was in line with expectations. High coverage at sound rate levels contributed significantly to
earnings and provided a good protection from weak spot market rates.
T/C earnings above
market levels The market continued on a downward trend in the second quarter with the Baltic Dry Index
(BDI) dropping 8%, taking the BDI’s decrease to 20% for the first half of the year. After a
sharp decrease in rates in the first quarter, the Capesize vessels rebounded to some extent
during the second quarter, however, not enough to offset first quarter’s poor performance.
Despite relative market weakness, the smaller vessel types continued to outperform larger
vessel types, as an indication of a relatively sound demand for coal, grain and minor bulk
cargoes.
The Dry Cargo Department managed to generate earnings approximately 37% above the
spot market in the second quarter. Panamax and Handymax, NORDENs biggest vessel types,
generated T/C earnings above USD 18,000 per day, which was 35% and 29% above the spot
market, respectively. This was due to high coverage at attractive rates.
Continued global fleet
growth Deliveries of new vessels to the dry cargo fleet continued at a strong pace in the second
quarter. Around 19.5 million dwt. was delivered during the period, taking total deliveries for
the first half-year to 43.8 million dwt. After scrapping, the fleet grew by 6% net in the first 6
months of the year. Looking at individual vessel types, the Handysize fleet grew by 2.5%,
while the other types grew between 6-7%. In the first half of the year, 13 million dwt. was
scrapped and there is considerable potential for further scrapping, especially in the
Handysize type, where 45% of the fleet is older than 20 years. It is, however, unlikely that
the rate of scrapping will be sufficient to counterbalance the volume of deliveries for the rest
of the year. The supply of dry cargo vessels is expected to grow by around 13-14% net in
2011, while dry cargo ton-mile demand is expected to grow by 8%, of which 1.5% is from
Chinese coastal trade (source: R.S. Platou).
China showing no sign of
weakness China’s demand for seaborne-traded commodities showed no signs of weakness in the first
half of 2011. During the period, China imported 335 million tonnes of iron ore, an increase of
8% compared to the first 6 months of 2010. At the same time, Chinese steel production was
353 million tonnes, 10% more than last year, reflecting a strong domestic demand for
infrastructure and housing construction projects (sources: China Customs General
Administration, International Iron & Steel Institute).
Employment and rates, Dry Cargo, second quarter 2011
Vessel type Capesize Post-Panamax Panamax Handymax Handysize Total**
NORDEN ship days 360 546 6,172 5,580 1,670 14,328
NORDEN T/C (USD per day) 41,330 18,661 18,634 18,771 13,325 18,640
Spot T/C (USD per day)* 8,709 10,922 13,848 14,583 11,471 13,617
NORDEN vs. spot T/C 375% 71% 35% 29% 16% 37%
* Source: Baltic Exchange
** Weighted average

DAMPSKIBSSELSKABET NORDEN A/S, 52, STRANDVEJEN, DK-2900 HELLERUP, DENMARK, WWW.DS-NORDEN.COM, CVR NO. 67758919 9/22
INTERIM REPORT – FIRST HALF-YEAR 2011
Capacity and coverage The Dry Cargo Department’s coverage for the rest of 2011 is at 94% and 50% for 2012,
both at sound rate levels. Until 2013, average costs of the known fleet will decrease to
approximately USD 10,500 per day, whereas average known earnings for 2011-2013 will be
on a level of approximately USD 18,000 per day.
NORDEN's Dry Cargo fleet and values at 30 June 2011
Vessel type Capesize Post-Panamax Panamax Handymax Handysize Total
Vessels in operation
Owned vessels 3 4 3 3 6 19
Chartered vessels with purchase option 1 2 11 17 7 38
Total active core fleet 4 6 14 20 13 57
Chartered vessels without purchase option 0 0 55 47 12 114
Total active fleet 4 6 69 67 25 171
Vessels to be delivered
Newbuildings (owned) 0 0 2 2 A 11 15
Chartered vessels with purchase option 0 2 6 3 3 14
Total for delivery to core fleet 0 2 8 5 14 29
Chartered vessels over 3 years without
purchase option 0 0 1 0 2 3
Total to be delivered 0 2 9 5 16 32
Total gross fleet 4 8 78 72 41 203
A) 2 units in 50%-owned joint venture
Dry Cargo fleet values at 30 June 2011 (USD million)
Market value of owned vessels and
newbuildings* 143 154 162 122 456 1,037
Added value of owned vessels and
newbuildings 43 -49 -22 1 -93 -120
Value of charter parties with purchase and
extension option 9 -30 38 91 3 111
* Active vessels and newbuildings including joint ventures, assets held for sale and charterparties, if any.
Capacity and coverage, Dry Cargo, at 30 June 2011
2011 2012 2013 2014+ 2011 2012 2013 2014+
Gross capacity
Capesize 736 1,464 1,460 12,008 8,775 8,775 8,775 6,897
Post-Panamax 1,268 2,762 2,920 34,819 10,650 11,350 11,770 9,191
Panamax 7,236 6,522 5,836 45,554 14,247 12,162 11,638 10,420
Handymax 7,512 10,971 8,903 41,180 14,318 12,811 11,723 8,443
Handysize 3,968 10,089 11,010 123,929 9,974 9,190 8,861 5,349
Total 20,721 31,808 30,129 257,490 13,040 11,217 10,522 7,333
Coverage
Capesize 800 732 553 0 34,558 45,872 45,528 0
Post-Panamax 668 0 0 0 19,326 0 0 0
Panamax 9,302 7,680 4,562 12,191 18,521 17,960 17,942 19,395
Handymax 6,627 5,343 2,511 5,070 15,975 20,300 15,252 14,634
Handysize 2,006 2,171 1,701 9,509 11,654 12,447 13,449 13,354
Total 19,403 15,926 9,327 26,770 17,631 19,276 18,034 16,347
Coverage in %
Capesize 109% 50% 38% 0%
Post-Panamax 53% 0% 0% 0%
Panamax 129% 118% 78% 27%
Handymax 88% 49% 28% 12%
Handysize 51% 22% 15% 8%
Total 94% 50% 31% 10%
Costs for gross capacity (USD per day)
Revenue from coverage (USD per day)
Ship days
Ship days

DAMPSKIBSSELSKABET NORDEN A/S, 52, STRANDVEJEN, DK-2900 HELLERUP, DENMARK, WWW.DS-NORDEN.COM, CVR NO. 67758919 10/22
INTERIM REPORT – FIRST HALF-YEAR 2011
Tankers
Results better than
expected
In the second quarter, the Tanker Department earned an EBITDA of USD 12 million, which
was better than expected. This was primarily due to higher spot earnings as the fleet was well
positioned to take advantage of the temporary improvement in the Atlantic market in the
period.
In the second quarter, NORDEN’s MR vessels earned USD 15,992 on average per day, which
was 14% higher than the 1-year time charter market. In Handysize, NORDEN generated USD
13,883 per day, or 3% higher than the benchmark (source: ACM).
Declining demand for oil
during the quarter
In the second quarter, the product tanker market was mainly driven by strong exports from
the U.S. Gulf and strong demand in South America and Africa. In addition, demand was driven
by trading activity in a tight oil market due to high oil prices and a tighter refinery market
after the earthquake in Japan and the war in Libya.
The International Energy Agency (IEA) estimates that oil demand decreased by 0.9 million
barrels per day or 1% in the second quarter compared to the first quarter of 2011. Despite
persistently high oil prices and slower demand in the quarter, IEA expects oil demand to
increase for the remainder of the year, reaching an average demand of 89.5 million barrels
per day for 2011 – a growth rate of 1.4% compared to 2010. Growth is expected to be limited
to non-OECD countries. China’s demand in particular is expected to grow by 6.9%, accounting
for 30% of global demand growth in the period. On the other hand, after a solid start to the
year, North American oil demand is starting to show signs of slowdown due to high oil prices
and slowing economic activity. Preliminary data indicate that oil demand in North America in
May fell by 2.6% year-on-year and is forecasted to drop by 0.9% in the full year 2011
compared to 2010 (source: IEA, July 2011).
Moderate changes in the
global fleet
Global fleet growth in NORDEN’s vessel types – Handysize and MR – continued at a moderate
pace in the second quarter, growing by 1%. The Handysize fleet grew by 0.3%, while the MR
fleet grew by 1.9%. As a result of low contracting activity, the order book for 2012 and
onwards was practically unchanged, further supporting the slowdown in vessel supply (source:
SSY).
4 newbuilding contracts In the second quarter, NORDEN took over 4 product tanker newbuilding contracts with
expected delivery in the first and second quarters of 2013 from the Korean yard STX Offshore
& Shipbuilding Co. Ltd. The 4 new MR vessels will be equipped with technology which will
improve STX’s already efficient vessel design and is expected to improve fuel efficiency by
more than 15% and reduce CO2 emissions correspondingly. Compared to average modern
standard MR designs, improvements amount to approximately 25%.
Employment and rates, Tankers, second quarter 2011
Vessel type MR Handysize Total**
NORDEN ship days 1,788 1,623 3,411
NORDEN T/C (USD per day) 15,992 13,883 14,989
1-year T/C (USD per day)* 14,000 13,500 13,762
NORDEN vs. 1-year T/C 14% 3% 9%
* Source: ACM
** Weighted average

DAMPSKIBSSELSKABET NORDEN A/S, 52, STRANDVEJEN, DK-2900 HELLERUP, DENMARK, WWW.DS-NORDEN.COM, CVR NO. 67758919 11/22
INTERIM REPORT – FIRST HALF-YEAR 2011
Capacity and coverage
At the end of the second quarter, NORDEN had covered 37% of the ship days for the rest of
2011. Until 2013, average costs of the known fleet will decrease to approximately USD 10,200
per day, whereas average known earnings for 2011-2013 will amount to approximately USD
13,000 per day.
NORDEN's Tanker fleet and values at 30 June 2011
Vessel type MR Handysize Total
Vessels in operation
Owned vessels 5 11 16
Chartered vessels with purchase option 10 0 10
Total active core fleet 15 11 26
Chartered vessels without purchase option 3 10 13
Total active fleet 18 21 39
Vessels to be delivered
Newbuildings (owned) 5 0 5
Chartered vessels with purchase option 1 0 1
Total for delivery to core fleet 6 0 6
Chartered vessels over 3 years without
purchase option 2 0 2
Total to be delivered 8 0 8
Total gross fleet 26 21 47
Tanker fleet values at 30 June 2011 (USD million)
Market value of owned vessels and
newbuildings* 351 309 660
Added value of owned vessels and
newbuildings -11 5 -6
Value of charter parties with purchase
and extension option -4 0 -4
* Active vessels and newbuildings including joint ventures, assets held for sale and charterparties, if any
Capacity and coverage, Tankers, at 30 June 2011
2011 2012 2013 2014+ 2011 2012 2013 2014+
Gross capacity
MR 3,870 6,993 7,714 72,768 13,113 12,584 11,766 8,248
Handysize 3,417 4,718 4,015 54,231 9,023 7,778 7,088 7,088
Total 7,287 11,711 11,729 126,999 11,195 10,648 10,164 7,752
Coverage
MR 1,116 744 333 0 14,648 13,422 13,041 0
Handysize 1,561 492 0 0 11,878 12,537 0 0
Total 2,677 1,236 333 0 13,033 13,069 13,041 0
Coverage in %
MR 29% 11% 4% 0%
Handysize 46% 10% 0% 0%
Total 37% 11% 3% 0%
Ship days
Ship days
Costs for gross capacity (USD per day)
Revenue from coverage (USD per day)

DAMPSKIBSSELSKABET NORDEN A/S, 52, STRANDVEJEN, DK-2900 HELLERUP, DENMARK, WWW.DS-NORDEN.COM, CVR NO. 67758919 12/22
INTERIM REPORT – FIRST HALF-YEAR 2011
Expectations for 2011
NORDEN maintains its
expectations
Expectations for the profit for the year remain unchanged. Like stated in previous reports,
2011 is expected to be marked by low freight rates in dry cargo, whereas rates in tankers
are expected to be higher on average than in the 2 previous years. Keeping these market
expectations in mind, NORDEN continues to be well positioned for the rest of 2011 with high
coverage in Dry Cargo and free capacity in Tankers.
Expectations for the full
year
Expectations for 2011
USD million
Dry Cargo Tankers Total
EBITDA 125-155 20-30 135-175
Realised profit from sale of vessels 0
EBIT 55-95
CAPEX 260-300
No sale of vessels The expectations do not include profit from sale of vessels. The Company assesses the
market on an ongoing basis for opportunities for purchase and sale of vessels, based on
price, timing, adjustment of capacity and optimisation of fleet and order book.
Risks and uncertainties Expectations for earnings on open ship days are based on current forward rates in Dry
Cargo. In Tankers, expectations are based on previously announced budget rates of USD
13,500 and USD 14,000 per day for Handysize and MR, respectively, which are higher than
current, seasonally low spot rates. Based on 6,000 open ship days, a change of USD 1,000
per day in both Dry Cargo and Tankers would mean a change in earnings of approximately
USD 6 million. Given the high coverage in Dry Cargo, sensitivity to changes in the market
level primarily comes from the Tanker segment. In the Dry Cargo segment, sensitivity in the
expectations mainly relates to shifting in the rate difference between fronthaul and backhaul
and between Panamax and Handysize.
Forward-looking statements
This report includes forward-looking statements reflecting management's current perception of future trends and financial
performance. The statements for the rest of 2011 and the years to come naturally carry some uncertainty, and NORDEN's actual
results may therefore differ from the expectations. Factors that may cause the results achieved to differ from the expectations are,
among other things, but not exclusively, changes in the macroeconomic and political conditions – especially in the Company's key
markets – changes in NORDEN's assumptions of rate development and operating costs, volatility in rates and vessel prices,
changes in legislation, possible interruptions in traffic and operations as a result of external events, etc.

DAMPSKIBSSELSKABET NORDEN A/S, 52, STRANDVEJEN, DK-2900 HELLERUP, DENMARK, WWW.DS-NORDEN.COM, CVR NO. 67758919 13/22
INTERIM REPORT – FIRST HALF-YEAR 2011
INTERIM REPORT FOR THE FIRST HALF-YEAR OF 2011 - THE GROUP
Statement
The Board of Directors and the Board of Management today reviewed and approved the interim report for the first half-year of 2011 of
Dampskibsselskabet NORDEN A/S.
The interim report is prepared in accordance with the International Financial Reporting Standard IAS 34 on interim reports and the
general Danish financial disclosure requirements for listed companies. In line with previous policies, the interim report is not audited
or auditor-reviewed.
We consider the accounting policies applied to be appropriate and the accounting estimates made to be adequate. Furthermore, we
find the overall presentation of the interim report to present a true and fair view.
Besides what has been disclosed in the interim report, no other significant changes in the Company's risk and uncertainties have
occurred relative to what was disclosed in the consolidated annual report for 2010.
In our opinion, the interim report gives a true and fair view of the assets and liabilities of the Group, the financial position as well as
the result of the Group's activities and cash flows for the interim period.
Furthermore, the management's review gives a true and fair account of the Group's activities and financial position as well as a
description of the material risks and uncertainties which the Group is facing.
Hellerup, 16 August 2011
Board of Management
Carsten Mortensen Michael Tønnes Jørgensen
President & CEO Executive Vice President & CFO
Board of Directors
Mogens Hugo Alison J. F. Riegels
Chairman Vice Chairman
Erling Højsgaard Karsten Knudsen
Arvid Grundekjøn Bent Torry Sørensen
Lars Enkegaard Biilmann Benn Pyrmont Johansen

DAMPSKIBSSELSKABET NORDEN A/S, 52, STRANDVEJEN, DK-2900 HELLERUP, DENMARK, WWW.DS-NORDEN.COM, CVR NO. 67758919 14/22
INTERIM REPORT – FIRST HALF-YEAR 2011
Income statement
USD ’000 2011 2010 2011 2010 2010
First
half-year
First
half-year
Second
quarter
Second
quarter 31/12
Revenue 1,109,209 1,101,736 561,153 585,485 2,189,606
Costs -1,021,093 -922,832 -520,872 -485,918 -1,950,046
Profit before depreciation, etc. (EBITDA) 88,116 178,904 40,281 99,567 239,560
Profit from sale of vessels, etc. -358 -2,979 18 -2,218 28,148
Depreciation and impairment -36,653 -20,745 -19,575 -10,859 -49,537
Share of results of joint ventures 17 -98 391 -30 4,372
Profit from operations (EBIT) 51,122 155,082 21,115 86,460 222,543
Fair value adjustment of certain hedging instruments note 2) 21,263 1,060 -11,429 1,947 30,771
Net financials 9,910 -7,272 1,855 -3,728 -2,539
Profit before tax 82,295 148,870 11,541 84,679 250,775
Tax on the profit for the period -3,149 -2,607 -1,546 -1,333 -5,973
Profit for the period 79,146 146,263 9,995 83,346 244,802
Attributable to:
Shareholders of NORDEN 79,147 146,263 9,996 83,346 244,804
Minority interests -1 0 -1 0 -2
Total 79,146 146,263 9,995 83,346 244,802
Earnings per share (EPS), USD 1.9 3.5 0.2 2.0 5.8
Diluted earnings per share, USD 1.9 3.5 0.2 2.0 5.8
Statement of comprehensive income
Profit for the period, after tax 79,146 146,263 9,995 83,346 244,802
Value adjustment of hedging instruments -9,212 866 -1,948 1,239 4,339
Fair value adjustment of securities 12,853 250 11,877 -901 429
Income and expenses recognised directly in equity 3,641 1,116 9,929 338 4,768
Comprehensive income for the period, after tax 82,787 147,379 19,924 83,684 249,570
Attributable to:
Shareholders of NORDEN 82,788 147,379 19,925 83,684 249,572
Minority interests -1 0 -1 0 -2
Total 82,787 147,379 19,924 83,684 249,570

DAMPSKIBSSELSKABET NORDEN A/S, 52, STRANDVEJEN, DK-2900 HELLERUP, DENMARK, WWW.DS-NORDEN.COM, CVR NO. 67758919 15/22
INTERIM REPORT – FIRST HALF-YEAR 2011
Income statement by quarter
USD ’000 2011 2011 2010 2010 2010
Second
quarter
First
quarter
Fourth
quarter
Third
quarter
Second
quarter
Revenue 561,153 548,056 591,755 496,115 585,485
Costs -520,872 -500,221 -552,950 -474,264 -485,918
Profit before depreciation, etc. (EBITDA) 40,281 47,835 38,805 21,851 99,567
Profit from sale of vessels, etc. 18 -376 -543 31,670 -2,218
Depreciation and impairment -19,575 -17,078 -15,623 -13,169 -10,859
Share of results of joint ventures 391 -374 -104 4,574 -30
Profit from operations (EBIT) 21,115 30,007 22,535 44,926 86,460
Fair value adjustment of certain hedging instruments note 2) -11,429 32,692 25,329 4,382 1,947
Net financials 1,855 8,055 -354 5,087 -3,728
Profit before tax 11,541 70,754 47,510 54,395 84,679
Tax on the profit for the period -1,546 -1,603 -1,307 -2,059 -1,333
Profit for the period 9,995 69,151 46,203 52,336 83,346
Attributable to:
Shareholders of NORDEN 9,996 69,151 46,204 52,337 83,346
Minority interests -1 0 -1 -1 0
Total 9,995 69,151 46,203 52,336 83,346
Earnings per share (EPS), USD 0.2 1.7 1.1 1.3 2.0
Diluted earnings per share, USD 0.2 1.7 1.1 1.3 2.0
Statement of comprehensive income by quarter
Profit for the period, after tax 9,995 69,151 46,203 52,336 83,346
Value adjustment of hedging instruments -1,948 -7,264 240 3,233 1,239
Fair value adjustment of securities 11,877 976 -731 910 -901
Income and expenses recognised directly in equity 9,929 -6,288 -491 4,143 338
Comprehensive income for the period, after tax 19,924 62,863 45,712 56,479 83,684
Attributable to:
Shareholders of NORDEN 19,925 62,863 45,713 56,480 83,684
Minority interests -1 0 -1 -1 0
Total 19,924 62,863 45,712 56,479 83,684

DAMPSKIBSSELSKABET NORDEN A/S, 52, STRANDVEJEN, DK-2900 HELLERUP, DENMARK, WWW.DS-NORDEN.COM, CVR NO. 67758919 16/22
INTERIM REPORT – FIRST HALF-YEAR 2011
Statement of financial position
USD ’000 2011 2010 2010
30/6 30/6 31/12
ASSETS
Property and equipment 55,514 56,846 55,626
Vessels note 3) 1,140,827 584,315 880,330
Prepayments on vessels and newbuildings note 4) 298,637 412,417 401,884
Investments in joint ventures 34,475 31,670 35,225
Non-current assets 1,529,453 1,085,248 1,373,065
Inventories 71,839 23,027 45,861
Receivables and prepayments 196,177 135,944 182,731
Receivables from joint ventures 0 0 726
Securities 76,867 23,844 38,150
Cash and cash equivalents 421,536 687,726 574,571
766,419 870,541 842,039
Tangible assets held for sale note 5) 0 142,926 35,377
Current assets 766,419 1,013,467 877,416
Total assets 2,295,872 2,098,715 2,250,481
EQUITY AND LIABILITIES
Share capital 6,833 7,087 7,087
Reserves 10,645 3,352 7,004
Retained earnings 1,969,967 1,891,251 1,983,894
Equity (NORDEN's shareholders) 1,987,445 1,901,690 1,997,985
Minority interests 67 70 68
Equity 1,987,512 1,901,760 1,998,053
Bank debt 78,097 30,000 14,666
Non-current liabilities 78,097 30,000 14,666
Current portion of non-current debt within 1 year 38,678 31,017 43,757
Trade payables 102,095 40,792 90,068
Liabilities with joint ventures 37,940 5,341 35,896
Other payables and deferred income 51,550 27,105 60,717
230,263 104,255 230,438
Liabilities relating to tangible assets held for sale 0 62,700 7,324
Current liabilities 230,263 166,955 237,762
Liabilities 308,360 196,955 252,428
Total equity and liabilities 2,295,872 2,098,715 2,250,481

DAMPSKIBSSELSKABET NORDEN A/S, 52, STRANDVEJEN, DK-2900 HELLERUP, DENMARK, WWW.DS-NORDEN.COM, CVR NO. 67758919 17/22
INTERIM REPORT – FIRST HALF-YEAR 2011
Statement of cash flows
USD ’000 2011 2010 2011 2010 2010
First
half-year
First
half-year
Second
quarter
Second
quarter 31/12
Profit for the period 79,146 146,263 9,995 83,346 244,802
Reversal of items with no effect on cash 15,651 24,926 36,599 16,135 -20,396
Cash flows before change in working capital 94,797 171,189 46,594 99,481 224,406
Change in working capital -28,474 15,873 21,728 57,466 73,982
Cash flows from operating activities 66,323 187,062 68,322 156,947 298,388
Investments in vessels, etc. -53,657 -130,548 -24,002 -95,956 -398,658
Additions in prepayments on newbuildings -140,308 -138,531 -70,817 -73,309 -264,343
Additions in prepayments received on sold vessels 0 24,275 0 15,650 -31,101
Held in restricted accounts 0 8,300 0 16,800 8,300
Acquisition of securities -29,631 0 -29,631 0 -14,207
Sale of securities 4,815 1,000 4,815 1,000 970
Proceeds from sale of vessels, etc, 35,047 99,293 47 64,463 318,922
Cash flows from investing activities -183,734 -136,211 -119,588 -71,352 -380,117
Dividend paid to shareholders -63,706 -52,705 -63,706 -52,705 -52,705
Acquisition of treasury shares -31,556 0 -867 0 -7,566
Instalments on/payment of non-current debt -28,423 -2,594 -13,230 0 -5,187
Raising of non-current debt 86,775 0 86,775 0 0
Cash flows from financing activities -36,910 -55,299 8,972 -52,705 -65,458
Change in cash and cash equivalents
for the period -154,321 -4,448 -42,294 32,890 -147,187
Cash and cash equivalents at beginning of period 574,571 702,584 469,945 658,953 702,584
Exchange rate adjustments 1,286 -10,410 -6,115 -4,117 19,174
Change in cash and cash equivalents for the period -154,321 -4,448 -42,294 32,890 -147,187
Cash and cash equivalents at end of period 421,536 687,726 421,536 687,726 574,571
Restricted cash and cash equivalents 0 0 0 0 0
Cash and cash equivalents according to the
statement of financial position 421,536 687,726 421,536 687,726 574,571

DAMPSKIBSSELSKABET NORDEN A/S, 52, STRANDVEJEN, DK-2900 HELLERUP, DENMARK, WWW.DS-NORDEN.COM, CVR NO. 67758919 18/22
INTERIM REPORT – FIRST HALF-YEAR 2011
Statement of changes in equity
USD ’000 Share
capital
Reserves Retained
earnings
Equity
(NORDEN's
shareholders)
Minority
interests
Group
equity
Equity at 1 January 2011 7,087 7,004 1,983,894 1,997,985 68 1,998,053
Total comprehensive income for the period 0 3,641 79,147 82,788 -1 82,787
Acquisition of treasury shares 0 0 -31,556 -31,556 0 -31,556
Distributed dividends 0 0 -68,946 -68,946 0 -68,946
Dividends, treasury shares 0 0 5,240 5,240 0 5,240
Capital reduction -254 0 254 0 0 0
Share-based payment 0 0 1,934 1,934 0 1,934
Changes in equity -254 3,641 -13,927 -10,540 -1 -10,541
Equity at 30 June 2011
6,833
10,645
1,969,967
1,987,445
67
1,987,512
Equity at 1 January 2010 7,087 2,236 1,795,620 1,804,943 70 1,805,013
Total comprehensive income for the period 0 1,116 146,263 147,379 0 147,379
Distributed dividends 0 0 -55,621 -55,621 0 -55,621
Dividends, treasury shares 0 0 2,916 2,916 0 2,916
Share-based payment 0 0 2,073 2,073 0 2,073
Changes in equity 0 1,116 95,631 96,747 0 96,747
Equity at 30 June 2010
7,087
3,352
1,891,251
1,901,690
70
1,901,760
Equity at 1 January 2010 7,087 2,236 1,795,620 1,804,943 70 1,805,013
Total comprehensive income for the period 0 4,768 244,804 249,572 -2 249,570
Acquisition of treasury shares 0 0 -7,566 -7,566 0 -7,566
Distributed dividends 0 0 -55,621 -55,621 0 -55,621
Dividends, treasury shares 0 0 2,916 2,916 0 2,916
Share-based payment 0 0 3,741 3,741 0 3,741
Changes in equity 0 4,768 188,274 193,042 -2 193,040
Equity at 31 December 2010
7,087
7,004
1,983,894
1,997,985
68
1,998,053

DAMPSKIBSSELSKABET NORDEN A/S, 52, STRANDVEJEN, DK-2900 HELLERUP, DENMARK, WWW.DS-NORDEN.COM, CVR NO. 67758919 19/22
INTERIM REPORT – FIRST HALF-YEAR 2011
Notes to the financial statements
1. Significant accounting policies Basis of accounting
The interim report comprises the summarised consolidated financial statements of Dampskibsselskabet NORDEN A/S.
Accounting policies
The interim report has been prepared in accordance with the International Financial Reporting Standard IAS 34 on interim reports and
additional Danish disclosure requirements for the financial statements of listed companies.
The consolidated annual report for 2010 has been prepared in accordance with the International Financial Reporting Standards (IFRS).
Accounting policies have not changed in relation to this.
For a complete description of accounting policies, see also pages 55-63 in the consolidated annual report for 2010.
New IAS/IFRSs
With effect from 1 January 2011, NORDEN has not implemented any new financial reporting standards or interpretations which are of
importance to NORDEN.
New financial reporting standards
For a description of the IFRS and IFRIC which become effective on 1 January 2011 or later, see page 55 of the consolidated annual
report for 2010. In addition to these, the following new or amended standards have been issued.
• IFRS 10 ”Consolidated Financial Statement”
• IFRS 11 ”Joint arrangements”
• IFRS 12 ”Disclosures of Interests in Other Entities”
• IFRS 13 ”Fair value measurement”
• IAS 27 on Separate Financial Statements
• IAS 28 on Investments in Associates and Joint Ventures
• IAS 19 on Employee Benefits, including pension
• IAS 1 on Presentation of Items of Other Comprehensive Income
The standards have yet to be adopted by the EU. NORDEN will assess the effect of the changes on the financial statements, but has at
the time of writing not completed this assessment.
Significant choices and assessments in the accounting policies and significant accounting estimates
Management's choices and assessments in the accounting policies in respect of vessel leases, recognition of revenue and voyage
costs, impairment test and onerous contracts are significant. Management's accounting estimates of receivables, contingent assets
and liabilities and useful lives and residual values of tangible assets are also significant. For a description of these, see pages 56-57 of
the consolidated annual report for 2010.

DAMPSKIBSSELSKABET NORDEN A/S, 52, STRANDVEJEN, DK-2900 HELLERUP, DENMARK, WWW.DS-NORDEN.COM, CVR NO. 67758919 20/22
INTERIM REPORT – FIRST HALF-YEAR 2011
2. Fair value adjustment of certain hedging instruments
USD ’000 2011 2010 2011 2010 2010
First
half-year
First
half-year
Second
quarter
Second
quarter 31/12
Bunker hedging:
Fair value adjustment for:
2010 0 -7,090 0 -4,616 -4,290
2011 28,281 -3,711 -471 -2,879 4,609
2012 7,495 -1,174 812 -1,339 2,144
2013 1,187 -183 164 -206 343
2014 338 -129 22 -144 158
37,301 -12,287 527 -9,184 2,964
Realised fair value adjustment reclassified to
"Vessel operating costs"*
-19,897
-3,243
-13,183
-1,373
-5,138
Total 17,404 -15,530 -12,656 -10,557 -2,174
Forward Freight Agreements:
Fair value adjustment for:
2010 0 3,086 0 7,037 764
2011 38,580 881 7,170 -1,985 15,149
2012 1,775 0 1,351 0 1,282
2013 104 0 104 0 0
40,459 3,967 8,625 5,052 17,195
Realised fair value adjustment reclassified to
"Revenue"*
-36,600
12,623
-7,398
7,452
15,750
Total 3,859 16,590 1,227 12,504 32,945
Total 21,263 1,060 -11,429 1,947 30,771
* As the hedging instruments are realised, the accumulated fair value adjustments are reclassified to operations in the same item as
the hedged transaction. For further information, see the section "Significant accounting policies" in the consolidated annual report
for 2010.

DAMPSKIBSSELSKABET NORDEN A/S, 52, STRANDVEJEN, DK-2900 HELLERUP, DENMARK, WWW.DS-NORDEN.COM, CVR NO. 67758919 21/22
INTERIM REPORT – FIRST HALF-YEAR 2011
3. Vessels
USD ’000 2011 2010 2010
30/6 30/6 31/12
Cost at 1 January 979,509 569,023 569,023
Transferred during the period from prepayments on vessels and newbuildings 243,412 113,557 249,902
Transferred during the period to tangible assets held for sale 0 -97,463 -134,448
Additions for the period 51,980 74,960 298,399
Disposals for the period 0 -3,088 -3,367
Cost 1,274,901 656,989 979,509
Depreciation at 1 January -99,179 -71,410 -71,410
Depreciation for the period -34,895 -19,190 -46,379
Reversed depreciation of disposed vessels 0 3,088 3,366
Reversed depreciation of tangible assets held for sale 0 14,838 15,244
Depreciation -134,074 -72,674 -99,179
Carrying amount 1,140,827 584,315 880,330
For the development of the fleet and added value, see the interim review.
4. Prepayments on vessels and newbuildings
USD ’000 2011 2010 2010
30/6 30/6 31/12
Cost at 1 January 401,884 442,526 442,526
Additions for the period 140,308 138,531 264,343
Disposals for the period 0 0 -87
Transferred during the period to vessels -243,412 -113,557 -242,982
Transferred during the period to other items -143 -87 -6,920
Transferred during the period to tangible assets held for sale 0 -54,996 -54,996
Carrying amount 298,637 412,417 401,884
5. Tangible assets held for sale
USD ’000 2011 2010 2010
30/6 30/6 31/12
Carrying amount at 1 January 35,377 54,547 54,547
Additions for the period from prepayments on vessels and newbuildings 0 54,996 54,996
Additions for the period to tangible assets held for sale 12 52,999 97,277
Additions for the period from vessels 0 82,625 119,203
Disposals for the period -35,389 -102,241 -290,646
Carrying amount 0 142,926 35,377
6. Related party transactions
No significant changes have occurred to closely related parties or types and scale of transactions with these parties other than those
disclosed in the consolidated annual report for 2010.

DAMPSKIBSSELSKABET NORDEN A/S, 52, STRANDVEJEN, DK-2900 HELLERUP, DENMARK, WWW.DS-NORDEN.COM, CVR NO. 67758919 22/22
INTERIM REPORT – FIRST HALF-YEAR 2011
7. Contingent assets and liabilities
Since the end of the first quarter 2011, no significant changes have occurred to contingent assets and liabilities other than those
referred to in this interim report.
8. Overview of deliveries to the core fleet and fleet values
9. Significant events after the balance sheet date
Between the end of the quarter and the publication of this interim report, other than the developments disclosed in the interim
review, no significant events have occurred which have not been recognised and adequately disclosed and which materially affect the
profit for the period or the statement of financial position.
Expected delivery of the NORDEN's core fleet at 30 June 2011
Total
Q3 Q4 Q1 Q2 Q3 Q4 Q1 Q2 Q3 Q4 Q1 Q2 Q3 Q4
Dry Cargo
Post-Panamax (1) (1) 2
Panamax 2 (1) (1) (2) (2) 8
Handymax 1 (1) 1 (1) (1) 5
Handysize 1 6 (1) 2 (1) 1 1 (1) 14
Tankers
MR 1 (1) 3 1 6
Handysize 0
Total 5 8 1 3 3 3 4 2 0 1 1 2 2 0 35
20142012
Note: Figures in brackets are deliveries of chartered vessels with purchase option, whereas deliveries from the
Company's newbuilding program are stated without brackets. Totals have been calculated for the core fleet as a whole.
2013
Fleet values (before tax) at 30 June 2011
Dry Cargo Number
Carrying
amount/
cost
Market
value* Added value Number
Charter
party
Purchase and
extension
option
Value of
charter party
and purchase
option
Capesize 3 100 143 43 1 0 9 9
Post-Panamax 4 203 154 -49 4 -49 19 -30
Panamax 5 184 162 -22 17 -11 49 38
Handymax 5 121 122 1 20 43 48 91
Handysize 17 549 456 -93 10 -2 5 3
Tankers
MR 10 362 351 -11 11 -10 6 -4
Handysize 11 304 309 5 0 0 0 0
Total 55 1,823 1,697 -126 63 -29 136 107
Net Asset Value at 30 June 2011 USD million DKK per share
Equity excl. minority interests per share 1,987 249
Added value own fleet -126 -16
Net Asset Value 1,861 233
Calculated value of charter parties with purchase
and extension option 107 13
Total theoretical NAV 1,968 246
Note: * Including joint ventures, assets held for sale and charter party, if any.
Calculated value of charter parties with purchase
and extension optionUSD million Owned (active and newbuildings)