INTERIM FINANCIAL STATEMENTS FOR THE SECOND QUARTER …
38
P P K K O O B B A A N N K K P P O O L L S S K K I I S S P P Ó Ó Ł Ł K K A A A A K K C C Y Y J J N N A A INTERIM FINANCIAL STATEMENTS FOR THE SECOND QUARTER OF 2008 Prepared in accordance with International Financial Reporting Standards
Transcript of INTERIM FINANCIAL STATEMENTS FOR THE SECOND QUARTER …

PPKKOO BBAANNKK PPOOLLSSKKIISSPPÓÓŁŁKKAA AAKKCCYYJJNNAA
INTERIM FINANCIAL STATEMENTSFOR THE SECOND QUARTER OF 2008
Prepared in accordance withInternational Financial Reporting Standards

Translation of Interim Financial Statements of the PKO BP SA Group for the 2nd quarter of 2008The Polish language original should be referred to in matters of interpretation
2
CONTENTS
1. KEY FINANCIAL INDICATORS .......................................................................................................... 3
2. ABBREVIATED FINANCIAL STATEMENTS .....................................................................................5
2.1 ABBREVIATED FINANCIAL STATEMENTS OF THE PKO BP SA GROUP ..................................52.2 ABBREVIATED FINANCIAL STATEMENTS OF PKO BP SA ...................................................... 14
3. COMMENTARY ON THE ABBREVIATED FINANCIAL STATEMENTS .........................................19
3.1 FINANCIAL RESULTS .................................................................................................................... 193.1.1. - The PKO BP SA Group .....................................................................................................193.1.2. - PKO BP SA........................................................................................................................20
3.2 BUSINESS DEVELOPMENT .......................................................................................................... 223.2.1. Segmentation of the activities of the PKO BP SA Group ....................................................223.2.2. Retail segment .....................................................................................................................253.2.2.1 Activities of PKO BP SA in the retail segment .................................................................253.2.2.2 Activities of the PKO BP SA Group’s entities in the retail segment...........................273.2.3 Corporate segment ..............................................................................................................283.2.3.1 Activities of PKO BP SA in the corporate segment.......................................................... 283.2.3.2 Activities of the PKO BP SA Group entities in the corporate segment ............................293.2.4 Investment segment ............................................................................................................293.2.4.1 Activities of the PKO BP SA Group entities in the investment segment .......................... 303.2.5 Other areas of activity ..........................................................................................................30
4 ADDITIONAL INFORMATION...........................................................................................................31
4.1 ACCOUNTING POLICIES APPLIED IN THE PREPARATION OF THE FINANCIALSTATEMENTS ............................................................................................................................................ 314.2 COMPARATIVE INFORMATION – CHANGES IN PRESENTATION .......................................... 314.3 MARKET AND REGULATORY ENVIRONMENTS........................................................................ 324.4 THE STRUCTURE OF THE PKO BP SA GROUP ........................................................................ 33
4.4.1 Consolidated entities ...........................................................................................................334.4.2 Changes in the group structure ...........................................................................................344.4.3 Related party transactions ...................................................................................................34
5. OTHER INFORMATION ....................................................................................................................35
Translation of Interim Financial Statements of the PKO BP SA Group for the 2nd quarter of 2008The Polish language original should be referred to in matters of interpretation
3
1. KEY FINANCIAL INDICATORS
* Result on business activities as the total of income items
PLN 1 848.3 million + 44.0% (y/y)
PLN 4 520.8 million + 27.1% (y/y)
PLN 2 914.4 million + 37.4% (y/y)
PLN 1 172.2 million + 7.4% (y/y)
PLN -2 009.9 million + 9.8% (y/y)
30.0% + 4.4 pp.
3.1% + 0.6 pp.
following 44.0% (y/y) increase in net profit and an increase in equity by a total of 21.7% (y/y)
as a result of increase in income items by 27.1% (y/y), with 9.8% (y/y) increase in costs
with 12.8% (y/y) increase in assets
following increase in interest result by 37.4% (y/y) and in fees and commission result by7.4% (y/y)
as a result of 28.5% (y/y) increase in net loan portfolio and higher deposit margins
as a result of 3.4% (y/y) increase in the number of banking cards and transactions madeusing those cards
as a result of 10.8% (y/y) increase in personnel costs and depreciation expense by12.8% (y/y)
NET FEEAND
COMMISIONINCOME
NETINTERESTINCOME
RESULTON BUSINESS
ACTIVITIES*
COSTS
ROA
net
ROE
net
NET
PROFIT

Translation of Interim Financial Statements of the PKO BP SA Group for the 2nd quarter of 2008The Polish language original should be referred to in matters of interpretation
4
2nd quarterperiod from01.01.2008 to
30.06.2008
2nd quartercumulativelyperiod from
01.01.2007 to30.06.2007
2nd quarterperiod from
01.01.2008 to30.06.2008
2nd quartercumulativelyperiod from
01.01.2007 to30.06.2007
Result on business activities*: 4 520 758 3 557 709 1 299 965 924 412Net interest income 2 914 429 2 121 145 838 058 551 145Net fees and commission income 1 172 193 1 091 547 337 070 283 621Net other income 434 136 345 017 124 838 89 647
Administrative expenses (2 009 937) (1 831 346) (577 967) (475 845)Operating profit 2 334 119 1 614 333 671 187 419 458
Net impairment allowance (176 702) (112 030) (50 811) (29 109)
Gross profit 2 350 941 1 614 011 676 024 419 374Net profit for the period (including minority interest) 1 862 852 1 300 793 535 672 337 990
Net profit 1 848 313 1 283 539 531 491 333 507
Total net cash flows 2 748 203 (4 262 034) 790 259 (1 107 420)Net cash flow from operating activities 3 031 469 (5 493 869) 871 713 (1 427 492)Net cash flow from investing activities (376 038) 1 150 658 (108 131) 298 980Net cash flow from financing activities 92 772 81 177 26 677 21 093
Total equity 12 671 895 10 414 958 3 777 919 2 765 669Attributable to equity holders of the parent company 12 630 175 10 378 952 3 765 481 2 756 108Tier 1 capital 9 437 182 8 392 305 2 813 542 2 228 558Tier 2 capital 1 498 330 - 446 703 -
Market indicatorsearnings per share for the period - basic 1.85 1.28 0.53 0.33earnings per share for the period - diluted 1.85 1.28 0.53 0.33P/BV 3.62 5.27 3.62 5.27P/E 13.22 22.14 13.22 22.14
* result on business activities as the total of net income items
PLN thousand EUR thousand
KEY FINANCIAL INDICATORSdata derived from the inancial statements of the PKO BP SA Group
2nd quarterperiod from
01.01.2008 to30.06.2008
2nd quartercumulativelyperiod from
01.01.2007 to30.06.2007
2nd quarterperiod from
01.01.2008 to30.06.2008
2nd quartercumulativelyperiod from
01.01.2007 to30.06.2007
Result on business activities*: 4 339 020 3 355 613 1 247 705 871 901Net interest income 2 843 481 2 053 550 817 656 533 581Net fee and commission income 1 043 366 963 381 300 025 250 319Net other income 452 173 338 682 130 024 88 001
Administrative expenses (1 871 453) (1 713 462) (538 145) (445 215)Operating result 2 282 993 1 530 875 656 485 397 773
Net impairment allowance (184 574) (111 276) (53 075) (28 913)
Gross profit 2 282 993 1 530 875 656 485 397 773Net profit 1 824 745 1 249 942 524 714 324 777
Total net cash flows 2 412 385 (4 164 761) 693 692 (1 082 145)Net cash flow from operating activities 2 806 174 (5 414 237) 806 928 (1 406 801)Net cash flow from investing activities (331 989) 1 272 337 (95 465) 330 596Net cash flow from financing activities (61 800) (22 861) (17 771) (5 940)
Total equity 12 425 807 10 306 385 3 704 552 2 736 838Tier 1 capital 9 131 969 6 699 114 2 722 548 1 778 935Tier 2 capital 1 162 737 - 346 651 -
Market indicatorsearnings per share for the period - basic 1.82 1.25 0.52 0.32earnings per share for the period - diluted 1.82 1.25 0.52 0.32P/BV 3.69 5.33 3.69 5.33P/E 13.92 23.24 13.92 23.24
KEY FINANCIAL INDICATORSdata derived from the abbreviated financial statements of PKO BP SA
PLN thousand EUR thousand
* result on business activities as the total of net income items

Translation of Interim Financial Statements of the PKO BP SA Group for the 2nd quarter of 2008The Polish language original should be referred to in matters of interpretation
5
2. ABBREVIATEDFINANCIAL STATEMENTS1
2.1 ABBREVIATED FINANCIAL STATEMENTS OF THE PKO BP SA GROUP
Notes
2nd quarterperiod from01.04.2008 to30.06.2008
2nd quartercumulative-lyperiod from01.01.2008 to30.06.2008
2nd quarterperiod from01.04.2007 to30.06.2007
2nd quartercumulative-lyperiod from
01.01.2007 to30.06.2007
Interest income 2 188 742 4 175 498 1 531 744 3 028 154
Interest expense (701 568) (1 261 069) (445 782) (907 009)
Net interest income 1 1 487 174 2 914 429 1 085 962 2 121 145
Fee and commission income 773 957 1 532 053 751 071 1 432 445
Fee and commission expense (192 538) (359 860) (193 177) (340 898)
Net fee and commission income 2 581 419 1 172 193 557 894 1 091 547
Dividend income 3 849 3 860 3 156 3 164
Net income from financial instruments designated at fairvalue
3 24 368 (61 109) 12 326 21 365
Gain less losses from investment securities 1 548 (183) 1 670 2 368
Foreign exchange result 207 821 374 687 133 451 252 792
Other operating income 165 616 368 833 77 941 227 164
Other operating expenses (112 384) (251 952) (65 075) (161 836)
Net other operating income and expense 4 53 232 116 881 12 866 65 328
Net impairment allowance 5 (149 927) (176 702) (112 874) (112 030)
Administrative expenses 6 (1 062 072) (2 009 937) (951 264) (1 831 346)
Operating profit 1 147 412 2 334 119 743 187 1 614 333
Share of profit of associates and jointly controlledentities
13 491 16 822 (1 732) (322)
Profit before income tax 1 160 903 2 350 941 741 455 1 614 011
Income tax expense (257 805) (488 089) (122 955) (313 218)
Net profit (including minority interest) 903 098 1 862 852 618 500 1 300 793
Profit attributable to minority shareholders 5 947 14 539 7 433 17 254
Net profit 7 897 151 1 848 313 611 067 1 283 539
Earnings per share
- basic 0.90 1.85 0.61 1.28
- diluted 0.90 1.85 0.61 1.28
INCOME STATEMENT
1 In this section, data is presented in PLN thousand.
Translation of Interim Financial Statements of the PKO BP SA Group for the 2nd quarter of 2008The Polish language original should be referred to in matters of interpretation
6
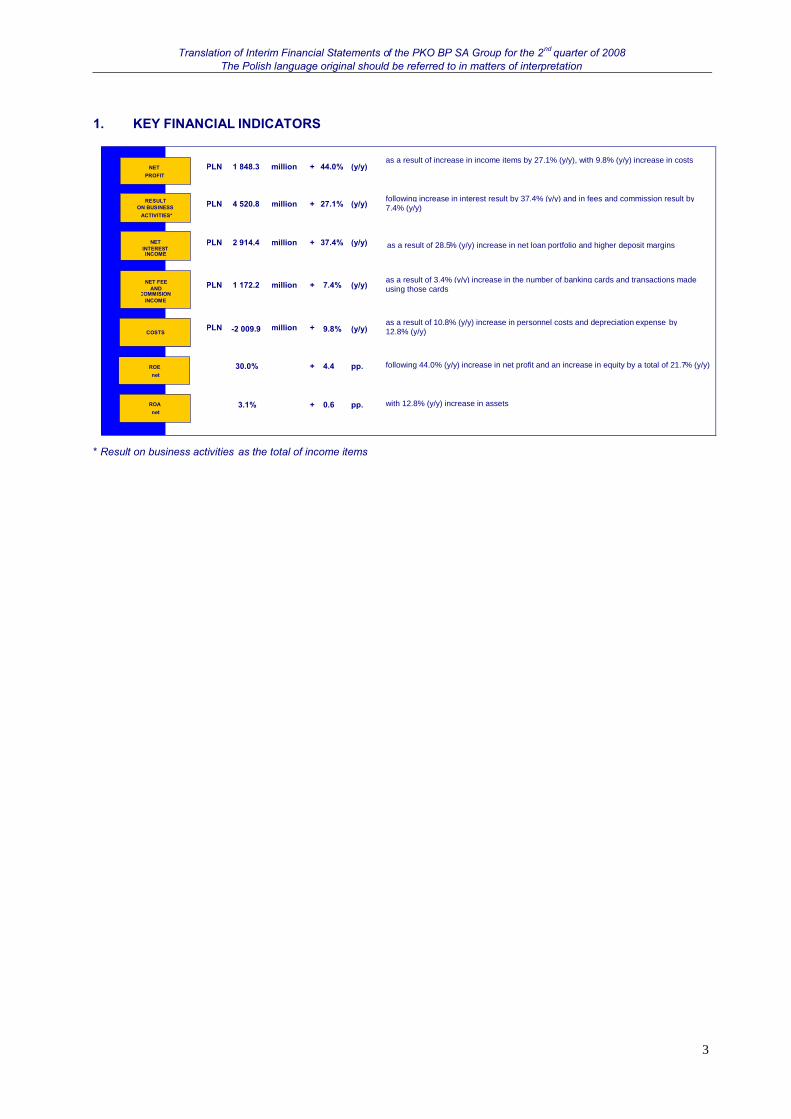
Cash and balances with central bank 4 790 500 4 682 627Amounts due from banks 9 7 321 728 5 292 319
Trading assets 1 080 920 1 202 919
Derivative financial instruments 2 181 000 1 556 736Financial assets designated at fair value 5 061 621 8 314 444
Loans and advances to customers 10 85 624 849 76 417 149
Investment securities 5 938 368 5 716 238Available for sale 5 938 368 5 716 238
Investments in subsidiaries, associates and jointly controlled entities 256 910 178 584
Intangible assets 1 274 819 1 183 491Tangible fixed assets 2 856 375 2 820 103
Current tax receivables 2 245 187 939
Deferred income tax asset 11 73 337 72 154
Other assets 1 325 753 943 980TOTAL ASSETS 117 788 425 108 568 683
LIABILITIES AND EQUITY Notes As at30.06.2008
As at31.12.2007
Amounts due to the central bank 1 164 1 279
Amounts due to other banks 4 748 269 4 703 114
Derivative financial instruments 1 914 233 1 279 925
Amounts due to customers 12 92 611 284 86 610 593Debt securities in issue 142 350 178 860
Subordinated liabilities 1 617 408 1 614 885
Other liabilities 3 385 207 1 732 333Current income tax liabilities 255 869 9 932
Deferred income tax liability 11 6 017 4 446
Provisions 11 434 729 454 301
TOTAL LIABILITIES 105 116 530 96 589 668
Share capital 1 000 000 1 000 000Other capital 9 726 645 8 137 270
Currency translation differences from foreign operations (53 992) (47 761)
Retained earnings 109 209 (72 192)
Net profit for the period 1 848 313 2 903 632Capital and reserves attributable to equity holders of the parent company 12 630 175 11 920 949
Minority interest 41 720 58 066
Total equity 12 671 895 11 979 015TOTAL LIABILITIES AND EQUITY 117 788 425 108 568 683
Capital adequacy ratio (%) 13 - 19 10.92 12.02
Liabilities
Equity
*As a result of the publication and implementation of the Banking Supervisory Commission Resolution 2/2007, the capital adequacy ratio for thecomparative period is prepared under a different basis. This is principally in respect of a different calculation for 2007 capital requirements andthe newly introduced operational risk capital requirement.
BALANCE SHEET
ASSETS NotesAs at
30.06.2008As at
31.12.2007

Translation of Interim Financial Statements of the PKO BP SA Group for the 2nd quarter of 2008The Polish language original should be referred to in matters of interpretation
7
ItemsPeriod from01.01.2008 to
30.06.2008
Period from01.01.2007 to
30.06.2007Share capital 1 000 000 1 000 000Other capital, of which: 9 726 645 8 184 620
Reserve capital 7 219 542 5 592 311Supplementary capital (85 922) 4 284
of which fair value adjustments to available-for-sale financial instruments (85 922) 4 284Reserve capital 1 523 025 1 518 025
General banking risk fund 1 070 000 1 070 000Currency translation differences from foreign operations (53 992) (17 015)Retained earnings 109 209 (72 192)
Net profit for the period 1 848 313 1 283 539Attributable to equity holders of the parent company 12 630 175 10 378 952
Minority interest 41 720 36 006of which: net result for the current period 14 539 17 254
Total equity 12 671 895 10 414 958
Equity as at the end of the previous period 11 979 015 10 180 580Changes in equity
Net profit for the period attributable to the shareholders of the holding company 1 848 313 1 283 539
Profit of the minority shareholders 14 539 17 254Fair value adjustments to available-for-sale financial assets as recognised in therevaluation reserve
(42 856) 450
Currency translation differences from foreign operations (6 231) (3 343)Other increases/decreases in equity (1 120 885) (1 063 522)
Total equity 12 671 895 10 414 958
ItemsPeriod from01.01.2008 to
30.06.2008
Period from01.01.2007 to
30.06.2007Net cash flow from operating activities 3 031 469 (5 493 869)Net cash flow from investing activities (376 038) 1 150 658
Net cash flow from financing activities 92 772 81 177Total net cash flow 2 748 203 (4 262 034)
Cash and cash equivalents at the beginning of the period 9 263 399 14 163 158Cash and cash equivalents at the end of the period, of which 12 011 602 9 901 124Cash and cash equivalents, of which: 12 011 602 9 901 124
Cash in hand 1 548 236 1 336 303Amounts due from the central bank 3 242 264 2 255 651
Current receivables from financial institutions 7 214 607 6 294 653
Cash of the brokerage house ('Dom Maklerski') in the Stock Exchange Guarantee Fund 6 495 14 517
Items As at30.06.2008
As at31.12.2007
Off-balance sheet contingent liabilities granted: 21 897 499 19 371 569
financial 17 890 201 15 486 297guarantees 4 007 298 3 885 272
Liabilities arising from the purchase/sale transactions 426 589 493 418 646 951
Other, of which: 19 004 767 18 269 487irrevocable liabilities 9 848 048 8 860 369
collateral received 9 156 719 9 409 118Total off-balance sheet items 467 491 759 456 288 007
STATEMENT OF CHANGES IN SHAREHOLDERS' EQUITY
Sources of changes in equity
ABBREVIATED STATEMENT OF CASH FLOW
OFF-BALANCE SHEET ITEMS

Translation of Interim Financial Statements of the PKO BP SA Group for the 2nd quarter of 2008The Polish language original should be referred to in matters of interpretation
8
EXPLANATORY NOTES – THE POWSZECHNA KASA OSZCZĘDNOŚCI BANK POLSKI SA GROUP
Note 2
2nd quarterperiod from
01.04.2008 to30.06.2008
2nd quartercumulativelyperiod from
01.01.2008 to30.06.2008
2nd quarterperiod from
01.04.2007 to30.06.2007
2nd quartercumulativelyperiod from
01.01.2007 to30.06.2007
Fee and commission income, of which: 773 957 1 532 053 751 071 1 432 445
Credit related fees and commissions 61 768 123 288 66 870 130 328Maintenance of bank accounts 211 398 416 376 193 225 383 210
Payment cards 222 364 415 903 172 038 321 934Portfolio and other management fees 108 688 228 916 128 861 247 217
Cash transactions 48 934 96 951 51 236 104 082Loan insurance intermediary and other 120 805 250 619 138 841 245 674
Fee and commission expenses, of which: (192 538) (359 860) (193 177) (340 898)
Payment cards (74 750) (146 455) (56 306) (118 523)Acquisition services (25 510) (50 152) (32 580) (62 873)
Loan insurance intermediary and other (61 298) (119 861) (76 816) (111 313)Asset management and related fees (30 980) (43 392) (27 475) (48 189)
Net fees and commission income 581 419 1 172 193 557 894 1 091 547
FEE AND COMMISSION INCOME
Note 3
2nd quarterperiod from
01.04.2008 to30.06.2008
2nd quartercumulativelyperiod from
01.01.2008 to30.06.2008
2nd quarterperiod from
01.04.2007 to30.06.2007
2nd quartercumulativelyperiod from
01.01.2007 to30.06.2007
Net income from the trading portfolio 64 652 (8 248) 187 031 210 939Securities portfolio - trading assets (7 589) (7 347) (3 789) (3 425)Derivatives 72 237 (942) 190 822 214 372
Other 4 41 (2) (8)Net income from finacial assets designated at fairvalue through the income statement
(40 284) (52 861) (174 705) (189 574)
TOTAL 24 368 (61 109) 12 326 21 365
NET INCOME FROM THE FINANCIAL INSTRUMENTS DESIGNETED AT FAIR VALUE
Not e 1
2n d qua rte rpe riod fro m
01 .04 .2 00 8 t o3 0.0 6.2 00 8
2n d qua rte rcum u lat iv elype riod from
01 .01 .20 0 8 t o3 0.0 6.2 00 8
2nd qua rte rpe rio d from01 .04 .20 0 7 to
30 .06 .2 00 7
2 nd q ua rt erc um ula tiv elype rio d from
0 1 .0 1 .20 07 to30 .06 .20 0 7
In te res t inc om e , o f w hic h: 2 1 88 74 2 4 1 75 49 8 1 53 1 7 4 4 3 02 8 1 5 4
L oa n s a n d a dv an ces to cus to m e rs 1 8 34 68 7 3 4 95 98 4 1 18 1 5 3 4 2 28 3 0 2 1F i na nc i al a sse ts de s ig na te d a t fa ir va lu e th ro ug h th e
inco m e sta te m en t1 20 78 0 2 36 73 0 14 3 7 3 0 30 2 6 1 7
A m o u nts d ue fro m oth e r ba n ks 1 09 89 2 2 07 81 3 12 6 0 9 7 27 7 4 5 8
In vestm en t secu ri ti es 82 23 0 1 56 00 6 5 9 9 8 5 12 4 2 3 3
Tr ad in g se cu rit ie s 15 63 3 31 83 2 3 3 5 3 8 4 9 9
O the r 25 52 0 47 13 3 1 7 0 4 5 3 2 3 2 6
In te res t e xpe ns e s, of w h ich : (7 01 56 8 ) (1 2 61 06 9) ( 44 5 7 8 2) ( 90 7 0 0 9)
A m o u nts d ue to cu stom er s (6 00 89 4 ) (1 1 07 55 0) ( 40 1 0 4 3) ( 80 1 0 0 1)
P la cem en ts w ith oth er ba nks ( 23 69 7 ) ( 44 97 3) (1 8 2 8 5) (5 5 3 8 1)
D e b t se cu rit ie s in issu e ( 31 05 2 ) ( 59 82 2) (2 3 0 7) (3 8 5 6)
O the r ( 45 92 5 ) ( 48 72 4) (2 4 1 4 7) (4 6 7 7 1)
N et in te res t inc om e 1 4 87 17 4 2 9 14 42 9 1 08 5 9 6 2 2 12 1 1 4 5
N E T INTE R E S T IN C O M E

Translation of Interim Financial Statements of the PKO BP SA Group for the 2nd quarter of 2008The Polish language original should be referred to in matters of interpretation
9
Note 4
2nd quarterperiod from
01.04.2008 to30.06.2008
2nd quartercumulativelyperiod from
01.01.2008 to30.06.2008
2nd quarterperiod from
01.04.2007 to30.06.2007
2nd quartercumulativelyperiod from
01.01.2007 to30.06.2007
Other operating income, ofwhich:
165 616 368 833 77 941 227 164
Sale of products, merchandise andmaterials
97 060 243 975 49 332 143 106
Sundry income 4 089 12 083 7 557 13 964Sale of subsidiary shares - 3 746 - -Sale, liquidation of tangible and
intangible assets3 975 8 196 3 050 5 597
Other 60 492 100 833 18 002 64 497Other operating expenses, ofwhich:
(112 384) (251 952) (65 075) (161 836)
Sale of products, merchandise andmaterials
(48 219) (162 033) (31 598) (88 177)
Sale, liquidation of tangible fixedassets, intangible assets and assetsheld for sale
(5 334) (9 292) (6 664) (11 752)
Other (58 831) (80 627) (26 813) (61 907)Total 53 232 116 881 12 866 65 328
OTHER OPERATING INCOME AND EXPENSES
Note 5
2nd quarterperiod from
01.04.2008 to30.06.2008
2nd quartercumulativelyperiod from
01.01.2008 to30.06.2008
2nd quarterperiod from
01.04.2007 to30.06.2007
2nd quartercumulativelyperiod from
01.01.2007 to30.06.2007
Increases, of which: (601 253) (972 367) (378 858) (626 576)
impairment losses on loans and advances (576 633) (930 762) (354 319) (577 301)
impairment losses on off-balance sheet liabilities (23 435) (32 229) (16 009) (38 177)impairment losses on securities and financialassets (1 220) (6 136) (2 909) (2 915)
impairment losses on other assets and tangiblefixed assets
35 (3 240) (5 621) (8 183)
Decreases, of which: 451 326 795 665 265 984 514 546impairment losses on loans and advances 409 954 687 277 252 773 484 355impairment losses on off-balance sheet liabilities 20 050 37 315 9 475 23 301impairment losses on securities and financialassets
22 047 69 881 399 1 400
impairment losses on other assets and tangiblefixed assets
(725) 1 192 3 337 5 490
Total (149 927) (176 702) (112 874) (112 030)
ASSET IMPAIRMENT CHARGE RECORDED IN THE INCOME STATEMENT
Note 6
2nd quarterperiod from
01.04.2008 to30.06.2008
2nd quartercumulativelyperiod from
01.01.2008 to30.06.2008
2nd quarterperiod from
01.04.2007 to30.06.2007
2nd quartercumulativelyperiod from
01.01.2007 to30.06.2007
Staff costs (603 751) (1 158 382) (540 184) (1 045 009)Non-personnel costs (332 649) (603 442) (293 677) (559 765)Depreciation and amortisation (105 691) (207 932) (95 458) (184 280)
Other (19 981) (40 181) (21 945) (42 292)Total (1 062 072) (2 009 937) (951 264) (1 831 346)
ADMINISTRATIVE EXPENSES

Translation of Interim Financial Statements of the PKO BP SA Group for the 2nd quarter of 2008The Polish language original should be referred to in matters of interpretation
10
Note 7
2nd quarterperiod from
01.04.2008 to30.06.2008
2nd quartercumulativelyperiod from
01.01.2008 to30.06.2008
2nd quarterperiod from
01.04.2007 to30.06.2007
2nd quartercumulativelyperiod from
01.01.2007 to30.06.2007
PKO BP 920 149 1 824 745 636 260 1 249 942
PKO TFI 28 879 64 766 20 983 49 165
KREDOBANK 593 2 906 (165) 2 616Grupa BFL 2 289 3 491 2 898 6 199
Grupa PTE 4 759 10 812 6 505 11 405CFP 5 366 7 858 651 1 168
eService 6 227 12 679 5 321 9 329
Grupa PKO Inwestycje 5 862 2 409 (14 808) (9 268)Inteligo 4 208 11 870 4 169 6 889
BTK (91) (293) (1 139) (2 020)
consolidation adjustments (81 090) (92 930) (49 608) (41 886)Consolidated net profit 897 151 1 848 313 611 067 1 283 539
CONSOLIDATED NET PROFIT
Note 8As at
30.06.2008As at
31.12.2007Loans, advances, realised guarantees and placements 2 630 615 2 415 879
Tangible and intangible fixed assets 17 991 18 426Financial assets 27 632 91 663
Other assets 129 836 84 546Total 2 806 074 2 610 514
Note 9As at
30.06.2008As at
31.12.2007Gross amount due from banks, of which: 7 321 728 5 292 595
Current accounts with other banks 253 418 183 784Placements with other banks 6 317 546 4 676 670Loans and advances with other banks 312 458 372 257Other 438 306 59 884
Impairment allowance charge on amounts due from banks - (276)Total 7 321 728 5 292 319
Note 10 As at30.06.2008
As at31.12.2007
Gross loans and advances, of which: 88 255 464 78 832 752Consumer 19 717 006 18 303 165Corporate 31 086 738 26 810 539Mortgage 36 839 111 33 260 792
Other receivables 78 341 -Interest 534 268 458 256Impairment allowances for losses on loans and advances (2 630 615) (2 415 603)Total 85 624 849 76 417 149
LOANS AND ADVANCES TO CUSTOMERS
IMPAIRMENT ALLOWANCES ON ASSETS
AMOUNTS DUE FROM BANKS

Translation of Interim Financial Statements of the PKO BP SA Group for the 2nd quarter of 2008The Polish language original should be referred to in matters of interpretation
11
Note 11As at
30.06.2008As at
31.12.2007Current income tax liabilities 6 017 4 446Deferred tax asset 73 337 72 154
Provisions for off-balance sheet liabilities 32 571 34 903Provisions for future liabilities to employees 383 128 399 986
Provision for other future liabilities 19 030 19 412Total 514 083 530 901
Note 12As at
30.06.2008As at
31.12.2007
Deposits, of which: 92 611 284 86 610 593current 40 881 214 39 391 609term 51 730 070 47 218 984
PROVISIONS, DEFERRED TAX ASSETS AND LIABILITIES
AMOUNTS DUE TO CUSTOMERS
Note 13 carryingamount
risk weightedvalue
Banking portfolio 114 319 846 73 433 997Trading portfolio 3 468 579 1 415 102
Total 117 788 425 74 849 100
Note 14 creditequivalent
weighted value
Derivative instruments 257 270 770 1 110 881Banking portfolio 39 919 710 343 389Trading portfolio 217 351 060 767 492
Other off-balance sheet instruments 32 088 282 10 597 598Banking portfolio 30 860 851 9 876 036Trading portfolio 1 227 430 721 562
Total 289 359 052 11 708 479
Note 15 risk weightedvalue
capitalrequirement
Banking portfolio - credit risk 83 653 423 6 692 274Counterparty credit risk - trading portfolio: 767 492 61 399Market risk 196 429
Currency risk - both portfolios -Commodity price risk - trading portfolio -Equity securities price risk - trading portfolio 1 572Debt instruments specific risk - trading portfolio 167 724Interest general risk - trading portfolio 27 133
Operational risk - both portfolios 1 089 024Other -
Settlement risk - counterparty's delivery - trading portfolio -Securities underwriting risk - trading portfolio -Other -
Total capital requirement 8 039 126
RISK WEIGHTED BALANCE SHEET ASSETS as at 30.06.2008
RISK WEIGHTED OFF-BALANCE SHEET INSTRUMENTS as at 30.06.2008
CAPITAL REQUIREMENTS as at 30.06.2008

Translation of Interim Financial Statements of the PKO BP SA Group for the 2nd quarter of 2008The Polish language original should be referred to in matters of interpretation
12
Note 16 carrying valuerisk weighted
valueBanking portfolio 105 568 443 74 699 683
Trading portfolio 3 000 241 1 099 072
Total 108 568 683 75 798 755*As a result of the publication and implementation of the Banking Supervisory Commission Resolution 2/2007, the capital adequacy ratio for thecomparative period is prepared under a different basis. This is principally in respect of a different calculation for 2007 capital requirements and thenewly introduced operational risk capital requirement.
RISK WEIGHTED BALANCE SHEET ASSETS as at 31.12.2007*
Note 17credit
equivalentweighted value
Derivative instruments 213 809 611 498 710Banking portfolio 38 235 646 230 591
Trading portfolio 175 573 965 268 119
Other off-balance sheet instruments 29 406 484 6 334 030Banking portfolio 27 941 868 5 085 761
Trading portfolio 1 464 616 1 248 269
Total 243 216 095 6 832 740
Note 18risk weighted
valuecapital
requirementBanking portfolio - credit risk 80 016 034 6 401 283Counterparty credit risk - trading portfolio: 303 100 24 248
Market risk 220 143
Currency risk - both portfolios -Commodity price risk - trading portfolio -
Equity securities price risk - trading portfolio 1 187
Debt instruments specific risk - trading portfolio 166 633Interest general risk - trading portfolio 52 322
Other -
Settlement risk - counterparty's delivery - trading portfolio -Securities underwriting risk - trading portfolio -
Other -
Total capital requirement 6 645 674
CAPITAL REQUIREMENTS as at 31.12.2007*
*As a result of the publication and implementation of the Banking Supervisory Commission Resolution 2/2007, the capital adequacy ratio for thecomparative period is prepared under a different basis. This is principally in respect of a different calculation for 2007 capital requirements and thenewly introduced operational risk capital requirement.
RISK WEIGHTED OFF-BALANCE SHEET ASSETS as at 31.12.2007*
*As a result of the publication and implementation of the Banking Supervisory Commission Resolution 2/2007, the capital adequacy ratio for thecomparative period is prepared under a different basis. This is principally in respect of a different calculation for 2007 capital requirements and thenewly introduced operational risk capital requirement.

Translation of Interim Financial Statements of the PKO BP SA Group for the 2nd quarter of 2008The Polish language original should be referred to in matters of interpretation
13
Note 19 As at 30.06.2008As at
31.12.2007*Tier 1 capital 9 437 182 8 449 415
Share capital 1 000 000 1 000 000Supplementary capital 7 219 542 5 592 311
Reserve capital 1 523 025 1 518 025
General banking risk fund 1 070 000 1 070 000
Net income of the current period in the part verified by a certified auditor after reductionof forecasted charges
- 653 720
Retained earnings 109 209 (72 192)Unrealised losses on debt and equity securities classified as available for sale (104 904) (55 228)
Investments in shares of bank and other financial institutions (50%) (102 370) (84 035)
Intangible assets (1 265 048) (1 183 491)
including goodwill (240 410) (234 066)Foreign exchange differences (53 992) (47 761)
Minority interest 41 720 58 066
Tier 2 capital 1 498 330 1 517 988Subordinated liabilities classified as supplementary funds 1 600 700 1 600 700Unrealised profits on debt and equity securities classified as available for sale(60% of pre-tax balance) - 1 323
Investments in shares of banking and other financial institutions (50%) (102 370) (84 035)
Tier 3 capital 35 904 15 997
Total regulatory capital and short-term capital 10 971 417 9 983 400
REGULATORY CAPITAL AND SHORT-TERM CAPITAL
*As a result of the publication and implementation of the Banking Supervisory Commission Resolution 2/2007, the capital adequacy ratio for thecomparative period is prepared under a different basis. This is principally in respect of a different calculation for 2007 capital requirements and thenewly introduced operational risk capital requirement.
Translation of Interim Financial Statements of the PKO BP SA Group for the 2nd quarter of 2008The Polish language original should be referred to in matters of interpretation
14
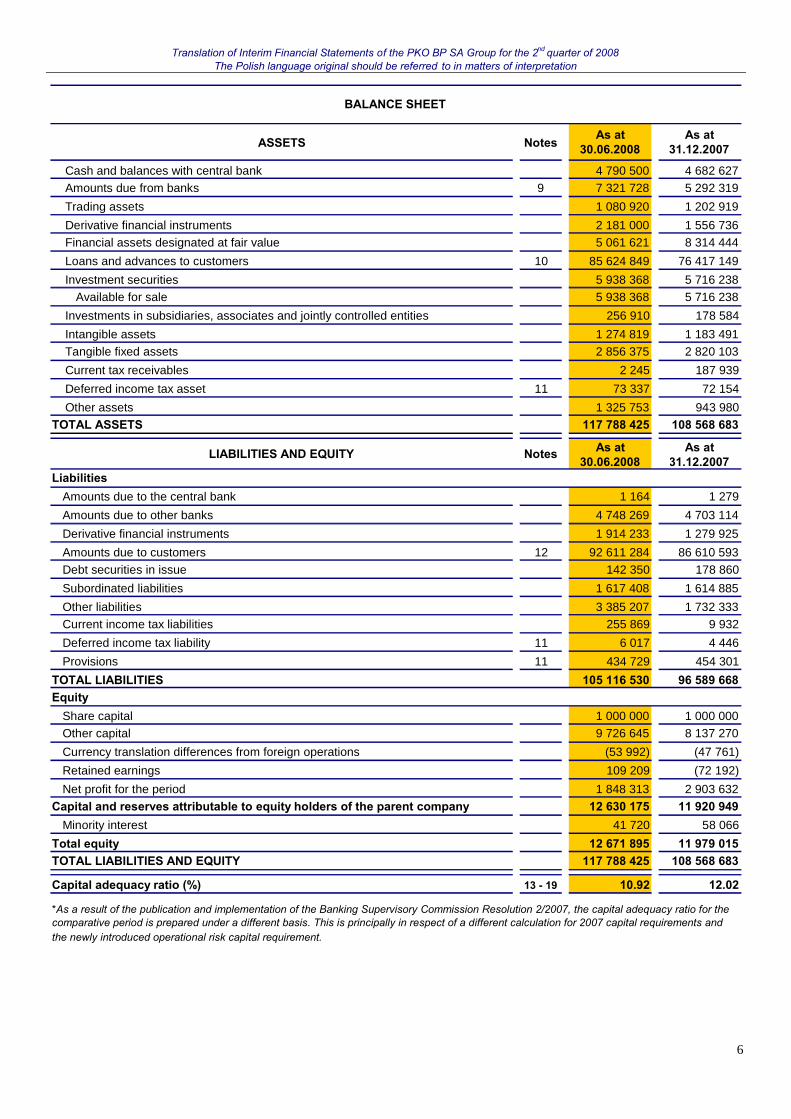
2.2 ABBREVIATED FINANCIAL STATEMENTS OF PKO BP SA
Notes
2nd quarterperiod from
01.04.2008 to30.06.2008
2nd quartercumulativelyperiod from
01.01.2008 to30.06.2008
2nd quarterperiod from
01.04.2007 to30.06.2007
2nd quartercumulativelyperiod from
01.01.2007 to30.06.2007
Interest income 2 096 163 3 996 826 1 458 776 2 881 963Interest expense (645 111) (1 153 345) (405 402) (828 413)
Net interest income 1 1 451 052 2 843 481 1 053 374 2 053 550
Fee and commission income 697 274 1 376 587 666 834 1 267 276
Fee and commission expense (176 264) (333 221) (181 671) (303 895)Net fee and commission income 2 521 010 1 043 366 485 163 963 381
Dividend income 112 790 112 801 51 976 51 984Net income from financial instruments designatedat fair value
3 24 511 (60 907) 12 111 19 337
Gains less losses from investment securities 138 (1 603) 924 1 782Foreign exchange result 204 828 369 649 131 939 249 493
Other operating income 58 288 99 838 19 997 62 148
Other operating expenses (53 075) (67 605) (21 350) (46 062)
Net other operating income and expenses 4 5 213 32 233 (1 353) 16 086Net impairment allowance (166 038) (184 574) (102 249) (111 276)
Administrative expenses 5 (987 441) (1 871 453) (889 794) (1 713 462)
Operating profit 1 166 063 2 282 993 742 091 1 530 875Profit before income tax 1 166 063 2 282 993 742 091 1 530 875
Income tax expense (245 914) (458 248) (105 831) (280 933)
Net profit 920 149 1 824 745 636 260 1 249 942
Earnings per share
basic 0.92 1.82 0.64 1.25
diluted 0.02 1.82 0.64 1.25
INCOME STATEMENT

Translation of Interim Financial Statements of the PKO BP SA Group for the 2nd quarter of 2008The Polish language original should be referred to in matters of interpretation
15
ASSETS As at 30.06.2008 As at 31.12.2007Cash and balances with central bank 4 690 825 4 594 084Amounts due from banks 7 519 310 5 346 882Trading assets 1 080 920 1 202 919Derivative financial instruments 2 181 000 1 556 750Other financial instruments designated at fair value through profitor loss 4 969 064 8 101 534
Loans and advances to customers 82 698 792 73 822 193Investment securities 6 058 283 5 841 553
Available for sale 6 058 283 5 841 553Investments in subsidiaries, associates and jointly controlledentities 1 101 733 1 054 395
Intangible assets 1 012 148 927 610Tangible fixed assets 2 307 442 2 270 480Current tax receivables - 187 707Deferred income tax asset 32 413 35 531Other assets 812 773 429 699
TOTAL ASSETS 114 464 703 105 371 337
LIABILITIES AND EQUITY As at 30.06.2008 As at 31.12.2007Liabilities
Amounts due to the central bank 1 164 1 279Amounts due to other banks 3 504 921 3 624 455Derivative financial instruments 1 915 201 1 280 265Amounts due to customers 91 270 182 85 246 546Debt securities in issue 1 617 408 1 614 885Other liabilities 3 052 056 1 421 321Current income tax liabilities 246 093 -Provisions 431 871 453 045
TOTAL LIABILITIES 102 038 896 93 641 796Equity
Share capital 1 000 000 1 000 000Other capital 9 601 062 8 009 550Net profit for the period 1 824 745 2 719 991
Total equity 12 425 807 11 729 541TOTAL LIABILITIES AND EQUITY 114 464 703 105 371 337
- -Capital adequacy ratio (%) 10.65 11.87*
BALANCE SHEET

Translation of Interim Financial Statements of the PKO BP SA Group for the 2nd quarter of 2008The Polish language original should be referred to in matters of interpretation
16
ItemsPeriod from
01.01.2008 to30.06.2008
Period from01.01.2007 to30.06.2007
Share capital 1 000 000 1 000 000
Other capital, of which: 9 601 062 8 056 443Reserve capital 7 216 986 5 591 995
Revaluation reserve (80 924) 4 448
of which fair value adjustments to available-for-sale financial assets (80 924) 4 448Other reserves 1 395 000 1 390 000
General banking risk fund 1 070 000 1 070 000
Retained earnings - -Net profit for the period 1 824 745 1 249 942
Total equity 12 425 807 10 306 385
Equity as at the end of the previous period 11 729 541 10 035 724
Changes in equity
Net profit (loss) of the Bank 1 824 745 1 249 942Fair value adjustments to available-for-sale financial assets recognised in the revaluationreserve
(38 479) 719
Other increases/decreases in equity (1 090 000) (980 000)
Total equity 12 425 807 10 306 385
Sources of changes in equity
ItemsPeriod from
01.01.2008 to30.06.2008
Period from01.01.2007 to30.06.2007
Net cash flow from operating activities 2 806 174 (5 414 237)
Net cash flow from investing activities (331 989) 1 272 337
Net cash flow from financing activities (61 800) (22 861)Total net cash flow 2 412 385 (4 164 761)
Cash and cash equivalents at the beginning of the period 9 032 509 13 879 643
Cash and cash equivalents at the end of the period 11 444 894 9 714 882Cash and cash equivalents, of which: 11 444 894 9 714 882
Cash in hand 1 448 561 1 271 146
Amounts due from the Central Bank 3 242 264 2 258 561Current receivables from financial institutions 6 747 574 6 170 658
Cash of the a brokerage house, Dom Maklerski, in the Stock Exchange Guarantee Fund 6 495 14 517
ABBREVIATED STATEMENT OF CASH FLOW
Items As at 30.06.2008 As at 31.12.2007
Off-balance sheet contingent liabilities granted: 22 247 466 19 659 505- financial 17 956 129 15 442 749
- guarantees 4 291 337 4 216 756Liabilities arising from the purchase/sale transactions 426 654 819 418 738 219
Other, of which: 13 943 642 13 386 552- irrevocable liabilities 9 843 708 8 856 029
- collateral received 4 099 934 4 530 523
Total off-balance sheet items 462 845 927 451 784 276
OFF-BALANCE SHEET ITEMS

Translation of Interim Financial Statements of the PKO BP SA Group for the 2nd quarter of 2008The Polish language original should be referred to in matters of interpretation
17
EXPLANATORY NOTES – POWSZECHNA KASA OSZCZĘDNOŚCI BANK POLSKI S.A.
Note 1
2nd quarterperiod from
01.04.2008 to30.06.2008
2nd quartercumulativelyperiod from
01.01.2008 to30.06.2008
2nd quarterperiod from
01.04.2007 to30.06.2007
2nd quartercumulativelyperiod from
01.01.2007 to30.06.2007
Interest income, of which: 2 096 163 3 996 826 1 458 776 2 881 963
Loans and advances to customers 1 742 069 3 319 374 1 110 366 2 143 423Financial assets designated at fair value through profit
or loss 118 283 231 654 140 431 296 762
Loans and advances to banks 109 988 207 326 124 372 273 989
Investment securities 84 881 159 515 60 474 124 233
Trading securities 15 633 31 832 6 097 11 241
Other 25 309 47 125 17 036 32 315
Interest expenses, of which: (645 111) (1 153 345) (405 402) (828 413)Amounts due to customers (591 619) (1 050 307) (375 170) (739 908)
Deposits from banks (23 731) (45 004) (18 301) (55 373)
Debt securities in issue (28 232) (53 777) - -
Other (1 529) (4 257) (11 931) (33 132)
Net interest income 1 451 052 2 843 481 1 053 374 2 053 550
Note 2
2nd quarterperiod from
01.04.2008 to30.06.2008
2nd quartercumulativelyperiod from
01.01.2008 to30.06.2008
2nd quarterperiod from
01.04.2007 to30.06.2007
2nd quartercumulativelyperiod from
01.01.2007 to30.06.2007
Interest income, of which: 697 274 1 376 587 666 834 1 267 276
Credit related fees and commissions 59 945 121 208 64 412 126 209
Maintenaince of bank accounts 204 761 403 727 185 746 372 733
Payment cards 219 630 412 703 170 767 319 651
Portfolio and other management fees 43 422 95 959 59 042 106 048Cash transactions 49 004 96 951 51 186 103 983
Loan insurance intermediary and other 120 512 246 039 135 681 238 652
Fee and commission expenses, of which: (176 264) (333 221) (181 671) (303 895)
Payment cards (84 759) (163 778) (69 155) (131 040)
Acquisition services (25 508) (50 149) (32 579) (62 871)Loan insurance intermediary and other (65 997) (119 294) (79 937) (109 984)
Net fee and commission income: 521 010 1 043 366 485 163 963 381
Note 3
2nd quarterperiod from
01.04.2008 to30.06.2008
2nd quartercumulativelyperiod from
01.01.2008 to30.06.2008
2nd quarterperiod from
01.04.2007 to30.06.2007
2nd quartercumulativelyperiod from
01.01.2007 to30.06.2007
Result from the trading portfolio 64 147 (8 679) 187 054 210 978
Securities portfolio - trading assets (7 589) (7 347) (3 789) (3 425)Derivatives 71 732 (1 373) 190 845 214 411
Other 4 41 (2) (8)Result from the finacial assets designated at fairvalue through profit or loss
(39 636) (52 228) (174 943) (191 641)
TOTAL 24 511 (60 907) 12 111 19 337
NET INTEREST INCOME
FEE AND COMMISSION INCOME
NET INCOME FROM THE FINANCIAL INSTRUMENTS DESIGNATED AT FAIR VALUE

Translation of Interim Financial Statements of the PKO BP SA Group for the 2nd quarter of 2008The Polish language original should be referred to in matters of interpretation
18
Note 4
2nd quarterperiod from
01.04.2008 to30.06.2008
2nd quartercumulativelyperiod from
01.01.2008 to30.06.2008
2nd quarterperiod from
01.04.2007 to30.06.2007
2nd quartercumulativelyperiod from
01.01.2007 to30.06.2007
Other operating income, of which: 58 288 99 838 19 997 62 148Sundry income 5 419 10 870 6 696 12 808
Sale of shares in subsidiaries - 3 746 - -
Sale, liquidation of tangible and intangible assets 1 902 4 482 2 058 3 068Other 50 967 80 740 11 243 46 272
Other operating expenses, of which: (53 075) (67 605) (21 350) (46 062)
Sale, liquidation of tangible fixed assets, intangibleassets and assets held for sale (1 327) (1 941) (4 941) (8 394)
Other (51 748) (65 664) (16 409) (37 668)
Total 5 213 32 233 (1 353) 16 086
OTHER OPERATING INCOME AND EXPENSES
Note 5
2nd quarterperiod from
01.04.2008 to30.06.2008
2nd quartercumulativelyperiod from
01.01.2008 to30.06.2008
2nd quarterperiod from
01.04.2007 to30.06.2007
2nd quartercumulativelyperiod from
01.01.2007 to30.06.2007
Staff costs (564 407) (1 082 258) (508 478) (983 378)
Non-personnel costs (319 259) (580 457) (283 206) (540 319)
Depreciation and amortisation (86 865) (174 624) (80 790) (155 819)Other (16 910) (34 114) (17 320) (33 946)
Total (987 441) (1 871 453) (889 794) (1 713 462)
ADMINISTRATIVE EXPENSES
Translation of Interim Financial Statements of the PKO BP SA Group for the 2nd quarter of 2008The Polish language original should be referred to in matters of interpretation
19
3. COMMENTARY ON THE ABBREVIATED FINANCIAL STATEMENTS
3.1 FINANCIAL RESULTS
3.1.1. The PKO BP SA Group
Financial results and profitability ratios
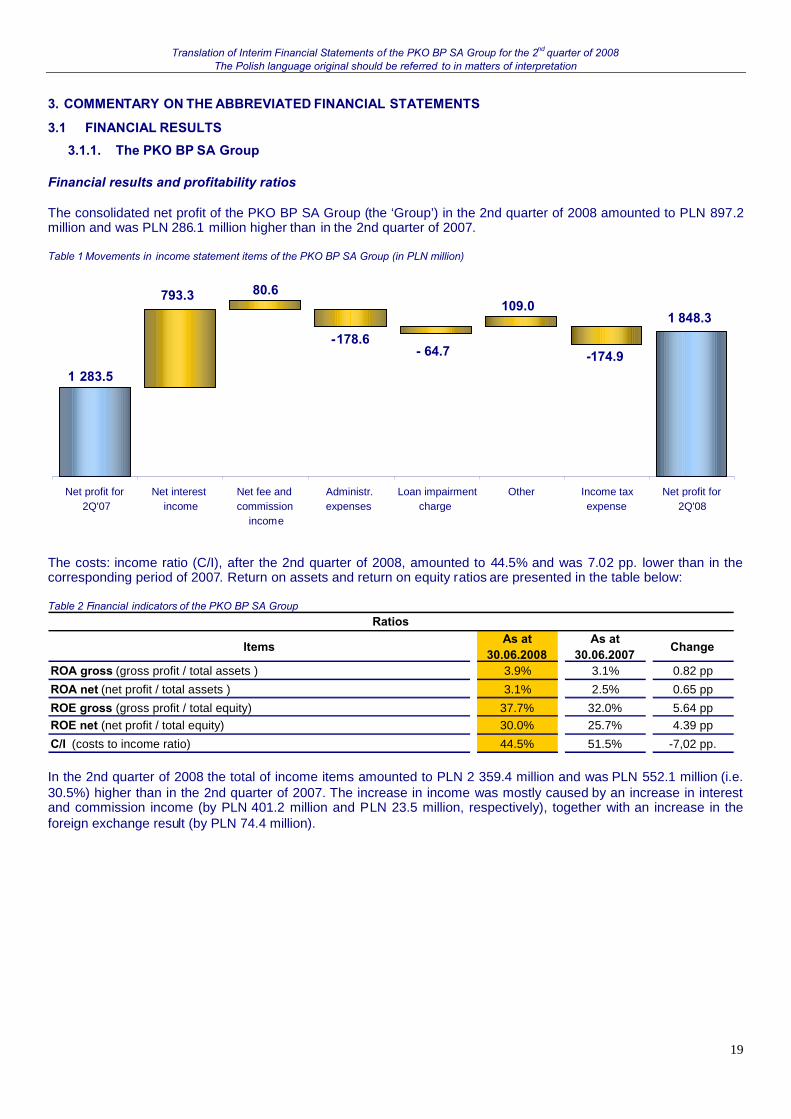
The consolidated net profit of the PKO BP SA Group (the ‘Group’) in the 2nd quarter of 2008 amounted to PLN 897.2million and was PLN 286.1 million higher than in the 2nd quarter of 2007.
Table 1 Movements in income statement items of the PKO BP SA Group (in PLN million)
The costs: income ratio (C/I), after the 2nd quarter of 2008, amounted to 44.5% and was 7.02 pp. lower than in thecorresponding period of 2007. Return on assets and return on equity ratios are presented in the table below:
Table 2 Financial indicators of the PKO BP SA Group
ItemsAs at
30.06.2008As at
30.06.2007Change
ROA gross (gross profit / total assets ) 3.9% 3.1% 0.82 pp
ROA net (net profit / total assets ) 3.1% 2.5% 0.65 pp
ROE gross (gross profit / total equity) 37.7% 32.0% 5.64 ppROE net (net profit / total equity) 30.0% 25.7% 4.39 pp
C/I (costs to income ratio) 44.5% 51.5% -7,02 pp.
Ratios
In the 2nd quarter of 2008 the total of income items amounted to PLN 2 359.4 million and was PLN 552.1 million (i.e.30.5%) higher than in the 2nd quarter of 2007. The increase in income was mostly caused by an increase in interestand commission income (by PLN 401.2 million and PLN 23.5 million, respectively), together with an increase in theforeign exchange result (by PLN 74.4 million).
1 283.5
793.3 80.6
-178.6- 64.7
109.0
-174.9
1 848.3
Net profit for2Q'07
Net interestincome
Net fee andcommission
income
Administr.expenses
Loan impairmentcharge
Other Income taxexpense
Net profit for2Q'08

Translation of Interim Financial Statements of the PKO BP SA Group for the 2nd quarter of 2008The Polish language original should be referred to in matters of interpretation
20
The main consolidated income items are as follows:
Table 3 Movements in the profit and loss account items of the PKO BP SA Group (in PLN million)
Income statement items
2nd quarterperiod from
01.04.2008 to30.06.2008
Change(2nd q 08/2nd q 07)
2nd quartercumulativelyperiod from01.01.2008 to30.06.2008
Change(2nd q 08/2nd q 07)
Comment
Net interest income 1 487,2 36,9% 2 914,4 37,4%
(+) 37.4% (y/y) mainly as a result of increase in.deposit margins as a result of increased marketinterest rates and 28.5% (y/y) increase in thevolume of the net loan portfolio.
Net fee and commissionincome 581,4 4,2% 1 172,2 7,4%
(+) 7.4% (y/y) mainly as a result of increases in thenumber of payment cards (by 3.4% y/y) and relatedcard transactions and growth of revenues related tocustomer accounts; fee and commission incomerelating to portfolio and other management fees.
Other net income 290,8 77,9% 434,1 25,8%
(+) 25.8% (y/y) as a result of:1) increase of foreign exchange result by PLN 121.9million (48.2% y/y) - the effect of increased spreadsbetween PLN interest rate and foreign interestsrates and the effect of an increase in sales of loansdenominated in foreign currencies, along with adecrease in net income from financial activiesderiving from increased risk aversion on financialmarkets,2) increase of net other operating income andexpenses realized mainly by PKO Inwestycje Groupand eService SA.
Administrative expenses -1 062,1 11,6% -2 009,9 9,8%
Increase of 9.8% (y/y) and C/I at the level of 44.5% (-7.02 pp. y/y) as a result of:1) increase in staff costs by 10.8% (y/y) - along withemployment reduction of 500 full time equivalents(y/y) at the Group2) increase in depreciation and amortisationexpense of 12.8% (y/y), mainly as a result ofIntegrated IT System (ZSI) modules activated during2007, along with profitability increase of 27.1% y/y.
Loan impairment charge -149,9 32,8% -176,7 57,7%
Decrease of 57.7% (y/y) resulting from an increasein impairment allowances on corporate loans and adeterioration in the quality of the consumer loanportfolio.
Balance sheet and off-balance sheet items
Table 4 Movements in the balance sheet items of the PKO BP SA Group (in PLN thousand)
ItemsAs at
30.06.2008
Change30.06.2008/31.12.2007
Cash and bances w ith the central bank 4 790 500 2,3%
Amounts due from banks 7 321 728 38,3%
Loans and advances to customers 85 624 849 12,0%
Financial instruments 12 080 909 -20,7%
Other assets 7 970 439 14,8%
TOTAL ASSETS 117 788 425 8,5%
Amount due to banks 4 749 433 1,0%
Amounts due to customers 92 611 284 6,9%
Securities in issue 1 759 758 -1,9%
Other liabilities 5 996 055 72,3%
TOTAL LIABILITIES 105 116 530 8,8%
Total equity 12 671 895 5,8%
TOTAL LIABILITIES AND EQUITY 117 788 425 8,5%
Loans/Deposits (Amounts due to customers) 92,5% 4,2 pp.
Interest bearing assets/Assets 89,2% -0,1 pp.
Interest paying liabilities/Liabilities 84,2% -1,6 pp.Result of increase in the proportion of other liabilties inthe total balance of liabilities (mainly derivatives andaccruals).
Comments
Increase in assets of PLN 9.2 billion (+ 8.5%
1H'08/2007), along w ith increase in loans andadvances to customers of PLN 9.2 billion (+ 12.0%1H'08/2007) and increase in amounts due from banks
of PLN 2.0 billion (+ 38.3% 1H'08/2007) along w ithdecrease in securities by PLN 3.2 billion (- 20.7%1H'08/2007).
Increase in financial assets as a consequence ofincrease in amounts due to customers of PLN 6.0 billion(+ 6.9% 1H'08/2007) and increase in equity as a resultof its accumulation prof it (+ 5.8% 1H'08/2007).
(+) 4.2 pp. resulting from an increase in loans by
12.0% (1H'08/2007) and an increase in deposits by6.9% (1H'08/2007).
Ratio remained at a stable level.
As at 30 June 2008, the total of off-balance sheet items of the PKO BP SA Group amounted to PLN 467.5 billion andincreased by 2.5%, compared to 31 December 2007. The main share in that balance related to liabilities resulting fromsale/purchase transactions, which equaled PLN 426.6 billion.
3.1.2. PKO BP SA
Financial result and profitability ratios
The net profit recorded by PKO BP SA (the ‘Bank’) in the 2nd quarter of 2008 amounted to PLN 920.1 million and wasPLN 283.9 million higher than in the 2nd quarter of 2007.

Translation of Interim Financial Statements of the PKO BP SA Group for the 2nd quarter of 2008The Polish language original should be referred to in matters of interpretation
21
Table 5 Movements in the profit and loss account items of PKO BP SA (in PLN million)
Table 6 Financial indicators of PKO BP SA
Items As at30.06.2008
As at30.06.2007
Change
ROA gross (gross profit / total assets ) 3.8% 2.9% 0.83 ppROA net (net profit / total assets ) 3.0% 2.4% 0.64 ppROE gross (gross profit / total equity) 35.9% 30.1% 5.83 ppROE net (net profit / total equity) 29.0% 24.6% 4.37 ppC/I (costs to income ratio) 43.1% 51.1% -7,93 pp.
Ratios
Table 7 Movements in the profit and loss account items of PKO BP SA
Income statement items
2nd quarterperiod from01.04.2008 to
30.06.2008
Change(2nd q 08/2nd q 07)
2nd quartercumulativelyperiod from
01.01.2008 to30.06.2008
Change(2nd q 08/2nd q 07)
Comment
Net interest income 1 451,1 37,8% 2 843,5 38,5%
(+) 38.5% (y/y) mainly as a result of increase indeposit margins as a result of increased marketinterest rates and 28.0% (y/y) increase in the volumeof the net loan portfolio
Net fee and commission income 521,0 7,4% 1 043,4 8,3%
(+) 8.3% (y/y) mainly as a result of increases in thenumber of payment cards (by 3.4% y/y) and relatedcard transactions, drop ;fee and commission incomerelating to portfolio and other management fees
Other net income 347,5 77,7% 452,2 33,5%
(+) 33.5% (y/y) as a result of:1) higher by PLN 60.8 million dividend income,2) increase of foreign exchange result 48.2% (y/y) -the effect of increased spreads between PLN interestrate and foreign interests rates and the effect of anincrease in sales of loans denominated in foreigncurrencies, along with decrease in net income fromfinancial activies deriving from an increase of riskaversion on financial markets,
Administrative expenses -987,4 11,0% -1 871,5 9,2%
9.2% (y/y) increase in C/I at the level of 43.1% (-7.9pp. y/y) together with:1) staff costs increase of 10.1% and employmentreduction of 1089 full time equivalents (y/y),2) increase in amortisation and depreciation costs of12.1% (y/y) mainly as a result of Integrated ITSystem (ZSI) modules activated during year 2007.
Loan impairment charge -166,0 62,4% -184,6 65,9%
Decrease of 65.9% (y/y) resulting from an increase inimpairment allowances on corporate loans and adeterioration in the quality of the consumer loanportfolio.
1 249.9
1 824.7
-177.3
113.5
- 73.3-158.0
80.0789.9
Net profit for2Q'07
Net interestincome
Net fee andcommission
income
Administr.expenses
Loan impairmentcharge
Other Income taxexpense
Net profit for2Q'08

Translation of Interim Financial Statements of the PKO BP SA Group for the 2nd quarter of 2008The Polish language original should be referred to in matters of interpretation
22
3.2 BUSINESS DEVELOPMENT2
3.2.1. Segmentation of the activities of the PKO BP SA Group
The primary basis of the PKO BP SA Group reporting scheme is business segments. The PKO BP SAGroup typically settles inter-segment transactions as if they were concluded between unrelated parties,using internal settlement rates and a rule of simultaneous recording of a single operation’s result in thesegment that contributed to its origin. Results simultaneously recorded in a few segments aresubsequently excluded through elimination, on entity consolidation.
Business segments
Segmentation by business is as follows:
- the retail segment comprises transactions of the parent entity with retail clients, small andmedium-sized enterprises, mortgage market clients and operations of the following subsidiaries:KREDOBANK SA, the Powszechne Towarzystwo Emerytalne BANKOWY SA Group, PKOTowarzystwo Funduszy Inwestycyjnych SA, Inteligo Financial Services SA, CentrumElektronicznych Usług Płatniczych eService SA and Grupa PKO Inwestycje Sp. z.o.o.,
- the corporate segment companies includes transactions of the parent entity with large corporateclients and operations of the Bankowy Fundusz Leasingowy SA Group,
- the investment segment comprises investing and brokerage activities, inter-bank transactions,derivative instruments and debt securities transactions and result on swap points of the parententity and operations of the PKO BP SA Group.
The Bank has not separated any other segments as a result of not having reached the thresholds setforth in IAS 14. According to IAS 14, segments which were not separated have been disclosed asunallocated balance sheet items (‘Other’).Assets and liabilities of a given segment represent operating assets and liabilities used by the segmentin its operating activities.The tables below present data relating to revenue and results of individual industry segments of the PKOBP SA Group for the 6-months period ended 30 June 2008 and 30 June 2007, and selected assets andliabilities as at 30 June 2008 and 31 December 2007.In January 2008, the PKO BP SA Group changed the method of business segment result calculation, aswell as the manner and scope of business segment separation. The financial data for the year of 2007was respectively restated for comparability purposes.As the PKO BP SA Group’s activities abroad are relatively small compared to the total results of thePKO BP SA Group, a geographical presentation is not included.
2 In this document, any differences in totals, percentages and ratios of changes are due to roundi ng of amounts to full million androunding of percentages to one decimal place.

Translation of Interim Financial Statements of the PKO BP SA Group for the 2nd quarter of 2008The Polish language original should be referred to in matters of interpretation
23
Table 8 Business segments of the PKO BP SA Groupmillion PLN
Period from 01.01.2008 to 30.06.2008Retail
segmentCorporatesegment
Investmentsegment
OtherConsolidationadjustments
All activities ofPKO BP SA Group
Net interest income 2 402.4 157.8 96.9 (12.6) 199.0 2 843,5Net fee and commission income 1 166.8 103.6 45.6 (14.5) (258.1) 1 043,4Other income 160.1 39.5 378.4 6.8 (132.7) 452,2
Result from financial operations 0.6 14.9 (104.4) (6.0) 32.4 (62,5)Foreign exchange result 130.0 36.0 369.7 0.2 (166.2) 369,6Dividend income - - 112.8 - - 112,8Net other operating income 16.5 1.6 0.4 12.6 1.1 32,2Income/expenses related to internal clients 13.0 (13.0) - - - -
Net loan impairment charges (134.9) (103.7) 47.3 6.8 - (184,6)Administrative expenses (1 711.6) (110.7) (49.1) - - (1 871,5)Results of subsidiaries 131.4 4.3 144.5 9.0 (221.3) 67,9Gross segment profit 2 014.2 90.8 663.5 (4.6) (413.0) 2 350,9Income tax expense (488.1) (488,1)Minority interest 14.5 14,5Net profit 2 014.2 90.8 663.5 (507.2) (413.0) 1 848,3
Continued activities
As at 30.06.2008
ASSETS 68 415,8 22 645,0 17 865,6 9 845,3 (983,4) 117 788,4
LIABILITIES 77 471,3 17 427,8 21 044,5 19 145,3 (17 300,6) 117 788,4

Translation of Interim Financial Statements of the PKO BP SA Group for the 2nd quarter of 2008The Polish language original should be referred to in matters of interpretation
24
Table 9 Business segments of the PKO BP SA Group
million PLN
Period from 01.01.2007 to 30.06.2007Retail
segmentCorporatesegment
Investmentsegment
OtherConsolidationadjustments
All activities ofPKO BP SA Group
Net interest income 1 713.5 114.1 76.4 (14.4) 164.0 2 053,6
Net fee and commission income 1 104.9 80.3 71.6 (77.1) (216.3) 963,4
Other result 114.8 10.4 330.7 8.3 (125.5) 338,7
Result from financial operations 3.4 (1.1) 29.0 (7.4) (2.9) 21,1
Foreign exchange result 97.9 24.7 249.5 - (122.6) 249,5
Dividend income - - 52.0 - - 52,0
Net other operating income 0.6 (0.3) 0.2 15.6 - 16,1
Income/expenses related to internal clients 13.0 (13.0) - - - -
Net loan impairment charges (91.1) (7.6) 1.4 (14.0) - (111,3)
Administrative expenses (1 633.6) (62.0) (17.9) - - (1 713,5)
Results of subsidiaries 100.6 7.8 108.2 1.7 (135.2) 83,1
Gross segment profit 1 309.2 143.0 570.4 (95.5) (313.0) 1 614,0
Income tax expense (313,2) (313,2)
Minority interest 17,3 17,3
Net profit 1 309.2 143.0 570.4 (426.0) (313.0) 1 283,5
Continued activities
As at 31.12.2007ASSETS 61 246.6 19 651.3 20 658.1 8 001.6 (988.9) 108 568.7LIABILITIES 73 149.2 15 191.0 18 805.6 14 215.6 (12 792.8) 108 568.7

Translation of Interim Financial Statements of the PKO BP SA Group for the 2nd quarter of 2008The Polish language original should be referred to in matters of interpretation
25
3.2.2. Retail segment
The result of the retail segment increased by PLN 705.0 million, i.e. 53.8% (y/y), with an 11.7% 1H’08/2007 increase insegment assets and 5.9% 1H’08/2007 increase in segment liabilities. The increase of the segment’s result was mainlydetermined by an increase of net interest income (40.2% y/y) due to an increase in the gross3 loan portfolio by 29.4%(y/y) and increased deposit margins resulting from an increase in market interest rates.
3.2.2.1 Activities of PKO BP SA in the retail segment
As at 30 June 2008, the total value of deposits of the retail segment of PKO BP SA and assets managed by PKO TFIwas PLN 87.2 billion. Since the beginning of the year, volume decreased by PLN 0.5 billion (i.e. 0.6%) as a result adepressed stock exchange (decrease of volume of the assets managed by PKO TFI by 27.5% since the beginning ofthe year, along with an increase in deposit volumes by 5.7% since the beginning of the year).
Table 10 Deposits of PKO BP SA and assets managed by PKO TFI (in PLN million)4
Items As at As at As at
30.06.2008 31.12.2007** 30.06.2007** 31.12.2007 30.06.2007Client deposits, of which:
- retail and private banking 58 269 53 767 54 139 8.4% 7,6%- small and medium entities 6 677 6 958 5 694 -4,0% 17,3%- mortgage 10 130 10 290 10 176 -1,5% -0,5%
Total deposits 75 077 71 014 70 010 5,7% 7,2%Assets under PKO TFI's management 12 099 16 685 14 563 -27,5% -16,9%Total clients' savings 87 176 87 699 84 573 -0,6% 3,1%Source: Bank’s Management Information and data of PKO TFI
As at
As at 30 June 2008, the gross value of loans and advances to the retail segment of PKO BP SA was PLN 65.1 billionand this was an increase by PLN 7.0 billion (i.e. 12.0%) since the beginning of the year.
Table 11 Gross loans and advances* of PKO BP SA (in PLN million)Items As at As at As at
30.06.2008 31.12.2007** 30.06.2007** 31.12.2007 30.06.2007Gross loans and advances*), of which:
- retail and private banking 17 679 16 414 14 842 7.7% 19.1%- small and medium entities 8 372 6 907 5 764 21.2% 45.2%- mortgage banking 33 880 30 299 26 156 11.8% 29.5%- housing market (including supported by state
budget)5 150 4 467 3 551 15.3% 45.0%
Total 65 081 58 087 50 313 12.0% 29.4%Source: Bank’s Management Information and data of PKO TFI* without interest due and interest not due** data for the year of 2007 restated for comparative purposes
As at
3 According to Bank’s Management information4 In the year of 2007 resegmentation of corporate deposits took place where a portion of corporate deposits was moved to small and mediumenterprises category. The shift did not have a significant impact on the data presented.
Retail segment result
30.06.2007 30.06.2008
1 309,2
2 014,253,8%

Translation of Interim Financial Statements of the PKO BP SA Group for the 2nd quarter of 2008The Polish language original should be referred to in matters of interpretation
26
Table 12 Accounts and payment cards of PKO BP SA (in thousands of units)
31.12.2007 30.06.2007Total number of accounts, of which: 6 269 6 207 6 134 62 135
Current and savings accounts 5 591 5 548 5 506 43 85Inteligo current accounts 678 659 627 19 50
Total number of banking cards, of which: 7 397 7 296 7 156 101 241Credit cards 1 042 1 010 972 32 70
Change since:Items
As at30.06.2008
As at31.12.2007
As at30.06.2007
Table 13 Branches and ATMs of PKO BP SA
31.12.2007 30.06.2007Total number of branches 1 219 1 233 1 233 (14) (14)- Retail Market Area: 1 151 1 150 1 150 1 1
Regional Retail Branches 12 12 12 - -Independent branches 574 574 574 - -Subordinated branches 565 564 564 1 1
Number of ATM's 2 266 2 106 2 088 160 178
Change since:Items
As at30.06.2008
As at31.12.2007
As at30.06.2007
Table 14 New products of PKO BP SA in the retail segment in the 2nd quarter of 2008.Product Product's characteristics
Indian BondsFrom 18 March to 4 April 2008 the Bank offered 2-year Indian Bonds ('Obligacje Indyjskie Tygrys gospodarczy'). Theproduct gives an investor an opportunity to invest in shares of the eight most popular Indian companies listed on BSESENSEX 30. Payment of initial capital at maturity is guaranteed.
Guaranteed ProfitThe product ('Gwarantowany Zysk') was offered from 27 March to 17 April 2008 in co-operation with PZU Życie SA. This isa group endowment policy.
Energy BondsFrom 28 May to 18 June 2008 the Bank offered 2-year structured Energy Bonds ('Obligacje Energetyczne') listed onWarsaw Stock Exchange with a minimum subscription of PLN 20,000. The interest rate on the bonds is dependant upon anincrease in the value of a portfolio of four main sources of energy.
Olympic DepositFrom 24 June to 24 July 2008 the Bank offered a 16-month structured deposit marketed under the name Olympic Deposit('Lokata Olimpijska'). The interest rate depends on EUR/PLN exchange rate throughout the life of the placement.
eBankingThe Bank has increased the offer of deposits for retail clients, offering savings accounts as a part of the Inteligo account.The product offers an interest rate which is dependent on the size of the initial investment with a maximum limit of 5.3%.The product has been offered since 23 April 2008. The account is accessed by website and phone.

Translation of Interim Financial Statements of the PKO BP SA Group for the 2nd quarter of 2008The Polish language original should be referred to in matters of interpretation
27
3.2.2.2 Activities of the PKO BP SA Group’s entities in the retail segment
Table 15 Activities and achievements of the PKO BP SA Group’s entities in the retail segment in the 2nd quarter of 2008
SUBSIDIARY SIGNIFICANT EVENTS OF THE 2ND QUARTER OF 2008
PKO TowarzystwoFunduszy
Inwestycyjnych SA
1. The value of the funds' assets managed by PKO Towarzystwo Funduszy Inwestycyjnych SA amounted to PLN 12.1billion at the end of the 2nd quarter of 2008, which is a decrease of 11.56% as compared to the end of the 1st quarter of2008.2. PKO TFI SA has a 12.4% share in the investment funds market (share increase by 2.0 pp. y/y), which is the thirdlargest market share.3. The Annual General Meeting approved a distribution of dividends for the year 2007 in the gross amount of PLN 123million, including PKO BP SA dividends to PKO BP SA in the gross amount of PLN 92.25 million.
KREDOBANK SA
1. Total assets of KREDOBANK SA in the 2nd quarter increased by PLN 146.6 million, i.e. 6.2 % and as at 30 June2008 amounted to PLN 2 349.2 million (UAH 5 039.0 million).2. The Bank's loan portfolio (gross) in 2nd quarter increased by PLN 148.9 million, i.e. 8.7% and as at 30 June 2008amounted to PLN 1 853.9 million (UAH 3 976.5 million).3. Clients' term deposits in the 2nd quarter increased by PLN 52,1 million, i.e. 4.7% and as at 30 June 2008 amounted toPLN 1 172.4 million (UAH 2 514.9 million).4. At the end of 30 June 2008, the outlets network of KREDOBANK SA consisted of 26 branches and 156 subordinatedbranches in 21 out of 24 Ukrainian districts and in the Independent Republic of the Crimea. During the 2nd quarter, thenetwork increased by 1 department and 3 branches.5. In the 2nd quarter of 2008 KREDOBANK SA received from PKO BP SA a subordinated loan in the amount of USD 10million and two revolving loans in the total amount of USD 31 million. The financial information of KREDOBANK SA as at30 June 2008 was recalculated according to the average NBP exchange rate prevailing as at June 30 2008 (1UAH =PLN 0.4662).
PowszechneTowarzystwoEmerytalne
BANKOWY SA
1. At the end of the 2nd quarter of 2008, the value of assets of Bankowy OFE, under PTE BANKOWY managementamounted to PLN 4 071 million, which is a decrease of PLN 111 million as compared to the end of the 1st quarter of2008. The decrease in Bankowy OFE's net assets value was mainly caused by a decrease in share values on theWarsaw Stock Exchange.2. At the end of June of 2008, the position of the Bankowy OFE in the pension fund market remained unchanged (8thposition in respect of OFEs' assets value and 9th position in respect of the number of active member accounts).
Inteligo FinancialServices SA
1. At the end of the 2nd quarter of 2008, the Company enabled access to electronic bank systems for 2.3 million of PKOBP SA customers using iPKO services2. Within the Inteligo account offer, the Company serviced over 597 thousand clients. The number of customers havingInteligo accounts increased in the 2nd quarter by 6 thousand.3. At the end of June of the current year, Inteligo customers' deposits amounted to PLN 2 198 million and increased byPLN 78 million as compared to the end of March 2008.4. On 8 April 2008, the Company signed a contract with Polska Telefonia Cyfrowa Sp. z o.o. regarding cooperation onoffering telecommunication services.
CentrumElektronicznych
Usług PłatniczycheService SA
1. In the 2nd quarter of 2008, transactions with a total value of PLN 4 630 million were generated in the use of eServiceSA terminals.2. In terms of value of card transactions (including cash withdrawals), the Company's market share amounted toapproximately 28.3% at the end of June of the current year (as estimated by the Company).3. The number of terminals installed at the end of the 2nd quarter amounted to 49 077 units, which constitutes a 5.4%increase as compared to the end 1st quarter 2008.4. In terms of installed terminals, company's market share amounted to 29% (as estimated by the Company).
PKO InwestycjeSp. z o.o.
1. In the 2nd quarter of 2008, PKO Inwestycje Sp. z o.o., with the use of SPV, continued implementation of investmentprojects, including:- the 'Nowy Wilanów' project in Warsaw through the company Wilanów Investments Sp. z o.o.,- the 'Neptun Park' project in Gdansk through the company POMERANKA Sp. z o.o.,- the 'Kuzminska' project in Kiev in Ukraine through the company UKRPOLINWESTYCJE Sp. z o.o.,- the 'Osiedle Jantar' project in Miedzyzdroje conducted by the company ARKADIA Inwestycje Sp. z o.o. and startednew projects, of which:- the 'Osiedle Siemienskiego' project in Rzeszów through the company WISŁOK Inwestycje Sp. z o.o.,- the 'Osiedle Bakowo' project in Baków near Gdansk through the company Baltic Dom 2 Sp. z o.o.2. The company Fort Mokotów Sp. z o.o. continued warranty services for the completed project 'Marina Mokotów'.3. On 7 March 2008, the extraordinary Meeting of the shareholders ARKADIA Inwestycje Sp. z o.o. decided to increasethe Company's share capital by PLN 1.5 million by issuing new shares, which will be held by PKO Inwestycje Sp. z o.o.(in June and July 2008)4. On 23 June 2008 WISŁOK Inwestycje Sp. z o.o. partners resolved to recommend an increase in the Company'scapital by PLN 2 million. The additional capital contribution attributable to PKO Inwestycje Sp. z o.o. equals PLN 1.6million. The increase will take place in the 3rd quarter of 2008.

Translation of Interim Financial Statements of the PKO BP SA Group for the 2nd quarter of 2008The Polish language original should be referred to in matters of interpretation
28
3.2.3 Corporate segment
The result of the corporate segment decreased by PLN 52.1 million, i.e. 36.5% (y/y) and was accompanied by a 15.2%1H’08/2007 increase in segment assets and a 14.7% 1H’08/2007 increase in segment liabilities. The changes weredetermined by a significant increase in the net impairment charge for corporate loan losses.
3.2.3.1 Activities of PKO BP SA in the corporate segment
Table 16 Gross loans and advances* and deposits of PKO BP SA (in PLN million)4
31.12.2007 30.06.2007Gross corporate loans*) 20 659 17 974 16 466 14.9% 25.5%Corporate deposits 15 493 13 542 12 154 14.4% 27.5%
Source: management data PKO BP S.A.*without interest due and interest not due
Change since:Items
As at30.06.2008
As at31.12.2007
As at30.06.2007
Table 17 Branches and ATM’s of PKO BP SA
31.12.2007 30.06.2007Total number of branches 1219 1233 1233 -14 -14- Corporate Market Area: 68 83 83 -15 -15
Regional Corporate Branches 13 13 13 0 0
Corporate Client Teams 0 0 0 0 0Corporate Centers 55 70 70 -15 -15
Number of ATM's 2266 2106 2088 160 178
Change since:Items
As at30.06.2008
As at31.12.2007
As at30.06.2007
Table 18 Activities and achievements of PKO BP SA in the corporate segment in the 2nd quarter of 2008Scope
of activityActivity
Loan activityThe Bank organized 2 bilateral loans, which amounted in total to PLN 383.95 million and 2 consortiumloans in the amount of PLN 256.22 million (the Bank's share). At the same time, the Bank granted a bankguarantee in the amount of PLN 130.45 million.
Issue ofnon-treasury
debt securities
The Bank signed 4 contracts for the issue of municipal debt securities in the total amount of PLN 33.1million and a consortium contract for the issue of corporate debt securities, without underwriting the issuein the amount of PLN 400 million (The Bank's participation is PLN 200 million).
Cooperation withbanks and financial
institutions
1. The Bank signed 2 general contracts and 3 appendices to previously signed general agreements fortransations with domestic financial institutions involving debt securities transactions2. The Bank signed a contract and 1 appendix with a domestic financial institution for granting depositaryservices in relation to debt securities not admitted to trading on any regulated market.
Corporate segment result
143,0
90,8
30.06.2007 30.06.2008
-36.5%

Translation of Interim Financial Statements of the PKO BP SA Group for the 2nd quarter of 2008The Polish language original should be referred to in matters of interpretation
29
International cooperation
The Bank completed:- 3 nonrevolving loan contracts to an entity directly related with the Bank (which operates within the banking
sector) for the total amount of USD 41 million;- an ISDA contract and an appendix to the previously signed ISDA contract with a foreign bank and 3 credit
support annexes to the previously signed ISDA contracts;- a deposit contract with a foreign bank and a contract for checks servicing.
3.2.3.2 Activities of the PKO BP SA Group entities in the corporate segment
Table 19 Activities and achievements of the PKO BP SA Group entities in the corporate segment
SUBSIDIARY SIGNIFICANT EVENTS OF THE 2ND QUARTER OF 2008
Bankowy FunduszLeasingowy SA
1. In the 2nd quarter of 2008, the BFL SA Group's entities leased out a total net value of assets amounting to PLN 497million.The total value of assets leased out in the 2nd quarter of 2008 was PLN 781.9 million2. The total carrying value of the lease investments of the BFL SA Group's entities amounted to PLN 1 874 million at theend of the 2nd quarter of 2008 and increased by 9.0% as compared to the end of March 2008.3. On 16 May 2008 the extraordinary Shareholders Meeting of BFL SA Group decided to increase Company's sharecapital by PLN 30 million by issuing new shares, which will be held by PKO BP SA. As at the end on June the sharecapital increase had not been registered by the registrar of companies.
3.2.4 Investment segment
The Bank’s operations on the money markets in the 2nd quarter 2008 were determined by an unfavorable situation onthe treasury securities market. The unfavorable situation was further exacerbated by a lack of demand from foreignfinancial institutions, which suffered from liquidity problems. The Bank’s investment policy in the 2nd quarter had adefensive character and the decrease of portfolio income was neutralized by hedge transactions.
Investment segment result
30.06.2007 30.06.2008
570.4
663.5
16.3%

Translation of Interim Financial Statements of the PKO BP SA Group for the 2nd quarter of 2008The Polish language original should be referred to in matters of interpretation
30
Table 20 Activities and achievements of PKO BP SA in the investment segment in the 2nd quarter of 2008
3.2.4.1 Activities of the PKO BP SA Group entities in the investment segment
Table 21 Activities of the PKO BP SA Group entities in the investment segmentSUBSIDIARY SIGNIFICANT EVENTS OF THE 2ND QUARTER OF 2008
BankoweTowarzystwoKapitałowe SA
At the end of the 2nd quarter of 2008, BTK SA managed an investment of PLN 6.5 million, in the FINDER SA company.
3.2.5 Other areas of activity
Table 22 Other area activities of the PKO BP SA Group entitiesSUBSIDIARY SIGNIFICANT EVENTS OF THE 2ND QUARTER OF 2008
Centrum FinansowePuławska Sp. z o.o.
1. As at 30 June 2008, the Company rented 100% of the office and commercial area in the managed building CentrumFinansowe Puławska, of which 90.7% was rented by PKO BP SA Group entities. As compared to the end of 1st quarter of2008, the rental of office and commercial area increased by 1.5%.2. A shareholders meeting agreed to a distribution of dividends in the gross amount of PLN 16.6 million
Investment activity Activity
financial riskmanagement
In the interests of financial risk management, the Bank entered into transations which aimed atbalancing interest rate, currency and liquidity risks. In the previous quarter, the Bank gained fundsin CHF (with the use of CIRS transations). The Bank's long-term liabilities denominated in CHFincreased to the level of CHF 5.3 billion.
interbank marketThe Bank achieved one of the top positions in a ranking organised by the Department of Financefor non-treasury securities dealers as a result of a high level of dealing turnover on interbankinterest rate and currency markets.
IPO market
1. In the 2nd quarter the Bank finalized a subscripton of the Tygrys Gospodarczy bonds andcarried out a subscripton for the Energetyczne bonds. The issuer is Barclays Bank and abrokerage house, Dom Maklerski PKO BP. PKO BP is a co-ordinator. The total value of thestructured bonds placed amounts to over PLN 65 million.2. The Bank managed a subscripton for the shares of: SELENA FM S.A., SONEL S.A. orazZakładów Azotowych TARNÓW w Mościcach S.A.Total subscriptions for these issues exceeded198 million PLN.
NewConnect market
The Bank, as a market maker on the NewConnect market, is in terms of number of clientsserviced in first position (27 clients at 30.06.2008, 5 more than at the end of March 2008), andexecuted turnover of PLN 25.5 million in the second quarter in the NewConnect stock market,which represents 4th position on the market.
futures contractmarket
In the 2nd quarter of 2008 the Bank executed 173.1 thousand future contracts which was 80thousand units fewer than in the 1st quarter of the current year - giving 8th position on the market.
option market
In the 2nd quarter of 2008 the Bank's turnover decreased by 11 thousand units to the level of 14thousand - giving the Bank 3rd position with an 11.6% share on the market. There was a 30%decrease in turnover (i.e. by 54 thousand units to the level of 121.2 thousand units) on theoptions market in the 2nd quarter of 2008 compared to the 1st quarter.
bond marketIn the second quarter of 2008 the Banks bond turnover reached PLN 373.4 mln or 52.3% of thetotal market. This- despite being 13.5% lower than in the first quarter enabled the bank to retainthe leading market position
Treasuryactivities
Brokerageactivities

Translation of Interim Financial Statements of the PKO BP SA Group for the 2nd quarter of 2008The Polish language original should be referred to in matters of interpretation
31
4 ADDITIONAL INFORMATION
4.1 ACCOUNTING POLICIES APPLIED IN THE PREPARATION OF THE FINANCIAL STATEMENTS
The accounting policies applied in the 2nd quarter of 2008 do not differ from those applied in prior quarters. Thesepolicies were described in detail in the financial statements of PKO BP SA for the year of 2007. When preparing theconsolidated quarterly report, the Bank applied the following regulations:
1. International Financial Reporting Standards issued by the International Accounting Standards Board (IASB)and Interpretations issued by International Financial Reporting Interpretations Committee (IFRIC),
2. International Accounting Standard No. 34 „Interim Financial Reporting”,3. Decree of the Minister of Finance dated 19 October 2005 on current and periodic information issued by the
issuers of securities (Journal of Laws, No. 209, item 1744).
4.2 COMPARATIVE INFORMATION – CHANGES IN PRESENTATIONThe following table shows significant changes in the presentation of prior period comparative information compared tothat originally published.
Table 23 Financial data of PKO BP SA Group
Items
2 quarters;period from
01.01.2007 to30.06.2007previouslypresented
2 quarters;period from
01.01.2007 to30.06.2007
comparativedata
Difference
3 027 781 3 028 154 373 1)
(919 803) (907 009) 12 794 1)
1 417 814 1 432 445 14 631 1)
(308 453) (340 898) (32 445) 1) 3)
Net income from financial instruments designated at fair value 21 495 21 365 (130) 1) 2)
278 473 227 164 (51 309) 1) 2) 4)
(157 557) (161 836) (4 279) 1) 2)
Administrative expenses (1 891 711) (1 831 346) 60 365 3) 4)
1) Change in presentation of selected income and costs of a brokerage house, Dom Maklerski2) Change in presentation of selected income and costs related to financial operations3) Change in presentation of fees related to KIR, BIK and SWiFT services4) Change in presentation of costs / revenues related to charging mobile phones
Other operating incomeOther operating expenses
INCOME STATEMENT OFPOWSZECHNA KASA OSZCZĘDNOŚCI BANK POLSKI S.A. GROUP
Interest incomeInterest expenseFee and commission incomeFee and commission expense
Table 24 Financial data of PKO BP SA
Items
2 quarters;period from
01.01.2007 to30.06.2007
previously presented
2 quarters;period from
01.01.2007 to30.06.2007
comparative data
Difference
2 881 590 2 881 963 373 1)
(841 207) (828 413) 12 794 1)
1 252 645 1 267 276 14 631 1)
(271 450) (303 895) (32 445) 1) 3)
Net income from financialinstruments designated at fair value 19 467 19 337 (130)
1) 2)
76 511 62 148 (14 363) 1) 2)
(41 783) (46 062) (4 279) 1) 2)
Administrative expenses (1 736 881) (1 713 462) 23 419 3)
1) Change in presentation of selected income and costs of a brokerage house, Dom Maklerski2) Change in presentation of selected income and costs related to financial operations3) Change in presentation of fees related to KIR, BIK and SWiFT services
Fee and commission expense
Other operating incomeOther operating expenses
INCOME STATEMENT OFPOWSZECHNA KASA OSZCZĘDNOŚCI BANK POLSKI S.A.
Interest incomeInterest expense
Fee and commission income
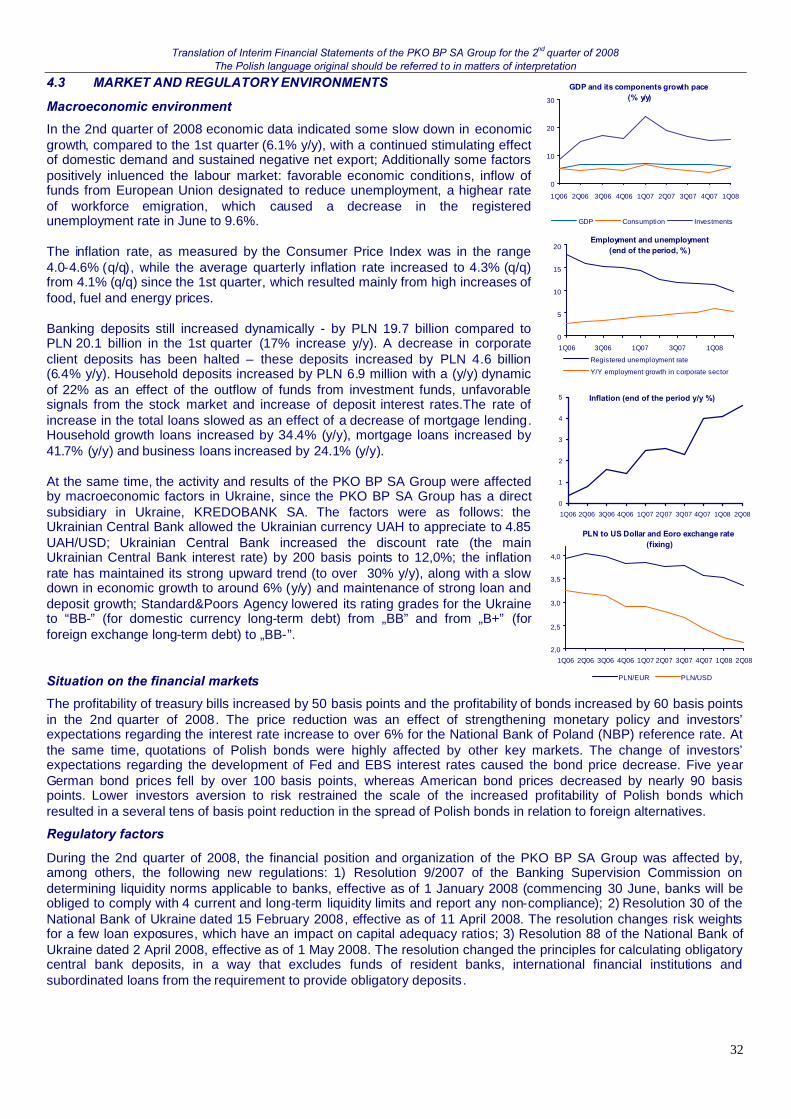
Translation of Interim Financial Statements of the PKO BP SA Group for the 2nd quarter of 2008The Polish language original should be referred to in matters of interpretation
32
4.3 MARKET AND REGULATORY ENVIRONMENTS
Macroeconomic environment
In the 2nd quarter of 2008 economic data indicated some slow down in economicgrowth, compared to the 1st quarter (6.1% y/y), with a continued stimulating effectof domestic demand and sustained negative net export; Additionally some factorspositively inluenced the labour market: favorable economic conditions, inflow offunds from European Union designated to reduce unemployment, a highear rateof workforce emigration, which caused a decrease in the registeredunemployment rate in June to 9.6%.
The inflation rate, as measured by the Consumer Price Index was in the range4.0-4.6% (q/q), while the average quarterly inflation rate increased to 4.3% (q/q)from 4.1% (q/q) since the 1st quarter, which resulted mainly from high increases offood, fuel and energy prices.
Banking deposits still increased dynamically - by PLN 19.7 billion compared toPLN 20.1 billion in the 1st quarter (17% increase y/y). A decrease in corporateclient deposits has been halted – these deposits increased by PLN 4.6 billion(6.4% y/y). Household deposits increased by PLN 6.9 million with a (y/y) dynamicof 22% as an effect of the outflow of funds from investment funds, unfavorablesignals from the stock market and increase of deposit interest rates.The rate ofincrease in the total loans slowed as an effect of a decrease of mortgage lending.Household growth loans increased by 34.4% (y/y), mortgage loans increased by41.7% (y/y) and business loans increased by 24.1% (y/y).
At the same time, the activity and results of the PKO BP SA Group were affectedby macroeconomic factors in Ukraine, since the PKO BP SA Group has a directsubsidiary in Ukraine, KREDOBANK SA. The factors were as follows: theUkrainian Central Bank allowed the Ukrainian currency UAH to appreciate to 4.85UAH/USD; Ukrainian Central Bank increased the discount rate (the mainUkrainian Central Bank interest rate) by 200 basis points to 12,0%; the inflationrate has maintained its strong upward trend (to over 30% y/y), along with a slowdown in economic growth to around 6% (y/y) and maintenance of strong loan anddeposit growth; Standard&Poors Agency lowered its rating grades for the Ukraineto “BB-” (for domestic currency long-term debt) from „BB” and from „B+” (forforeign exchange long-term debt) to „BB-”.
Situation on the financial markets
The profitability of treasury bills increased by 50 basis points and the profitability of bonds increased by 60 basis pointsin the 2nd quarter of 2008. The price reduction was an effect of strengthening monetary policy and investors’expectations regarding the interest rate increase to over 6% for the National Bank of Poland (NBP) reference rate. Atthe same time, quotations of Polish bonds were highly affected by other key markets. The change of investors’expectations regarding the development of Fed and EBS interest rates caused the bond price decrease. Five yearGerman bond prices fell by over 100 basis points, whereas American bond prices decreased by nearly 90 basispoints. Lower investors aversion to risk restrained the scale of the increased profitability of Polish bonds whichresulted in a several tens of basis point reduction in the spread of Polish bonds in relation to foreign alternatives.
Regulatory factors
During the 2nd quarter of 2008, the financial position and organization of the PKO BP SA Group was affected by,among others, the following new regulations: 1) Resolution 9/2007 of the Banking Supervision Commission ondetermining liquidity norms applicable to banks, effective as of 1 January 2008 (commencing 30 June, banks will beobliged to comply with 4 current and long-term liquidity limits and report any non-compliance); 2) Resolution 30 of theNational Bank of Ukraine dated 15 February 2008, effective as of 11 April 2008. The resolution changes risk weightsfor a few loan exposures, which have an impact on capital adequacy ratios; 3) Resolution 88 of the National Bank ofUkraine dated 2 April 2008, effective as of 1 May 2008. The resolution changed the principles for calculating obligatorycentral bank deposits, in a way that excludes funds of resident banks, international financial institutions andsubordinated loans from the requirement to provide obligatory deposits.
GDP and its components growth pace(% y/y)
0
10
20
30
1Q06 2Q06 3Q06 4Q06 1Q07 2Q07 3Q07 4Q07 1Q08
GDP Consumption Investments
Employment and unemployment(end of the period, %)
0
5
10
15
20
1Q06 3Q06 1Q07 3Q07 1Q08
Registered unemployment rate
Y/Y employment growth in corporate sector
Inflation (end of the period y/y %)
0
1
2
3
4
5
1Q06 2Q06 3Q06 4Q06 1Q07 2Q07 3Q07 4Q07 1Q08 2Q08
PLN to US Dollar and Eoro exchange rate(fixing)
2,0
2,5
3,0
3,5
4,0
1Q06 2Q06 3Q06 4Q06 1Q07 2Q07 3Q07 4Q07 1Q08 2Q08
PLN/EUR PLN/USD

Translation of Interim Financial Statements of the PKO BP SA Group for the 2nd quarter of 2008The Polish language original should be referred to in matters of interpretation
33
4.4 THE STRUCTURE OF THE PKO BP SA GROUP
4.4.1 Consolidated entities
Included in the consolidated financial statements is the Bank – the parent company of the PKO BP SA Group and itssubsidiaries as defined in IAS 27 „Consolidated and separate financial statements”.
Table 25 Entities included in the consolidated financial statements of the PKO BP SA GroupValue of
investment*PLN thousand
1
2 KREDOBANK SA 307 364 98,1815 full method
3 Powszechne Towarzystwo Emerytalne BANKOWY SA 205 786 100 full method
4 Centrum Finansowe Puławska Sp. z o.o. 128 288 100 full method
5 PKO Inwestycje Sp. z o.o. 117 813 100 full method
6 PKO Towarzystwo Funduszy Inwestycyjnych SA 69 055 75 full method
7 Inteligo Financial Services SA 59 602 100 full method
8 Centrum Elektronicznych Usług Płatniczych eService SA 55 500 100 full method
9 Bankowy Fundusz Leasingowy SA 40 000 100 full method
10 Bankowe Towarzystwo Kapitałowe SA 18 566 100 full method
11 Wilanów Investments Sp. z o.o. 82 981 100 full method
12 POMERANKA Sp. z o.o. 19 000 100 full method
13 ARKADIA Inwestycje Sp. z o.o. 6 075 100 full method
14 Baltic Dom 2 Sp. z o.o. 6 009 50 full method
15 Fort Mokotów Sp. z o.o. 2 040 51 full method
16 UKRPOLINWESTYCJE Sp. z o.o. 519 55 full method
17 WISŁOK Inwestycje Sp. z o.o. 400 80 full method
18 Finanse Agent Transferowy Sp. z o.o. 4 361 100 full method
19 Bankowy Leasing Sp. z o.o. 1 309 100 full method
20 BFL Nieruchomości Sp. z o.o. 1 109 100 full method
Subsidiaries of PKO Inwestycje Sp. z o.o.
Subsidiaries of PTE BANKOWY S.A.
Subsidiaries of Bankowy Fundusz Leasingow y S.A.
* included in this item is the value of stocks and shares at purchase price and the specific capital contributions made
No. Entity name Share capital (%)Consolidation
method
Parent company
Powszechna Kasa Oszczędności Bank Polski Spółka Akcyjna
Direct subsidiaries
Indirect subsidiaries

Translation of Interim Financial Statements of the PKO BP SA Group for the 2nd quarter of 2008The Polish language original should be referred to in matters of interpretation
34
Additionally, the following jointly controlled and associated entities have been included in the consolidated financialdata using the equity method.
Table 26 Other subordinated entities included in the consolidated financial statements using the equity methodValue of
investment*PLN thousand
1 CENTRUM HAFFNERA Sp. z o.o. 44 371 49.43 equity method
2 Centrum Obsługi Biznesu Sp. z o.o. 17 498 41.44 equity method
3 Sopot Zdrój Sp. z o.o. 58 923 100 equity method
4 Promenada Sopocka Sp. z o.o. 10 058 100 equity method
5 Centrum Majkowskiego Sp. z o.o. 6 609 100 equity method
6 Kamienica Morska Sp. z o.o. 976 100 equity method
7 Bank Pocztowy SA 146 500 25.0001 equity method
8 Kolej Gondolowa Jaworzyna Krynicka SA 15 531 37.53 equity method
9 Ekogips SA – w upadłości 5 400 60.26 equity method
10 Poznański Fundusz PoręczeńKredytowych Sp. z o.o. 1 500 33.33 equity method
11 Agencja Inwestycyjna CORP SA 29 22.31 equity method
12 FINDER SA 6 500 46.43 equity method
Associates
Associate of Bankowe Towarzystwo Kapitałowe S.A.
* included in this item is the value of stocks and shares at purchase price and the specific capital contributions made
No. Entity name Share capital (%)Consolidation
method
Jointly controlled entities
Subsidiaries of CENTRUM HAFFNERA Sp. z o.o.
4.4.2 Changes in the group structure
In the 2nd quarter of 2008, the structure of PKO BP SA capital relationships was affected by a fact that PKO BP SAdecreased its capital share in PKO Inwestycje Sp. z o.o., its direct subsidiary. On 30 June 2008 PKO Inwestycje Sp. zo.o. returned a temporary capital injection previously received from PKO BP SA for the realization of investmentprojects in the amount of PLN 5.5 million.
4.4.3 Related party transactions
In the 1st quarter of 2008, PKO BP SA provided the following services to its related parties (subordinated entities) atarms’ length: keeping bank accounts, accepting deposits, extending loans and advances, issuing debt securities,providing guarantees and conducting spot foreign exchange transactions.
Details of related party transactions of PKO BP SA with a total value exceeding the PLN equivalent of EUR 500thousand and not relating to current business activities of the Bank, are presented in point 5 of this Report.

Translation of Interim Financial Statements of the PKO BP SA Group for the 2nd quarter of 2008The Polish language original should be referred to in matters of interpretation
35
5. OTHER INFORMATION
Identification dataPKO BP SA, with its registered Head Office in Warsaw at 15 Puławska Street, has been entered in the Register ofEntrepreneurs of the National Court Register kept by the District Court in Warsaw, Entry No. KRS 0000026438. TheCompany was granted statistical number (REGON) 016298263 and tax identification number (NIP) 525-000-77-38.
Seasonality or cyclical nature of activities in the reporting periodPKO BP SA is a universal bank, which provides services on the territory of Poland, and thus its activities are exposedto similar fluctuations to those affecting the entire Polish economy. The activities of other companies of the PKO BPSA Group similarly do not show any particular seasonality or cyclical nature.
Prizes and awardsAwards and distinctions granted to PKO BP SA in the 2nd quarter of 2008:1. 1st place, in the ranking of the 50 biggest Polish banks, organized by the “Bank” magazine - for the best financial
results,2. “The Donor of the Year” award for long-term and generous support of the “Artificial Heart Development Program”
(including Inteligo Financial Services SA);3. “A Diamond” to the Polish Business Leader Gold Statuette granted at the BCC Summer Gala;4. “Brand of the best reputation 2008” received in the Finance category, granted by the Independent Polish Brands
Reputation Ranking;5. For the eighth time, the “Dlaczego” magazine and students website www.korba.pl granted the Bank a prize for the
most popular products and brands. The Bank won awards in two categories: “the bank for students”, and “studentemployer”.
Issuance, redemption and repayment of debt and equity securitiesWithin the PKO BP SA Group, there are two entities which raise capital through the issue of debt securities: BankowyFundusz Leasingowy SA and KREDOBANK SA.
In the 2nd quarter of 2008, Bankowy Fundusz Leasingowy SA decreased the amount of its debt under the bonds issueprogramme to PLN 545 million (i.e. by 5 million) using its liquid funds to redeem its maturing bonds. In the 2nd quarterof 2008 Bankowy Fundusz Leasingowy SA issued 10 000 bonds with the total nominal value of PLN 100 million andredeemed 10 500 bonds at the nominal value of PLN 105 million.
On 27 June 2008 KREDOBANK SA commenced an issue of bonds with the total nominal value of UAH 50.75 millionand maturity on 27 June 2013. Funds from the issue will be used for long-term financing of corporate entities. As at 30June 2008 the process of distribution of bonds to investors has not been completed.
Events that occurred after the date on which the report was prepared and that may affect futurefinancial results1. On 4 July 2008, PKO BP SA, according to an agreement dated 27 June 2008 with Svenska Standardbolag AB
(registered in Sweden), made payment for the purchase of 5000 shares of Aktiebolaget Grundstenen 108756registered in Sweden. The purchased shares represent 100% of the Company’s capital share and entitles PKO BPSA to 100% of the votes in the Company. The purchase price with additional expenses amounted to SEK504 969.00 (PLN 178 910.52) (according to the average exchange rate of NBP on 4 July 2008). On 17 July 2008the Swedish Company Register registered Aktiebolaget Grundstenen 108756 as PKO Finance AB.
2. On 15 July 2008, PKO BP SA resolved to initiate an euro-bonds issue programme (the EMTN programme) throughthe use of its subordinate entity PKO Finance AB (previous name Aktiebolaget Grundstenen 108756) withheadquarters in Sweden (“Issuer”). PKO BP SA is the only shareholder. The issuer is a related party as defined bythe Polish Accounting Act.The EMTN programme will be carried out according to the following conditions:- Programme value: EUR 3 000 000 000 or its equivalent in other currencies;- Programme currencies: EUR, USD and CHF;- Redemption of particular tranches: 1 year to 15 years;- Funds obtained from the issue will be used for the Bank’s general financial purposes, including liquidity capital
needs;- Interest rate: fixed, floating or tied to selected indices;- Interest period: 1 month to 1 year;- The nominal value of one bond will not be less than EUR 50 000 or its equivalent in other currency;- Types of issue: senior, minor, public, and nonpublic (so called: private placement);

Translation of Interim Financial Statements of the PKO BP SA Group for the 2nd quarter of 2008The Polish language original should be referred to in matters of interpretation
36
- Place of programme registration: Stock Exchange in Luxembourg;- Settlement type between the Issuer and the Bank: the Issuer will give the Bank a loan in the amount of funds
obtained from the issue and at the rate equaling the rate of the issue. The settlement will be made by anintermediary (settlement agent) after the Bank’s approval, using accounts exclusively dedicated to the issuesettlements;
- The Issuer will generate remuneration for administrative services granted in respect of the programme, asdefined in the agreement.
On July 16 2008 the Supervisory Board of PKO BP SA gave its consent to the signing of an agreement between theBank and the Issuer. The consent was a crucial element for the initiation of the EMTN programme.
Shareholders holding, directly or indirectly, at least 5% of votes at the General Shareholders’ MeetingThe interim report for the 1st quarter of 2008 was submitted to the Polish Financial Supervision Authority (KNF) on 8May 2008.
To the best knowledge of the Bank, the only shareholder holding, directly or indirectly, at least 5% of total votes at theGeneral Shareholders’ Meeting of the Bank is the State Treasury which holds 514 935 409 of the Bank’s shares. Thisequates to 51.49% and matches the percentage share in the total number of votes at the General Shareholders’Meeting of the Bank as at the date of submission of this Report.
Table 27 Ownership structure of PKO BP SA
Shareholder
Percentage of votesat the GeneralShareholders’
Meeting as at thedate of submittingprevious quarterly
report
Number of sharesas at the date of
submitting previousquarterly report
Percentage pointchange from the
date of submittingprevious quarterly
report
Percentage ofvotes at the
GeneralShareholders’
Meeting as at thedate of submitting
this Report
Number of sharesas at the date ofsubmitting this
Report
National Treasury 51.49% 514 935 409 0,00 pp. 51.49% 514 935 409
Changes in the number of PKO BP SA shares held by the Management or Supervisory Board Members
Table 28 Shares held by the PKO BP SA’s Management or Supervisory Board Members as at the date of submitting this Report
No. Name
Number ofshares as atthe date ofsubmittingpreviousquarterly
report
Purchase Disposal
Number ofshares as atthe date ofsubmittingthis Report
I.
1. Jerzy Pruski*, President of the Bank's Management Board x x x -----
2. Bartosz Drabikowski*, Vice-President of the Bank's Management Board x x x -----
3. Krzysztof Dresler*, Vice-President of the Bank's Management Board x x x -----
4. Mariusz Klimczak, Vice-President of the Bank's Management Board ----- ----- ----- -----
5. Tomasz Mironczuk*, Vice-President of the Bank's Management Board x x x -----
6. Wojciech Papierak*, Vice-President of the Bank's Management Board x x x 2500
II.
1. Marzena Piszczek, President of the Bank's Supervisory Board ----- ----- ----- -----
2. Eligiusz Jerzy Krześniak, Vice-President of the Bank's Supervisory Board ----- ----- ----- -----
3. Jan Bossak, member of the Bank's Supervisory Board ----- ----- ----- -----
4. Jerzy Osiatyński, member of the Bank's Supervisory Board ----- ----- ----- -----
5. Urszula Pałaszek, member of the Bank's Supervisory Board ----- ----- ----- -----
5. Roman Sobiecki, member of the Bank's Supervisory Board ----- ----- ----- -----
6. Ryszard Wierzba, member of the Bank's Supervisory Board ----- ----- ----- -----
Management Board
Supervisory Board
* Supervisory Board’s members, who were not members of the Bank’s Supervisory Board at the date of the previous Report’s submission (May 8 2008)Ownership of PKO BP shares at the day of becoming a member of the Bank’s Supervisory Board (date):Jerzy Pruski, President of the Bank's Management Board (20.05.08): did not possess any shares,Bartosz Drabikowski, Vice-President of the Bank's Management Board (20.05.08): did not possess any shares,Krzysztof Dresler, Vice-President of the Bank's Management Board (01.07.08): did not possess any shares,Tomasz Mironczuk, Vice-President of the Bank's Management Board (20.05.08): did not possess any shares,Wojciech Papierak, Vice-President of the Bank's Management Board (01.07.08): possessed 2500 shares.
Information on any transaction or a number of transactions concluded by the issuer or its subsidiary withother Group entities, with a value exceeding Euro 500 000, if they are not typical or routine transactionsIn executing the provisions of the Lease Agreement dated 7 December 1995 (amended by Annexes No. 1 to 38) withthe Bank’s subsidiary, Centrum Finansowe Puławska Sp. z o.o. (“CFP”), in the 2nd quarter of 2008, PKO BP SA madepayments to CFP in the total gross amount of PLN 12.4 million. As at the first half of the year 2008 (January to June)

Translation of Interim Financial Statements of the PKO BP SA Group for the 2nd quarter of 2008The Polish language original should be referred to in matters of interpretation
37
the total amount of payments was PLN 24.1 million. The Agreement determines the terms and conditions for the leaseof space in the building located in Warsaw at 15 Puławska Street. The payments that were made by the Bank relatedto rental fees, maintenance costs and costs of cleaning common space.Due to the comprehensive regulation of all issues connected with cooperation between the parties to the Agreement,the Agreement is not a typical or routine agreement concluded by the parties in the course of their day-to-dayoperations.
Results of changes in the Bank’s structure, including the effects of merger, takeover or disposal of the Groupentities, long-term investments, division, restructuring and discontinuation of activitiesThe results of changes in the Bank’s structure, including the results of merger, takeover or sale of the PKO BP SAGroup entities have been described in point 4.4.2 of this Report.
Factors which may affect future financial performance within at least the next quarterIn subsequent quarters, the results of the Bank and the PKO BP SA Group will be affected by economic processeswhich will take place in the Polish and global economies, as well as by a response of the financial markets to thoseprocesses. The interest rate policy applied by the Monetary Policy Council and by other largest central banks will alsohave a great influence on the Bank’s performance.
Information on guarantees or warranties on loans and advances granted by the Issuer or by the Issuer’ssubsidiary – cumulatively to a single entity or its subsidiary, if the total value of outstanding warranties andguaranties constitutes at least 10% of the Issuer’s net assets.In the 2nd quarter of 2008, PKO BP SA and its subsidiaries did not grant any guarantees or warranties on loans onadvances to a single entity or capital group that would constitute at least 10% of the Bank’s net assets.
Proceedings pending before the court, arbitration tribunal or public administrative authorityAs at 30 June 2008, the total value of court proceedings against the Bank was circa PLN 196 771 thousand, while thetotal value of proceedings initiated by the Bank was circa PLN 55 425 thousand.
No court proceedings with the participation of PKO BP SA are in progress, the value of which amounts to at least 10%of the Bank’s shareholders’ equity.
No other Group entities have conducted any proceedings before court, arbitration tribunal or public administrationauthorities concerning receivables or liabilities, the value of which amounts to at least 10% of the shareholders’ equityof PKO BP SA.
Integrated Information System of PKO BP SAIn the 2nd quarter of 2008 the Bank continued the implementation of the Integrated Information System Application(‘ZSI’). In the 2nd quarter of 2008, the ZSI activities were focused on the development of functionalities in successiveversions of the application.
The most important tasks completed under the ZSI Project in the 2nd quarter of 2008 include the following:- between 25 and 27 April 2008 a new version of the application was initiated;- conversion of 34 units of the Zorba system (in 325 branches and 562 agencies) into the ZSI system took place (2
940 000 accounts were finalized);- conversion trial tests for the implementation of ZSI in the remaining branches took (conversion planned for 3rd
quarter);- the scope and the specific assumptions for the subsequent 3 versions of ZSI, were agreed.
As at the end of 2nd quarter of 2008 the Integrated Information System Application (‘ZSI’) is in use in 604 branchesand 1071 agencies and operates 6.1 million accounts.
Position of the PKO BP SA Management Board in regards to possibility of achieving previously publishedforecastsPKO BP SA did not publish any financial forecasts for 2008.
Information on dividend paid or declaredThe Annual General Meeting decided to a distribution of dividends for the year 2007 in the amount of PLN 1.09 pershare. The list of the shareholders entitled to receive the dividend will be drawn up as at 18 August 2008, and thedividends will be paid out on 4 September 2008.

Translation of Interim Financial Statements of the PKO BP SA Group for the 2nd quarter of 2008The Polish language original should be referred to in matters of interpretation
38
Other disclosures significant for evaluation of the issuer’s human resources, financial situation, financialperformance, and any changes therein
1. On 11 April 2008, the Supervisory Board of PKO BP SA appointed Mr. Jerzy Pruski as President of theManagement Board of PKO BP SA, effective as of 20 May 2008, for the common term of the Board beginningon that date. The Supervisory Board appointed Mr. Pruski as the acting President of the Management Boardof PKO BP SA for the period from 20 May 2008 to the date on which the Polish Financial SupervisionCommission approves his appointment as the President of the Management Board of PKO BP SA. On June17 2008 the Polish Financial Supervision Supervision Commission approved his appointment as the Presidentof the Management Board of PKO BP SA.
2. On 17 April 2008, the Supervisory Board of PKO BP SA selected an authorized entity to audit the financialstatements of the Bank. This entity is PricewaterhouseCoopers Sp. z o.o. with its registered office in Warsaw,entered by the National Chamber of Statutory Auditors on the list of entities authorized to audit financialstatements under No. 144. The scope of the contract covers the audit and review of annual and interimfinancial statements of the Bank for the years 2008 -2010.
3. On 20 May 2008, Supervisory Board of PKO BP SA appointed:
Mr. Bartosz Drabikowski as Vice President of the Management Board of PKO BP SA as of 20 May 2008Mr. Mariusz Klimczak as Vice President of the Management Board of PKO BP SA as of 20 May 2008Mr. Tomasz Mironczuk as Vice President of the Management Board of PKO BP SA as of 20 May 2008Mr. Krzysztof Dresler as Vice President of the Management Board of PKO BP SA as of 1 July 2008Mr. Wojciech Papierak as Vice President of the Management Board of PKO BP SA as of 1 July 2008Mr. Mariusz Zarzycki as Vice President of the Management Board of PKO BP SA as of 1 September 2008
According to the related resolution, the above mentioned persons were appointed for the said positions for thecommon term of the Board, beginning on 20 May 2008.
6 August 2008 Danuta Szymańska Director of the Bank ..................................................(signature)