2017 SECOND QUARTER REPORT - stantec.com · contained in our 2017 Second Quarter Report. Our...
70
1 Stantec Inc. 2017 SECOND QUARTER REPORT Three and Six Months Ended June 30, 2017, and 2016
Transcript of 2017 SECOND QUARTER REPORT - stantec.com · contained in our 2017 Second Quarter Report. Our...

1Stantec Inc.
2017 SECOND QUARTER REPORTThree and Six Months Ended June 30, 2017, and 2016
Table of Contents
i Report to Shareholders
Management’s Discussion and AnalysisM–1 Core Business and Strategy
M–2 Results
M–21 Summary of Quarterly Results
M–23 Statements of Financial Position
M–24 Liquidity and Capital Resources
M–27 Other
M–28 Outlook
M–29 Critical Accounting Estimates, Developments, and Measures
M–31 Controls and Procedures
M–31 Risk Factors
M–31 Subsequent Events
M–32 Caution Regarding Forward-Looking Statements
Unaudited Interim Condensed Consolidated Financial StatementsF–1 Consolidated Statements of Financial Position
F–2 Consolidated Statements of Income
F–3 Consolidated Statements of Comprehensive Income (Loss)
F–4 Consolidated Statements of Shareholders’ Equity
F–5 Consolidated Statements of Cash Flows
F–6 Notes to the Unaudited Interim Condensed Consolidated Financial Statements
Creating communities is our purpose. Designing with community in mind is our promise.
We’re active members of the communities we serve. That’s why at Stantec, we always design with community in mind.
The Stantec community unites approximately 22,000 employees working in over 400 locations across 6 continents. We collaborate across disciplines and industries to bring buildings, energy and resource, environmental, water, and infrastructure projects to life. Our work—engineering, architecture, interior design, landscape architecture, surveying, environmental sciences, construction services, project management, and project economics, from initial project concept and planning through to design, construction, commissioning, maintenance, decommissioning, and remediation—begins at the intersection of community, creativity, and client relationships.
Our local strength, knowledge, and relationships, coupled with our world-class expertise, have allowed us to go anywhere to meet our clients’ needs in more creative and personalized ways. With a long-term commitment to the people and places we serve, Stantec has the unique ability to connect to projects on a personal level and advance the quality of life in communities across the globe. Stantec trades on the TSX and the NYSE under the symbol STN. Visit us at stantec.com or �nd us on social media.
i
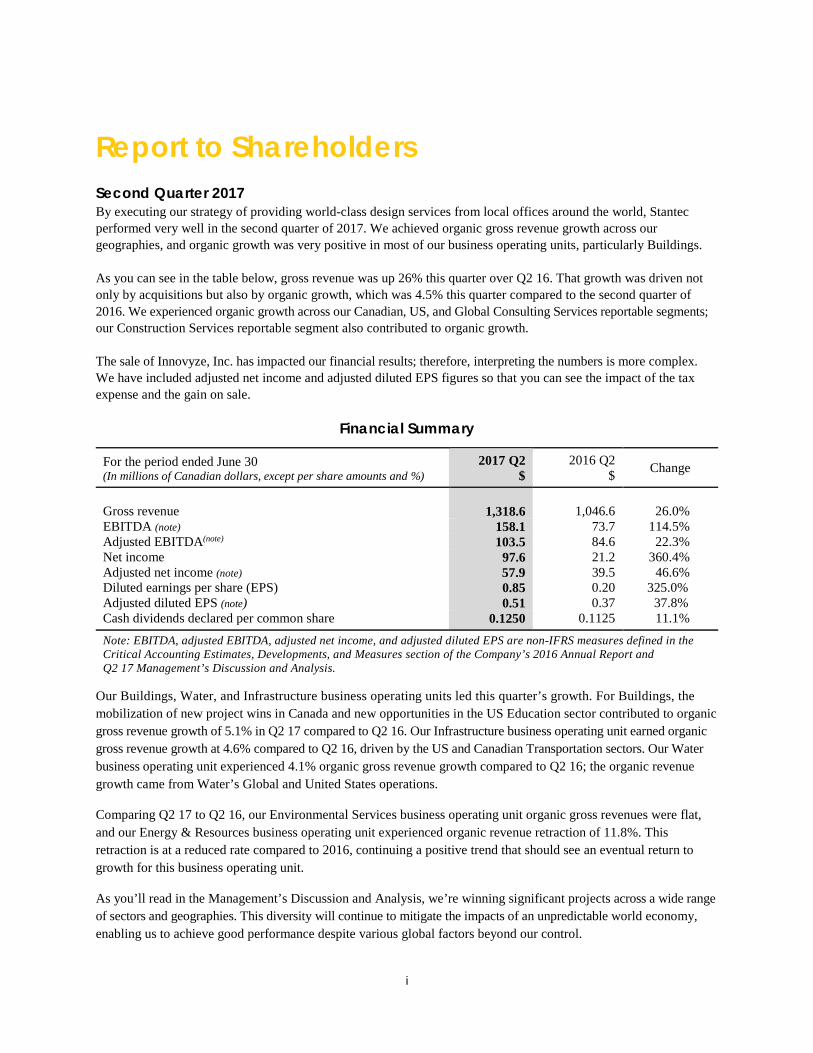
Report to Shareholders Second Quarter 2017 By executing our strategy of providing world-class design services from local offices around the world, Stantec performed very well in the second quarter of 2017. We achieved organic gross revenue growth across our geographies, and organic growth was very positive in most of our business operating units, particularly Buildings. As you can see in the table below, gross revenue was up 26% this quarter over Q2 16. That growth was driven not only by acquisitions but also by organic growth, which was 4.5% this quarter compared to the second quarter of 2016. We experienced organic growth across our Canadian, US, and Global Consulting Services reportable segments; our Construction Services reportable segment also contributed to organic growth. The sale of Innovyze, Inc. has impacted our financial results; therefore, interpreting the numbers is more complex. We have included adjusted net income and adjusted diluted EPS figures so that you can see the impact of the tax expense and the gain on sale.
Financial Summary
For the period ended June 30 (In millions of Canadian dollars, except per share amounts and %)
2017 Q2 $
2016 Q2 $ Change
Gross revenue
1,318.6
1,046.6
26.0%
EBITDA (note) 158.1 73.7 114.5% Adjusted EBITDA(note) 103.5 84.6 22.3% Net income Adjusted net income (note) Diluted earnings per share (EPS) Adjusted diluted EPS (note)
97.6 57.9
0.85 0.51
21.2 39.5
0.20 0.37
360.4% 46.6%
325.0% 37.8%
Cash dividends declared per common share 0.1250 0.1125 11.1%
Note: EBITDA, adjusted EBITDA, adjusted net income, and adjusted diluted EPS are non-IFRS measures defined in the Critical Accounting Estimates, Developments, and Measures section of the Company’s 2016 Annual Report and Q2 17 Management’s Discussion and Analysis.
Our Buildings, Water, and Infrastructure business operating units led this quarter’s growth. For Buildings, the mobilization of new project wins in Canada and new opportunities in the US Education sector contributed to organic gross revenue growth of 5.1% in Q2 17 compared to Q2 16. Our Infrastructure business operating unit earned organic gross revenue growth at 4.6% compared to Q2 16, driven by the US and Canadian Transportation sectors. Our Water business operating unit experienced 4.1% organic gross revenue growth compared to Q2 16; the organic revenue growth came from Water’s Global and United States operations.
Comparing Q2 17 to Q2 16, our Environmental Services business operating unit organic gross revenues were flat, and our Energy & Resources business operating unit experienced organic revenue retraction of 11.8%. This retraction is at a reduced rate compared to 2016, continuing a positive trend that should see an eventual return to growth for this business operating unit.
As you’ll read in the Management’s Discussion and Analysis, we’re winning significant projects across a wide range of sectors and geographies. This diversity will continue to mitigate the impacts of an unpredictable world economy, enabling us to achieve good performance despite various global factors beyond our control.
ii
After almost 30 years at Stantec and almost 9 of those years serving as president and chief executive officer, I will be retiring at the end of 2017. Gord Johnston, leader of our Infrastructure business operating unit, will take on the role of president and chief executive officer on January 1, 2018. Gord has worked in our industry for over 30 years, 20 of those with Stantec. Gord’s understanding of Stantec’s culture and strategy makes him a great choice for Stantec’s fifth CEO. I’ll work with him until the end of the year to ensure a smooth transition.
Stantec’s success each quarter depends on the experience, creativity, expertise, and goodwill of our employees. It also depends on the continuing support of our clients and shareholders. Please accept my thanks for making it possible for Stantec to create communities around the world. Bob Gomes, P.Eng. Bob Gomes President & CEO August 8, 2017
Management’s Discussion and Analysis (unaudited) June 30, 2017 M-1 Stantec Inc.
Management’s Discussion and Analysis AUGUST 8, 2017 This discussion and analysis of Stantec Inc.’s (Stantec or the Company) operations, financial position, and cash flows for the quarter ended June 30, 2017, dated August 8, 2017, should be read in conjunction with the Company’s unaudited interim condensed consolidated financial statements and related notes for the two quarters ended June 30, 2017; the Management’s Discussion and Analysis and audited consolidated financial statements and related notes included in our 2016 Annual Report filed on February 23, 2017; and the Report to Shareholders contained in our 2017 Second Quarter Report. Our unaudited interim consolidated financial statements and related notes for the quarter ended June 30, 2017, are prepared in accordance with International Financial Reporting Standards (IFRS) as issued by the International Accounting Standards Board (IASB). We continue to use the same accounting policies and methods as we used in 2016.
All amounts shown in this report are in Canadian dollars unless otherwise indicated. Additional information regarding our Company, including our Annual Information Form, is available on SEDAR at sedar.com and on EDGAR at sec.gov. Such additional information is not incorporated here by reference, unless otherwise specified, and should not be deemed to be part of this Management’s Discussion and Analysis.
Core Business and Strategy Our Company’s work—engineering, architecture, interior design, landscape architecture, surveying, environmental sciences, construction services, project management, and project economics, from initial project concept and planning through design, construction, commissioning, maintenance, decommissioning, and remediation—begins at the intersection of community, creativity, and client relationships. By integrating our expertise, we are able to provide our clients with a vast number of project solutions. We believe this integrated approach enables us to execute our operating philosophy by maintaining a world-class level of expertise, which we supply to our clients through the strength of our local offices.
Our business objective is to be a top 10 global design firm, and our focus is to provide professional services in the infrastructure and facilities market, principally on a fee-for-service basis, while maintaining our newly acquired construction management at-risk services. To realize our business objective, we plan on achieving a compound average growth rate of 15% through a combination of organic and acquisition growth, while also providing dividend returns for our shareholders. Our core business and strategy and the key performance drivers and capabilities required to meet our business objective have not changed in the second quarter of 2017 from those described on pages M-4 to M-19 of our 2016 Annual Report (incorporated here by reference).
Management’s Discussion and Analysis (unaudited) June 30, 2017 M-2 Stantec Inc.
Results
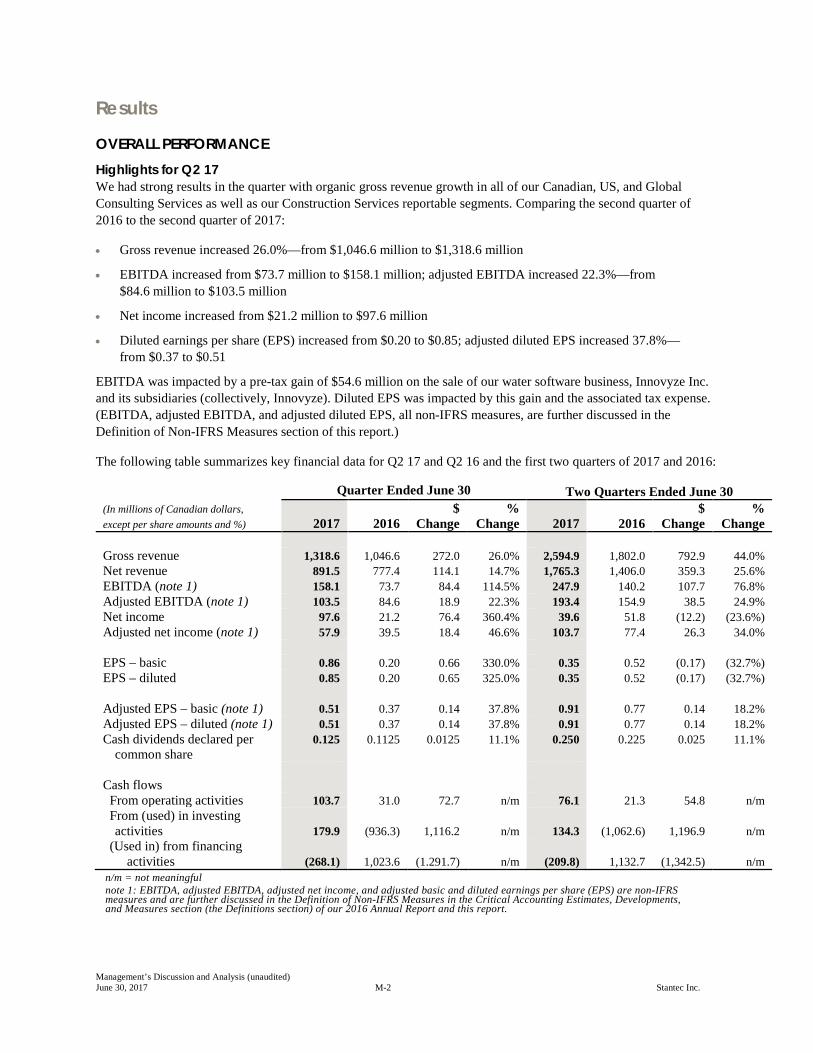
OVERALL PERFORMANCE Highlights for Q2 17 We had strong results in the quarter with organic gross revenue growth in all of our Canadian, US, and Global Consulting Services as well as our Construction Services reportable segments. Comparing the second quarter of 2016 to the second quarter of 2017:
• Gross revenue increased 26.0%—from $1,046.6 million to $1,318.6 million
• EBITDA increased from $73.7 million to $158.1 million; adjusted EBITDA increased 22.3%—from $84.6 million to $103.5 million
• Net income increased from $21.2 million to $97.6 million
• Diluted earnings per share (EPS) increased from $0.20 to $0.85; adjusted diluted EPS increased 37.8%—from $0.37 to $0.51
EBITDA was impacted by a pre-tax gain of $54.6 million on the sale of our water software business, Innovyze Inc. and its subsidiaries (collectively, Innovyze). Diluted EPS was impacted by this gain and the associated tax expense. (EBITDA, adjusted EBITDA, and adjusted diluted EPS, all non-IFRS measures, are further discussed in the Definition of Non-IFRS Measures section of this report.)
The following table summarizes key financial data for Q2 17 and Q2 16 and the first two quarters of 2017 and 2016:
Quarter Ended June 30 Two Quarters Ended June 30 (In millions of Canadian dollars, except per share amounts and %) 2017 2016
$ Change
% Change 2017 2016
$ Change
% Change
Gross revenue 1,318.6 1,046.6 272.0 26.0% 2,594.9 1,802.0 792.9 44.0% Net revenue 891.5 777.4 114.1 14.7% 1,765.3 1,406.0 359.3 25.6% EBITDA (note 1) 158.1 73.7 84.4 114.5% 247.9 140.2 107.7 76.8% Adjusted EBITDA (note 1) 103.5 84.6 18.9 22.3% 193.4 154.9 38.5 24.9% Net income 97.6 21.2 76.4 360.4% 39.6 51.8 (12.2) (23.6%) Adjusted net income (note 1) 57.9 39.5 18.4 46.6% 103.7 77.4 26.3 34.0% EPS – basic 0.86 0.20 0.66 330.0% 0.35 0.52 (0.17) (32.7%) EPS – diluted 0.85 0.20 0.65 325.0% 0.35 0.52 (0.17) (32.7%)
Adjusted EPS – basic (note 1)
0.51
0.37
0.14
37.8%
0.91
0.77
0.14
18.2% Adjusted EPS – diluted (note 1) 0.51 0.37 0.14 37.8% 0.91 0.77 0.14 18.2% Cash dividends declared per
common share 0.125 0.1125 0.0125 11.1% 0.250 0.225 0.025 11.1%
Cash flows From operating activities 103.7 31.0 72.7 n/m 76.1 21.3 54.8 n/m From (used) in investing
activities 179.9 (936.3) 1,116.2 n/m 134.3 (1,062.6) 1,196.9 n/m (Used in) from financing
activities (268.1) 1,023.6 (1.291.7) n/m (209.8) 1,132.7 (1,342.5) n/m n/m = not meaningful note 1: EBITDA, adjusted EBITDA, adjusted net income, and adjusted basic and diluted earnings per share (EPS) are non-IFRS measures and are further discussed in the Definition of Non-IFRS Measures in the Critical Accounting Estimates, Developments, and Measures section (the Definitions section) of our 2016 Annual Report and this report.
Management’s Discussion and Analysis (unaudited) June 30, 2017 M-3 Stantec Inc.
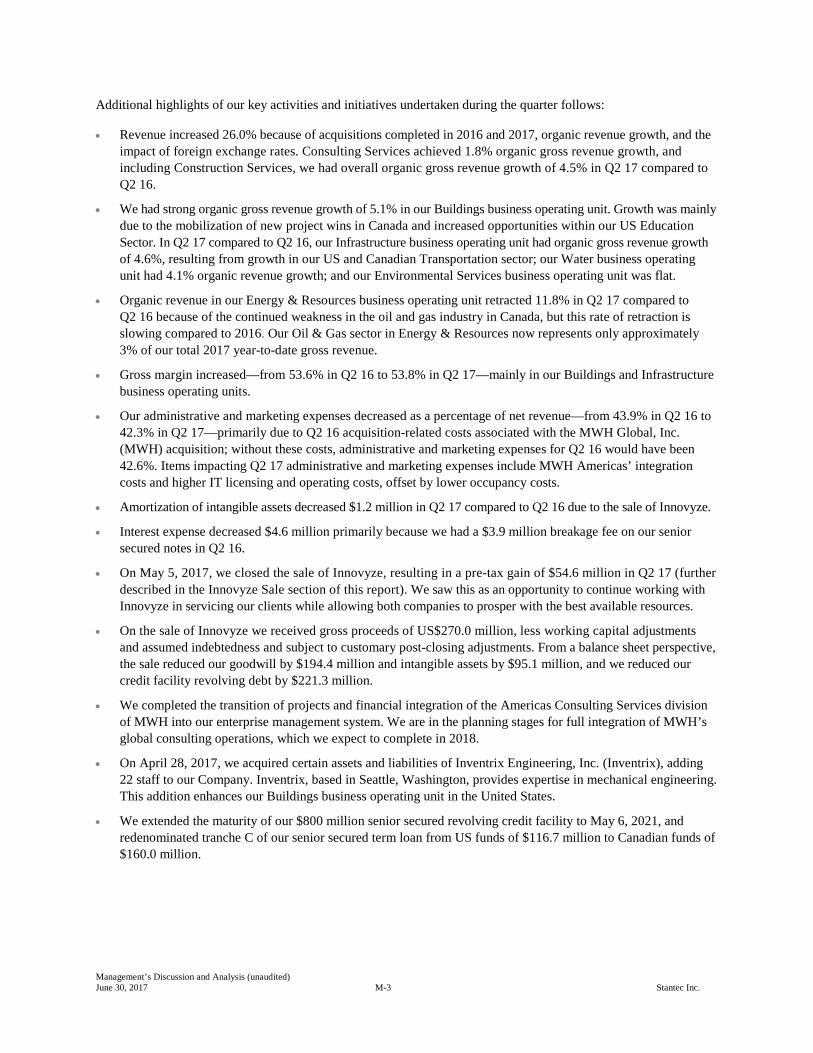
Additional highlights of our key activities and initiatives undertaken during the quarter follows:
• Revenue increased 26.0% because of acquisitions completed in 2016 and 2017, organic revenue growth, and the impact of foreign exchange rates. Consulting Services achieved 1.8% organic gross revenue growth, and including Construction Services, we had overall organic gross revenue growth of 4.5% in Q2 17 compared to Q2 16.
• We had strong organic gross revenue growth of 5.1% in our Buildings business operating unit. Growth was mainly due to the mobilization of new project wins in Canada and increased opportunities within our US Education Sector. In Q2 17 compared to Q2 16, our Infrastructure business operating unit had organic gross revenue growth of 4.6%, resulting from growth in our US and Canadian Transportation sector; our Water business operating unit had 4.1% organic revenue growth; and our Environmental Services business operating unit was flat.
• Organic revenue in our Energy & Resources business operating unit retracted 11.8% in Q2 17 compared to Q2 16 because of the continued weakness in the oil and gas industry in Canada, but this rate of retraction is slowing compared to 2016. Our Oil & Gas sector in Energy & Resources now represents only approximately 3% of our total 2017 year-to-date gross revenue.
• Gross margin increased—from 53.6% in Q2 16 to 53.8% in Q2 17—mainly in our Buildings and Infrastructure business operating units.
• Our administrative and marketing expenses decreased as a percentage of net revenue—from 43.9% in Q2 16 to 42.3% in Q2 17—primarily due to Q2 16 acquisition-related costs associated with the MWH Global, Inc. (MWH) acquisition; without these costs, administrative and marketing expenses for Q2 16 would have been 42.6%. Items impacting Q2 17 administrative and marketing expenses include MWH Americas’ integration costs and higher IT licensing and operating costs, offset by lower occupancy costs.
• Amortization of intangible assets decreased $1.2 million in Q2 17 compared to Q2 16 due to the sale of Innovyze.
• Interest expense decreased $4.6 million primarily because we had a $3.9 million breakage fee on our senior secured notes in Q2 16.
• On May 5, 2017, we closed the sale of Innovyze, resulting in a pre-tax gain of $54.6 million in Q2 17 (further described in the Innovyze Sale section of this report). We saw this as an opportunity to continue working with Innovyze in servicing our clients while allowing both companies to prosper with the best available resources.
• On the sale of Innovyze we received gross proceeds of US$270.0 million, less working capital adjustments and assumed indebtedness and subject to customary post-closing adjustments. From a balance sheet perspective, the sale reduced our goodwill by $194.4 million and intangible assets by $95.1 million, and we reduced our credit facility revolving debt by $221.3 million.
• We completed the transition of projects and financial integration of the Americas Consulting Services division of MWH into our enterprise management system. We are in the planning stages for full integration of MWH’s global consulting operations, which we expect to complete in 2018.
• On April 28, 2017, we acquired certain assets and liabilities of Inventrix Engineering, Inc. (Inventrix), adding 22 staff to our Company. Inventrix, based in Seattle, Washington, provides expertise in mechanical engineering. This addition enhances our Buildings business operating unit in the United States.
• We extended the maturity of our $800 million senior secured revolving credit facility to May 6, 2021, and redenominated tranche C of our senior secured term loan from US funds of $116.7 million to Canadian funds of $160.0 million.
Management’s Discussion and Analysis (unaudited) June 30, 2017 M-4 Stantec Inc.
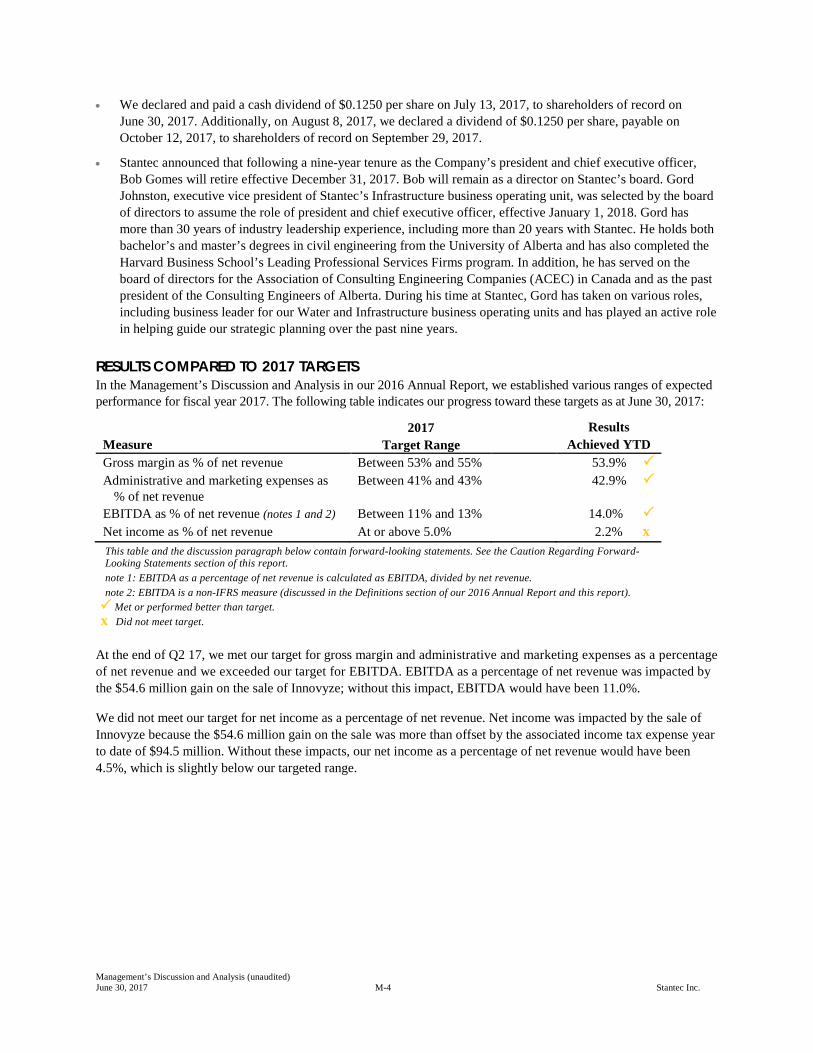
• We declared and paid a cash dividend of $0.1250 per share on July 13, 2017, to shareholders of record on June 30, 2017. Additionally, on August 8, 2017, we declared a dividend of $0.1250 per share, payable on October 12, 2017, to shareholders of record on September 29, 2017.
• Stantec announced that following a nine-year tenure as the Company’s president and chief executive officer, Bob Gomes will retire effective December 31, 2017. Bob will remain as a director on Stantec’s board. Gord Johnston, executive vice president of Stantec’s Infrastructure business operating unit, was selected by the board of directors to assume the role of president and chief executive officer, effective January 1, 2018. Gord has more than 30 years of industry leadership experience, including more than 20 years with Stantec. He holds both bachelor’s and master’s degrees in civil engineering from the University of Alberta and has also completed the Harvard Business School’s Leading Professional Services Firms program. In addition, he has served on the board of directors for the Association of Consulting Engineering Companies (ACEC) in Canada and as the past president of the Consulting Engineers of Alberta. During his time at Stantec, Gord has taken on various roles, including business leader for our Water and Infrastructure business operating units and has played an active role in helping guide our strategic planning over the past nine years.
RESULTS COMPARED TO 2017 TARGETS In the Management’s Discussion and Analysis in our 2016 Annual Report, we established various ranges of expected performance for fiscal year 2017. The following table indicates our progress toward these targets as at June 30, 2017:
Measure
2017 Target Range
Results Achieved YTD
Gross margin as % of net revenue Between 53% and 55% 53.9% Administrative and marketing expenses as
% of net revenue Between 41% and 43% 42.9%
EBITDA as % of net revenue (notes 1 and 2) Between 11% and 13% 14.0% Net income as % of net revenue At or above 5.0% 2.2% x This table and the discussion paragraph below contain forward-looking statements. See the Caution Regarding Forward-Looking Statements section of this report. note 1: EBITDA as a percentage of net revenue is calculated as EBITDA, divided by net revenue. note 2: EBITDA is a non-IFRS measure (discussed in the Definitions section of our 2016 Annual Report and this report). Met or performed better than target. x Did not meet target.
At the end of Q2 17, we met our target for gross margin and administrative and marketing expenses as a percentage of net revenue and we exceeded our target for EBITDA. EBITDA as a percentage of net revenue was impacted by the $54.6 million gain on the sale of Innovyze; without this impact, EBITDA would have been 11.0%.
We did not meet our target for net income as a percentage of net revenue. Net income was impacted by the sale of Innovyze because the $54.6 million gain on the sale was more than offset by the associated income tax expense year to date of $94.5 million. Without these impacts, our net income as a percentage of net revenue would have been 4.5%, which is slightly below our targeted range.
Management’s Discussion and Analysis (unaudited) June 30, 2017 M-5 Stantec Inc.
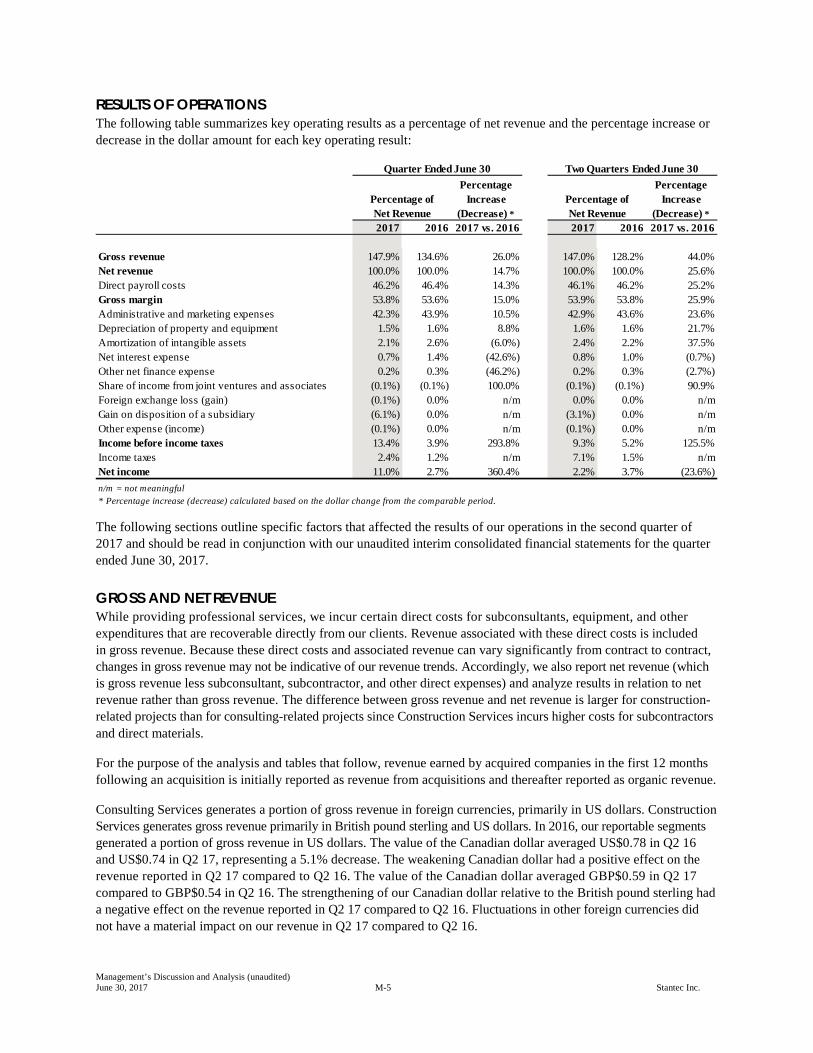
RESULTS OF OPERATIONS The following table summarizes key operating results as a percentage of net revenue and the percentage increase or decrease in the dollar amount for each key operating result:
The following sections outline specific factors that affected the results of our operations in the second quarter of 2017 and should be read in conjunction with our unaudited interim consolidated financial statements for the quarter ended June 30, 2017.
GROSS AND NET REVENUE While providing professional services, we incur certain direct costs for subconsultants, equipment, and other expenditures that are recoverable directly from our clients. Revenue associated with these direct costs is included in gross revenue. Because these direct costs and associated revenue can vary significantly from contract to contract, changes in gross revenue may not be indicative of our revenue trends. Accordingly, we also report net revenue (which is gross revenue less subconsultant, subcontractor, and other direct expenses) and analyze results in relation to net revenue rather than gross revenue. The difference between gross revenue and net revenue is larger for construction-related projects than for consulting-related projects since Construction Services incurs higher costs for subcontractors and direct materials.
For the purpose of the analysis and tables that follow, revenue earned by acquired companies in the first 12 months following an acquisition is initially reported as revenue from acquisitions and thereafter reported as organic revenue.
Consulting Services generates a portion of gross revenue in foreign currencies, primarily in US dollars. Construction Services generates gross revenue primarily in British pound sterling and US dollars. In 2016, our reportable segments generated a portion of gross revenue in US dollars. The value of the Canadian dollar averaged US$0.78 in Q2 16 and US$0.74 in Q2 17, representing a 5.1% decrease. The weakening Canadian dollar had a positive effect on the revenue reported in Q2 17 compared to Q2 16. The value of the Canadian dollar averaged GBP$0.59 in Q2 17 compared to GBP$0.54 in Q2 16. The strengthening of our Canadian dollar relative to the British pound sterling had a negative effect on the revenue reported in Q2 17 compared to Q2 16. Fluctuations in other foreign currencies did not have a material impact on our revenue in Q2 17 compared to Q2 16.
Percentage Increase
(Decrease) *
Percentage Increase
(Decrease) *2017 2016 2017 vs. 2016 2017 2016 2017 vs. 2016
Gross revenue 147.9% 134.6% 26.0% 147.0% 128.2% 44.0%Net revenue 100.0% 100.0% 14.7% 100.0% 100.0% 25.6%Direct payroll costs 46.2% 46.4% 14.3% 46.1% 46.2% 25.2%Gross margin 53.8% 53.6% 15.0% 53.9% 53.8% 25.9%Administrative and marketing expenses 42.3% 43.9% 10.5% 42.9% 43.6% 23.6%Depreciation of property and equipment 1.5% 1.6% 8.8% 1.6% 1.6% 21.7%Amortization of intangible assets 2.1% 2.6% (6.0%) 2.4% 2.2% 37.5%Net interest expense 0.7% 1.4% (42.6%) 0.8% 1.0% (0.7%)Other net finance expense 0.2% 0.3% (46.2%) 0.2% 0.3% (2.7%)Share of income from joint ventures and associates (0.1%) (0.1%) 100.0% (0.1%) (0.1%) 90.9%Foreign exchange loss (gain) (0.1%) 0.0% n/m 0.0% 0.0% n/mGain on disposition of a subsidiary (6.1%) 0.0% n/m (3.1%) 0.0% n/mOther expense (income) (0.1%) 0.0% n/m (0.1%) 0.0% n/mIncome before income taxes 13.4% 3.9% 293.8% 9.3% 5.2% 125.5%Income taxes 2.4% 1.2% n/m 7.1% 1.5% n/mNet income 11.0% 2.7% 360.4% 2.2% 3.7% (23.6%)n/m = not meaningful
Quarter Ended June 30
Percentage of Net Revenue
* Percentage increase (decrease) calculated based on the dollar change from the comparable period.
Two Quarters Ended June 30
Percentage of Net Revenue
Management’s Discussion and Analysis (unaudited) June 30, 2017 M-6 Stantec Inc.
Our contract backlog was $3.9 billion at December 31, 2016, and was the same at June 30, 2017—$2.9 billion in Consulting Services and $1.0 billion in Construction Services. (Backlog is a non-IFRS measure further discussed in the Definitions section of our 2016 Annual Report.). Backlog increases as a result of project wins and acquisitions completed in a quarter. Year to date, these increases were offset by the fluctuation in foreign exchange since the Canadian dollar was US$0.77 at June 30, 2017, compared to US$0.74 at December 31, 2016.
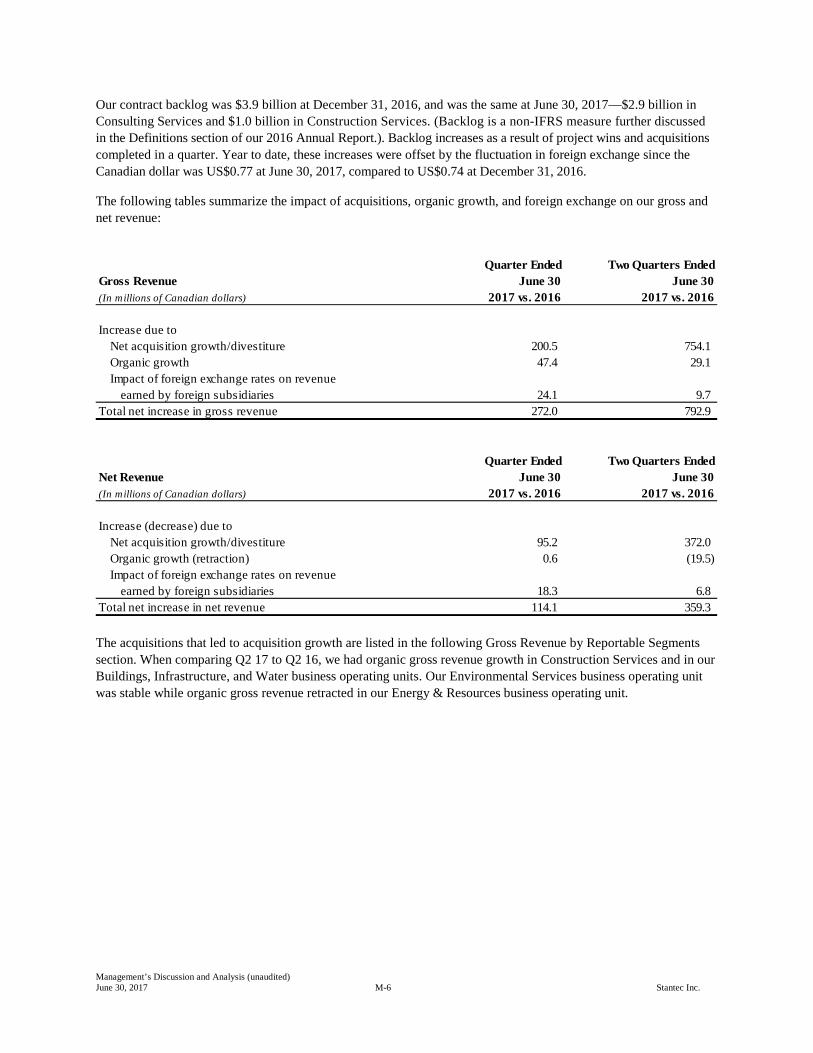
The following tables summarize the impact of acquisitions, organic growth, and foreign exchange on our gross and net revenue:
The acquisitions that led to acquisition growth are listed in the following Gross Revenue by Reportable Segments section. When comparing Q2 17 to Q2 16, we had organic gross revenue growth in Construction Services and in our Buildings, Infrastructure, and Water business operating units. Our Environmental Services business operating unit was stable while organic gross revenue retracted in our Energy & Resources business operating unit.
Gross RevenueQuarter Ended
June 30Two Quarters Ended
June 30(In millions of Canadian dollars) 2017 vs. 2016 2017 vs. 2016
Increase due to Net acquisition growth/divestiture 200.5 754.1 Organic growth 47.4 29.1 Impact of foreign exchange rates on revenue
earned by foreign subsidiaries 24.1 9.7Total net increase in gross revenue 272.0 792.9
Net RevenueQuarter Ended
June 30Two Quarters Ended
June 30(In millions of Canadian dollars) 2017 vs. 2016 2017 vs. 2016
Increase (decrease) due to Net acquisition growth/divestiture 95.2 372.0 Organic growth (retraction) 0.6 (19.5) Impact of foreign exchange rates on revenue
earned by foreign subsidiaries 18.3 6.8Total net increase in net revenue 114.1 359.3
Management’s Discussion and Analysis (unaudited) June 30, 2017 M-7 Stantec Inc.
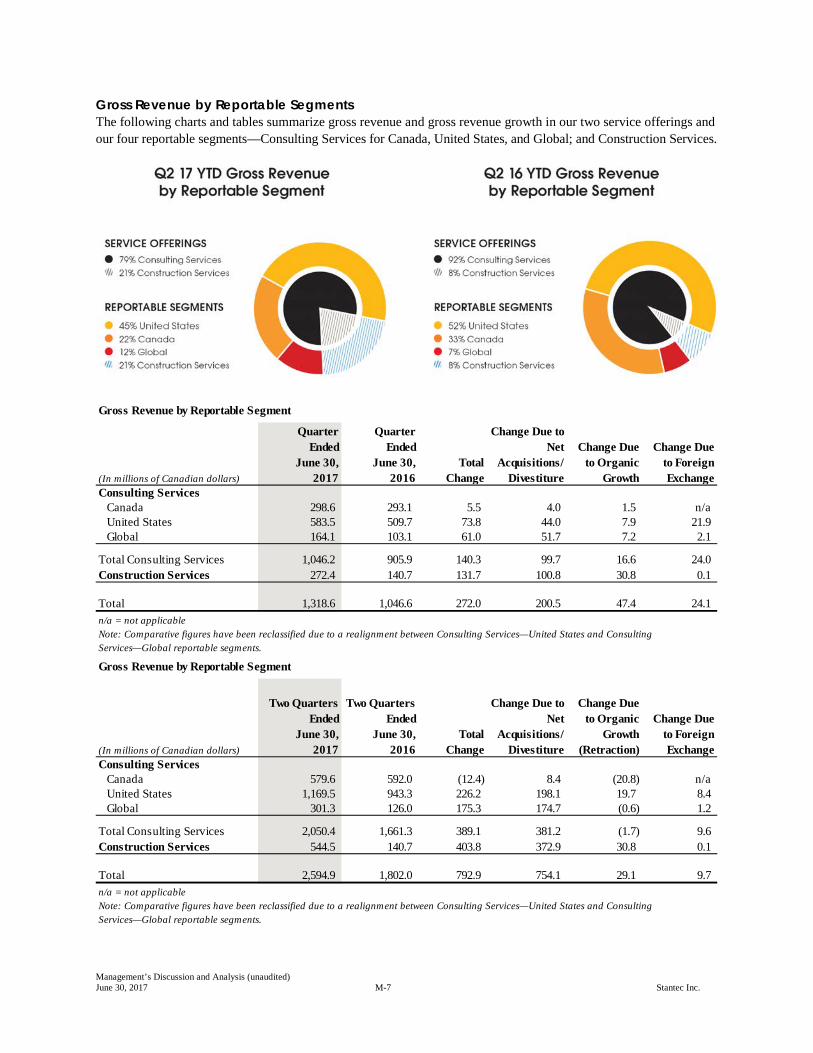
Gross Revenue by Reportable Segments The following charts and tables summarize gross revenue and gross revenue growth in our two service offerings and our four reportable segments—Consulting Services for Canada, United States, and Global; and Construction Services.
Gross Revenue by Reportable Segment
(In millions of Canadian dollars)
Quarter Ended
June 30, 2017
Quarter Ended
June 30, 2016
Total Change
Change Due to Net
Acquisitions/Divestiture
Change Due to Organic
Growth
Change Due to Foreign Exchange
Consulting ServicesCanada 298.6 293.1 5.5 4.0 1.5 n/aUnited States 583.5 509.7 73.8 44.0 7.9 21.9 Global 164.1 103.1 61.0 51.7 7.2 2.1
Total Consulting Services 1,046.2 905.9 140.3 99.7 16.6 24.0Construction Services 272.4 140.7 131.7 100.8 30.8 0.1
Total 1,318.6 1,046.6 272.0 200.5 47.4 24.1 n/a = not applicableNote: Comparative figures have been reclassified due to a realignment between Consulting Services—United States and Consulting Services—Global reportable segments.
Gross Revenue by Reportable Segment
(In millions of Canadian dollars)
Two Quarters Ended
June 30, 2017
Two Quarters Ended
June 30, 2016
Total Change
Change Due to Net
Acquisitions/Divestiture
Change Due to Organic
Growth (Retraction)
Change Due to Foreign Exchange
Consulting ServicesCanada 579.6 592.0 (12.4) 8.4 (20.8) n/aUnited States 1,169.5 943.3 226.2 198.1 19.7 8.4 Global 301.3 126.0 175.3 174.7 (0.6) 1.2
Total Consulting Services 2,050.4 1,661.3 389.1 381.2 (1.7) 9.6Construction Services 544.5 140.7 403.8 372.9 30.8 0.1
Total 2,594.9 1,802.0 792.9 754.1 29.1 9.7 n/a = not applicableNote: Comparative figures have been reclassified due to a realignment between Consulting Services—United States and Consulting Services—Global reportable segments.
Management’s Discussion and Analysis (unaudited) June 30, 2017 M-8 Stantec Inc.
Total gross revenue in Q2 17 was positively impacted by the acquisitions completed in 2016 and 2017, the weakening Canadian dollar in Q2 17 compared to Q2 16, and organic growth in all reportable segments.
The following acquisitions, completed in 2016 and 2017, impacted our reportable segments year to date:
Consulting Services – Canada • MWH Global, Inc. (MWH) (May 2016) • Architecture | Tkalcic Bengert (Arch | TB) (December 2016)
Consulting Services – United States • Bury Holdings, Inc. (Bury) (March 2016) • VOA Associates, Inc. (VOA) (May 2016) • MWH Global, Inc. (MWH) (May 2016) • Edwards & Zuck, P.C. and Edwards & Zuck, D.P.C. (collectively, Edwards & Zuck) (September 2016) • Inventrix Engineering, Inc. (Inventrix) (April 2017)
Consulting Services – Global • MWH Global, Inc. (MWH) (May 2016)
Construction Services • MWH Global, Inc. (MWH) (May 2016)
Consulting Services – Canada Gross revenue from our Consulting Services – Canada operations increased 1.9% in Q2 17 compared to Q2 16 and decreased 2.1% year to date. Organic revenue grew 0.5% in Q2 17 compared to Q2 16 because of growth in our Buildings and Infrastructure business operating units; this was partly offset by retraction in our Energy & Resources and Environmental Services business operating units. Organic revenue in our Water business operating unit was flat in Q2 17 compared to Q2 16.
In the private sector, our Energy & Resources business operating unit experienced year-to-date organic revenue retraction in two sectors: Oil & Gas and Power. In our Oil & Gas sector, retraction in Q2 17 was slower than in the previous five quarters. We continued to win a stream of generally smaller projects because of our strong client relationships and industry expertise. Strength in our Atlantic region Power sector partly offset weakness in other areas of the country. Our Mining business revenues grew organically year to date compared to the same period in 2016 because we secured a major project in Q2 17.
In our Environmental Services business operating unit, we continued to see year-to-date revenue retraction compared to 2016, mainly in our Oil & Gas sector in Alberta and British Columbia. This was partly offset by growth in other provinces. Almost 67% of our Canadian Environmental Services revenue is derived from our Oil & Gas clients.
The Community Development sector of our Infrastructure business operating unit saw growth overall in Quebec and southern Alberta; however, central and northern Alberta showed retraction due to the continuing weakness in the oil and gas market. Benefiting from 2016 provincial budgets that provided stimuli for infrastructure spending, our Transportation sector continued to show strong year-to-date organic growth.
Our Water business operating unit has benefited from infrastructure spending on water and wastewater treatment facilities. Year to date, our Canadian Water business has experienced organic revenue growth, particularly in British Columbia.
Our Buildings business operating unit had stable organic gross revenue year to date compared to the same period in 2016. In Q2 17, we saw organic growth due to the mobilization of new project wins. Organic gross revenue grew in
Management’s Discussion and Analysis (unaudited) June 30, 2017 M-9 Stantec Inc.
British Columbia and Ontario, while we saw retraction in the Prairie Provinces. The Quebec telecommunication business has shown softness year to date.
Consulting Services – United States Gross revenue in our Consulting Services – United States operations increased 24.0% year to date and 14.5% in Q2 17 compared to Q2 16. These increases resulted from acquisition growth, particularly in our Buildings and Water business operating units; organic revenue growth; and foreign exchange. Organic gross revenue grew 1.5% in Q2 17 compared to Q2 16 and grew 2.1% year to date in 2017 compared to the same period in 2016. This growth was largely driven by our Buildings and Infrastructure business operating units. Within our Infrastructure business operating unit, Transportation grew due to our strategic market position in North America. Organic growth in our Buildings business operating unit resulted mainly from steady activity in the healthcare and commercial markets, and we saw increased opportunities in the southwestern United States, particularly in our Education sector. Our Power business saw growth year to date, assisted by renewable energy and distributed generation, along with continued market penetration in the transmission and distribution markets.
In the private sector, the housing market continued to grow, specifically in Florida, Texas, and the western United States. We saw a continued trend toward urbanization, which means that cities need to be revitalized. We continued to capitalize on our expertise in environmental mitigation and to build on our remediation and recovery expertise in our Environmental Services business.
The public sector continued to be a growth area for us, though some uncertainty in the political and regulatory environment, notably at the federal level, remains. Partly in response to fiscal constraints, design-build opportunities increased in the United States because some clients view design-build as a more efficient project delivery method. Organic revenue growth occurred in our Transportation sector due to our strategic market position in program management, bridge inspection, light-rail transit, roadway, and bridge projects. Our Water business continued to benefit from regulatory requirements, including consent decrees that mandate municipalities to upgrade their water and wastewater facilities, as well as the continued efforts of public agencies and private industry to improve operational efficiency. Acquisition revenue from our Waterpower & Dams sector was strong in our Energy & Resources business operating unit in our eastern US operations.
Consulting Services – Global Gross revenue from our Consulting Services – Global operations increased $175.3 million year to date and $61.0 million in Q2 17 compared to Q2 16. Year to date, acquisition revenue increased as a result of the MWH acquisition. Organic gross revenue was flat year to date when compared to the same period in 2016. We experienced modest year-over-year organic revenue growth in our Environmental Services and Water business operating units. This growth was fueled by increased public water sector spending in Australia and New Zealand, strong water-related activity in the United Kingdom, and private sector environmental services activity in Continental Europe. This organic revenue growth was offset by continued softness in our Mining and Buildings businesses. Mining revenue was down primarily in Latin America, driven by project delays and cancellations where our major mining clients continue to struggle with low commodity prices. Revenue in our Buildings business operating unit was down primarily in the Middle East, which has been impacted by low oil prices and recent political instability.
Construction Services Construction Services earned $272.4 million in gross revenue in Q2 17 and $544.5 million year to date. Revenue was generated primarily in the United States and United Kingdom.
The United States generated $160.1 million in Q2 17 and $338.8 million year to date in gross revenue. In Florida, Texas, and the western United States, we had significant and steady work during the quarter on a number of major water and wastewater treatment plant construction projects. Also, activity increased on a major new commercial contract in the western United States; under this contract, we are performing the construction management and project management services for a major manufacturer.
Management’s Discussion and Analysis (unaudited) June 30, 2017 M-10 Stantec Inc.
The remaining $107.6 million in Q2 17 and $197.4 million year to date in gross revenue for Construction Services was earned mainly in the United Kingdom. Revenue in the United Kingdom was driven by ongoing construction activities for water utilities in the third year of the Asset Management Programme (AMP6) cycle.
An example of a project awarded during the quarter involves us providing pre-construction and construction services for the Southeast Water Pollution Control Plant Bio-Solids Digester Facility in San Francisco, California. To meet the community’s improved sewer system service goals, our team will replace the existing digester facilities with new, expanded, and modern facilities.
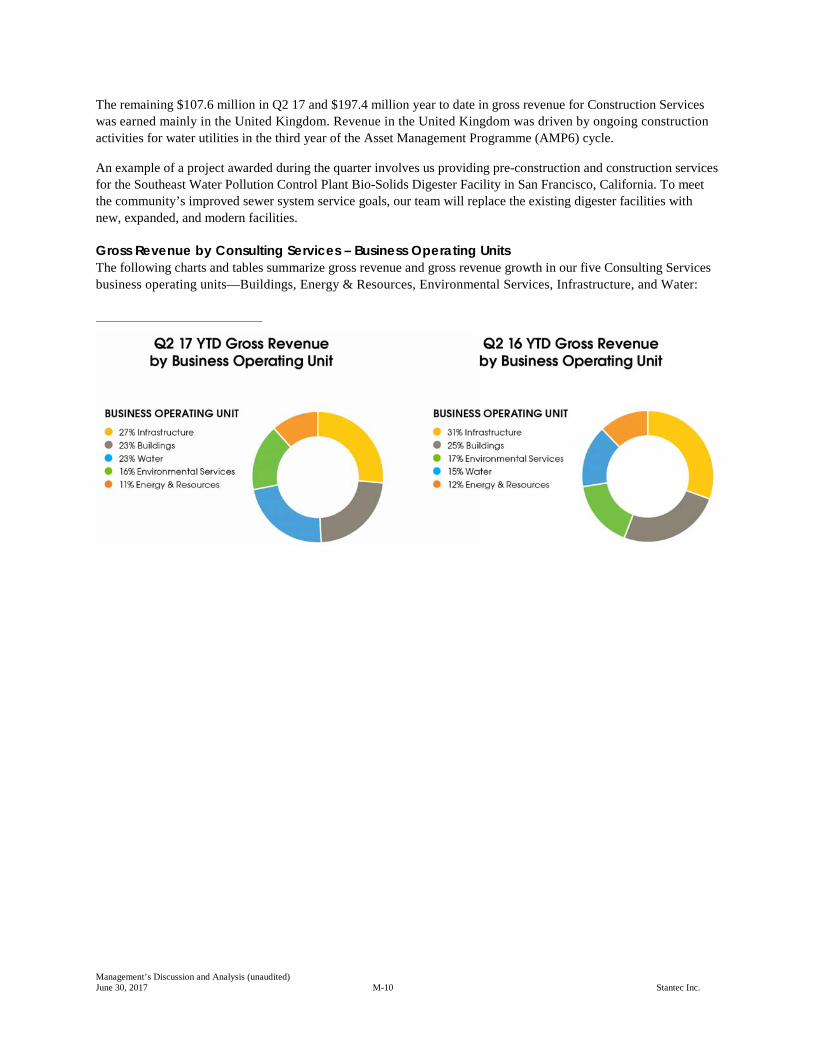
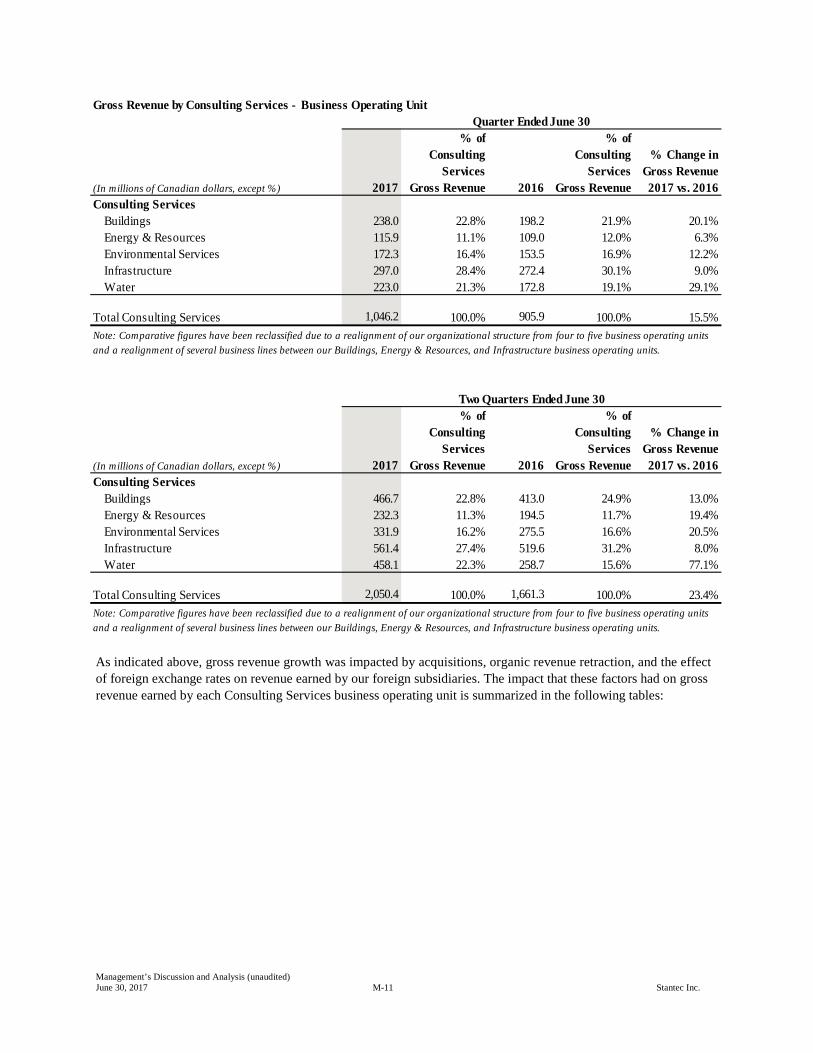
Gross Revenue by Consulting Services – Business Operating Units The following charts and tables summarize gross revenue and gross revenue growth in our five Consulting Services business operating units—Buildings, Energy & Resources, Environmental Services, Infrastructure, and Water:
Management’s Discussion and Analysis (unaudited) June 30, 2017 M-11 Stantec Inc.
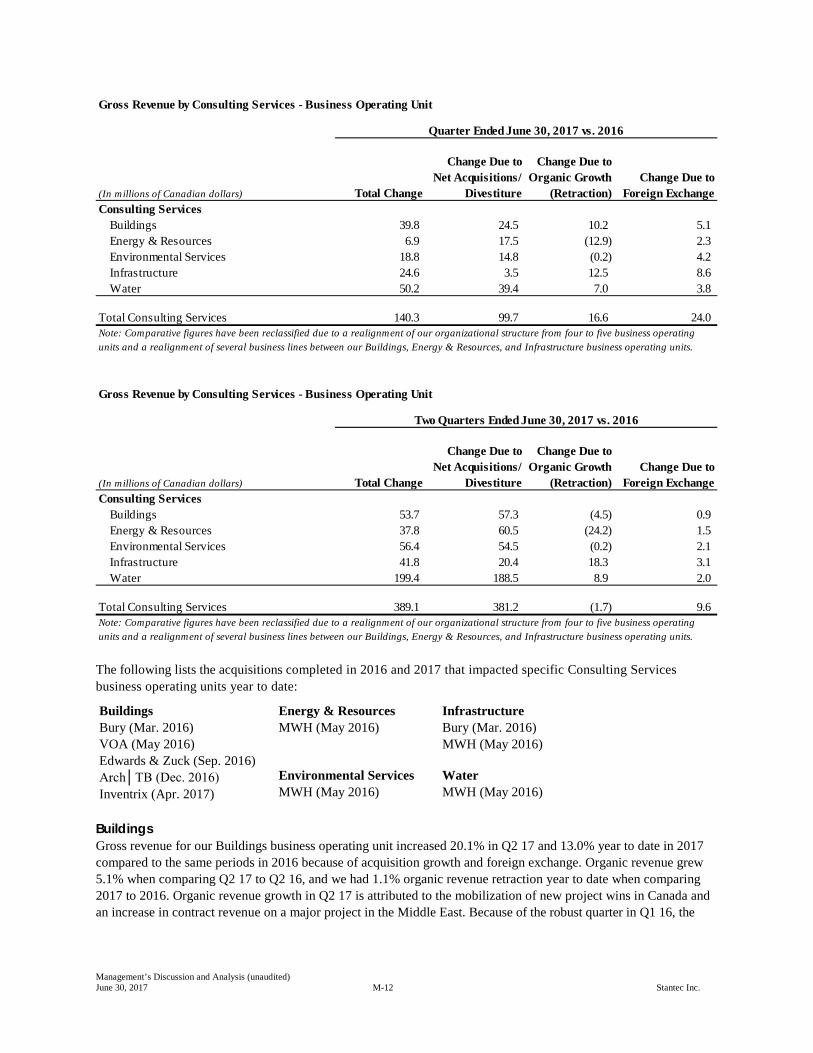
As indicated above, gross revenue growth was impacted by acquisitions, organic revenue retraction, and the effect of foreign exchange rates on revenue earned by our foreign subsidiaries. The impact that these factors had on gross revenue earned by each Consulting Services business operating unit is summarized in the following tables:
Gross Revenue by Consulting Services - Business Operating Unit
(In millions of Canadian dollars, except %) 2017
% of Consulting
Services Gross Revenue 2016
% of Consulting
Services Gross Revenue
% Change in Gross Revenue 2017 vs. 2016
Consulting Services Buildings 238.0 22.8% 198.2 21.9% 20.1%Energy & Resources 115.9 11.1% 109.0 12.0% 6.3%Environmental Services 172.3 16.4% 153.5 16.9% 12.2%Infrastructure 297.0 28.4% 272.4 30.1% 9.0%Water 223.0 21.3% 172.8 19.1% 29.1%
Total Consulting Services 1,046.2 100.0% 905.9 100.0% 15.5%
(In millions of Canadian dollars, except %) 2017
% of Consulting
Services Gross Revenue 2016
% of Consulting
Services Gross Revenue
% Change in Gross Revenue 2017 vs. 2016
Consulting Services Buildings 466.7 22.8% 413.0 24.9% 13.0%Energy & Resources 232.3 11.3% 194.5 11.7% 19.4%Environmental Services 331.9 16.2% 275.5 16.6% 20.5%Infrastructure 561.4 27.4% 519.6 31.2% 8.0%Water 458.1 22.3% 258.7 15.6% 77.1%
Total Consulting Services 2,050.4 100.0% 1,661.3 100.0% 23.4%Note: Comparative figures have been reclassified due to a realignment of our organizational structure from four to five business operating units and a realignment of several business lines between our Buildings, Energy & Resources, and Infrastructure business operating units.
Note: Comparative figures have been reclassified due to a realignment of our organizational structure from four to five business operating units and a realignment of several business lines between our Buildings, Energy & Resources, and Infrastructure business operating units.
Quarter Ended June 30
Two Quarters Ended June 30
Management’s Discussion and Analysis (unaudited) June 30, 2017 M-12 Stantec Inc.
The following lists the acquisitions completed in 2016 and 2017 that impacted specific Consulting Services business operating units year to date:
Buildings Bury (Mar. 2016) VOA (May 2016) Edwards & Zuck (Sep. 2016) Arch│TB (Dec. 2016) Inventrix (Apr. 2017)
Energy & Resources MWH (May 2016)
Infrastructure Bury (Mar. 2016) MWH (May 2016)
Environmental Services MWH (May 2016)
Water MWH (May 2016)
Buildings Gross revenue for our Buildings business operating unit increased 20.1% in Q2 17 and 13.0% year to date in 2017 compared to the same periods in 2016 because of acquisition growth and foreign exchange. Organic revenue grew 5.1% when comparing Q2 17 to Q2 16, and we had 1.1% organic revenue retraction year to date when comparing 2017 to 2016. Organic revenue growth in Q2 17 is attributed to the mobilization of new project wins in Canada and an increase in contract revenue on a major project in the Middle East. Because of the robust quarter in Q1 16, the
Gross Revenue by Consulting Services - Business Operating Unit
(In millions of Canadian dollars) Total Change
Change Due to Net Acquisitions/
Divestiture
Change Due to Organic Growth
(Retraction)Change Due to
Foreign ExchangeConsulting Services
Buildings 39.8 24.5 10.2 5.1Energy & Resources 6.9 17.5 (12.9) 2.3Environmental Services 18.8 14.8 (0.2) 4.2Infrastructure 24.6 3.5 12.5 8.6Water 50.2 39.4 7.0 3.8
Total Consulting Services 140.3 99.7 16.6 24.0
Gross Revenue by Consulting Services - Business Operating Unit
(In millions of Canadian dollars) Total Change
Change Due to Net Acquisitions/
Divestiture
Change Due to Organic Growth
(Retraction)Change Due to
Foreign ExchangeConsulting Services
Buildings 53.7 57.3 (4.5) 0.9Energy & Resources 37.8 60.5 (24.2) 1.5Environmental Services 56.4 54.5 (0.2) 2.1Infrastructure 41.8 20.4 18.3 3.1Water 199.4 188.5 8.9 2.0
Total Consulting Services 389.1 381.2 (1.7) 9.6
Quarter Ended June 30, 2017 vs. 2016
Note: Comparative figures have been reclassified due to a realignment of our organizational structure from four to five business operating units and a realignment of several business lines between our Buildings, Energy & Resources, and Infrastructure business operating units.
Two Quarters Ended June 30, 2017 vs. 2016
Note: Comparative figures have been reclassified due to a realignment of our organizational structure from four to five business operating units and a realignment of several business lines between our Buildings, Energy & Resources, and Infrastructure business operating units.
Management’s Discussion and Analysis (unaudited) June 30, 2017 M-13 Stantec Inc.
year-to-date retraction was larger than it might otherwise have been. Also, the decline in the oil and gas sector continued to impact private and public spending in our Canadian and Middle Eastern operations.
In Canada, we maintained strong activity in the healthcare, commercial, and education markets, plus we experienced steady activity in the civic and industrial sectors. In the United States, gross revenue increased partly due to strategic acquisitions completed in 2016. We experienced steady activity in the healthcare and commercial markets and saw increased opportunities in the southwestern United States, particularly in our Education sector. We benefit from the urbanization trend across North America as inner cities are revitalized. Our Civic sector provides a range of services to respond to these needs.
Highlights of projects secured in the quarter include a contract (in partnership with DIALOG) to provide architectural and interior design as well as structural and electrical engineering services for the new Calgary Cancer Centre, a leading healthcare and academic facility with over 100 patient exam rooms, 160 inpatient beds, 15 radiation therapy treatment vaults, 120 systemic treatment chairs, and a variety of labs for cancer research. During the quarter, we were also awarded the contract to provide design, architecture, interior design, furniture planning, and lab planning for the Texas Woman’s University’s new Science and Technology Learning Center, a 73,000-square-foot graduate research facility with technologically advanced tools to investigate chemistry, psychology, applied biology, dental hygiene, and nutrition and food sciences.
Energy & Resources Gross revenue for our Energy & Resources business operating unit increased 6.3% in Q2 17 compared to Q2 16 and increased 19.4% year to date in 2017 compared to the same period in 2016. Revenue was positively impacted by acquisition growth. Organic gross revenue retracted 11.8% in Q2 17 compared to Q2 16 and 12.4% year to date in 2017 compared to the same period in 2016. This represents a continued positive trend in our retraction in this business operating unit. Sustained weakness in the oil and gas sector in Canada and the United States continued to impact our engineering services. We experienced year-to-date organic revenue retraction in our Mining and Oil & Gas sectors in 2017 compared to 2016. Power retracted year over year with organic revenue growth in the United States offset by retraction in Canada.
In our Oil & Gas sector, organic revenue retraction continued year to date in 2017 compared to the same period in 2016. Despite a slowdown caused by uncertain market conditions, we continued to be awarded new work in our midstream business because of our strong client relationships.
In our Power sector, we continued securing projects as a result of infrastructure improvement, environmental compliance, and resiliency requirements in the transmission and distribution and the power replacement markets. In the United States, our organic revenue growth was strong, assisted by renewable energy, plant services, and distributed energy, along with continued penetration in the transmission and distribution markets. Our Canadian Power operations were impacted by the slowdown in capital spending by Oil & Gas clients, resulting in deferred gas-generation projects. Nonetheless, we continued to secure smaller projects.
Our Mining sector’s organic revenue retraction is primarily attributed to the continuing slowdown in the mining market and impacted by regulation changes in Indonesia, affecting a major project. The organic retraction in our operations is due mainly to continued challenging macroeconomic industry conditions and clients managing their debt levels. These debt levels resulted in a cautious approach to capital spending. The retraction in 2016 was challenging for the mining industry; however, in 2017, the number of small and midsized capital projects has increased.
An example of a mining project awarded in the quarter was an underground mining study to determine the final mine design, scheduling, costing, infrastructure, and equipment requirements for the Mariana Norte and Emilia deposits of the Cerro Negro gold mine in Santa Cruz, Argentina.
Management’s Discussion and Analysis (unaudited) June 30, 2017 M-14 Stantec Inc.
Activity in the Waterpower & Dams sector remains steady, especially in our US operations with recent project awards in US West operations and continued work on the Oroville Dam repairs in California.
Highlights of projects won in our Oil & Gas sector in the quarter include providing engineering and procurement services for additions to four compressor stations in Alberta, part of a project to increase the capacity of a natural gas pipeline in northwestern Alberta. We will also provide detailed engineering design that involves project management, construction management, contracting, and procurement services for a pipeline replacement project. This project will enable the continued transportation of refined petroleum products between the Edmonton and Calgary regions. As well this quarter, our Company earned a contract to provide pre-turnaround engineering and turnaround execution support for the ongoing safe operation of a refinery in the Edmonton region.
One Power project to highlight this quarter is our contribution to Manitoba Hydro’s Bipole III High Voltage Direct Current (HVDC) project. Stantec will be providing additional office and site engineering support under an existing contract for construction and commissioning of the Riel and Keewatinohk converter stations. This project will improve the reliability and dependability of the overall power grid, which provides renewable energy to southern Manitoba.
Environmental Services Gross revenue for our Environmental Services business operating unit increased 12.2% in Q2 17 compared to Q2 16 and 20.5% year to date in 2017 compared to year to date in 2016. Acquisition growth and foreign exchange positively impacted revenue.
Environmental Services continued to be impacted by low commodity prices and reduced capital spending, primarily in the midstream oil and gas sector. This led to delays and cancellations and put downward pressure on project fees. Existing large-scale projects continued to wind down; however, the oil and gas industry did start to show signs of stabilization in Q2 17. Our North American operations continued to win a stream of generally smaller lower-margin projects because of our strong client relationships and industry expertise.
In the United States, we had organic gross revenue growth. The winding down of projects was offset by growth in our Power and Transportation sectors. We experienced increased activity in airport, rail, and highway and road projects, particularly in our eastern US operations, and we see strong backlog spread across all our primary sectors. With the addition of MWH, we expanded our services in the manufacturing sector to serve their key legacy clients.
In Canada, Environmental Services continued to face pricing pressure as clients reviewed their supply chain for opportunities to gain efficiencies; therefore, our margins were impacted. Organic gross revenue retraction slowed year to date as evidenced by recent wins, including some new clients and an increase in small project opportunities. Although the oil and gas and mining markets continued to be challenged across North America, we maintained our backlog because of our strong emphasis on operations and maintenance programs and the award and execution of a few assessment projects. We saw growth in government infrastructure spending, including spending for Aboriginal communities.
In our Global operations, we had higher-than-expected project volume in Italy due to a significant Environmental Services contract.
Highlights of projects awarded in the quarter include our response to the Oroville Dam emergency. Within two days of the discovery of a damaged spillway at the Oroville Dam Facilities in Northern California, Stantec was on site supporting the recovery efforts of the California Department of Water Resources (DWR). Our long history and knowledge of DWR’s facilities played a key role in our being selected this quarter to lead the engineering and construction management services for the rebuild of the Oroville Dam main and auxiliary spillways. In addition to this new contract, we are providing multiple other services during the recovery efforts, including monitoring dam and spillway safety, relocating a damaged transmission line, and providing ongoing regulatory and permitting support.
Management’s Discussion and Analysis (unaudited) June 30, 2017 M-15 Stantec Inc.
Infrastructure Gross revenue for our Infrastructure business operating unit increased 9.0% in Q2 17 compared to Q2 16 and 8.0% year to date in 2017 compared to the same period in 2016. This increase was due to acquisition revenue and organic gross revenue growth of 4.6% in Q2 17 compared to Q2 16 and 3.5% year to date in 2017 compared to year to date in 2016 as well as due to foreign exchange.
Our Community Development sector was stable year to date in 2017 compared to the same period in 2016. We perform approximately 40% of our Community Development work in Canada and approximately 60% in the United States. The flat Alberta economy resulted in lower business volume and downward pressure on fees. Except for Alberta, other parts of Canada and the United States experienced a continued demand for housing, a continued interest in urban development, and an increase in mixed-use commercial projects. In Canada, we completed projects for Parks Canada across the country to prepare for celebrating Canada’s 150th anniversary. US organic gross revenue was stable year over year; however, acquisition revenue benefited from the acquisition of Bury. We continued working on US urban design projects, further developing our expanded level of expertise to provide urban and brownfield solutions.
Our Transportation sector saw organic growth, mainly in the United States, that was primarily due to increased revenue in our Transit & Rail operations. Our Transportation sector generates approximately 75% of its revenue in the United States. An expanding US economy and our North American strategic market position led to increased organic growth opportunities, especially in the alternative project delivery market where we had several program management, light-rail transit, roadway, and bridge projects in various stages of development.
Our maturity and prominence in the Transportation sector allows us to compete for very large projects, which attracts top talent, increases our diversity, and positions us to compete in both large and small markets. Transportation’s backlog grew, and we continued to pursue large project opportunities in both Canada and the United States.
Highlights of projects in the quarter include our Community Development team winning the Alberta Infrastructure contract to provide project management, preliminary design, detailed design, and construction management for the next five years on the 2,000-acre Parsons Creek master-planned community development in Fort McMurray, Alberta. The Parsons Creek community will eventually be home to about 24,000 people.
Water Gross revenue for our Water business operating unit increased 29.1% in Q2 17 compared to Q2 16 and increased 77.1% year to date in 2017 compared to the same period in 2016. These increases resulted from acquisition growth and organic revenue growth of 4.1% in Q2 17 compared to Q2 16 and 3.4% year to date in 2017 compared to year to date in 2016. During Q2 17, organic growth in gross revenue was notably strongest in our global operations, and we had modest positive organic growth in our US operations, particularly in Texas. Stability in our Canadian operations was supported by strong large project growth in Alberta and British Columbia, combined with retraction in other Prairie Provinces and Quebec. Year over year, organic revenue growth occurred in each of our Canada, US, and global operations.
Organic growth in North America in the first half of 2017 compared to the same period in 2016 was driven by the following: alternative project delivery, coastal restoration and protection, mandated regulatory improvements, water supply portfolio planning to accommodate growth and technology applications around water quality regulatory mandates, and operational efficiency.
Our Water sector in the United Kingdom benefited from strong revenue in the UK Water Asset Management Programme (AMP6) cycle. Our Middle East operations remained stable because of ongoing programs in Qatar and Dubai. In our Asia Pacific Water operations, revenues were better than expected, driven by the receipt of contract change orders, particularly in our Sydney, Australia, operations.
Management’s Discussion and Analysis (unaudited) June 30, 2017 M-16 Stantec Inc.
Highlights of projects secured in the quarter include a contract amendment to design the pump station and pipelines for the City of San Mateo, California’s Basins 2 and 3 Collection System Improvements Project. The project, part of the City’s Clean Water Program, will eliminate overflows from the City’s water collection and treatment systems, protecting San Francisco Bay from unwanted discharges of contaminated water.
Also during the quarter, we were awarded a five-year contract for continued implementation of a Capacity Assurance Program (CAP) for Lexington, Kentucky. Stantec was awarded a similar five-year contract in 2012 to develop and implement the City’s CAP. The CAP, mandated by federal consent decree under the U.S. Clean Water Act, ensures that there is adequate capacity in the wastewater conveyance, transmission, and treatment systems before new connections to the wastewater sewer system are authorized.
We believe that our goal of occupying the number one position in water and sewer work in the world has been realized with the combination of Stantec and MWH.
GROSS MARGIN For a definition of gross margin, refer to the Definitions section of our 2016 Annual Report (incorporated here by reference). Gross margin as a percentage of net revenue was 53.8% in Q2 17 compared to 53.6% in Q2 16. The year-to-date gross margin was 53.9% in 2017 compared to 53.8% in 2016. Our gross margin was within our previously targeted range of 53.0% to 55.0% (set out in our 2016 Annual Report). The increase from Q2 16 to Q2 17 resulted from an increase in margins in our US operations and in Consulting Services, particularly in our Buildings and Infrastructure business operating units.
The following table summarizes gross margin percentages by reportable segments:
In general, gross margin fluctuations depend on the particular mix of projects in progress during any quarter and on project execution. The fluctuations reflect our business model, which is based on providing two primary service offerings—Consulting Services and Construction Services—across diverse geographic locations, business operating units (within Consulting Services), and all phases of the infrastructure and facilities project life cycle.
In Consulting Services, our US operations had higher margins in Q2 17 compared to Q2 16 and year to date mainly from the mix of projects acquired from MWH and predominantly in the Water and Energy & Resources business operating units due in part to the scale of projects and the way we managed the scope of the work.
Margins for our Global operations decreased in Q2 17 compared to Q2 16 due to a lower mix of high-margin mining projects, a higher mix of low-margin water projects, and the May 5, 2017, divestiture of Innovyze, which operated at high margins. Year-to-date gross margins declined compared to the same period in 2016 primarily due to a change in the mix of projects acquired from MWH, particularly in our Mining sector and Water business operating unit. This was partly offset by a higher contribution from Innovyze in 2017 compared to 2016.
Gross Margin by Reportable Segments
2017 2016 2017 2016Consulting Services
Canada 53.5% 53.3% 53.5% 53.8%United States 55.6% 54.3% 55.8% 54.1%Global 54.0% 59.9% 57.5% 58.2%
Construction Services 34.5% 36.6% 36.1% 36.6%Note: Comparative figures have been reclassified due to a realignment between Consulting Services—United States and Consulting Services—Global reportable segments.
Quarter EndedJune 30
Two Quarters EndedJune 30
Management’s Discussion and Analysis (unaudited) June 30, 2017 M-17 Stantec Inc.
Construction Services is a high-volume, lower-margin business that incurs more subcontractors and direct expenditures than Consulting Services. Margins decreased in Q2 17 compared to Q2 16 due to the extensions of project life completion dates for certain US- and UK-based projects that have resulted in recognizing additional costs. Also, a US facility management project with a lower margin had higher activity in Q2 17 compared to Q2 16.
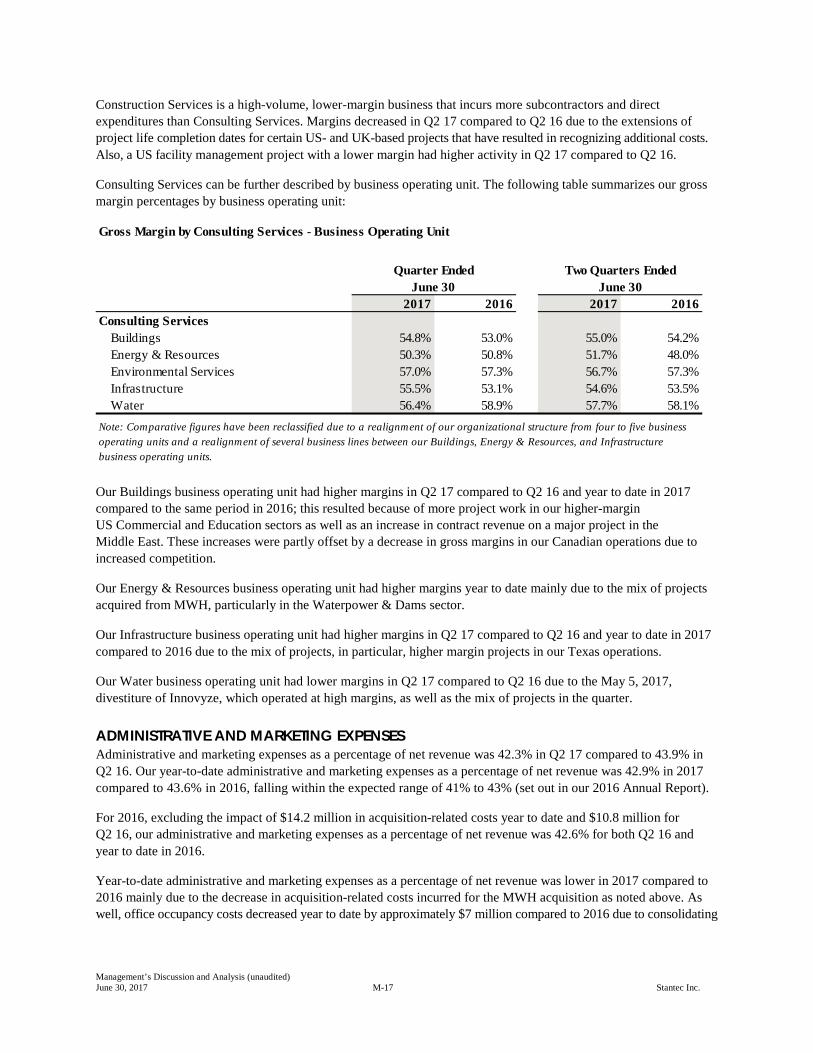
Consulting Services can be further described by business operating unit. The following table summarizes our gross margin percentages by business operating unit:
Our Buildings business operating unit had higher margins in Q2 17 compared to Q2 16 and year to date in 2017 compared to the same period in 2016; this resulted because of more project work in our higher-margin US Commercial and Education sectors as well as an increase in contract revenue on a major project in the Middle East. These increases were partly offset by a decrease in gross margins in our Canadian operations due to increased competition.
Our Energy & Resources business operating unit had higher margins year to date mainly due to the mix of projects acquired from MWH, particularly in the Waterpower & Dams sector.
Our Infrastructure business operating unit had higher margins in Q2 17 compared to Q2 16 and year to date in 2017 compared to 2016 due to the mix of projects, in particular, higher margin projects in our Texas operations.
Our Water business operating unit had lower margins in Q2 17 compared to Q2 16 due to the May 5, 2017, divestiture of Innovyze, which operated at high margins, as well as the mix of projects in the quarter.
ADMINISTRATIVE AND MARKETING EXPENSES Administrative and marketing expenses as a percentage of net revenue was 42.3% in Q2 17 compared to 43.9% in Q2 16. Our year-to-date administrative and marketing expenses as a percentage of net revenue was 42.9% in 2017 compared to 43.6% in 2016, falling within the expected range of 41% to 43% (set out in our 2016 Annual Report).
For 2016, excluding the impact of $14.2 million in acquisition-related costs year to date and $10.8 million for Q2 16, our administrative and marketing expenses as a percentage of net revenue was 42.6% for both Q2 16 and year to date in 2016.
Year-to-date administrative and marketing expenses as a percentage of net revenue was lower in 2017 compared to 2016 mainly due to the decrease in acquisition-related costs incurred for the MWH acquisition as noted above. As well, office occupancy costs decreased year to date by approximately $7 million compared to 2016 due to consolidating
Gross Margin by Consulting Services - Business Operating Unit
2017 2016 2017 2016Consulting Services
Buildings 54.8% 53.0% 55.0% 54.2%Energy & Resources 50.3% 50.8% 51.7% 48.0%Environmental Services 57.0% 57.3% 56.7% 57.3%Infrastructure 55.5% 53.1% 54.6% 53.5%Water 56.4% 58.9% 57.7% 58.1%
Quarter EndedJune 30
Two Quarters EndedJune 30
Note: Comparative figures have been reclassified due to a realignment of our organizational structure from four to five business operating units and a realignment of several business lines between our Buildings, Energy & Resources, and Infrastructure business operating units.
Management’s Discussion and Analysis (unaudited) June 30, 2017 M-18 Stantec Inc.
our offices and optimizing our existing office space. These decreases were partly offset by higher IT software licensing and investments in our core infrastructure of approximately $9 million year to date. Also, project and financial MWH Americas integration activities of approximately $2 million were incurred because of lower utilization.
Administrative and marketing expenses fluctuate year to year because of the amount of staff time charged to marketing and administrative labor, which is influenced by the mix of projects in progress during the period, by business development, and by integration activities resulting from acquisitions. In the months after completing an acquisition, staff time charged to administration and marketing is generally higher because of integration activities, including orienting newly acquired staff.
AMORTIZATION OF INTANGIBLE ASSETS The timing of completed acquisitions, size of acquisitions, and type of intangible assets acquired impact the amount of amortization of intangible assets in a period. Client relationships are amortized over estimated useful lives ranging from 10 to 15 years, and contract backlog and finite-lived trademarks are generally amortized over an estimated useful life of 1 to 3 years. Consequently, the impact of the amortization of contract backlog can be significant in the 4 to 12 quarters following an acquisition. Also included in intangible assets is purchased and internally generated computer software that is amortized over an estimated useful life ranging from 3 to 7 years.
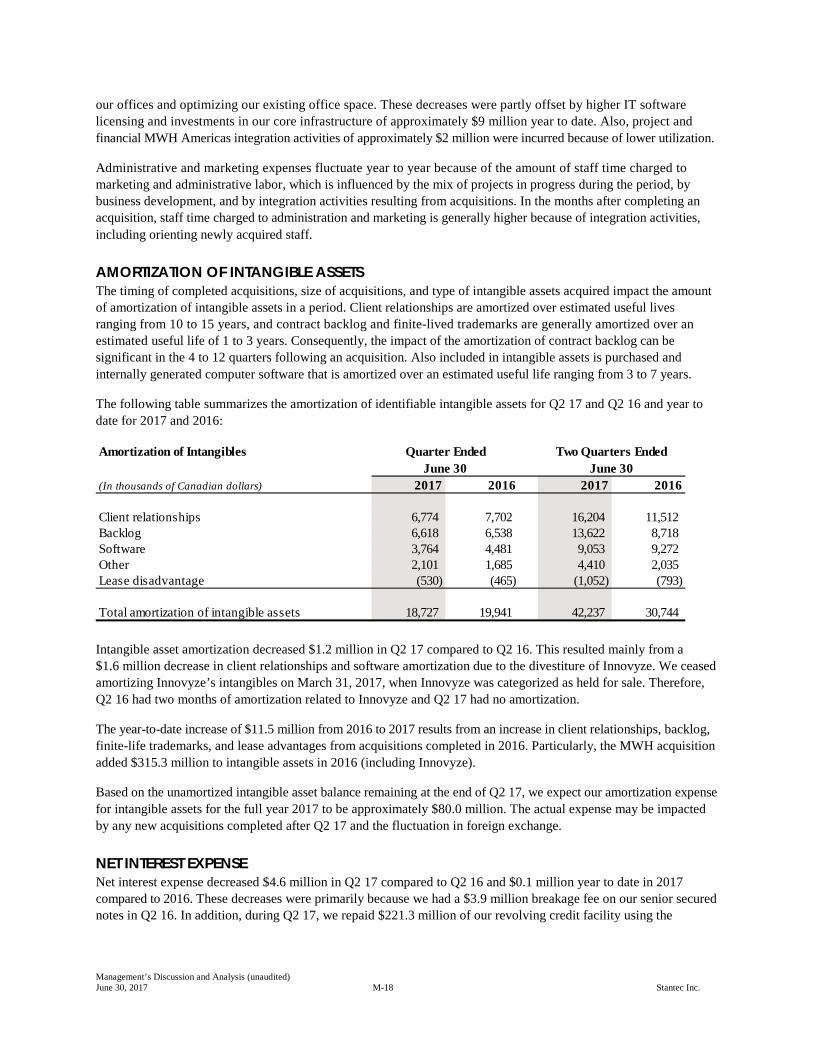
The following table summarizes the amortization of identifiable intangible assets for Q2 17 and Q2 16 and year to date for 2017 and 2016:
Intangible asset amortization decreased $1.2 million in Q2 17 compared to Q2 16. This resulted mainly from a $1.6 million decrease in client relationships and software amortization due to the divestiture of Innovyze. We ceased amortizing Innovyze’s intangibles on March 31, 2017, when Innovyze was categorized as held for sale. Therefore, Q2 16 had two months of amortization related to Innovyze and Q2 17 had no amortization.
The year-to-date increase of $11.5 million from 2016 to 2017 results from an increase in client relationships, backlog, finite-life trademarks, and lease advantages from acquisitions completed in 2016. Particularly, the MWH acquisition added $315.3 million to intangible assets in 2016 (including Innovyze).
Based on the unamortized intangible asset balance remaining at the end of Q2 17, we expect our amortization expense for intangible assets for the full year 2017 to be approximately $80.0 million. The actual expense may be impacted by any new acquisitions completed after Q2 17 and the fluctuation in foreign exchange.
NET INTEREST EXPENSE Net interest expense decreased $4.6 million in Q2 17 compared to Q2 16 and $0.1 million year to date in 2017 compared to 2016. These decreases were primarily because we had a $3.9 million breakage fee on our senior secured notes in Q2 16. In addition, during Q2 17, we repaid $221.3 million of our revolving credit facility using the
Amortization of Intangibles
(In thousands of Canadian dollars) 2017 2016 2017 2016
Client relationships 6,774 7,702 16,204 11,512 Backlog 6,618 6,538 13,622 8,718 Software 3,764 4,481 9,053 9,272 Other 2,101 1,685 4,410 2,035 Lease disadvantage (530) (465) (1,052) (793)
Total amortization of intangible assets 18,727 19,941 42,237 30,744
Quarter EndedJune 30
Two Quarters EndedJune 30
Management’s Discussion and Analysis (unaudited) June 30, 2017 M-19 Stantec Inc.
proceeds we received from the Innovyze sale. The balance outstanding on our revolving credit facility and term loan was $713.4 million at June 30, 2017, and $942.8 million at June 30, 2016. We had a higher outstanding long-term debt balance in Q1 17 compared to Q1 16, which was incurred mainly for the MWH acquisition in May 2016. The average interest rate for our current revolving credit facility and term loan was approximately 3.25% at June 30, 2017, and approximately 3.0% at June 30, 2016. Our financing arrangements are further described in the Liquidity and Capital Resources section of this report.
Based on our credit balance at June 30, 2017, we estimate that a 0.5% increase in interest rates, with all other variables held constant, would have decreased net income for the first two quarters of 2017 by $1.3 million and decreased basic earnings per share (EPS) by $0.01. If the interest rate had been 0.5% lower, an equal and opposite impact on net income and basic EPS would have occurred.
FOREIGN EXCHANGE GAINS AND LOSSES We recorded a $1.1 million foreign exchange gain in Q2 17 compared to an immaterial foreign exchange gain in Q2 16. These gains arose from the translation of foreign-denominated assets and liabilities held in our Canadian, US, and other foreign subsidiaries. We minimize our exposure to foreign exchange fluctuations by matching foreign currency assets with foreign currency liabilities and, when appropriate, by entering into forward contracts to buy or sell foreign currencies in exchange for Canadian dollars. The foreign exchange gain reported during the quarter was caused by the volatility of daily foreign exchange rates and by the timing of the recognition and relief of foreign-denominated assets and liabilities.
We recorded an $81.3 million loss on the translation of our foreign operations in other comprehensive income in the first two quarters of 2017 compared to a $56.0 million loss in the same period in 2016. These unrealized losses arose when translating our foreign operations into Canadian dollars. The loss during the first two quarters of 2017 was a result of the strengthening Canadian dollar—from US$0.74 at December 31, 2016, to US$0.77 at June 30, 2017.
We estimate that at June 30, 2017, a 1.0% decrease in foreign exchange rates, with all other variables held constant, would have increased net income by $34,000 for the first two quarters of 2017 and increased basic earnings per share by less than $0.01. If the exchange rates had increased by 1.0%, an equal and opposite impact on net loss and basic loss per share would have occurred.
INNOVYZE SALE On May 5, 2017, we completed the sale of the shares of our software business, Innovyze, to the EQT Mid Market US fund, part of the international alternative investments firm EQT, for gross proceeds of $369.1 million (US$270 million), less estimated working capital adjustments, resulting in net cash proceeds of $336.9 million. The working capital adjustments are expected to be finalized in the third quarter, at which time the payable will be settled.
In Q1 17, we recorded a $90.4 million deferred tax liability and expense relating to the value of our net investment in Innovyze—the goodwill allocated to Innovyze and its undistributed profits. This deferred tax liability was reversed in Q2 17 when we recorded the gain on sale and current tax expense. This sale transaction resulted in an accounting gain of $54.6 million. The gain for tax purposes was $352.6 million, which is higher than the accounting gain because the adjusted cost base (for tax purposes) of Innovyze was $9.0 million, resulting in a current tax provision of $124.1 million (further explained in the Income Taxes section of this report).
During the quarter, the Company used the net proceeds on sale, less taxes payable and certain transaction costs, to repay its long-term debt by $221.3 million.
Management’s Discussion and Analysis (unaudited) June 30, 2017 M-20 Stantec Inc.
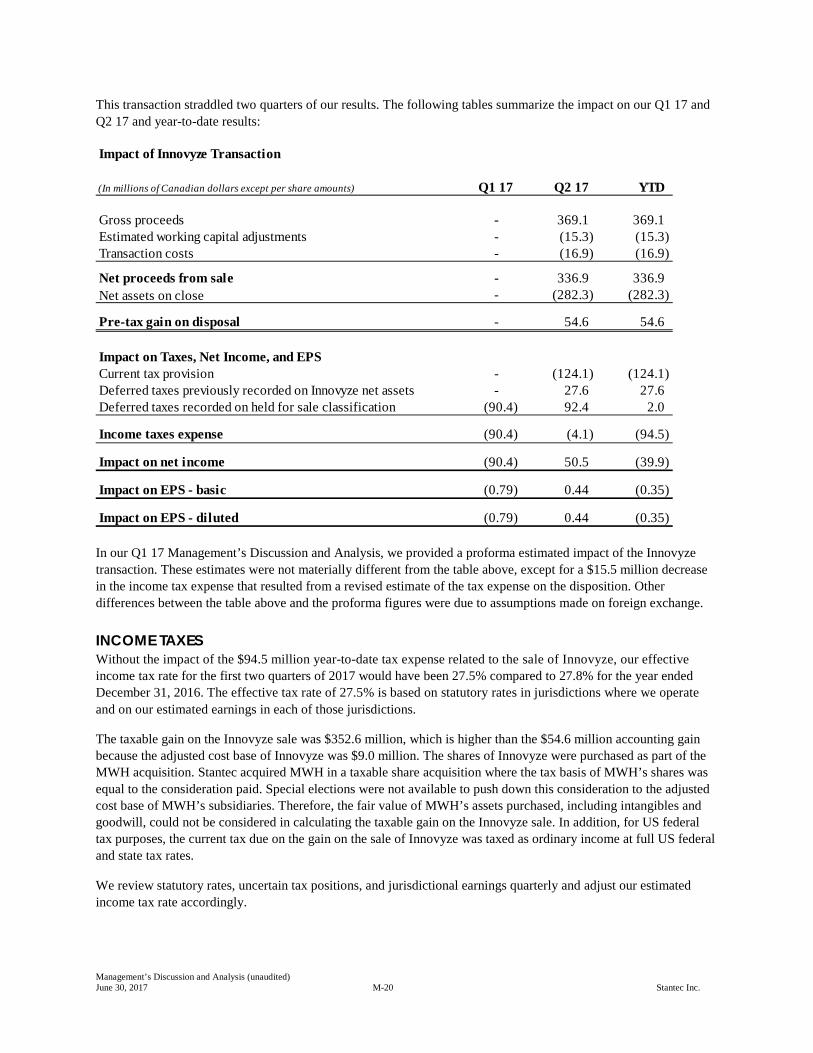
This transaction straddled two quarters of our results. The following tables summarize the impact on our Q1 17 and Q2 17 and year-to-date results:
In our Q1 17 Management’s Discussion and Analysis, we provided a proforma estimated impact of the Innovyze transaction. These estimates were not materially different from the table above, except for a $15.5 million decrease in the income tax expense that resulted from a revised estimate of the tax expense on the disposition. Other differences between the table above and the proforma figures were due to assumptions made on foreign exchange.
INCOME TAXES Without the impact of the $94.5 million year-to-date tax expense related to the sale of Innovyze, our effective income tax rate for the first two quarters of 2017 would have been 27.5% compared to 27.8% for the year ended December 31, 2016. The effective tax rate of 27.5% is based on statutory rates in jurisdictions where we operate and on our estimated earnings in each of those jurisdictions.
The taxable gain on the Innovyze sale was $352.6 million, which is higher than the $54.6 million accounting gain because the adjusted cost base of Innovyze was $9.0 million. The shares of Innovyze were purchased as part of the MWH acquisition. Stantec acquired MWH in a taxable share acquisition where the tax basis of MWH’s shares was equal to the consideration paid. Special elections were not available to push down this consideration to the adjusted cost base of MWH’s subsidiaries. Therefore, the fair value of MWH’s assets purchased, including intangibles and goodwill, could not be considered in calculating the taxable gain on the Innovyze sale. In addition, for US federal tax purposes, the current tax due on the gain on the sale of Innovyze was taxed as ordinary income at full US federal and state tax rates.
We review statutory rates, uncertain tax positions, and jurisdictional earnings quarterly and adjust our estimated income tax rate accordingly.
Impact of Innovyze Transaction
(In millions of Canadian dollars except per share amounts) Q1 17 Q2 17 YTD
Gross proceeds - 369.1 369.1 Estimated working capital adjustments - (15.3) (15.3) Transaction costs - (16.9) (16.9)
Net proceeds from sale - 336.9 336.9 Net assets on close - (282.3) (282.3)
Pre-tax gain on disposal - 54.6 54.6
Impact on Taxes, Net Income, and EPSCurrent tax provision - (124.1) (124.1) Deferred taxes previously recorded on Innovyze net assets - 27.6 27.6 Deferred taxes recorded on held for sale classification (90.4) 92.4 2.0
Income taxes expense (90.4) (4.1) (94.5)
Impact on net income (90.4) 50.5 (39.9)
Impact on EPS - basic (0.79) 0.44 (0.35)
Impact on EPS - diluted (0.79) 0.44 (0.35)
Management’s Discussion and Analysis (unaudited) June 30, 2017 M-21 Stantec Inc.
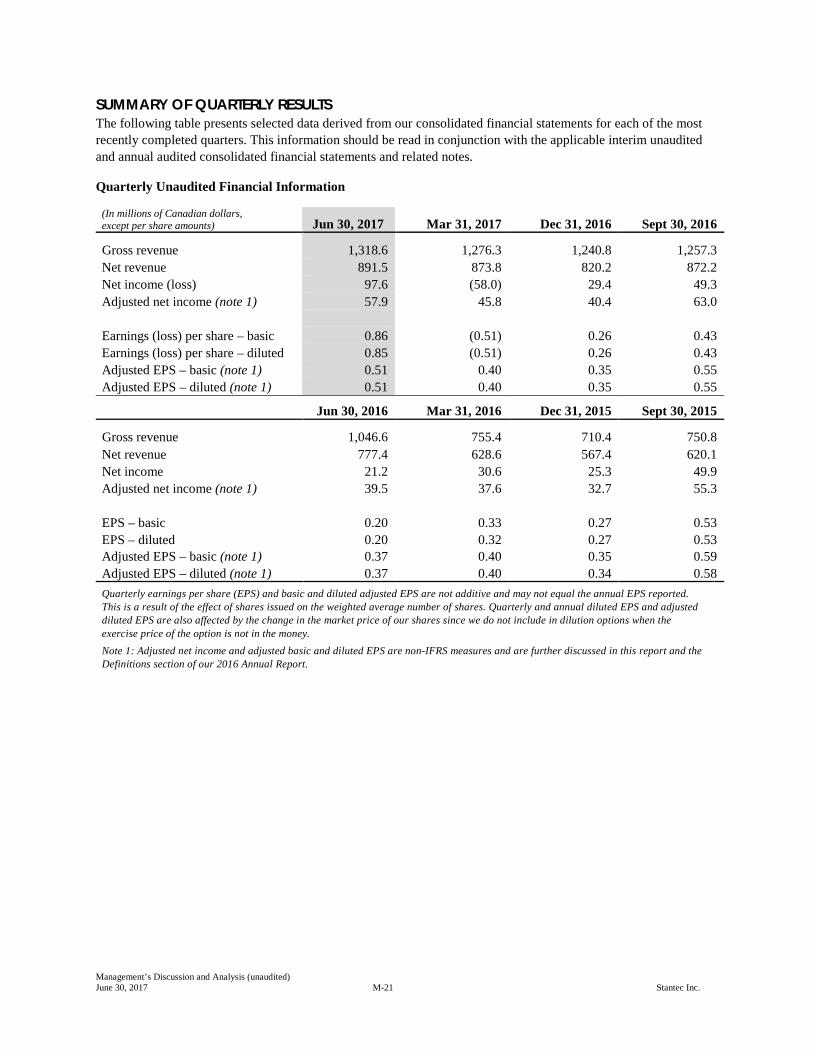
SUMMARY OF QUARTERLY RESULTS The following table presents selected data derived from our consolidated financial statements for each of the most recently completed quarters. This information should be read in conjunction with the applicable interim unaudited and annual audited consolidated financial statements and related notes.
Quarterly Unaudited Financial Information
(In millions of Canadian dollars, except per share amounts) Jun 30, 2017 Mar 31, 2017 Dec 31, 2016 Sept 30, 2016
Gross revenue 1,318.6 1,276.3 1,240.8 1,257.3 Net revenue 891.5 873.8 820.2 872.2 Net income (loss) 97.6 (58.0) 29.4 49.3 Adjusted net income (note 1) 57.9 45.8 40.4 63.0 Earnings (loss) per share – basic 0.86 (0.51) 0.26 0.43 Earnings (loss) per share – diluted 0.85 (0.51) 0.26 0.43 Adjusted EPS – basic (note 1) 0.51 0.40 0.35 0.55 Adjusted EPS – diluted (note 1) 0.51 0.40 0.35 0.55 Jun 30, 2016 Mar 31, 2016 Dec 31, 2015 Sept 30, 2015
Gross revenue 1,046.6 755.4 710.4 750.8 Net revenue 777.4 628.6 567.4 620.1 Net income 21.2 30.6 25.3 49.9 Adjusted net income (note 1) 39.5 37.6 32.7 55.3 EPS – basic 0.20 0.33 0.27 0.53 EPS – diluted 0.20 0.32 0.27 0.53 Adjusted EPS – basic (note 1) 0.37 0.40 0.35 0.59 Adjusted EPS – diluted (note 1) 0.37 0.40 0.34 0.58 Quarterly earnings per share (EPS) and basic and diluted adjusted EPS are not additive and may not equal the annual EPS reported. This is a result of the effect of shares issued on the weighted average number of shares. Quarterly and annual diluted EPS and adjusted diluted EPS are also affected by the change in the market price of our shares since we do not include in dilution options when the exercise price of the option is not in the money. Note 1: Adjusted net income and adjusted basic and diluted EPS are non-IFRS measures and are further discussed in this report and the Definitions section of our 2016 Annual Report.
Management’s Discussion and Analysis (unaudited) June 30, 2017 M-22 Stantec Inc.
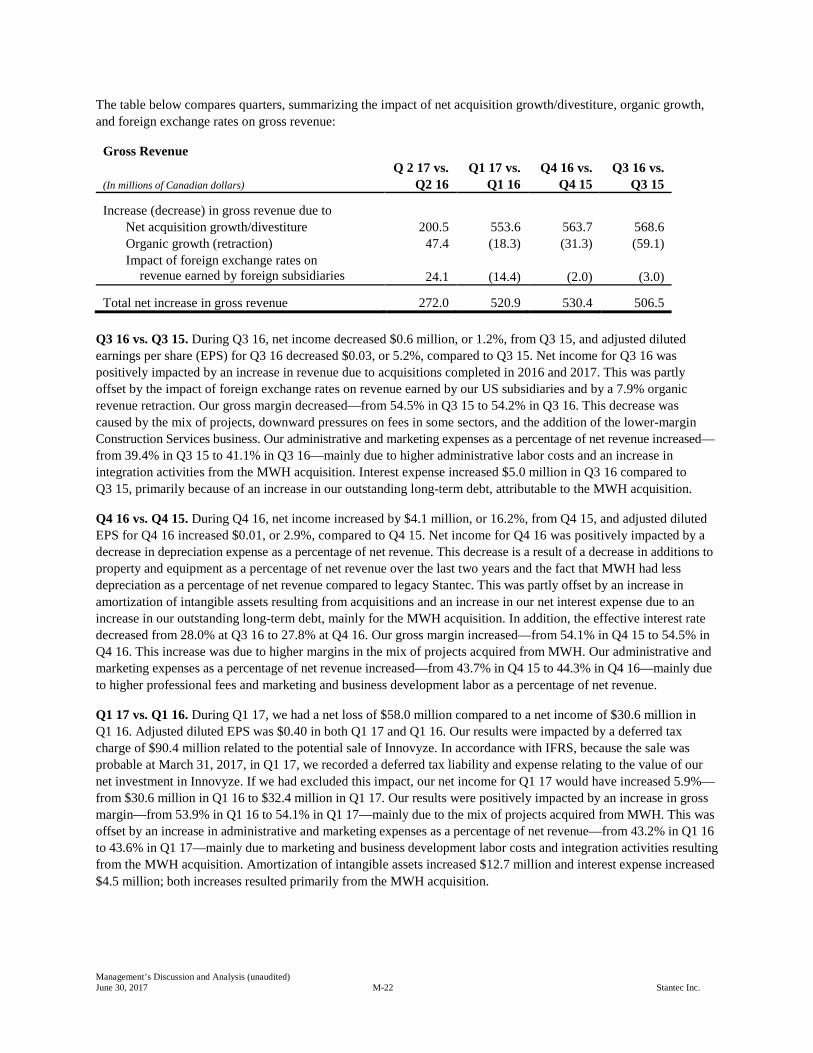
The table below compares quarters, summarizing the impact of net acquisition growth/divestiture, organic growth, and foreign exchange rates on gross revenue:
Gross Revenue
(In millions of Canadian dollars) Q 2 17 vs.
Q2 16 Q1 17 vs.
Q1 16 Q4 16 vs.
Q4 15 Q3 16 vs.
Q3 15
Increase (decrease) in gross revenue due to Net acquisition growth/divestiture 200.5 553.6 563.7 568.6 Organic growth (retraction) 47.4 (18.3) (31.3) (59.1) Impact of foreign exchange rates on
revenue earned by foreign subsidiaries
24.1
(14.4)
(2.0)
(3.0)
Total net increase in gross revenue 272.0 520.9 530.4 506.5 Q3 16 vs. Q3 15. During Q3 16, net income decreased $0.6 million, or 1.2%, from Q3 15, and adjusted diluted earnings per share (EPS) for Q3 16 decreased $0.03, or 5.2%, compared to Q3 15. Net income for Q3 16 was positively impacted by an increase in revenue due to acquisitions completed in 2016 and 2017. This was partly offset by the impact of foreign exchange rates on revenue earned by our US subsidiaries and by a 7.9% organic revenue retraction. Our gross margin decreased—from 54.5% in Q3 15 to 54.2% in Q3 16. This decrease was caused by the mix of projects, downward pressures on fees in some sectors, and the addition of the lower-margin Construction Services business. Our administrative and marketing expenses as a percentage of net revenue increased—from 39.4% in Q3 15 to 41.1% in Q3 16—mainly due to higher administrative labor costs and an increase in integration activities from the MWH acquisition. Interest expense increased $5.0 million in Q3 16 compared to Q3 15, primarily because of an increase in our outstanding long-term debt, attributable to the MWH acquisition.
Q4 16 vs. Q4 15. During Q4 16, net income increased by $4.1 million, or 16.2%, from Q4 15, and adjusted diluted EPS for Q4 16 increased $0.01, or 2.9%, compared to Q4 15. Net income for Q4 16 was positively impacted by a decrease in depreciation expense as a percentage of net revenue. This decrease is a result of a decrease in additions to property and equipment as a percentage of net revenue over the last two years and the fact that MWH had less depreciation as a percentage of net revenue compared to legacy Stantec. This was partly offset by an increase in amortization of intangible assets resulting from acquisitions and an increase in our net interest expense due to an increase in our outstanding long-term debt, mainly for the MWH acquisition. In addition, the effective interest rate decreased from 28.0% at Q3 16 to 27.8% at Q4 16. Our gross margin increased—from 54.1% in Q4 15 to 54.5% in Q4 16. This increase was due to higher margins in the mix of projects acquired from MWH. Our administrative and marketing expenses as a percentage of net revenue increased—from 43.7% in Q4 15 to 44.3% in Q4 16—mainly due to higher professional fees and marketing and business development labor as a percentage of net revenue.
Q1 17 vs. Q1 16. During Q1 17, we had a net loss of $58.0 million compared to a net income of $30.6 million in Q1 16. Adjusted diluted EPS was $0.40 in both Q1 17 and Q1 16. Our results were impacted by a deferred tax charge of $90.4 million related to the potential sale of Innovyze. In accordance with IFRS, because the sale was probable at March 31, 2017, in Q1 17, we recorded a deferred tax liability and expense relating to the value of our net investment in Innovyze. If we had excluded this impact, our net income for Q1 17 would have increased 5.9%—from $30.6 million in Q1 16 to $32.4 million in Q1 17. Our results were positively impacted by an increase in gross margin—from 53.9% in Q1 16 to 54.1% in Q1 17—mainly due to the mix of projects acquired from MWH. This was offset by an increase in administrative and marketing expenses as a percentage of net revenue—from 43.2% in Q1 16 to 43.6% in Q1 17—mainly due to marketing and business development labor costs and integration activities resulting from the MWH acquisition. Amortization of intangible assets increased $12.7 million and interest expense increased $4.5 million; both increases resulted primarily from the MWH acquisition.
Management’s Discussion and Analysis (unaudited) June 30, 2017 M-23 Stantec Inc.
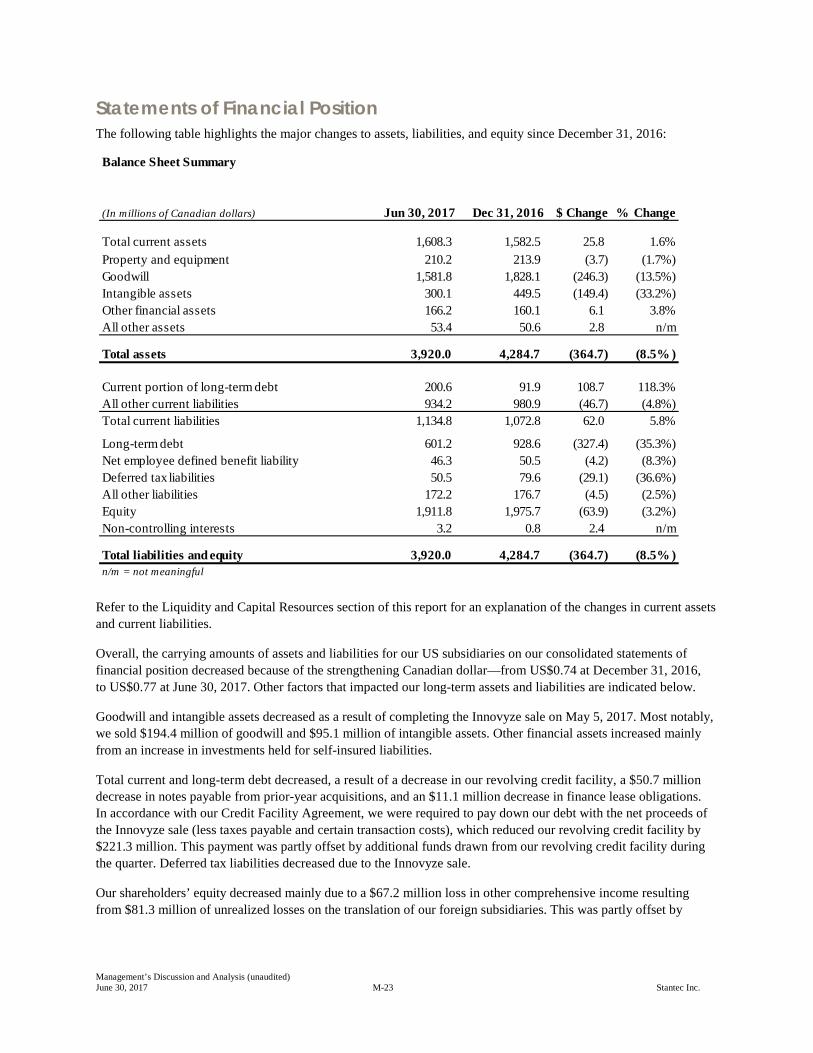
Statements of Financial Position The following table highlights the major changes to assets, liabilities, and equity since December 31, 2016:
Refer to the Liquidity and Capital Resources section of this report for an explanation of the changes in current assets and current liabilities.
Overall, the carrying amounts of assets and liabilities for our US subsidiaries on our consolidated statements of financial position decreased because of the strengthening Canadian dollar—from US$0.74 at December 31, 2016, to US$0.77 at June 30, 2017. Other factors that impacted our long-term assets and liabilities are indicated below.
Goodwill and intangible assets decreased as a result of completing the Innovyze sale on May 5, 2017. Most notably, we sold $194.4 million of goodwill and $95.1 million of intangible assets. Other financial assets increased mainly from an increase in investments held for self-insured liabilities.
Total current and long-term debt decreased, a result of a decrease in our revolving credit facility, a $50.7 million decrease in notes payable from prior-year acquisitions, and an $11.1 million decrease in finance lease obligations. In accordance with our Credit Facility Agreement, we were required to pay down our debt with the net proceeds of the Innovyze sale (less taxes payable and certain transaction costs), which reduced our revolving credit facility by $221.3 million. This payment was partly offset by additional funds drawn from our revolving credit facility during the quarter. Deferred tax liabilities decreased due to the Innovyze sale.
Our shareholders’ equity decreased mainly due to a $67.2 million loss in other comprehensive income resulting from $81.3 million of unrealized losses on the translation of our foreign subsidiaries. This was partly offset by
Balance Sheet Summary
(In millions of Canadian dollars) Jun 30, 2017 Dec 31, 2016 $ Change % Change
Total current assets 1,608.3 1,582.5 25.8 1.6% Property and equipment 210.2 213.9 (3.7) (1.7%)Goodwill 1,581.8 1,828.1 (246.3) (13.5%)Intangible assets 300.1 449.5 (149.4) (33.2%)Other financial assets 166.2 160.1 6.1 3.8%All other assets 53.4 50.6 2.8 n/m
Total assets 3,920.0 4,284.7 (364.7) (8.5% )
Current portion of long-term debt 200.6 91.9 108.7 118.3%All other current liabilities 934.2 980.9 (46.7) (4.8%)Total current liabilities 1,134.8 1,072.8 62.0 5.8%
Long-term debt 601.2 928.6 (327.4) (35.3%)Net employee defined benefit liability 46.3 50.5 (4.2) (8.3%)Deferred tax liabilities 50.5 79.6 (29.1) (36.6%)All other liabilities 172.2 176.7 (4.5) (2.5%)Equity 1,911.8 1,975.7 (63.9) (3.2%)Non-controlling interests 3.2 0.8 2.4 n/m
Total liabilities and equity 3,920.0 4,284.7 (364.7) (8.5% )n/m = not meaningful
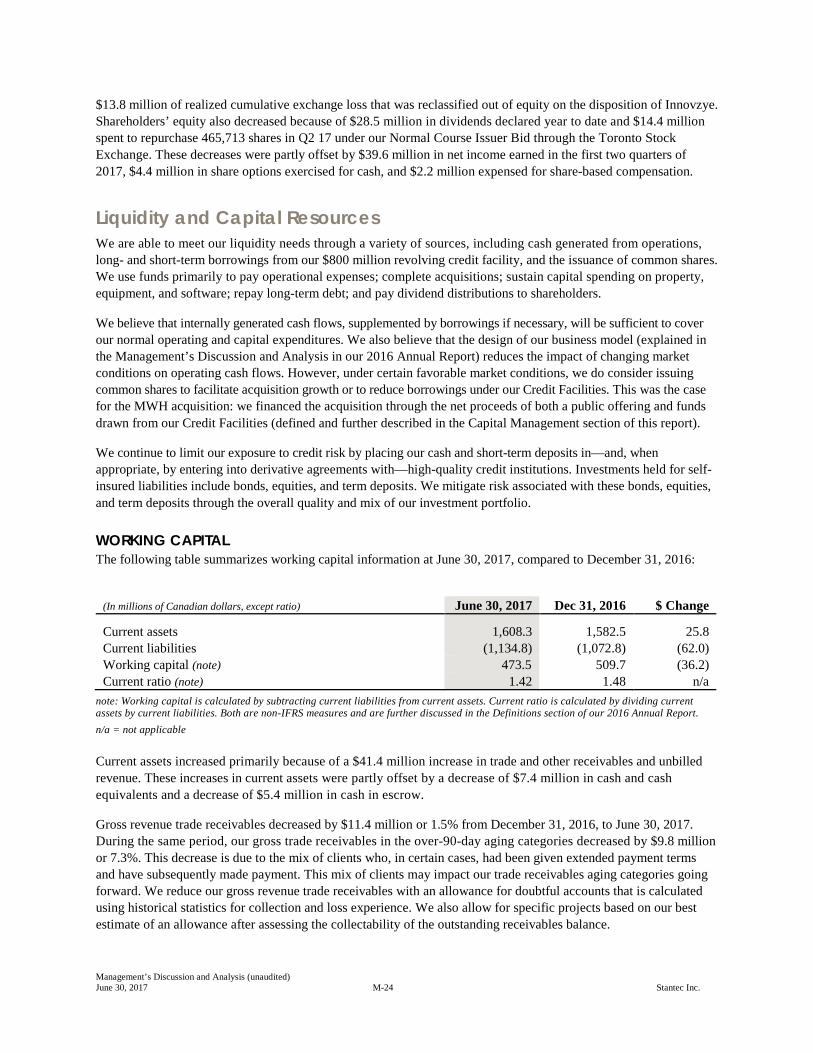
Management’s Discussion and Analysis (unaudited) June 30, 2017 M-24 Stantec Inc.
$13.8 million of realized cumulative exchange loss that was reclassified out of equity on the disposition of Innovzye. Shareholders’ equity also decreased because of $28.5 million in dividends declared year to date and $14.4 million spent to repurchase 465,713 shares in Q2 17 under our Normal Course Issuer Bid through the Toronto Stock Exchange. These decreases were partly offset by $39.6 million in net income earned in the first two quarters of 2017, $4.4 million in share options exercised for cash, and $2.2 million expensed for share-based compensation.
Liquidity and Capital Resources We are able to meet our liquidity needs through a variety of sources, including cash generated from operations, long- and short-term borrowings from our $800 million revolving credit facility, and the issuance of common shares. We use funds primarily to pay operational expenses; complete acquisitions; sustain capital spending on property, equipment, and software; repay long-term debt; and pay dividend distributions to shareholders.
We believe that internally generated cash flows, supplemented by borrowings if necessary, will be sufficient to cover our normal operating and capital expenditures. We also believe that the design of our business model (explained in the Management’s Discussion and Analysis in our 2016 Annual Report) reduces the impact of changing market conditions on operating cash flows. However, under certain favorable market conditions, we do consider issuing common shares to facilitate acquisition growth or to reduce borrowings under our Credit Facilities. This was the case for the MWH acquisition: we financed the acquisition through the net proceeds of both a public offering and funds drawn from our Credit Facilities (defined and further described in the Capital Management section of this report).
We continue to limit our exposure to credit risk by placing our cash and short-term deposits in—and, when appropriate, by entering into derivative agreements with—high-quality credit institutions. Investments held for self-insured liabilities include bonds, equities, and term deposits. We mitigate risk associated with these bonds, equities, and term deposits through the overall quality and mix of our investment portfolio.
WORKING CAPITAL The following table summarizes working capital information at June 30, 2017, compared to December 31, 2016:
(In millions of Canadian dollars, except ratio) June 30, 2017 Dec 31, 2016 $ Change
Current assets 1,608.3 1,582.5 25.8 Current liabilities (1,134.8) (1,072.8) (62.0) Working capital (note) 473.5 509.7 (36.2) Current ratio (note) 1.42 1.48 n/a
note: Working capital is calculated by subtracting current liabilities from current assets. Current ratio is calculated by dividing current assets by current liabilities. Both are non-IFRS measures and are further discussed in the Definitions section of our 2016 Annual Report. n/a = not applicable Current assets increased primarily because of a $41.4 million increase in trade and other receivables and unbilled revenue. These increases in current assets were partly offset by a decrease of $7.4 million in cash and cash equivalents and a decrease of $5.4 million in cash in escrow.
Gross revenue trade receivables decreased by $11.4 million or 1.5% from December 31, 2016, to June 30, 2017. During the same period, our gross trade receivables in the over-90-day aging categories decreased by $9.8 million or 7.3%. This decrease is due to the mix of clients who, in certain cases, had been given extended payment terms and have subsequently made payment. This mix of clients may impact our trade receivables aging categories going forward. We reduce our gross revenue trade receivables with an allowance for doubtful accounts that is calculated using historical statistics for collection and loss experience. We also allow for specific projects based on our best estimate of an allowance after assessing the collectability of the outstanding receivables balance.
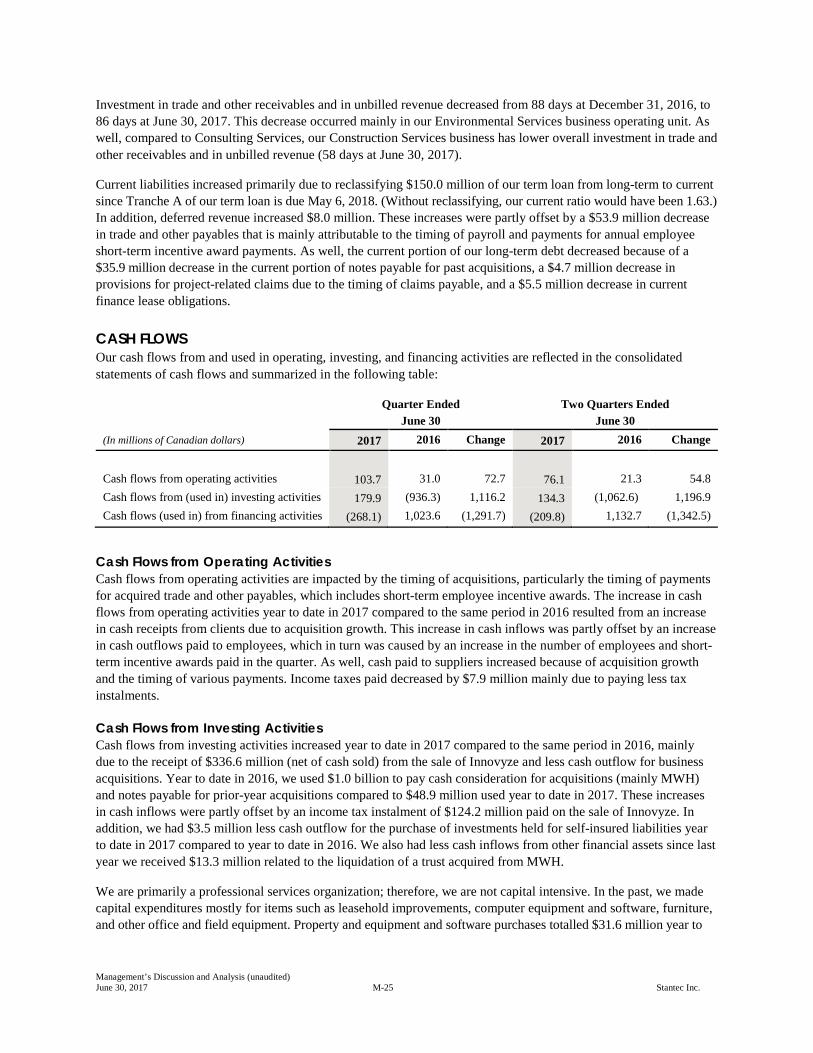
Management’s Discussion and Analysis (unaudited) June 30, 2017 M-25 Stantec Inc.
Investment in trade and other receivables and in unbilled revenue decreased from 88 days at December 31, 2016, to 86 days at June 30, 2017. This decrease occurred mainly in our Environmental Services business operating unit. As well, compared to Consulting Services, our Construction Services business has lower overall investment in trade and other receivables and in unbilled revenue (58 days at June 30, 2017).
Current liabilities increased primarily due to reclassifying $150.0 million of our term loan from long-term to current since Tranche A of our term loan is due May 6, 2018. (Without reclassifying, our current ratio would have been 1.63.) In addition, deferred revenue increased $8.0 million. These increases were partly offset by a $53.9 million decrease in trade and other payables that is mainly attributable to the timing of payroll and payments for annual employee short-term incentive award payments. As well, the current portion of our long-term debt decreased because of a $35.9 million decrease in the current portion of notes payable for past acquisitions, a $4.7 million decrease in provisions for project-related claims due to the timing of claims payable, and a $5.5 million decrease in current finance lease obligations.
CASH FLOWS Our cash flows from and used in operating, investing, and financing activities are reflected in the consolidated statements of cash flows and summarized in the following table:
Quarter Ended June 30
Two Quarters Ended June 30
(In millions of Canadian dollars) 2017 2016 Change 2017 2016 Change
Cash flows from operating activities 103.7 31.0 72.7 76.1 21.3 54.8 Cash flows from (used in) investing activities 179.9 (936.3) 1,116.2 134.3 (1,062.6) 1,196.9 Cash flows (used in) from financing activities (268.1) 1,023.6 (1,291.7) (209.8) 1,132.7 (1,342.5)
Cash Flows from Operating Activities Cash flows from operating activities are impacted by the timing of acquisitions, particularly the timing of payments for acquired trade and other payables, which includes short-term employee incentive awards. The increase in cash flows from operating activities year to date in 2017 compared to the same period in 2016 resulted from an increase in cash receipts from clients due to acquisition growth. This increase in cash inflows was partly offset by an increase in cash outflows paid to employees, which in turn was caused by an increase in the number of employees and short-term incentive awards paid in the quarter. As well, cash paid to suppliers increased because of acquisition growth and the timing of various payments. Income taxes paid decreased by $7.9 million mainly due to paying less tax instalments.
Cash Flows from Investing Activities Cash flows from investing activities increased year to date in 2017 compared to the same period in 2016, mainly due to the receipt of $336.6 million (net of cash sold) from the sale of Innovyze and less cash outflow for business acquisitions. Year to date in 2016, we used $1.0 billion to pay cash consideration for acquisitions (mainly MWH) and notes payable for prior-year acquisitions compared to $48.9 million used year to date in 2017. These increases in cash inflows were partly offset by an income tax instalment of $124.2 million paid on the sale of Innovyze. In addition, we had $3.5 million less cash outflow for the purchase of investments held for self-insured liabilities year to date in 2017 compared to year to date in 2016. We also had less cash inflows from other financial assets since last year we received $13.3 million related to the liquidation of a trust acquired from MWH.
We are primarily a professional services organization; therefore, we are not capital intensive. In the past, we made capital expenditures mostly for items such as leasehold improvements, computer equipment and software, furniture, and other office and field equipment. Property and equipment and software purchases totalled $31.6 million year to
Management’s Discussion and Analysis (unaudited) June 30, 2017 M-26 Stantec Inc.
date in 2017 compared to $27.3 million year to date in 2016. During the remainder of 2017, we plan to continue investing in enhancements to our information technology infrastructure and enterprise systems; this will optimize and streamline business processes and prepare us for continued growth. Year to date, we financed property and equipment and software purchases through cash flows from operations.
In the Management’s Discussion and Analysis in our 2016 Annual Report, we indicated that in 2017 we expected to spend approximately $15.0 million in software additions and approximately $75.0 million in property and equipment, excluding capital assets acquired from acquisitions. Our expectations regarding these expenditures have not changed.
Cash Flows Used in Financing Activities Cash flows used in financing activities increased year to date in 2017 compared to 2016, mainly due to a $161.6 million net cash outflow for the payment of our revolving credit facility in 2017 compared to a net cash inflow of $612.6 million in 2016. In 2017, we used $221.3 million from the proceeds of the Innovyze sale to reduce our revolving credit facility. In 2016, we had a net cash inflow of $579.7 million from the issuance of shares, as well as a net cash inflow of $603.2 million from the settlement of our old revolving credit facility and senior secured notes and funds drawn on our new revolving credit facility and term loans. The increase in cash used in financing for 2017 year to date compared to 2016 year to date was also due to an additional $6.6 million outflow for the payment of dividends. These increases were partly offset by a decrease of $3.8 million paid to repurchase shares for cancellation under our Normal Course Issuer Bid.
CAPITAL MANAGEMENT We manage our capital structure by maintaining a net debt to EBITDA ratio of less than 2.5 to 1.0. At June 30, 2017, our net debt to EBITDA ratio was 1.34, calculated on a trailing four-quarter basis. Based on an adjusted EBITDA, our net debt to adjusted EBITDA was 1.52. There may be occasions when we exceed our target by completing opportune acquisitions that increase our debt level for a period of time.
In 2016, we entered into an agreement for $1.25 billion syndicated senior secured credit facilities (Credit Facilities) consisting of a senior secured revolving credit facility in the maximum amount of $800 million and a $450 million term loan in three tranches. The revolving credit facility expires on May 6, 2021, and may be repaid from time to time at our option. The facility is available for future acquisitions, working capital needs, and general corporate purposes. Tranches A and B of the term loan were drawn in Canadian funds of $150 million each (due May 6, 2018, and May 6, 2019, respectively), and tranche C was drawn in US funds of $116.7 million (due May 6, 2020). On May 5, 2017, we reached an agreement to extend the maturity date of our $800 million senior secured revolving credit facility from May 6, 2020, to May 6, 2021, and to redenominate tranche C of our $450 million senior secured term loan from US funds of $116.7 million to Canadian funds of $160.0 million. Transaction costs for the Credit Facilities were $9.4 million and will be amortized over the life of the facilities.
The Credit Facilities may be drawn in Canadian dollars as either a prime rate loan or a bankers’ acceptance, in US dollars as either a US-base rate or a LIBOR advance, or, in the case of the revolving credit facility, in British pound sterling or euros as a LIBOR advance and by way of letters of credit. These facilities bear interest at the reference rate, plus an applicable margin ranging from 0.00% to 2.75%, depending on the nature of the loan drawn and our leverage ratio (a non-IFRS measure). We will also have available additional currencies under the revolving credit facility on a case-by-case basis, depending on availability from lenders at the time of the drawdown. As security for the obligations under these facilities, Stantec and certain of our subsidiaries granted lenders a first-ranking security interest over all present and after-acquired assets, property, and undertakings, subject to customary carve-outs.
Management’s Discussion and Analysis (unaudited) June 30, 2017 M-27 Stantec Inc.
The funds available under the revolving credit facility are reduced by any outstanding letters of credit issued pursuant to the facility agreement. At June 30, 2017, $487.6 million was available in our revolving credit facility for future activities.
We are subject to financial and operating covenants related to our Credit Facilities. Failure to meet the terms of one or more of these covenants constitutes a default, potentially resulting in accelerated repayment of our debt obligation. In particular, we are required to satisfy the following at all times: (1) our leverage ratio must not exceed 3.0 to 1.0, except in the case of a material acquisition when our leverage ratio must not exceed 3.5 to 1.0 for a period of four complete quarters following the acquisition and (2) our interest coverage ratio must not be less than 3.0 to 1.0. Leverage ratio and interest coverage ratio are defined in the Definition of Non-IFRS Measures section of this report.
We were in compliance with all of these covenants as at and throughout the period ended June 30, 2017.
Other OUTSTANDING SHARE DATA At June 30, 2017, 113,816,504 common shares and 4,625,536 share options were outstanding. From July 1, 2017, to August 8, 2017, 5,536 share options were exercised and 6,334 share options were forfeited. At August 8, 2017, 113,822,040 common shares and 4,613,666 share options were outstanding.
CONTRACTUAL OBLIGATIONS As part of our continuing operations, we enter into long-term contractual arrangements from time to time. The following table summarizes the contractual obligations due on our long-term debt, operating and finance lease commitments, purchase and service obligations, and other obligations at June 30, 2017, on a discounted basis.
For further information regarding the nature and repayment terms of our long-term debt, refer to the Cash Flows from Financing Activities and Capital Management sections of this report and notes 12 and 18 of our unaudited interim consolidated financial statements for the quarter ended June 30, 2017.
Our operating lease commitments include future minimum rental payments under non-cancellable agreements for office space. Our purchase and service obligations include enforceable and legally binding agreements to purchase future goods and services. Our other obligations include amounts payable under our deferred share unit plan and amounts payable for performance share units issued under our Long-Term Incentive Program. Failure to meet the terms of our operating lease commitments may constitute a default, potentially resulting in a lease termination payment,
Contractual Obligations
(In millions of Canadian dollars) TotalLess than
1 Year 1–3 Years 4–5 YearsAfter
5 Years
Debt 791.8 194.4 341.5 255.5 0.4 Interest on debt 59.7 22.6 30.1 7.0 - Operating leases 1,065.1 184.8 313.9 209.5 356.9 Finance lease obligation 12.0 7.3 3.3 1.4 - Purchase and service obligations 57.1 17.5 28.0 11.6 - Other obligations 44.9 8.6 14.8 0.9 20.6
Total contractual obligations 2,030.6 435.2 731.6 485.9 377.9
Payment Due by Period
Management’s Discussion and Analysis (unaudited) June 30, 2017 M-28 Stantec Inc.
accelerated payments, or a penalty as detailed in each lease agreement. The previous table does not include obligations to fund defined benefit pension plans, although we make regular contributions. Funding levels are monitored regularly and reset with triennial funding valuations performed for the pension plans’ board of trustees. The Company expects to contribute $20.5 million to the pension plans in 2017.
OFF-BALANCE SHEET ARRANGEMENTS As of June 30, 2017, we had off-balance-sheet financial arrangements relating to letters of credit for $61.2 million that expire at various dates before July 2018. These—including the guarantee of certain office rental obligations—were issued in the normal course of operations. We also provide indemnifications and, in limited circumstances, guarantees. These are often standard contractual terms and are provided to counterparties in transactions such as purchase and sale contracts for assets or shares, service agreements, and leasing transactions. As part of the normal course of operations, our surety facilities allow the issuance of bonds for certain types of project work. At June 30, 2017, $356.9 million in bonds—expiring at various dates before January 2021—were issued under these surety facilities. This balance relates mainly to our construction business, which requires construction and performance bonds. These bonds are intended to provide owners with financial security to complete their construction project in the event of default.
FINANCIAL INSTRUMENTS AND MARKET RISK At June 30, 2017, the nature and extent of our use of financial instruments and the risks associated with these instruments did not change materially from those described in the Financial Instruments and Market Risk section of our 2016 Annual Report (incorporated here by reference).
RELATED-PARTY TRANSACTIONS We have subsidiaries that are 100% owned and structured entities that are consolidated in our financial statements. From time to time, we enter into transactions with associated companies, joint ventures, and joint operations. These transactions involve providing or receiving services and are entered into in the normal course of business. Key management personnel—including the chief executive officer (CEO), chief financial officer (CFO), chief operating officer (COO), chief business officer (CBO), and executive vice presidents—have the authority and responsibility for planning, directing, and controlling the activities of the Company. We pay compensation to key management personnel and directors in the normal course of business.
From time to time, we guarantee the obligation of a subsidiary or structured entity regarding lease agreements. Also from time to time, we guarantee a subsidiary or structured entity’s obligations to a third party pursuant to an acquisition agreement. Transactions with subsidiaries, structured entities, associated companies, joint ventures, and key management personnel are further described in note 21 of our unaudited interim consolidated financial statements for the quarter ended June 30, 2017, and notes 13 and 34 of our audited consolidated financial statements for the year ended December 31, 2016 (included in our 2016 Annual Report and incorporated here by reference).
Outlook The outlook for fiscal 2017 is based on our expectations described in our 2016 Annual Report in the Outlook section (incorporated here by reference). An update to our outlook targets described on pages M-58 and M-59 of the 2016 Annual Report is provided on page M-4 of this report. At June 30, 2017, our geographic outlooks had not changed materially from those described on pages M-59 to M-63 of the 2016 Annual Report.
We expect to achieve a long-term average annual compound growth rate for gross revenue of 15% through a combination of acquisition and organic growth. For 2017, we anticipate continued economic improvement in the United States; increased infrastructure spending in both Canada and the United States; increased spending in the water and wastewater sector; strong spending growth in the US transportation sector; a modest improvement in the energy
Management’s Discussion and Analysis (unaudited) June 30, 2017 M-29 Stantec Inc.
and resource sectors compared to 2016; continued support for alternative project delivery (APD) methods, including public-private partnerships (P3s), in Canada with increasing opportunities for APD in the United States; and modest global economic growth offset by a moderate slowdown in the Canadian housing market.
For the MWH integration, we expect to continue to review various segments of MWH’s business, and we anticipate these segments will become fully integrated into Stantec’s legacy business by the end of 2017. We expect that the integration of some of the Global operations will extend into 2018. Construction Services will not be integrated into Stantec’s Consulting Services platform and will continue to be reported as a separate segment of our business. Management believes synergies associated with revenue opportunities and cross-selling capabilities, as well as back-office functions, are progressing and expect to be realized as we move through the integration phases.
Our business operates in a highly diverse infrastructure and facilities market in North America and globally that consists of many technical disciplines, market sectors, client types, and industries in both the private and public sectors. This gives us the flexibility to adapt to changing market conditions in a timely manner. Our results may fluctuate from quarter to quarter, depending on variables such as project mix, economic factors, and integration activities related to acquisitions in a quarter.
Our overall outlook is based in part on an update of the underlying assumptions found in the Outlook section of the Management’s Discussion and Analysis in our 2016 Annual Report. The Caution Regarding Forward-Looking Statements section of this Management’s Discussion and Analysis outlines these updated assumptions.
Critical Accounting Estimates, Developments, and Measures
CRITICAL ACCOUNTING ESTIMATES The preparation of consolidated financial statements in accordance with IFRS requires us to make various estimates and assumptions. However, future events may result in significant differences between estimates and actual results. There has been no significant change in our critical accounting estimates in Q2 17 from those described in our 2016 Annual Report under the heading Critical Accounting Estimates, Developments, and Measures and in note 5 of our December 31, 2016, audited consolidated financial statements (incorporated here by reference), except for a change in the useful lives of certain property and equipment as further described in note 2 of our interim consolidated financial statements for the quarter ended June 30, 2017 (incorporated here by reference).
DEFINITION OF NON-IFRS MEASURES This Management’s Discussion and Analysis includes references to and uses measures and terms that are not specifically defined in IFRS and do not have any standardized meaning prescribed by IFRS. These measures and terms are working capital, current ratio, return on equity ratio, EBITDA, net debt to EBITDA, leverage ratio, interest coverage ratio, backlog, adjusted EBITDA, and adjusted earnings per share (EPS). These non-IFRS measures may not be comparable to similar measures presented by other companies.
For the first two quarters ended June 30, 2017, there has been no significant change in our description of non-IFRS measures from that included in our 2016 Annual Report under the heading Critical Accounting Estimates, Developments, and Measures (incorporated here by reference), except for adding adjusted net income as further described below. For more information, refer to this discussion in our 2016 Annual Report.
We currently use net income as a measure of overall profitability. Management defines adjusted net income as follows:
Adjusted Net Income is net (loss) income as prescribed by IFRS, adjusted to exclude the amortization of acquisition-related intangibles, acquisition-related costs, out-of-ordinary course severance, and gains or losses on property and equipment, sale of subsidiaries, and the rebalancing of our investments held for self-
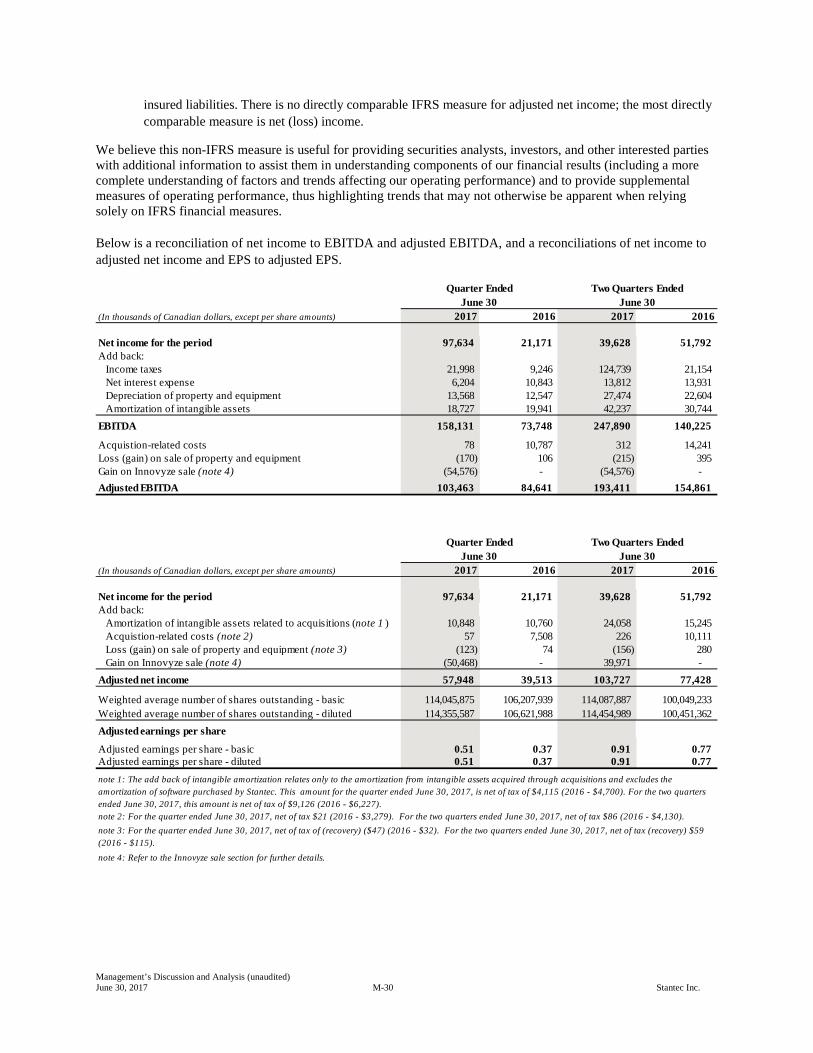
Management’s Discussion and Analysis (unaudited) June 30, 2017 M-30 Stantec Inc.
insured liabilities. There is no directly comparable IFRS measure for adjusted net income; the most directly comparable measure is net (loss) income.
We believe this non-IFRS measure is useful for providing securities analysts, investors, and other interested parties with additional information to assist them in understanding components of our financial results (including a more complete understanding of factors and trends affecting our operating performance) and to provide supplemental measures of operating performance, thus highlighting trends that may not otherwise be apparent when relying solely on IFRS financial measures. Below is a reconciliation of net income to EBITDA and adjusted EBITDA, and a reconciliations of net income to adjusted net income and EPS to adjusted EPS.
(In thousands of Canadian dollars, except per share amounts) 2017 2016 2017 2016
Net income for the period 97,634 21,171 39,628 51,792 Add back:
Income taxes 21,998 9,246 124,739 21,154 Net interest expense 6,204 10,843 13,812 13,931 Depreciation of property and equipment 13,568 12,547 27,474 22,604 Amortization of intangible assets 18,727 19,941 42,237 30,744
EBITDA 158,131 73,748 247,890 140,225
Acquistion-related costs 78 10,787 312 14,241 Loss (gain) on sale of property and equipment (170) 106 (215) 395 Gain on Innovyze sale (note 4) (54,576) - (54,576) - Adjusted EBITDA 103,463 84,641 193,411 154,861
(In thousands of Canadian dollars, except per share amounts) 2017 2016 2017 2016
Net income for the period 97,634 21,171 39,628 51,792 Add back:
Amortization of intangible assets related to acquisitions (note 1 ) 10,848 10,760 24,058 15,245 Acquistion-related costs (note 2) 57 7,508 226 10,111 Loss (gain) on sale of property and equipment (note 3) (123) 74 (156) 280 Gain on Innovyze sale (note 4) (50,468) - 39,971 -
Adjusted net income 57,948 39,513 103,727 77,428
Weighted average number of shares outstanding - basic 114,045,875 106,207,939 114,087,887 100,049,233 Weighted average number of shares outstanding - diluted 114,355,587 106,621,988 114,454,989 100,451,362 Adjusted earnings per share
Adjusted earnings per share - basic 0.51 0.37 0.91 0.77 Adjusted earnings per share - diluted 0.51 0.37 0.91 0.77
Quarter EndedJune 30
Quarter EndedJune 30
Two Quarters EndedJune 30
Two Quarters EndedJune 30
note 1: The add back of intangible amortization relates only to the amortization from intangible assets acquired through acquisitions and excludes the amortization of software purchased by Stantec. This amount for the quarter ended June 30, 2017, is net of tax of $4,115 (2016 - $4,700). For the two quarters ended June 30, 2017, this amount is net of tax of $9,126 (2016 - $6,227). note 2: For the quarter ended June 30, 2017, net of tax $21 (2016 - $3,279). For the two quarters ended June 30, 2017, net of tax $86 (2016 - $4,130).note 3: For the quarter ended June 30, 2017, net of tax of (recovery) ($47) (2016 - $32). For the two quarters ended June 30, 2017, net of tax (recovery) $59 (2016 - $115).note 4: Refer to the Innovyze sale section for further details.
Management’s Discussion and Analysis (unaudited) June 30, 2017 M-31 Stantec Inc.
RECENT ACCOUNTING PRONOUNCEMENTS Effective January 1, 2017, we adopted the following amendments (further described in note 6 of our December 31, 2016, annual consolidated financial statements and note 4 of our June 30, 2017, unaudited interim consolidated financial statements):
• Recognition of Deferred Tax Assets for Unrealized Losses (Amendments to IAS 12)
• Disclosure Initiative (Amendments to IAS 7)
• Annual Improvements (2014-2016 Cycle) (Amendments to IFRS 12 Disclosure of Interests in Other Entities)
Adopting these amendments had no impact on our financial position or performance.
FUTURE ADOPTIONS Standards, amendments, and interpretations that we reasonably expect to be applicable at a future date and intend to adopt when they become effective are described in note 4 of our June 30, 2017, unaudited interim consolidated financial statements (incorporated here by reference).
Controls and Procedures Evaluation of Disclosure Controls and Procedures. Our CEO and CFO evaluated our disclosure controls and procedures (defined in the US Securities Exchange Act Rules 13a–15(e) and 15d–15(e)) as of the end of the period covered by this quarterly report. Based on this evaluation, our CEO and CFO concluded that our disclosure controls and procedures were effective as of such date.
Changes in Internal Controls over Financial Reporting. Except as described below, there has been no change in our internal control over financial reporting identified in connection with the evaluation required by paragraph (d) of Rules 13a–15 or 15d–15 under the Securities Exchange Act of 1934 that occurred during our last fiscal quarter that has materially affected, or is reasonably likely to materially affect, our internal control over financial reporting. During the quarter ended June 30, 2017, the process of merging and integrating the MWH Global business into our overall internal control over financial reporting process continued.
Risk Factors For the first two quarters ended June 30, 2017, there has been no significant change in our risk factors from those described in our 2016 Annual Report; the risk factors are incorporated here by reference.
Subsequent Events
RNL FACILITIES CORPORATION On July 28, 2017, we acquired all the shares and business of RNL Facilities Corporation (RNL), increasing our staff count by approximately 130 people. RNL, based in Denver, Colorado, has additional offices in Phoenix, Arizona; Los Angeles, California; Washington, DC; and Abu Dhabi, United Arab Emirates. RNL provides expertise in architecture, interior design, urban design, and landscaping. This addition will enhance our Buildings business operating unit.
DIVIDENDS On August 8, 2017, we declared a cash dividend of $0.1250 per share payable on October 12, 2017, to shareholders of record on September 29, 2017.
Management’s Discussion and Analysis (unaudited) June 30, 2017 M-32 Stantec Inc.
Caution Regarding Forward-Looking Statements Our public communications often include written or verbal forward-looking statements within the meaning of the US Private Securities Litigation Reform Act and Canadian securities laws. Forward-looking statements are disclosures regarding possible events, conditions, or results of operations that are based on assumptions about future economic conditions or courses of action and include financial outlook or future-oriented financial information. Any financial outlook or future-oriented financial information in this Management’s Discussion and Analysis has been approved by management of Stantec. Such financial outlook or future-oriented financial information is provided for the purpose of providing information about management’s current expectations and plans relating to the future.
Forward-looking statements may involve but are not limited to comments with respect to our objectives for 2017 and beyond, our strategies or future actions, our targets, our expectations for our financial condition or share price, or the results of or outlook for our operations. Statements of this type may be contained in filings with securities regulators or in other communications and are contained in this report. Forward-looking statements in this report include but are not limited to the following:
• The discussion of our overall outlook in the Outlook section, including but not limited to our plan to achieve a compound average growth rate of 15% through a combination of organic and acquisition growth
• Our short-term, annual, and long-term targets and expectations for our regional and business operating units in the Results Compared to 2017 Targets and Gross and Net Revenue sections
• Our belief that we will meet our 2017 annual targets (excluding the impact of the Innovyze sale)
• Our goal to occupy the number one position in water and sewer works in the world and our belief that we have realized this goal
• Our expectation on the timing for completing the MWH integration and the expected synergies and efficiencies of the combined business in the Outlook section
• Our expectations regarding economic trends, industry trends, and commodity prices in the sectors and regions we operate in
• Our expectations for the costs of the software additions and property and equipment for 2017
• Our expectations regarding our sources of cash and ability to meet our normal operating and capital expenditures in the Liquidity and Capital Resources section
These describe the management expectations and targets by which we measure our success and assist our shareholders in understanding our financial position as at and for the periods ended on the dates presented in this report. Readers are cautioned that this information may not be appropriate for other purposes.
By their nature, forward-looking statements require us to make assumptions and are subject to inherent risks and uncertainties. There is a significant risk that predictions, forecasts, conclusions, projections, and other forward-looking statements will not prove to be accurate. We caution readers of this report not to place undue reliance on our forward-looking statements since a number of factors could cause actual future results, conditions, actions, or events to differ materially from the targets, expectations, estimates, or intentions expressed in these forward-looking statements. Future outcomes relating to forward-looking statements may be influenced by many factors and material risks. For the quarter ended June 30, 2017, there has been no significant change in our risk factors from those described in our 2016 Annual Report; the risk factors are incorporated by reference.
Management’s Discussion and Analysis (unaudited) June 30, 2017 M-33 Stantec Inc.
Assumptions In determining our forward-looking statements, we consider material factors, including assumptions about the performance of the Canadian, US, and various international economies in 2017 and their effect on our business. The assumptions we made at the time of publishing our annual targets and outlook for 2017 are listed in the Outlook section beginning on page M-58 of our 2016 Annual Report. The following information updates and, therefore, supersedes those assumptions.
• To establish our level of future cash flows, we assumed that the Canadian dollar would be US$0.77 in 2017. We also assumed that our average interest rate would remain relatively stable in 2017 compared to 2016. The Canadian dollar closed at US$0.77 on June 30, 2017, and was US$0.74 on December 31, 2016. The average interest rate for our revolving credit facility and term loan was 3.25% at June 30, 2017, compared to 3.1% at December 31, 2016. To establish our effective income tax rate, we assumed the tax rate substantially enacted at the time of preparing our targets for 2017 for the countries we operate in, primarily Canada and the United States. Our effective tax rate was 27.5% at June 30, 2017, compared to 27.8% for the year ended December 31, 2016 (further explained in the Income Taxes section of this report).
• As stated in our 2016 Annual Report, the Bank of Canada forecasted that GDP growth would be 2.0% in 2017 and the overnight target rate would be 0.50%. The GDP forecast for 2017 has since been revised to 2.6%.
• In our 2016 Annual Report, the average price of WTI crude oil—according to the US Energy Information Administration—was forecasted to be $52.50 in 2017 compared to an average of $43.33 in 2016. The Administration forecasted that US crude oil production would average 9.0 million barrels a day in 2017 compared to an average of 8.9 million barrels a day in 2016. These forecasts have since been revised to an average of $50.78 and 9.3 million barrels a day in 2017.
• As stated in our 2016 Annual Report, the US Congressional Budget Office forecasted that real GDP growth would be 2.4% in 2017. The GDP forecast for 2017 has since been revised to 2.3%.
• In our 2016 Annual Report, we noted that according to the National Association of Home Builders (NAHB) in the United States, seasonally adjusted annual rates of total housing starts in the United States were expected to increase to 1,239,000 units in 2017 from the expected 1,162,000 units in 2016. This forecast has since been revised to an expected 1,234,000 units in 2017 from 1,176,000 units in 2016.
• The Canadian dollar is expected to remain stable or depreciate from its current level given the anticipated increases in the US federal funds rate. This forecast has since been revised: the Canadian dollar is expected to remain stable relative to its current level given the 0.25 increase in the Bank of Canada benchmark rate from 0.50 to 0.75 during Q2 17.
The preceding list of assumptions is not exhaustive. Investors and the public should carefully consider these factors, other uncertainties, and potential events, as well as the inherent uncertainty of forward-looking statements, when relying on these statements to make decisions with respect to our Company. The forward-looking statements contained here represent our expectations as of August 8, 2017, and, accordingly, are subject to change after such date. Except as may be required by law, we do not undertake to update any forward-looking statement, whether written or verbal, that may be made from time to time. In the case of the ranges of expected performance for fiscal 2017, our current practice is to evaluate and, where we deem appropriate, provide updates. However, subject to legal requirements, we may change this practice at any time at our sole discretion.
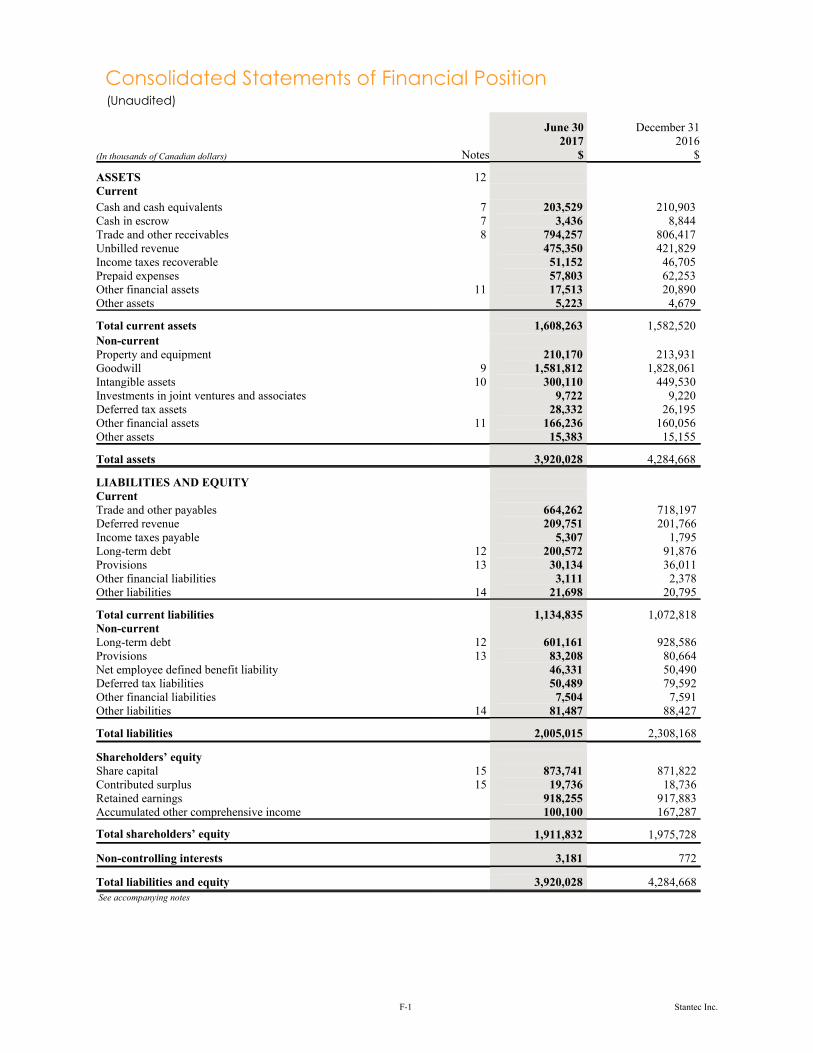
Consolidated Statements of Financial Position (Unaudited)
June 30 December 312017 2016
(In thousands of Canadian dollars) Notes $ $
ASSETS 12Current
Cash and cash equivalents 7 203,529 210,903Cash in escrow 7 3,436 8,844Trade and other receivables 8 794,257 806,417Unbilled revenue 475,350 421,829Income taxes recoverable 51,152 46,705Prepaid expenses 57,803 62,253Other financial assets 11 17,513 20,890Other assets 5,223 4,679
Total current assets 1,608,263 1,582,520
Non-currentProperty and equipment 210,170 213,931Goodwill 9 1,581,812 1,828,061Intangible assets 10 300,110 449,530Investments in joint ventures and associates 9,722 9,220Deferred tax assets 28,332 26,195Other financial assets 11 166,236 160,056Other assets 15,383 15,155
Total assets 3,920,028 4,284,668
LIABILITIES AND EQUITYCurrentTrade and other payables 664,262 718,197Deferred revenue 209,751 201,766Income taxes payable 5,307 1,795Long-term debt 12 200,572 91,876Provisions 13 30,134 36,011Other financial liabilities 3,111 2,378Other liabilities 14 21,698 20,795
Total current liabilities 1,134,835 1,072,818Non-currentLong-term debt 12 601,161 928,586Provisions 13 83,208 80,664Net employee defined benefit liability 46,331 50,490Deferred tax liabilities 50,489 79,592Other financial liabilities 7,504 7,591Other liabilities 14 81,487 88,427
Total liabilities 2,005,015 2,308,168
Shareholders’ equityShare capital 15 873,741 871,822Contributed surplus 15 19,736 18,736Retained earnings 918,255 917,883Accumulated other comprehensive income 100,100 167,287
Total shareholders’ equity 1,911,832 1,975,728
Non-controlling interests 3,181 772
Total liabilities and equity 3,920,028 4,284,668 See accompanying notes
F-1 Stantec Inc.
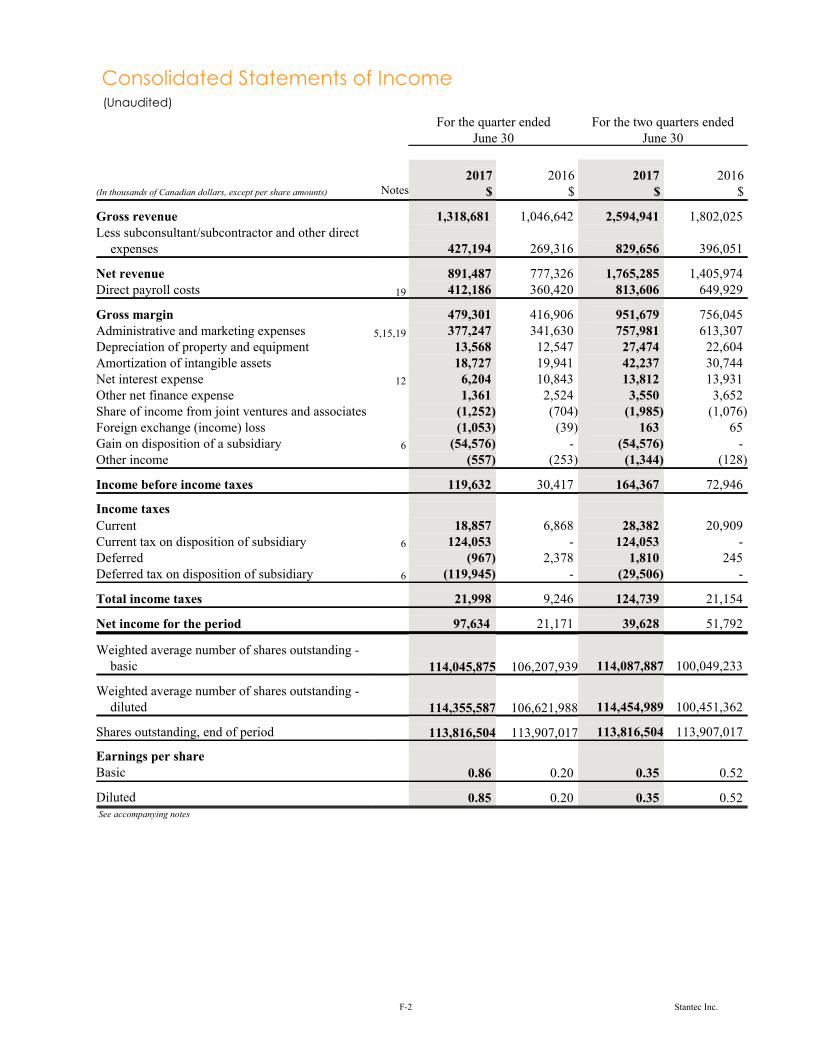
Consolidated Statements of Income (Unaudited)
For the quarter endedJune 30
For the two quarters endedJune 30
(In thousands of Canadian dollars, except per share amounts) Notes2017
$2016
$2017
$2016
$
Gross revenue 1,318,681 1,046,642 2,594,941 1,802,025Less subconsultant/subcontractor and other direct
expenses 427,194 269,316 829,656 396,051
Net revenue 891,487 777,326 1,765,285 1,405,974Direct payroll costs 19 412,186 360,420 813,606 649,929
Gross margin 479,301 416,906 951,679 756,045Administrative and marketing expenses 5,15,19 377,247 341,630 757,981 613,307Depreciation of property and equipment 13,568 12,547 27,474 22,604Amortization of intangible assets 18,727 19,941 42,237 30,744Net interest expense 12 6,204 10,843 13,812 13,931Other net finance expense 1,361 2,524 3,550 3,652Share of income from joint ventures and associates (1,252) (704) (1,985) (1,076)Foreign exchange (income) loss (1,053) (39) 163 65Gain on disposition of a subsidiary 6 (54,576) - (54,576) -Other income (557) (253) (1,344) (128)
Income before income taxes 119,632 30,417 164,367 72,946
Income taxes
Current 18,857 6,868 28,382 20,909Current tax on disposition of subsidiary 6 124,053 - 124,053 -Deferred (967) 2,378 1,810 245Deferred tax on disposition of subsidiary 6 (119,945) - (29,506) -
Total income taxes 21,998 9,246 124,739 21,154
Net income for the period 97,634 21,171 39,628 51,792
Weighted average number of shares outstanding -basic 114,045,875 106,207,939 114,087,887 100,049,233
Weighted average number of shares outstanding -diluted 114,355,587 106,621,988 114,454,989 100,451,362
Shares outstanding, end of period 113,816,504 113,907,017 113,816,504 113,907,017
Earnings per shareBasic 0.86 0.20 0.35 0.52
Diluted 0.85 0.20 0.35 0.52 See accompanying notes
F-2 Stantec Inc.
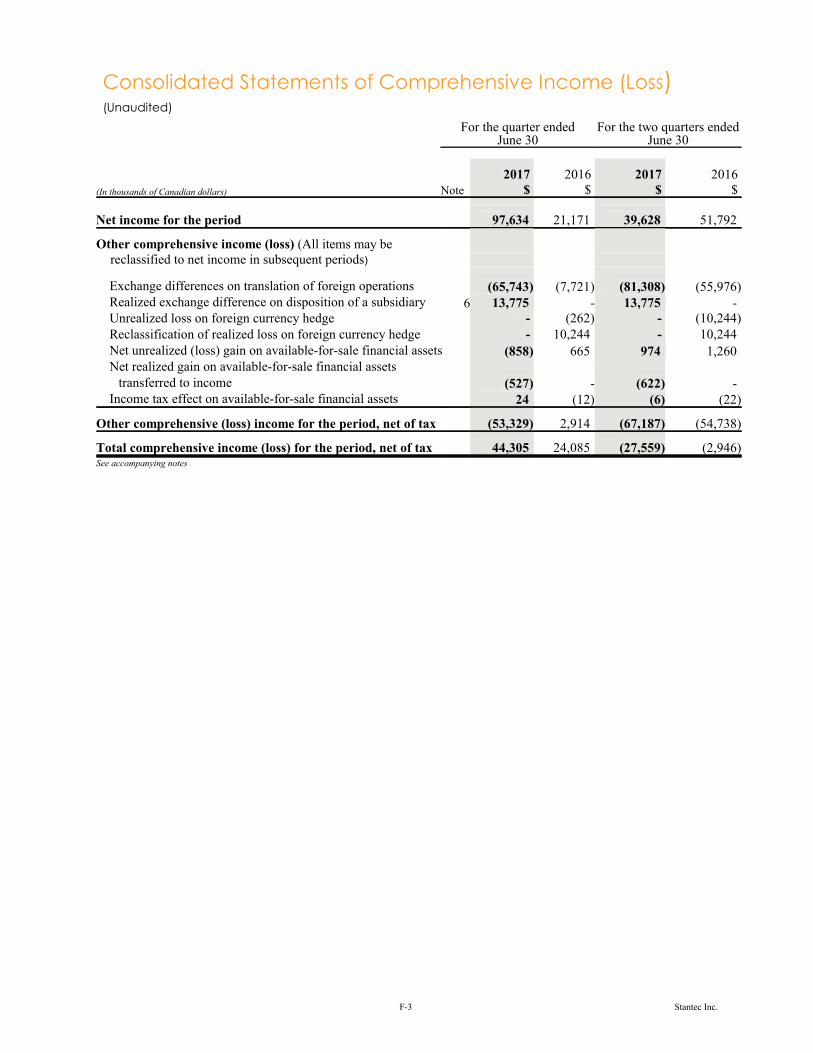
Consolidated Statements of Comprehensive Income (Loss) (Unaudited)
For the quarter ended For the two quarters endedJune 30 June 30
2017 2016 2017 2016(In thousands of Canadian dollars) Note $ $ $ $
Net income for the period 97,634 21,171 39,628 51,792
Other comprehensive income (loss) (All items may bereclassified to net income in subsequent periods)
Exchange differences on translation of foreign operations (65,743) (7,721) (81,308) (55,976) Realized exchange difference on disposition of a subsidiary 6 13,775 - 13,775 - Unrealized loss on foreign currency hedge - (262) - (10,244) Reclassification of realized loss on foreign currency hedge - 10,244 - 10,244 Net unrealized (loss) gain on available-for-sale financial assets (858) 665 974 1,260 Net realized gain on available-for-sale financial assets
transferred to income (527) - (622) - Income tax effect on available-for-sale financial assets 24 (12) (6) (22)
Other comprehensive (loss) income for the period, net of tax (53,329) 2,914 (67,187) (54,738)
Total comprehensive income (loss) for the period, net of tax 44,305 24,085 (27,559) (2,946)See accompanying notes
F-3 Stantec Inc.
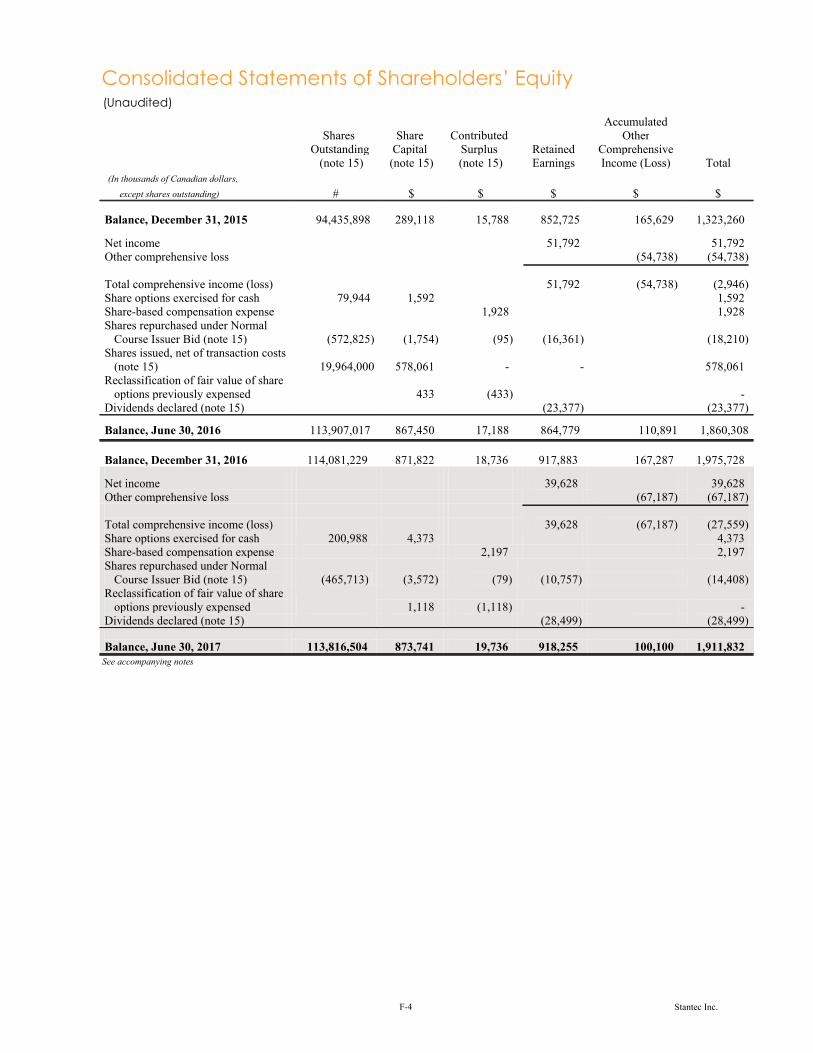
Consolidated Statements of Shareholders’ Equity (Unaudited)
SharesOutstanding
(note 15)
ShareCapital
(note 15)
ContributedSurplus(note 15)
RetainedEarnings
AccumulatedOther
ComprehensiveIncome (Loss) Total
(In thousands of Canadian dollars,
except shares outstanding) # $ $ $ $ $
Balance, December 31, 2015 94,435,898 289,118 15,788 852,725 165,629 1,323,260
Net income 51,792 51,792Other comprehensive loss (54,738) (54,738)
Total comprehensive income (loss) 51,792 (54,738) (2,946)Share options exercised for cash 79,944 1,592 1,592Share-based compensation expense 1,928 1,928Shares repurchased under Normal
Course Issuer Bid (note 15) (572,825) (1,754) (95) (16,361) (18,210)Shares issued, net of transaction costs
(note 15) 19,964,000 578,061 - - 578,061Reclassification of fair value of share
options previously expensed 433 (433) -Dividends declared (note 15) (23,377) (23,377)
Balance, June 30, 2016 113,907,017 867,450 17,188 864,779 110,891 1,860,308
Balance, December 31, 2016 114,081,229 871,822 18,736 917,883 167,287 1,975,728
Net income 39,628 39,628Other comprehensive loss (67,187) (67,187)
Total comprehensive income (loss) 39,628 (67,187) (27,559)Share options exercised for cash 200,988 4,373 4,373Share-based compensation expense 2,197 2,197Shares repurchased under Normal
Course Issuer Bid (note 15) (465,713) (3,572) (79) (10,757) (14,408)Reclassification of fair value of share
options previously expensed 1,118 (1,118) -Dividends declared (note 15) (28,499) (28,499)
Balance, June 30, 2017 113,816,504 873,741 19,736 918,255 100,100 1,911,832 See accompanying notes
F-4 Stantec Inc.
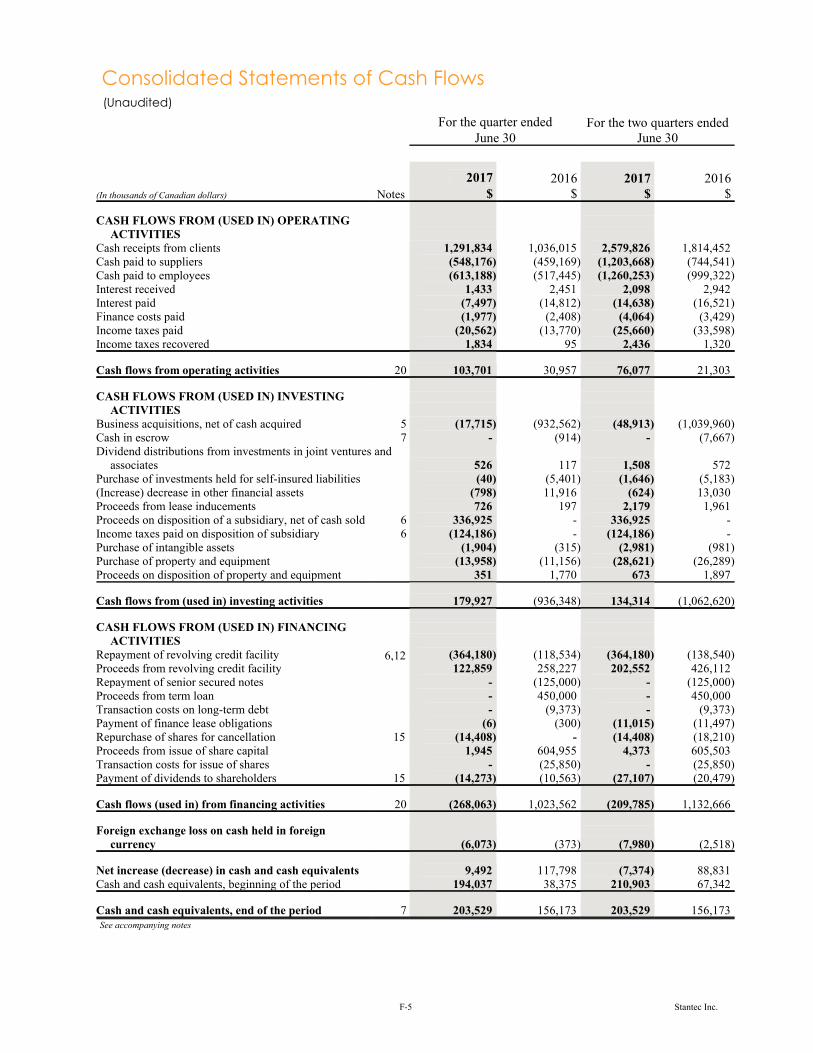
Consolidated Statements of Cash Flows (Unaudited)
For the quarter ended For the two quarters endedJune 30 June 30
2017 2016 2017 2016(In thousands of Canadian dollars) Notes $ $ $ $
CASH FLOWS FROM (USED IN) OPERATINGACTIVITIES
Cash receipts from clients 1,291,834 1,036,015 2,579,826 1,814,452Cash paid to suppliers (548,176) (459,169) (1,203,668) (744,541)Cash paid to employees (613,188) (517,445) (1,260,253) (999,322)Interest received 1,433 2,451 2,098 2,942Interest paid (7,497) (14,812) (14,638) (16,521)Finance costs paid (1,977) (2,408) (4,064) (3,429)Income taxes paid (20,562) (13,770) (25,660) (33,598)Income taxes recovered 1,834 95 2,436 1,320
Cash flows from operating activities 20 103,701 30,957 76,077 21,303
CASH FLOWS FROM (USED IN) INVESTINGACTIVITIES
Business acquisitions, net of cash acquired 5 (17,715) (932,562) (48,913) (1,039,960)Cash in escrow 7 - (914) - (7,667)Dividend distributions from investments in joint ventures and
associates 526 117 1,508 572Purchase of investments held for self-insured liabilities (40) (5,401) (1,646) (5,183)(Increase) decrease in other financial assets (798) 11,916 (624) 13,030Proceeds from lease inducements 726 197 2,179 1,961Proceeds on disposition of a subsidiary, net of cash sold 6 336,925 - 336,925 -Income taxes paid on disposition of subsidiary 6 (124,186) - (124,186) -Purchase of intangible assets (1,904) (315) (2,981) (981)Purchase of property and equipment (13,958) (11,156) (28,621) (26,289)Proceeds on disposition of property and equipment 351 1,770 673 1,897
Cash flows from (used in) investing activities 179,927 (936,348) 134,314 (1,062,620)
CASH FLOWS FROM (USED IN) FINANCINGACTIVITIES
Repayment of revolving credit facility 6,12 (364,180) (118,534) (364,180) (138,540)Proceeds from revolving credit facility 122,859 258,227 202,552 426,112Repayment of senior secured notes - (125,000) - (125,000)Proceeds from term loan - 450,000 - 450,000Transaction costs on long-term debt - (9,373) - (9,373)Payment of finance lease obligations (6) (300) (11,015) (11,497)Repurchase of shares for cancellation 15 (14,408) - (14,408) (18,210)Proceeds from issue of share capital 1,945 604,955 4,373 605,503Transaction costs for issue of shares - (25,850) - (25,850)Payment of dividends to shareholders 15 (14,273) (10,563) (27,107) (20,479)
Cash flows (used in) from financing activities 20 (268,063) 1,023,562 (209,785) 1,132,666
Foreign exchange loss on cash held in foreigncurrency (6,073) (373) (7,980) (2,518)
Net increase (decrease) in cash and cash equivalents 9,492 117,798 (7,374) 88,831Cash and cash equivalents, beginning of the period 194,037 38,375 210,903 67,342
Cash and cash equivalents, end of the period 7 203,529 156,173 203,529 156,173See accompanying notes
F-5 Stantec Inc.
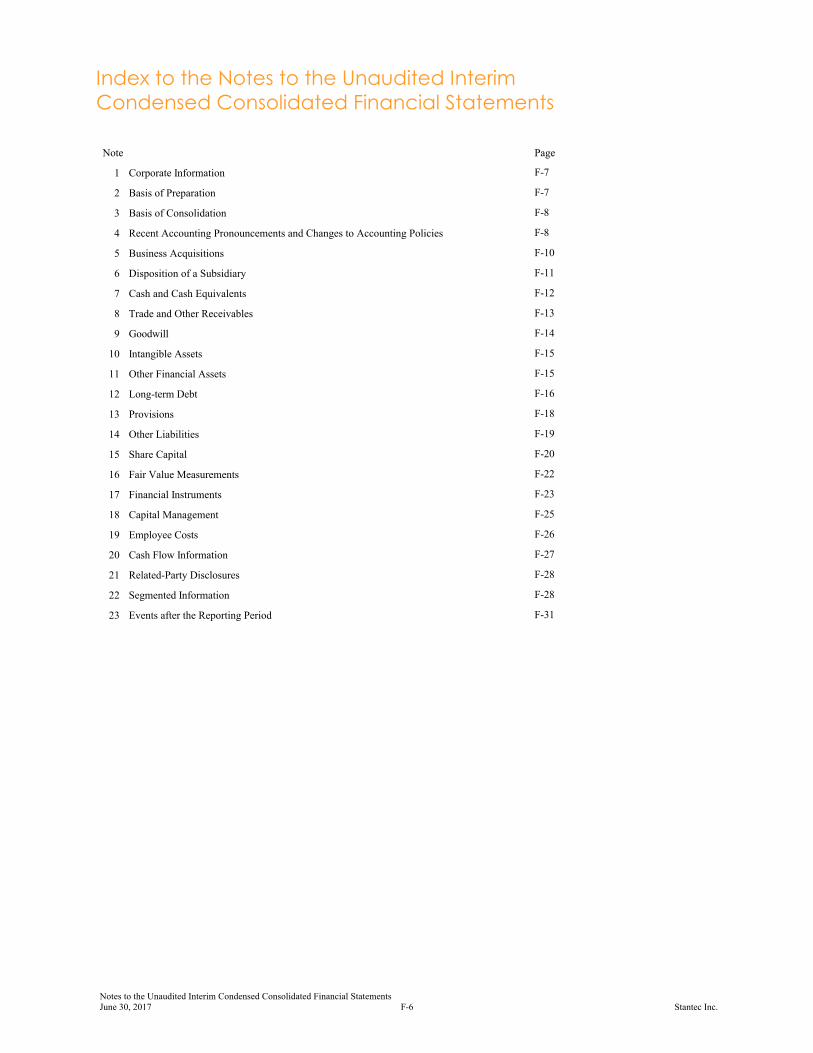
Index to the Notes to the Unaudited Interim Condensed Consolidated Financial Statements
Note Page
1 Corporate Information F-7
2 Basis of Preparation F-7
3 Basis of Consolidation F-8
4 Recent Accounting Pronouncements and Changes to Accounting Policies F-8
5 Business Acquisitions F-10
6 Disposition of a Subsidiary F-11
7 Cash and Cash Equivalents F-12
8 Trade and Other Receivables F-13
9 Goodwill F-14
10 Intangible Assets F-15
11 Other Financial Assets F-15
12 Long-term Debt F-16
13 Provisions F-18
14 Other Liabilities F-19
15 Share Capital F-20
16 Fair Value Measurements F-22
17 Financial Instruments F-23
18 Capital Management F-25
19 Employee Costs F-26
20 Cash Flow Information F-27
21 Related-Party Disclosures F-28
22 Segmented Information F-28
23 Events after the Reporting Period F-31
Notes to the Unaudited Interim Condensed Consolidated Financial Statements June 30, 2017 F-6 Stantec Inc.
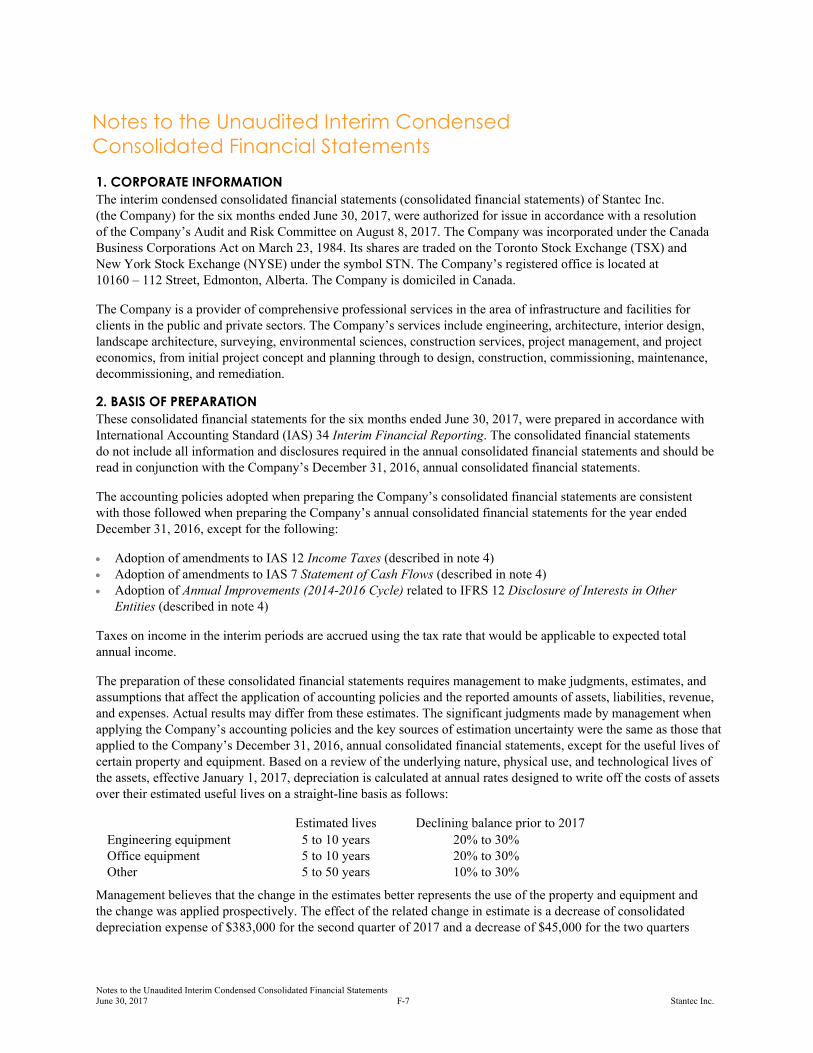
Notes to the Unaudited Interim Condensed Consolidated Financial Statements
1. CORPORATE INFORMATION
The interim condensed consolidated financial statements (consolidated financial statements) of Stantec Inc. (the Company) for the six months ended June 30, 2017, were authorized for issue in accordance with a resolution of the Company’s Audit and Risk Committee on August 8, 2017. The Company was incorporated under the CanadaBusiness Corporations Act on March 23, 1984. Its shares are traded on the Toronto Stock Exchange (TSX) and New York Stock Exchange (NYSE) under the symbol STN. The Company’s registered office is located at 10160 – 112 Street, Edmonton, Alberta. The Company is domiciled in Canada.
The Company is a provider of comprehensive professional services in the area of infrastructure and facilities forclients in the public and private sectors. The Company’s services include engineering, architecture, interior design,landscape architecture, surveying, environmental sciences, construction services, project management, and projecteconomics, from initial project concept and planning through to design, construction, commissioning, maintenance,decommissioning, and remediation.
2. BASIS OF PREPARATION
These consolidated financial statements for the six months ended June 30, 2017, were prepared in accordance withInternational Accounting Standard (IAS) 34 Interim Financial Reporting. The consolidated financial statements do not include all information and disclosures required in the annual consolidated financial statements and should beread in conjunction with the Company’s December 31, 2016, annual consolidated financial statements.
The accounting policies adopted when preparing the Company’s consolidated financial statements are consistent with those followed when preparing the Company’s annual consolidated financial statements for the year ended December 31, 2016, except for the following:
Adoption of amendments to IAS 12 Income Taxes (described in note 4) Adoption of amendments to IAS 7 Statement of Cash Flows (described in note 4) Adoption of Annual Improvements (2014-2016 Cycle) related to IFRS 12 Disclosure of Interests in Other
Entities (described in note 4)
Taxes on income in the interim periods are accrued using the tax rate that would be applicable to expected total annual income.
The preparation of these consolidated financial statements requires management to make judgments, estimates, andassumptions that affect the application of accounting policies and the reported amounts of assets, liabilities, revenue,and expenses. Actual results may differ from these estimates. The significant judgments made by management whenapplying the Company’s accounting policies and the key sources of estimation uncertainty were the same as those thatapplied to the Company’s December 31, 2016, annual consolidated financial statements, except for the useful lives ofcertain property and equipment. Based on a review of the underlying nature, physical use, and technological lives ofthe assets, effective January 1, 2017, depreciation is calculated at annual rates designed to write off the costs of assetsover their estimated useful lives on a straight-line basis as follows:
Estimated lives Declining balance prior to 2017
Engineering equipment 5 to 10 years 20% to 30%Office equipment 5 to 10 years 20% to 30%Other 5 to 50 years 10% to 30%
Management believes that the change in the estimates better represents the use of the property and equipment and the change was applied prospectively. The effect of the related change in estimate is a decrease of consolidateddepreciation expense of $383,000 for the second quarter of 2017 and a decrease of $45,000 for the two quarters
Notes to the Unaudited Interim Condensed Consolidated Financial Statements June 30, 2017 F-7 Stantec Inc.
ended June 30, 2017. It is impracticable to determine the amount of the effect in future periods since depreciationexpense is impacted by additions and disposals.
3. BASIS OF CONSOLIDATION
The consolidated financial statements include the accounts of the Company, its subsidiaries, and its structured entitiesas at June 30, 2017.
Subsidiaries and structured entities are fully consolidated from the date of acquisition, which is the date the Companyobtains control, and continue to be consolidated until the date that this control ceases. The financial statements of thesubsidiaries and structured entities are prepared as at June 30, 2017. All intercompany balances are eliminated.
Joint ventures and associates are accounted for using the equity method, and joint operations are accounted for by theCompany recognizing its share of assets, liabilities, revenue, and expenses of the joint operation.
4. RECENT ACCOUNTING PRONOUNCEMENTS AND CHANGES TO ACCOUNTING POLICIES
Recently adopted
The following amendments have been adopted by the Company effective January 1, 2017. The adoption of theseamendments did not have an impact on the financial position or performance of the Company.
In January 2016, the International Accounting Standards Board (IASB) issued Recognition of Deferred TaxAssets for Unrealized Losses (Amendments to IAS 12). The amendments clarify requirements for the recognitionof deferred tax assets for unrealized losses on debt instruments measured at fair value. These amendments areeffective January 1, 2017, retrospectively, subject to certain exceptions.
In January 2016, the IASB issued Disclosure Initiative (Amendments to IAS 7). These amendments clarify IAS 7,improving the information provided to users of financial statements about an entity’s financing activities. Theseamendments are effective January 1, 2017, with earlier application permitted. The additional disclosures requiredby the amendments are included in note 20.
In December 2016, the IASB issued Annual Improvements (2014-2016 Cycle) which amended IFRS 12Disclosure of Interests in Other Entities to clarify the scope of disclosures in accordance with scope of IFRS 12.The amendments clarify that the disclosure requirements in IFRS 12, other than those in paragraphs B10 to B16,apply to an entity’s held-for-sale interests. The Company has adopted the amendments retrospectively.
Future adoptions
The standards, amendments, and interpretations issued before 2017 but not yet adopted by the Company have beendisclosed in note 6 of the Company’s December 31, 2016, annual consolidated financial statements. The Company iscurrently considering the impact of adopting these standards, amendments, and interpretations on its consolidatedfinancial statements and cannot reasonably estimate the effect at this time, except as specifically mentioned below:
In May 2014, the IASB issued IFRS 15 Revenue from Contracts with Customers (IFRS 15). In April 2016, theIASB issued amendments to clarify the standard and provide additional transition relief for modified contracts andcompleted contracts. IFRS 15 applies to all revenue contracts with customers and provides a model for therecognition and measurement of the sale of some non-financial assets such as property, plant, and equipment, andintangible assets. It sets out a five-step model for revenue recognition and applies to all industries. The coreprinciple is that revenue should be recognized to depict the transfer of promised goods or services to customers inan amount that reflects the consideration that the entity expects to be entitled to in exchange for those goods orservices. IFRS 15 requires numerous disclosures, such as the disaggregation of total revenue, disclosures aboutperformance obligations, changes in contract asset and liability account balances, and key judgments andestimates. In addition, the accounting for loss-making contracts will fall under the onerous contracts guidance inIAS 37 Provisions, Contingent Liabilities and Contingent Assets. The Company has established a cross-functionalIFRS 15 implementation team that provides regular updates to the Audit and Risk Committee, including reportson the progress made on the project’s detailed work plan.
Notes to the Unaudited Interim Condensed Consolidated Financial Statements June 30, 2017 F-8 Stantec Inc.
Major provisions of IFRS 15 include determining which goods and services are distinct and require separateaccounting (performance obligations), determining the total transaction price, estimating and recognizing variableconsideration, identifying and accounting for contract modifications, and determining whether revenue should berecognized at a point in time or over time (including guidance on measuring the stage of completion). TheCompany is currently assessing the potential effect of these requirements on its consolidated financial statements,including the timing of revenue recognition. It is also in the process of formulating policies and practices forestimating variable consideration and applying the constraint thereto. At this time, the Company expects tocontinue to recognize revenue over time for fixed-fee and variable-fee-with-ceiling contracts by referring to thestage of completion. For time-and-material contracts without stated ceilings, the Company is currently assessingwhether a practical expedient could be applied which allows the recognition of revenue in the amount for which ithas the right to invoice, consistent with current practices for such contracts. Because the Company is currentlyassessing IFRS 15, the above explanation may not fully describe the potential effect of IFRS 15 on the Company’saccounting policies and is subject to change with new facts and circumstances.
The mandatory effective date of IFRS 15 is January 1, 2018, and the standard may be adopted using a full
retrospective or modified retrospective approach. The Company currently intends to select the modified
retrospective approach which results in the cumulative effect of adoption recognized at the date of initial
application. The Company has not yet quantified the financial reporting impact of adopting this standard.
In July 2014, the IASB issued IFRS 9 Financial Instruments (IFRS 9) to introduce new requirements for theclassification and measurement of financial assets and financial liabilities, including derecognition. IFRS 9requires that all financial assets be subsequently measured at amortized cost or fair value. The new standard also requires that changes in fair value attributable to a financial liability’s credit risk be presented in othercomprehensive income, not in profit or loss. In addition, it includes a single expected-loss impairment model and a reformed approach to hedge accounting. This standard is effective on or after January 1, 2018, on aretrospective basis subject to certain exceptions.
The Company is conducting an initial diagnostic assessment of IFRS 9, including assessing the impact that thenew expected-loss impairment model will have on the timing of recognition of allowance for doubtful accounts.The Company has investments held for self-insured liabilities, including equity securities and bonds. TheCompany is in the process of evaluating whether to classify these equities at fair value through profit or loss(FVTPL) or at fair value through other comprehensive income (FVTOCI). If the election for FVTOCI is chosen,any subsequent gains or losses on disposal will not be recycled to income. In addition, these equity securities willno longer require an impairment test under either option. Regarding bonds, the Company is in the process ofdetermining whether they will be classified at amortized cost, FVTOCI, or FVTPL.
In January 2016, the IASB issued IFRS 16 Leases (IFRS 16) to introduce a single lessee accounting model andrequires a lessee to recognize assets and liabilities for all leases with a term of more than 12 months, unless theunderlying asset is of low value. IFRS 16 substantially carries forward the lessor accounting requirements in IAS 17 Leases (IAS 17). The new standard is effective for annual periods beginning on or after January 1, 2019.IFRS 16 will replace IAS 17 and some lease-related interpretations. The Company is currently evaluating theimpact of this standard on its consolidated financial statements.
The following additional interpretation was issued in 2017 and will be effective in future years. The Company iscurrently considering the impact of adopting this interpretation on its consolidated financial statements and cannotreasonably estimate the effect at this time.
In June 2017, the International Financial Reporting Interpretations Committee (IFRIC) issued IFRIC 23Uncertainty over Income Tax Treatments (IFRIC 23). This interpretation addresses how to reflect the effects ofuncertainty in accounting for income tax. When there is uncertainty over income tax treatments under IAS 12Income Taxes, IFRIC 23 is to be applied when determining taxable profit (tax loss), tax bases, unused taxlosses, unused tax credits, and tax rates. This interpretation is effective January 1, 2019, retrospectively, subjectto certain exceptions.
Notes to the Unaudited Interim Condensed Consolidated Financial Statements June 30, 2017 F-9 Stantec Inc.
5. BUSINESS ACQUISITIONS
Acquisitions are accounted for under the acquisition method of accounting, and the results of operations since therespective dates of acquisition are included in the consolidated statements of income. From time to time, as a result of the timing of acquisitions in relation to the Company’s reporting schedule, certain estimates of fair values of assetsand liabilities acquired may not be finalized at the initial time of reporting. These estimates are completed after thevendors’ final financial statements and income tax returns have been prepared and accepted by the Company, afterdetailed project portfolio reviews are performed, and when the valuations of intangible assets and other assets andliabilities acquired are finalized. The preliminary fair values are based on management’s best estimates of theacquired identifiable assets and liabilities at the acquisition date. During a measurement period not to exceed oneyear, adjustments to the initial estimates may be required to finalize the fair value of assets and liabilities acquired.The Company will revise comparative information if these measurement period adjustments are material.
The consideration paid for acquisitions may be subject to price adjustment clauses included in the purchaseagreements and may extend over a number of years. At each consolidated statement of financial position date, these price adjustment clauses are reviewed. This may result in an increase or decrease of the notes payableconsideration (recorded on the acquisition date) to reflect either more or less non-cash working capital than wasoriginally recorded. Since these adjustments are a result of facts and circumstances occurring after the acquisitiondate, they are not considered measurement period adjustments.
For some acquisitions, additional payments may be made to the employees of an acquired company that are based on the employees’ continued service over an agreed time period. These additional payments are not included in thepurchase price. They are expensed as compensation when services are provided by the employees.
Acquisitions in 2016
During 2016, the Company acquired all the shares and business of Bury Holdings, Inc. (Bury); MWH Global, Inc.
(MWH); VOA Associates, Inc. (VOA); Edwards and Zuck, P.C. and Edwards and Zuck Consulting Engineers,
D.P.C. (collectively called Edwards & Zuck); and all the assets of Architecture | Tkalcic Bengert (Arch | TB).
The preliminary fair values of the net assets recognized in the Company’s consolidated financial statements werebased on management’s best estimates of the acquired identifiable assets and liabilities at the acquisition date. For thetwo quarters ended June 30, 2017, management finalized the fair value assessment for all assets and liabilitiesacquired from VOA, Bury, and MWH. For the VOA and Bury acquisitions, no adjustments were required to theinitial estimates of the fair value of assets and liabilities acquired. For the MWH acquisition, all adjustments required,from the initial estimates of the fair value of net assets acquired to their final fair value, were recorded in 2016. Theseadjustments, as well as the final MWH purchase price allocation to all identifiable assets and liabilities acquired, aredisclosed in note 7 of the Company’s December 31, 2016, annual consolidated financial statements. For all otheracquisitions completed in 2016, the fair value estimates are still preliminary, pending the preparation of their final taxreturns, a detailed review of their project portfolio, and the valuation of intangible assets and other assets andliabilities. There were no material measurement period adjustments recorded in the six months ended June 30, 2017.
Acquisitions in 2017
On April 28, 2017, the Company acquired certain assets and liabilities of Inventrix Engineering, Inc. (Inventrix) forcash consideration and notes payable. Inventrix, based in Seattle, Washington, provides expertise in mechanicalengineering. This addition will enhance the Company’s Buildings business operating unit in the United States. Theconsideration was allocated to the fair value of assets and liabilities acquired.
The fair values of provisions are determined at the acquisition date. These liabilities relate to claims that are subjectto legal arbitration and onerous contracts. At the reporting date, provisions for claims outstanding relating to currentyear and all prior acquisitions were reassessed and determined to be $18,729,000, based on their expected probableoutcome. Certain of these claims are indemnified by the acquiree (note 11).
In 2017, directly attributable acquisition-related costs of $312,000 have been expensed and are included inadministrative and marketing expenses. These costs consist primarily of legal, accounting, and financial advisory fees and costs directly related to acquisitions.
Notes to the Unaudited Interim Condensed Consolidated Financial Statements June 30, 2017 F-10 Stantec Inc.
Consideration paid and outstanding
Details of the consideration paid for current and past acquisitions are as follows:
For the quarter For the two quarters ended June 30 ended June 30
(In thousands of Canadian dollars)
2017$
2017$
Cash consideration (net of cash acquired) 1,435 1,435Payments on notes payable from previous acquisitions 16,280 47,478
Total net cash paid 17,715 48,913
Total notes payable and adjustments to these obligations are as follows:
June 30 2017
(In thousands of Canadian dollars) $
Balance, beginning of period 122,365Additions for acquisitions in the period 871Other adjustments 2,627Payments (47,478)Interest 620Impact of foreign exchange (2,959)
Total notes payable 76,046
6. DISPOSITION OF A SUBSIDIARY
On May 5, 2017, the Company completed the sale of the shares of Innovyze, Inc. along with its subsidiaries InnovyzePty Limited and Innovyze Limited (collectively, Innovyze). Innovyze was acquired as part of the MWH acquisitionand formed part of the Company’s Consulting Services – US and Consulting Services – Global reportable segments.Innovyze was sold for gross proceeds of $369,090,000 (US$270,000,000), less estimated working capitaladjustments, resulting in cash proceeds of $337,198,000 and accounts payable of $327,000. The working capitaladjustments are expected to be finalized in the third quarter, at which time the payable will be settled. As a result ofthe sale, during the quarter ended June 30, 2017, the Company recognized the following gain on disposition in theconsolidated statements of income:
(In thousands of Canadian dollars) $
Gross proceeds 369,090Estimated working capital adjustments (15,008)Transaction costs (16,884)
Cash proceeds from sale 337,198Accounts payable owing to purchaser (327)
Net proceeds from sale 336,871
Net assets disposed (268,520)Cumulative exchange loss on translating foreign operations reclassified from equity (13,775)
Gain on disposal of a subsidiary 54,576
Notes to the Unaudited Interim Condensed Consolidated Financial Statements June 30, 2017 F-11 Stantec Inc.
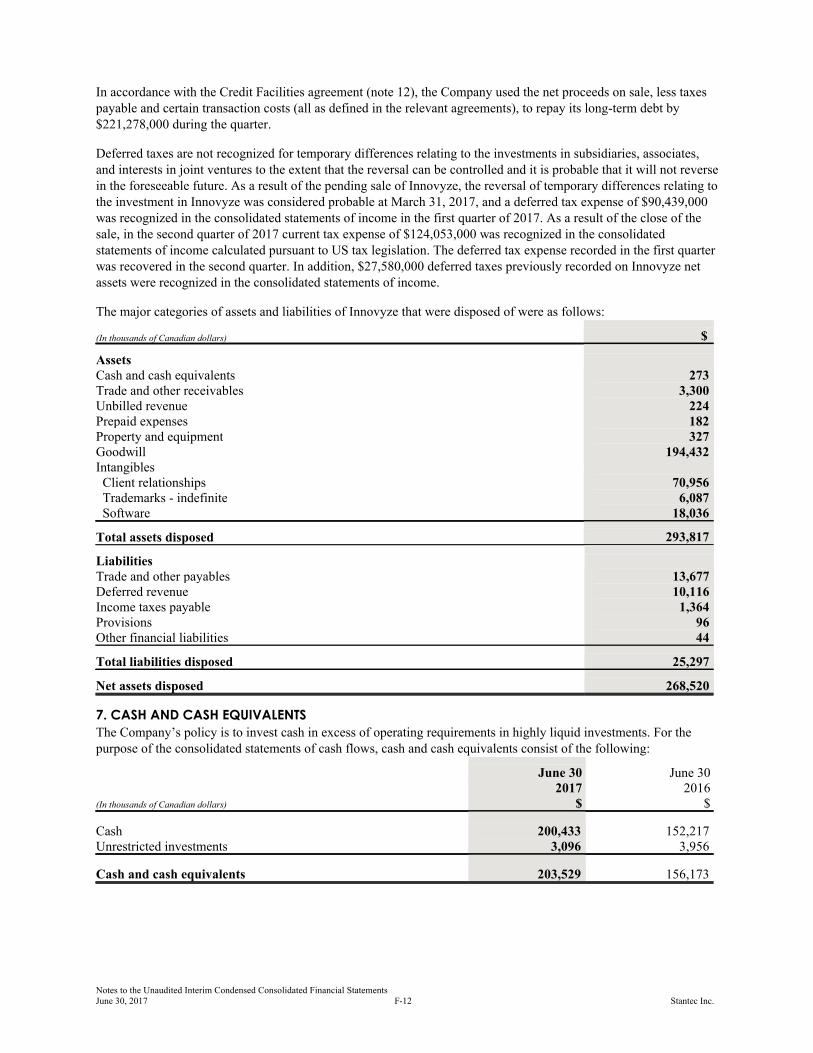
In accordance with the Credit Facilities agreement (note 12), the Company used the net proceeds on sale, less taxespayable and certain transaction costs (all as defined in the relevant agreements), to repay its long-term debt by$221,278,000 during the quarter.
Deferred taxes are not recognized for temporary differences relating to the investments in subsidiaries, associates, and interests in joint ventures to the extent that the reversal can be controlled and it is probable that it will not reversein the foreseeable future. As a result of the pending sale of Innovyze, the reversal of temporary differences relating tothe investment in Innovyze was considered probable at March 31, 2017, and a deferred tax expense of $90,439,000was recognized in the consolidated statements of income in the first quarter of 2017. As a result of the close of thesale, in the second quarter of 2017 current tax expense of $124,053,000 was recognized in the consolidatedstatements of income calculated pursuant to US tax legislation. The deferred tax expense recorded in the first quarterwas recovered in the second quarter. In addition, $27,580,000 deferred taxes previously recorded on Innovyze netassets were recognized in the consolidated statements of income.
The major categories of assets and liabilities of Innovyze that were disposed of were as follows:
(In thousands of Canadian dollars) $
AssetsCash and cash equivalents 273Trade and other receivables 3,300Unbilled revenue 224Prepaid expenses 182Property and equipment 327Goodwill 194,432Intangibles Client relationships 70,956 Trademarks - indefinite 6,087 Software 18,036
Total assets disposed 293,817
LiabilitiesTrade and other payables 13,677Deferred revenue 10,116Income taxes payable 1,364Provisions 96Other financial liabilities 44
Total liabilities disposed 25,297
Net assets disposed 268,520
7. CASH AND CASH EQUIVALENTS
The Company’s policy is to invest cash in excess of operating requirements in highly liquid investments. For thepurpose of the consolidated statements of cash flows, cash and cash equivalents consist of the following:
June 30 June 302017 2016
(In thousands of Canadian dollars) $ $
Cash 200,433 152,217Unrestricted investments 3,096 3,956
Cash and cash equivalents 203,529 156,173
Notes to the Unaudited Interim Condensed Consolidated Financial Statements June 30, 2017 F-12 Stantec Inc.
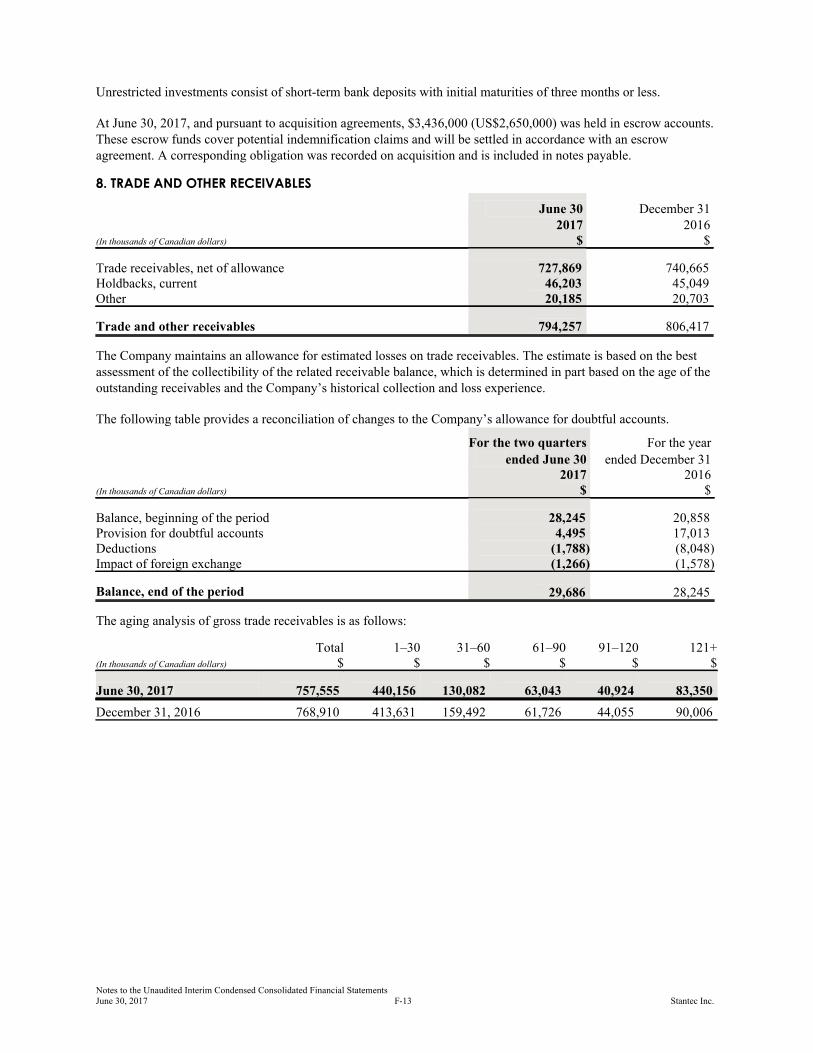
Unrestricted investments consist of short-term bank deposits with initial maturities of three months or less.
At June 30, 2017, and pursuant to acquisition agreements, $3,436,000 (US$2,650,000) was held in escrow accounts.These escrow funds cover potential indemnification claims and will be settled in accordance with an escrowagreement. A corresponding obligation was recorded on acquisition and is included in notes payable.
8. TRADE AND OTHER RECEIVABLES
June 30 December 312017 2016
(In thousands of Canadian dollars) $ $
Trade receivables, net of allowance 727,869 740,665Holdbacks, current 46,203 45,049Other 20,185 20,703
Trade and other receivables 794,257 806,417
The Company maintains an allowance for estimated losses on trade receivables. The estimate is based on the bestassessment of the collectibility of the related receivable balance, which is determined in part based on the age of theoutstanding receivables and the Company’s historical collection and loss experience.
The following table provides a reconciliation of changes to the Company’s allowance for doubtful accounts.
For the two quarters For the year
ended June 30 ended December 312017 2016
(In thousands of Canadian dollars) $ $
Balance, beginning of the period 28,245 20,858Provision for doubtful accounts 4,495 17,013Deductions (1,788) (8,048)Impact of foreign exchange (1,266) (1,578)
Balance, end of the period 29,686 28,245
The aging analysis of gross trade receivables is as follows:
Total 1–30 31–60 61–90 91–120 121+(In thousands of Canadian dollars) $ $ $ $ $ $
June 30, 2017 757,555 440,156 130,082 63,043 40,924 83,350
December 31, 2016 768,910 413,631 159,492 61,726 44,055 90,006
Notes to the Unaudited Interim Condensed Consolidated Financial Statements June 30, 2017 F-13 Stantec Inc.
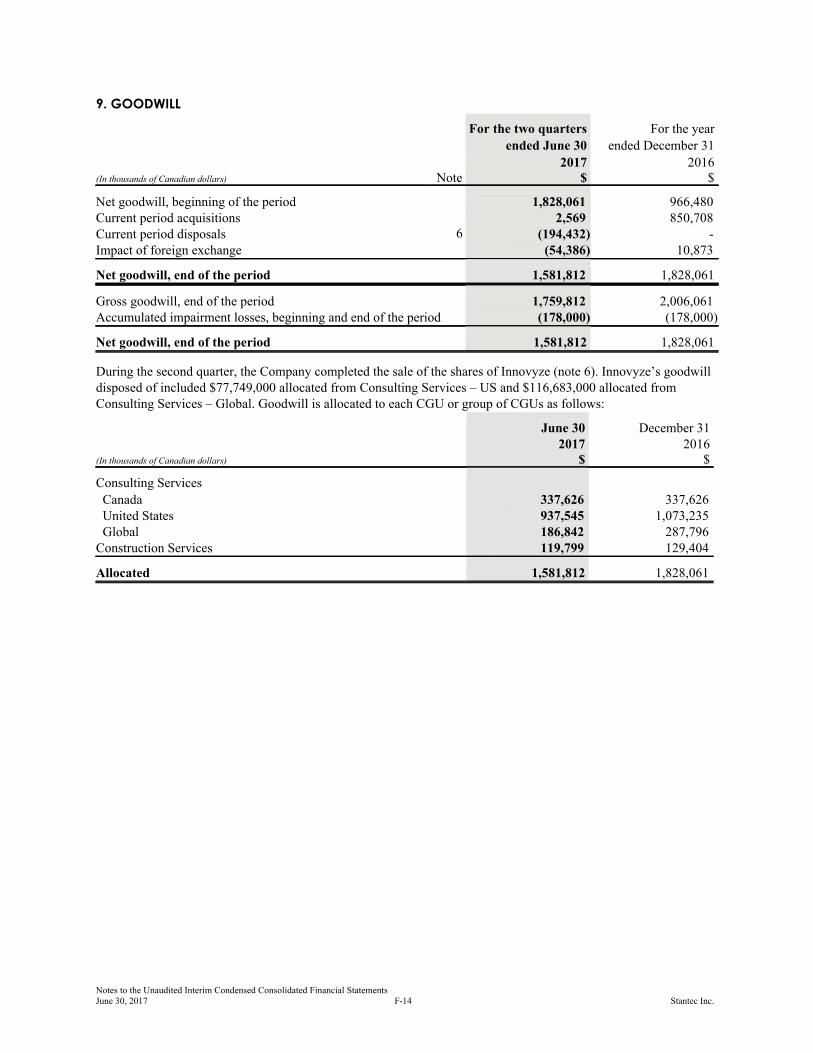
9. GOODWILL
For the two quarters For the year
ended June 30 ended December 31
2017 2016(In thousands of Canadian dollars) Note $ $
Net goodwill, beginning of the period 1,828,061 966,480Current period acquisitions 2,569 850,708Current period disposals 6 (194,432) -Impact of foreign exchange (54,386) 10,873
Net goodwill, end of the period 1,581,812 1,828,061
Gross goodwill, end of the period 1,759,812 2,006,061Accumulated impairment losses, beginning and end of the period (178,000) (178,000)
Net goodwill, end of the period 1,581,812 1,828,061
During the second quarter, the Company completed the sale of the shares of Innovyze (note 6). Innovyze’s goodwilldisposed of included $77,749,000 allocated from Consulting Services – US and $116,683,000 allocated fromConsulting Services – Global. Goodwill is allocated to each CGU or group of CGUs as follows:
June 30 December 312017 2016
(In thousands of Canadian dollars) $ $
Consulting Services
Canada 337,626 337,626 United States 937,545 1,073,235 Global 186,842 287,796Construction Services 119,799 129,404
Allocated 1,581,812 1,828,061
Notes to the Unaudited Interim Condensed Consolidated Financial Statements June 30, 2017 F-14 Stantec Inc.
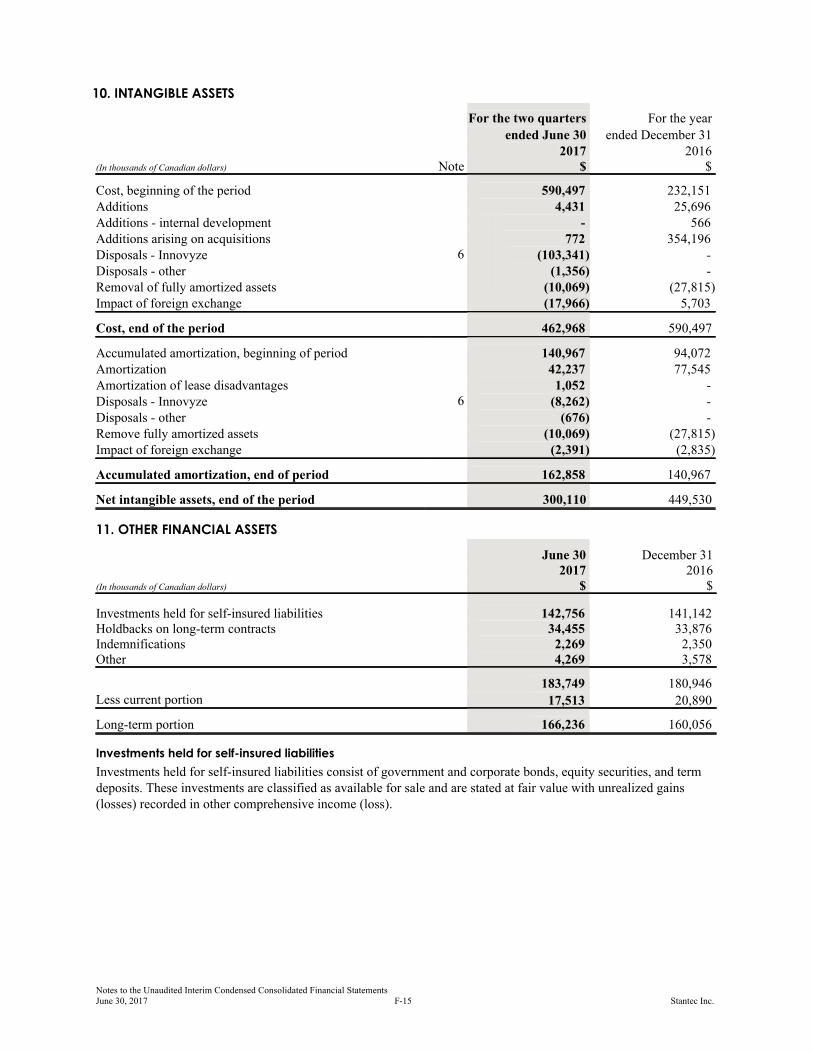
10. INTANGIBLE ASSETS
For the two quarters For the year
ended June 30 ended December 312017 2016
(In thousands of Canadian dollars) Note $ $
Cost, beginning of the period 590,497 232,151Additions 4,431 25,696Additions - internal development - 566Additions arising on acquisitions 772 354,196Disposals - Innovyze 6 (103,341) -Disposals - other (1,356) -Removal of fully amortized assets (10,069) (27,815)Impact of foreign exchange (17,966) 5,703
Cost, end of the period 462,968 590,497
Accumulated amortization, beginning of period 140,967 94,072Amortization 42,237 77,545Amortization of lease disadvantages 1,052 -Disposals - Innovyze 6 (8,262) -Disposals - other (676) -Remove fully amortized assets (10,069) (27,815)Impact of foreign exchange (2,391) (2,835)
Accumulated amortization, end of period 162,858 140,967
Net intangible assets, end of the period 300,110 449,530
11. OTHER FINANCIAL ASSETS
June 30 December 312017 2016
(In thousands of Canadian dollars) $ $
Investments held for self-insured liabilities 142,756 141,142Holdbacks on long-term contracts 34,455 33,876Indemnifications 2,269 2,350Other 4,269 3,578
183,749 180,946Less current portion 17,513 20,890
Long-term portion 166,236 160,056
Investments held for self-insured liabilities
Investments held for self-insured liabilities consist of government and corporate bonds, equity securities, and termdeposits. These investments are classified as available for sale and are stated at fair value with unrealized gains(losses) recorded in other comprehensive income (loss).
Notes to the Unaudited Interim Condensed Consolidated Financial Statements June 30, 2017 F-15 Stantec Inc.
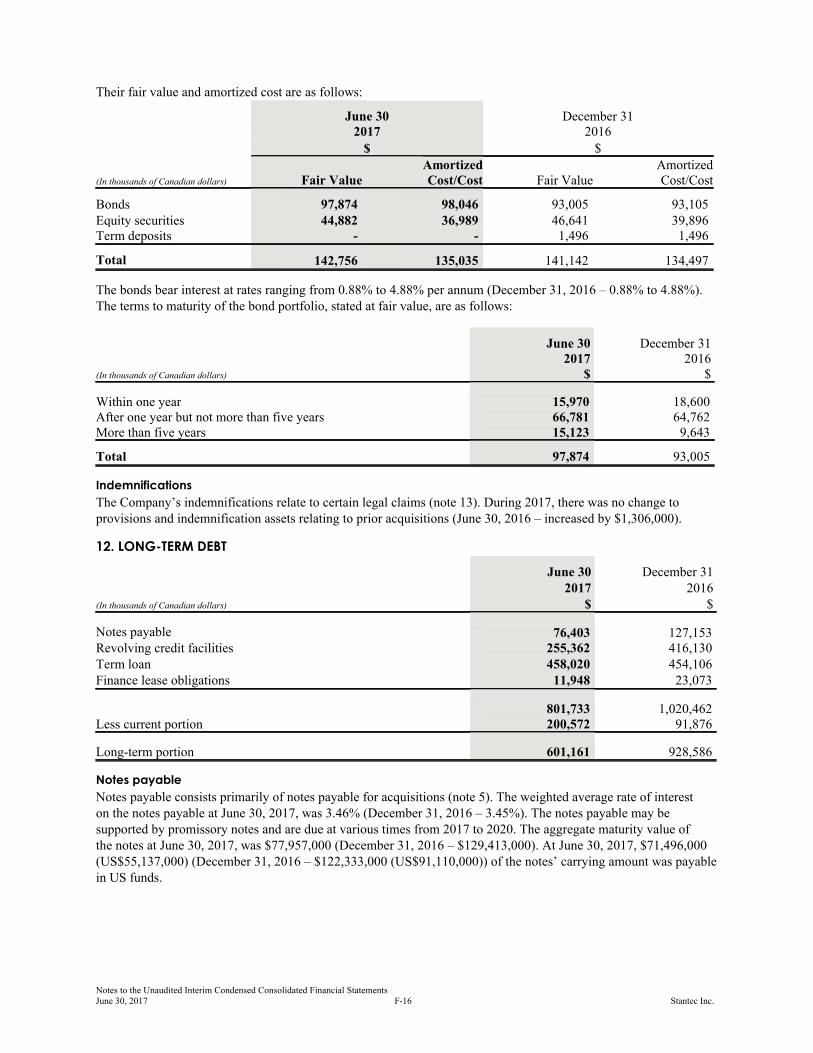
Their fair value and amortized cost are as follows:
June 30 December 312017 2016
$ $
(In thousands of Canadian dollars) Fair ValueAmortized Cost/Cost Fair Value
Amortized Cost/Cost
Bonds 97,874 98,046 93,005 93,105Equity securities 44,882 36,989 46,641 39,896Term deposits - - 1,496 1,496
Total 142,756 135,035 141,142 134,497
The bonds bear interest at rates ranging from 0.88% to 4.88% per annum (December 31, 2016 – 0.88% to 4.88%).The terms to maturity of the bond portfolio, stated at fair value, are as follows:
June 30 December 312017 2016
(In thousands of Canadian dollars) $ $
Within one year 15,970 18,600After one year but not more than five years 66,781 64,762More than five years 15,123 9,643
Total 97,874 93,005
Indemnifications
The Company’s indemnifications relate to certain legal claims (note 13). During 2017, there was no change toprovisions and indemnification assets relating to prior acquisitions (June 30, 2016 – increased by $1,306,000).
12. LONG-TERM DEBT
June 30 December 312017 2016
(In thousands of Canadian dollars) $ $
Notes payable 76,403 127,153Revolving credit facilities 255,362 416,130Term loan 458,020 454,106Finance lease obligations 11,948 23,073
801,733 1,020,462Less current portion 200,572 91,876
Long-term portion 601,161 928,586
Notes payable
Notes payable consists primarily of notes payable for acquisitions (note 5). The weighted average rate of interest on the notes payable at June 30, 2017, was 3.46% (December 31, 2016 – 3.45%). The notes payable may besupported by promissory notes and are due at various times from 2017 to 2020. The aggregate maturity value of the notes at June 30, 2017, was $77,957,000 (December 31, 2016 – $129,413,000). At June 30, 2017, $71,496,000(US$55,137,000) (December 31, 2016 – $122,333,000 (US$91,110,000)) of the notes’ carrying amount was payablein US funds.
Notes to the Unaudited Interim Condensed Consolidated Financial Statements June 30, 2017 F-16 Stantec Inc.
Revolving credit facilities and term loan
On May 6, 2016, the Company entered into an agreement for new $1.25 billion syndicated senior secured creditfacilities (Credit Facilities) consisting of a senior secured revolving credit facility in the maximum amount of $800 million and a $450 million senior secured term loan in three tranches. This agreement allows the Companyaccess to an additional $200 million, subject to approval, under the same terms and conditions. The revolving creditfacility expires on May 6, 2021, and may be repaid from time to time at the option of the Company. The facility isavailable for future acquisitions, working capital needs, and general corporate purposes. Tranches A and B of theterm loan were drawn in Canadian funds of $150 million each (due May 6, 2018, and May 6, 2019, respectively), and tranche C was originally drawn in US funds of $116.7 million (due May 6, 2020). On May 5, 2017, the Companyreached an agreement to extend the maturity date of its $800 million senior secured revolving credit facility fromMay 6, 2020, to May 6, 2021, and to redenominate tranche C of its $450 million senior secured term loan from USfunds of $116.7 million to Canadian funds of $160.0 million. The term loan was recorded net of transaction costs of$3,341,000, which are amortized over the life of the three tranches.
The Credit Facilities may be drawn in Canadian dollars as either a prime rate loan or a bankers’ acceptance; in US dollars as either a US base rate or a LIBOR advance; or, in the case of the revolving credit facility, in sterling oreuros as a LIBOR advance; and by way of letters of credit. Depending on the form under which the credit facilitiesare accessed, rates of interest vary between Canadian prime, US base rate, and LIBOR or bankers’ acceptance rates,plus specified basis points. The specified basis points vary, depending on the Company’s leverage ratio (a non-IFRS measure), from 0 to 175 for Canadian prime and US base rate loans and from 100 to 275 for bankers’acceptances, LIBOR advances, and letters of credit. As security for the obligations under these facilities, theCompany and certain of its subsidiaries granted the lenders a first-ranking security interest over all present and after-acquired assets, property, and undertakings, subject to customary carve-outs. The Credit Facilities containrestrictive covenants (note 18).
At June 30, 2017, $93,362,000 (US$72,000,000) of the revolving credit facility was payable in US funds,$162,000,000 in Canadian funds. At December 31, 2016, $114,130,000 (US$85,000,000) of the revolving creditfacility was payable in US funds and $302,000,000 was payable in Canadian funds. At June 30, 2017, $460,041,000of the term loan was payable in Canadian funds. At December 31, 2016, $156,693,000 (US $116,700,000) of theterm loan was payable in US funds and $300,000,000 was payable in Canadian funds. The average interest rateapplicable at June 30, 2017, for the Credit Facilities was 3.25% (December 31, 2016 – 3.13%).
The funds available under the revolving credit facility are reduced by any outstanding letters of credit issued pursuantto the facility agreement. At June 30, 2017, the Company had issued and outstanding letters of credit that expire atvarious dates before July 2018, are payable in various currencies, and total $57,046,000 (December 31, 2016 –$54,729,000). These letters of credit were issued in the normal course of operations, including the guarantee ofcertain office rental obligations. At June 30, 2017, $487,592,000 (December 31, 2016 – $329,141,000) was availablein the revolving credit facility for future activities.
At June 30, 2017, there were $4,146,000 (December 31, 2016 – $3,628,000) in additional letters of credit issued andoutstanding, outside of the Company’s revolving credit facility. These were issued in various currencies and expire atvarious dates before July 2018.
Surety facilities
The Company has surety facilities to facilitate, as part of the normal course of operations, the issuance of bonds for certain types of project work. At June 30, 2017, the Company issued bonds under these surety facilities totaling $162,000 (December 31, 2016 – $162,000) in Canadian funds, $355,527,000 (US$274,178,000) (December 31, 2016 – $430,630,000 (US$320,719,000)) in US funds, and $1,216,000 (December 31, 2016 –$1,320,000) in other foreign currencies. These bonds expire at various dates before January 2021.
Finance lease obligations
The Company has finance leases for software and for automotive and office equipment. At June 30, 2017, finance lease obligations included finance leases bearing interest at rates ranging from 1.395% to 5.926% (December 31, 2016 – 1.37% to 5.93%). These finance leases expire at various dates before November 2021.
Notes to the Unaudited Interim Condensed Consolidated Financial Statements June 30, 2017 F-17 Stantec Inc.
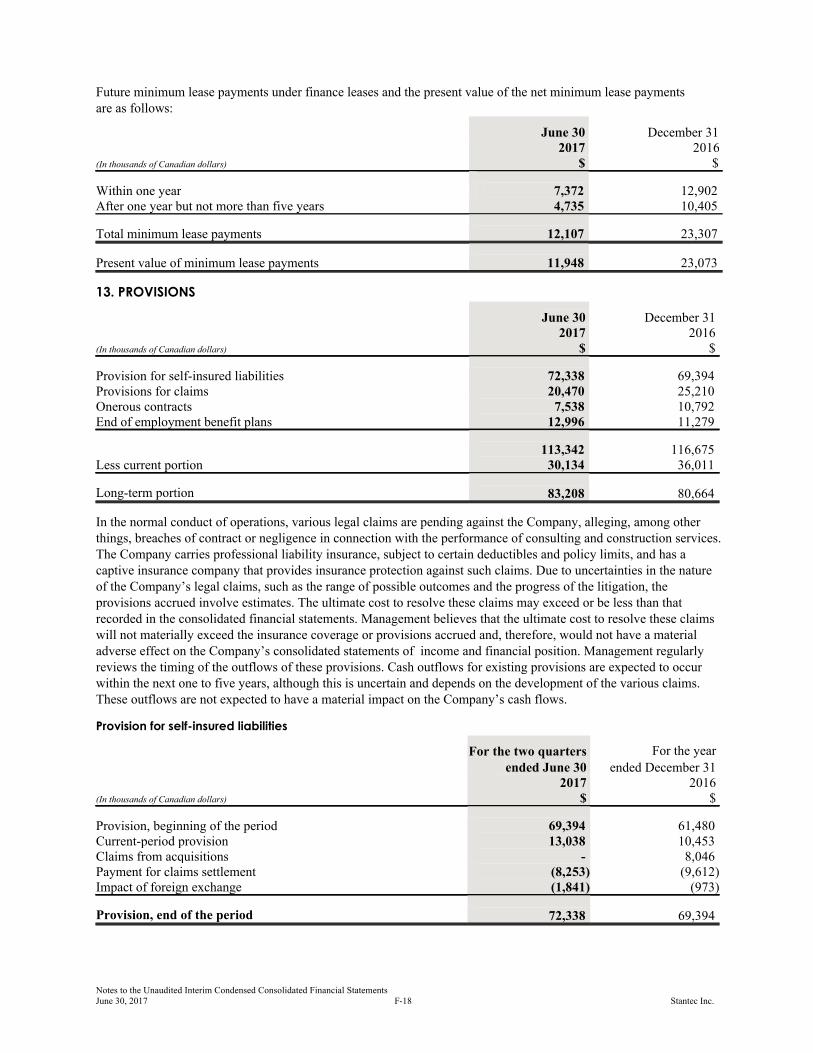
Future minimum lease payments under finance leases and the present value of the net minimum lease payments are as follows:
June 30 December 312017 2016
(In thousands of Canadian dollars) $ $
Within one year 7,372 12,902After one year but not more than five years 4,735 10,405
Total minimum lease payments 12,107 23,307
Present value of minimum lease payments 11,948 23,073
13. PROVISIONS
June 30 December 312017 2016
(In thousands of Canadian dollars) $ $
Provision for self-insured liabilities 72,338 69,394Provisions for claims 20,470 25,210Onerous contracts 7,538 10,792End of employment benefit plans 12,996 11,279
113,342 116,675Less current portion 30,134 36,011
Long-term portion 83,208 80,664
In the normal conduct of operations, various legal claims are pending against the Company, alleging, among otherthings, breaches of contract or negligence in connection with the performance of consulting and construction services.The Company carries professional liability insurance, subject to certain deductibles and policy limits, and has acaptive insurance company that provides insurance protection against such claims. Due to uncertainties in the natureof the Company’s legal claims, such as the range of possible outcomes and the progress of the litigation, theprovisions accrued involve estimates. The ultimate cost to resolve these claims may exceed or be less than thatrecorded in the consolidated financial statements. Management believes that the ultimate cost to resolve these claimswill not materially exceed the insurance coverage or provisions accrued and, therefore, would not have a materialadverse effect on the Company’s consolidated statements of income and financial position. Management regularlyreviews the timing of the outflows of these provisions. Cash outflows for existing provisions are expected to occurwithin the next one to five years, although this is uncertain and depends on the development of the various claims.These outflows are not expected to have a material impact on the Company’s cash flows.
Provision for self-insured liabilities
For the two quarters For the year
ended June 30 ended December 312017 2016
(In thousands of Canadian dollars) $ $
Provision, beginning of the period 69,394 61,480Current-period provision 13,038 10,453Claims from acquisitions - 8,046Payment for claims settlement (8,253) (9,612)Impact of foreign exchange (1,841) (973)
Provision, end of the period 72,338 69,394
Notes to the Unaudited Interim Condensed Consolidated Financial Statements June 30, 2017 F-18 Stantec Inc.
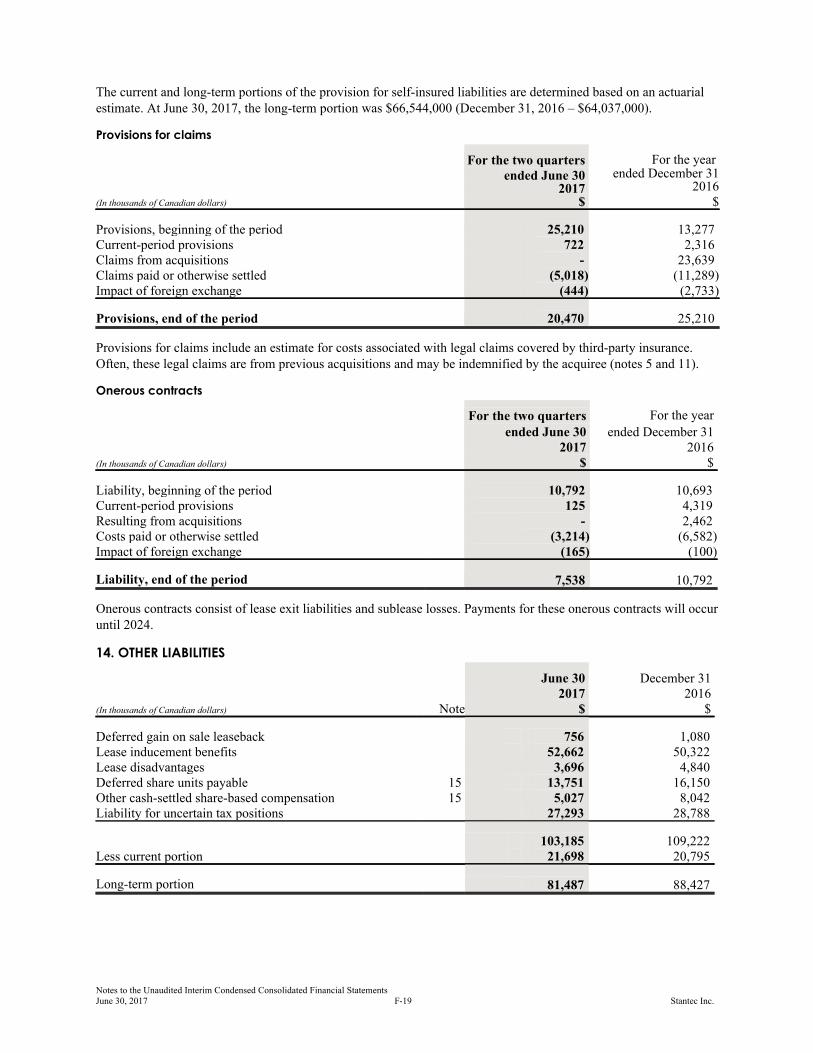
The current and long-term portions of the provision for self-insured liabilities are determined based on an actuarialestimate. At June 30, 2017, the long-term portion was $66,544,000 (December 31, 2016 – $64,037,000).
Provisions for claims
For the two quarters ended June 30
2017
For the year ended December 31
2016(In thousands of Canadian dollars) $ $
Provisions, beginning of the period 25,210 13,277Current-period provisions 722 2,316Claims from acquisitions - 23,639Claims paid or otherwise settled (5,018) (11,289)Impact of foreign exchange (444) (2,733)
Provisions, end of the period 20,470 25,210
Provisions for claims include an estimate for costs associated with legal claims covered by third-party insurance.Often, these legal claims are from previous acquisitions and may be indemnified by the acquiree (notes 5 and 11).
Onerous contracts
For the two quarters For the year
ended June 30 ended December 312017 2016
(In thousands of Canadian dollars) $ $
Liability, beginning of the period 10,792 10,693Current-period provisions 125 4,319Resulting from acquisitions - 2,462Costs paid or otherwise settled (3,214) (6,582)Impact of foreign exchange (165) (100)
Liability, end of the period 7,538 10,792
Onerous contracts consist of lease exit liabilities and sublease losses. Payments for these onerous contracts will occuruntil 2024.
14. OTHER LIABILITIES
June 30 December 312017 2016
(In thousands of Canadian dollars) Note $ $
Deferred gain on sale leaseback 756 1,080Lease inducement benefits 52,662 50,322Lease disadvantages 3,696 4,840Deferred share units payable 15 13,751 16,150Other cash-settled share-based compensation 15 5,027 8,042Liability for uncertain tax positions 27,293 28,788
103,185 109,222Less current portion 21,698 20,795
Long-term portion 81,487 88,427
Notes to the Unaudited Interim Condensed Consolidated Financial Statements June 30, 2017 F-19 Stantec Inc.
15. SHARE CAPITAL
Authorized
Unlimited Common shares, with no par valueUnlimited Preferred shares issuable in series, with attributes designated by the board of directors
Common shares
On November 9, 2016, the Company received approval from the TSX respecting the renewal of the Company’sNormal Course Issuer Bid, which enables it to purchase up to 3,418,357 common shares during the period November 14, 2016, to November 13, 2017. During the second quarter of 2017, 465,713 common shares wererepurchased for cancellation pursuant to the ongoing Normal Course Issuer Bid at a cost of $14,408,000. Of thisamount, $3,572,000 and $79,000 reduced the share capital and contributed surplus accounts, respectively, with$10,757,000 being charged to retained earnings. No shares were repurchased in the first quarter of 2017.
During the first quarter of 2016, 572,825 common shares were repurchased for cancellation pursuant to the then-effective Normal Course Issuer Bid at a cost of $18,210,000. Of this amount, $1,754,000 and $95,000 reducedthe share capital and contributed surplus accounts, respectively, with $16,361,000 being charged to retained earnings.No shares were repurchased in the second quarter of 2016.
During the second quarter of 2017, the Company recognized a share-based compensation expense of $539,000 (June 30, 2016 – $393,000) in administrative and marketing expenses in the consolidated statements of income. Of the amount expensed, $1,056,000 (June 30, 2016 – $880,000) related to the amortization of the fair value ofoptions granted and was decreased by $517,000 (June 30, 2016 – reduced by $487,000) related to the cash-settledshare-based compensation (deferred share units (DSUs) and performance share units (PSUs)).
During the first two quarters of 2017, the Company recognized a share-based compensation expense of $3,149,000(June 30, 2016 – $1,276,000) in administrative and marketing expenses in the consolidated statements of income. Ofthe amount expensed, $2,197,000 (June 30, 2016 – $1,928,000) related to the amortization of the fair value ofoptions granted and was increased by $952,000 (June 30, 2016 – reduced by $652,000) related to the cash-settledshare-based compensation DSUs and PSUs.
The fair value of options granted was reflected through contributed surplus, and the cash-settled share-basedcompensation was reflected through other liabilities. Upon the exercise of share options for which a share-basedcompensation expense has been recognized, the cash paid, together with the related portion of contributed surplus, is credited to share capital.
Dividends
Holders of common shares are entitled to receive dividends when declared by the Company’s board of directors. The table below describes the dividends declared and recorded in the consolidated financial statements in 2017.
Date Declared Record Date Payment DateDividend per Share
$Paid
$
November 9, 2016 December 30, 2016 January 12, 2017 0.1125 12,834,000 February 22, 2017 March 31, 2017 April 13, 2017 0.1250 14,273,000 May 10, 2017 June 30, 2017 July 13, 2017 0.1250 -
At June 30, 2017, trade and other payables included $14,226,000 (December 31, 2016 – $12,834,000) related to thedividends declared on May 10, 2017.
Share-based payment transactions
In 2017, under the long-term incentive program, the Company granted share options and PSUs. The Company alsohas a DSU plan for the board of directors.
Notes to the Unaudited Interim Condensed Consolidated Financial Statements June 30, 2017 F-20 Stantec Inc.
a) Share options
The Company has granted share options to officers and employees to purchase 4,625,536 shares at prices from$14.33 to $32.90 per share. These options expire on dates between January 28, 2018, and May 16, 2022.
For the two quarters ended For the year endedJune 30 December 31
2017 2016
Shares
WeightedAverage Exercise
Price Shares
WeightedAverage Exercise
Price# $ # $
Share options, beginning of the period 3,655,020 28.33 2,980,601 26.17Granted 1,229,689 31.75 995,904 32.83Exercised (200,988) 21.76 (254,156) 19.76Forfeited (58,185) 32.08 (67,329) 31.45
Share options, end of the period 4,625,536 29.48 3,655,020 28.33
The fair value of options granted is determined at the date of grant using the Black-Scholes option-pricing model.The model was developed to use when estimating the fair value of traded options that have no vesting restrictions and are fully transferable. Option valuation models require the input of highly subjective assumptions, includingexpected share price volatility and expected hold period to exercise.
In the second quarter of 2017, the Company granted 1,229,689 (June 30, 2016 – 995,904) share options. Theestimated fair value of options granted at the share market price on the grant date was $5.03 (June 30, 2016 – $5.22)and was determined using the weighted average assumptions indicated below:
2017 2016
Volatility in the price of the Company’s shares (%) 24.13 23.73Risk-free interest rate (%) 0.81 0.76Expected hold period to exercise (years) 3.50 3.50Dividend yield (%) 1.575 1.370Exercise price ($) 31.75 32.83
The expected volatility was based on the historical volatility of the Company’s shares over a period commensuratewith the expected hold period of the share options. The risk-free interest rate for the expected hold period of theoptions was based on the yield available on government bonds, with an approximate equivalent remaining term at thetime of the grant. Historical data was used to estimate the expected hold period before exercising the options. The options have a contractual life of five years.
A summary of the status of the Company’s non-vested options as at June 30, 2017, and of changes in the period are as follows:
Number of SharesSubject to Option
Weighted Average Grant DateFair Value
# $
Non-vested share options, beginning of the period 1,826,629 5.78Granted 1,229,689 5.03Vested (852,872) 5.98Forfeited (51,997) 5.51
Non-vested share options, end of the period 2,151,449 5.28
Notes to the Unaudited Interim Condensed Consolidated Financial Statements June 30, 2017 F-21 Stantec Inc.
At June 30, 2017, 2,151,449 (June 30, 2016 – 1,862,484) options remain unvested. At June 30, 2017, a totalcompensation cost of $7,471,000 (June 30, 2016 – $6,428,000) relating to the Company’s share option plansremained unrecognized. This cost is expected to be recognized over a weighted average period of 1.6 years (June 30, 2016 – 1.5 years).
At June 30, 2017, 2,474,087 (June 30, 2016 – 2,013,007) share options were exercisable at weighted average costprice of $27.20 (June 30, 2016 – $23.74). At June 30, 2017, 1,624,068 share options were antidilutive (June 30, 2016 – 2,667,675).
b) Performance share units
Under the Company’s long-term incentive program, certain members of the senior leadership teams, including thechief executive officer (CEO), may be granted PSUs. These units are adjusted for dividends as they arise, based onthe number of units held on the record date. PSUs vest upon completing a three-year service condition that starts onthe grant date. The number of units that vest is subject to a percentage that can range from 0% to 200%, depending onachieving two equally weighted three-year performance objectives based on net income growth and return on equity.For units that vest, unit holders receive a cash payment based on the closing price of the Company’s common shareson the third anniversary date of issue. The fair value of these units is expensed over their three-year vesting period.
During the quarter, 279,403 PSUs were issued (June 30, 2016 – 228,112), and 17,078 units were forfeited (June 30, 2016 – nil). At June 30, 2017, 683,000 PSUs were outstanding at a fair value of $16,375,000 (December 31, 2016 – 576,055 PSUs were outstanding at a fair value of $15,452,000).
c) Deferred share units
The directors of the board receive DSUs and, on an annual basis, elect to receive an additional fixed valuecompensation in the form of either DSUs or cash payment, less withholding amounts, to purchase common shares. A DSU is equal to one common share. Before 2014, the CEO could also receive DSUs. These units vest on theirgrant date and are paid in cash to the CEO and directors of the board on their death or retirement, or in the case of theCEO, in cash on termination. They are valued at the weighted-by-volume average of the closing market price of theCompany’s common shares for the last 10 trading days of the month of death, retirement, or termination. These unitsare recorded at fair value. DSUs are adjusted for dividends as they arise, based on the number of units outstanding onthe record date.
During the quarter, 10,051 DSUs (June 30, 2016 – 9,568) were issued and 66,021 DSUs were paid at a value of$2,051,000. At June 30, 2017, 420,532 DSUs were outstanding at the fair value of $13,751,000 (December 31, 2016– 466,365 DSUs were outstanding at a fair value of $16,150,000).
16. FAIR VALUE MEASUREMENTS
All financial instruments carried at fair value are categorized into one of the following categories:
Level 1 – quoted market prices
Level 2 – valuation techniques (market observable)
Level 3 – valuation techniques (non-market observable)
When forming estimates, the Company uses the most observable inputs available for valuation purposes. If a fairvalue measurement reflects inputs of different levels within the hierarchy, the financial instrument is categorizedbased on the lowest level of significant input.
When determining fair value, the Company considers the principal or most advantageous market in which it wouldtransact and the assumptions that market participants would use when pricing the asset or liability. The Companymeasures certain financial assets at fair value on a recurring basis. During 2017, no change was made to the methodof determining fair value.
For financial instruments recognized at fair value on a recurring basis, the Company determines whether transfershave occurred between levels in the hierarchy by reassessing categorizations at the end of each reporting period.
Notes to the Unaudited Interim Condensed Consolidated Financial Statements June 30, 2017 F-22 Stantec Inc.
During the two quarters ended June 30, 2017, no transfers were made between levels 1 and 2 fair valuemeasurements.
The following table summarizes the Company’s fair value hierarchy for those assets and liabilities measured andadjusted to fair value on a recurring basis as at June 30, 2017:
(In thousands of Canadian dollars) Note
CarryingAmount
$
Quoted Pricesin ActiveMarkets
for Identical
Items (Level 1)
$
SignificantOther
ObservableInputs
(Level 2)$
SignificantUnobservable
Inputs (Level 3)
$
Investments held for self-insured liabilities 11 142,756 - 142,756 -
Investments held for self-insured liabilities consist of government and corporate bonds, equity securities, and termdeposits. Fair value of equities is determined using the reported net asset value per share of the investment funds. Thefunds derive their value from the observable quoted prices of the equities owned that are traded in an active market.Fair value of bonds is determined using observable prices of debt with characteristics and maturities that are similarto the bonds being valued.
The following table summarizes the Company’s fair value hierarchy for those liabilities that were not measured at fairvalue but are required to be disclosed at fair value on a recurring basis as at June 30, 2017:
(In thousands of Canadian dollars) Note
Fair ValueAmount of
Liability $
Quoted Pricesin ActiveMarkets
for Identical
Items (Level 1)
$
SignificantOther
ObservableInputs
(Level 2)$
SignificantUnobservable
Inputs (Level 3)
$
Notes payable 12 76,932 - 76,932 -
The fair value of notes payable is determined by calculating the present value of future payments using observablebenchmark interest rates and credit spreads for debt with similar characteristics and maturities.
17. FINANCIAL INSTRUMENTS
Credit risk
Credit risk is the risk of financial loss to the Company if a counterparty to a financial instrument fails to meet itscontractual obligation. Financial instruments that subject the Company to credit risk consist primarily of cash andcash equivalents, cash in escrow, trade and other receivables, investments held for self-insured liabilities, holdbackson long-term contracts, and indemnifications.
The Company’s maximum amount of credit risk exposure is limited to the carrying amount of these financialinstruments, which, at June 30, 2017, was $1,180,702,000 (December 31, 2016 – $1,203,532,000).
The Company limits its exposure to credit risk by placing its cash and cash equivalents in and entering into derivativeagreements with high-quality credit institutions. Investments held for self-insured liabilities include corporate bonds,equities, and term deposits. The Company believes the risk associated with corporate bonds, equities, and termdeposits is mitigated by the overall quality and mix of the Company’s investment portfolio.
Notes to the Unaudited Interim Condensed Consolidated Financial Statements June 30, 2017 F-23 Stantec Inc.
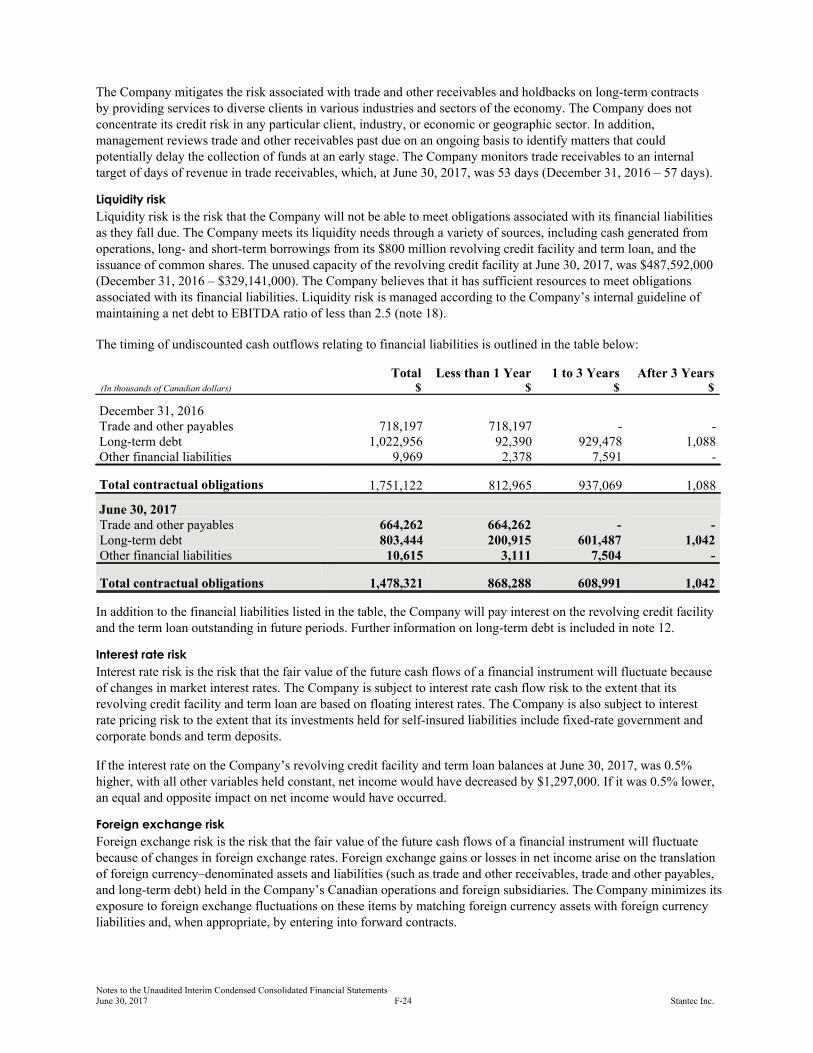
The Company mitigates the risk associated with trade and other receivables and holdbacks on long-term contracts by providing services to diverse clients in various industries and sectors of the economy. The Company does notconcentrate its credit risk in any particular client, industry, or economic or geographic sector. In addition,management reviews trade and other receivables past due on an ongoing basis to identify matters that couldpotentially delay the collection of funds at an early stage. The Company monitors trade receivables to an internaltarget of days of revenue in trade receivables, which, at June 30, 2017, was 53 days (December 31, 2016 – 57 days).
Liquidity risk
Liquidity risk is the risk that the Company will not be able to meet obligations associated with its financial liabilitiesas they fall due. The Company meets its liquidity needs through a variety of sources, including cash generated fromoperations, long- and short-term borrowings from its $800 million revolving credit facility and term loan, and theissuance of common shares. The unused capacity of the revolving credit facility at June 30, 2017, was $487,592,000(December 31, 2016 – $329,141,000). The Company believes that it has sufficient resources to meet obligationsassociated with its financial liabilities. Liquidity risk is managed according to the Company’s internal guideline ofmaintaining a net debt to EBITDA ratio of less than 2.5 (note 18).
The timing of undiscounted cash outflows relating to financial liabilities is outlined in the table below:
Total Less than 1 Year 1 to 3 Years After 3 Years(In thousands of Canadian dollars) $ $ $ $
December 31, 2016Trade and other payables 718,197 718,197 - -Long-term debt 1,022,956 92,390 929,478 1,088Other financial liabilities 9,969 2,378 7,591 -
Total contractual obligations 1,751,122 812,965 937,069 1,088
June 30, 2017Trade and other payables 664,262 664,262 - -Long-term debt 803,444 200,915 601,487 1,042Other financial liabilities 10,615 3,111 7,504 -
Total contractual obligations 1,478,321 868,288 608,991 1,042
In addition to the financial liabilities listed in the table, the Company will pay interest on the revolving credit facilityand the term loan outstanding in future periods. Further information on long-term debt is included in note 12.
Interest rate risk
Interest rate risk is the risk that the fair value of the future cash flows of a financial instrument will fluctuate becauseof changes in market interest rates. The Company is subject to interest rate cash flow risk to the extent that itsrevolving credit facility and term loan are based on floating interest rates. The Company is also subject to interest rate pricing risk to the extent that its investments held for self-insured liabilities include fixed-rate government andcorporate bonds and term deposits.
If the interest rate on the Company’s revolving credit facility and term loan balances at June 30, 2017, was 0.5%higher, with all other variables held constant, net income would have decreased by $1,297,000. If it was 0.5% lower,an equal and opposite impact on net income would have occurred.
Foreign exchange risk
Foreign exchange risk is the risk that the fair value of the future cash flows of a financial instrument will fluctuatebecause of changes in foreign exchange rates. Foreign exchange gains or losses in net income arise on the translationof foreign currency–denominated assets and liabilities (such as trade and other receivables, trade and other payables,and long-term debt) held in the Company’s Canadian operations and foreign subsidiaries. The Company minimizes itsexposure to foreign exchange fluctuations on these items by matching foreign currency assets with foreign currencyliabilities and, when appropriate, by entering into forward contracts.
Notes to the Unaudited Interim Condensed Consolidated Financial Statements June 30, 2017 F-24 Stantec Inc.
If exchange rates were 1.0% lower at June 30, 2017, with all other variables held constant, net income would haveincreased by $34,000. If they were 1.0% higher, an equal and opposite impact on net income would have occurred.
Foreign exchange fluctuations may also arise on the translation of the Company’s US-based subsidiaries or otherforeign subsidiaries, where the functional currency is different from the Canadian dollar, and are recorded in othercomprehensive income (loss). The Company does not hedge for this foreign exchange risk.
Price risk
The Company’s investments held for self-insured liabilities are exposed to price risk arising from changes in themarket values of the equity funds. This risk is mitigated because the portfolio of equity funds is monitored regularlyand is appropriately diversified.
A 1.0% increase in equity prices at June 30, 2017, would have increased the Company’s comprehensive income by$325,000. A 1.0% decrease would have had an equal and opposite impact on comprehensive income.
18. CAPITAL MANAGEMENT
The Company’s objective when managing capital is to provide sufficient capacity to cover normal operating andcapital expenditures, acquisition growth, and payment of dividends, while maintaining an adequate return forshareholders. The Company defines its capital as the aggregate of long-term debt (including the current portion) and shareholders’ equity.
The Company manages its capital structure to maintain the flexibility to adjust to changes in economic conditions andacquisition growth and to respond to interest rate, foreign exchange, credit, and other risks. To maintain or adjust itscapital structure, the Company may purchase shares for cancellation pursuant to Normal Course Issuer Bids, issuenew shares, or raise or retire debt.
The Company periodically monitors capital by maintaining a net debt to EBITDA ratio below 2.5. This target isestablished annually and monitored quarterly, and is the same target as in 2016.
Net debt to EBITDA ratio, a non-IFRS measure, is calculated as the sum of (1) long-term debt, including currentportion, plus bank indebtedness, less cash and cash equivalents and cash in escrow, divided by (2) EBITDA,calculated as income before income taxes, net interest expense, amortization of intangible assets, depreciation ofproperty and equipment, and goodwill and intangible asset impairment. The Company’s net debt to EBITDA ratio atJune 30, 2017, was 1.34 (December 31, 2016 – 2.38), calculated on a trailing four-quarter basis. Going forward, theremay be occasions when the Company exceeds its target by completing acquisitions that increase its debt level abovethe target for a period of time.
The Company is subject to restrictive covenants related to its Credit Facilities (measured quarterly). These covenantsinclude, but are not limited to, a leverage ratio and an interest coverage ratio (non-IFRS measures). The leverage ratiois calculated as consolidated debt to EBITDA, and the interest coverage ratio is calculated as EBITDA to interestexpense. Failure to meet the terms of one or more of these covenants may constitute a default, potentially resulting inaccelerating the repayment of the debt obligation.
The Company was in compliance with the covenants under these agreements as at and throughout the six monthsended June 30, 2017.
Notes to the Unaudited Interim Condensed Consolidated Financial Statements June 30, 2017 F-25 Stantec Inc.
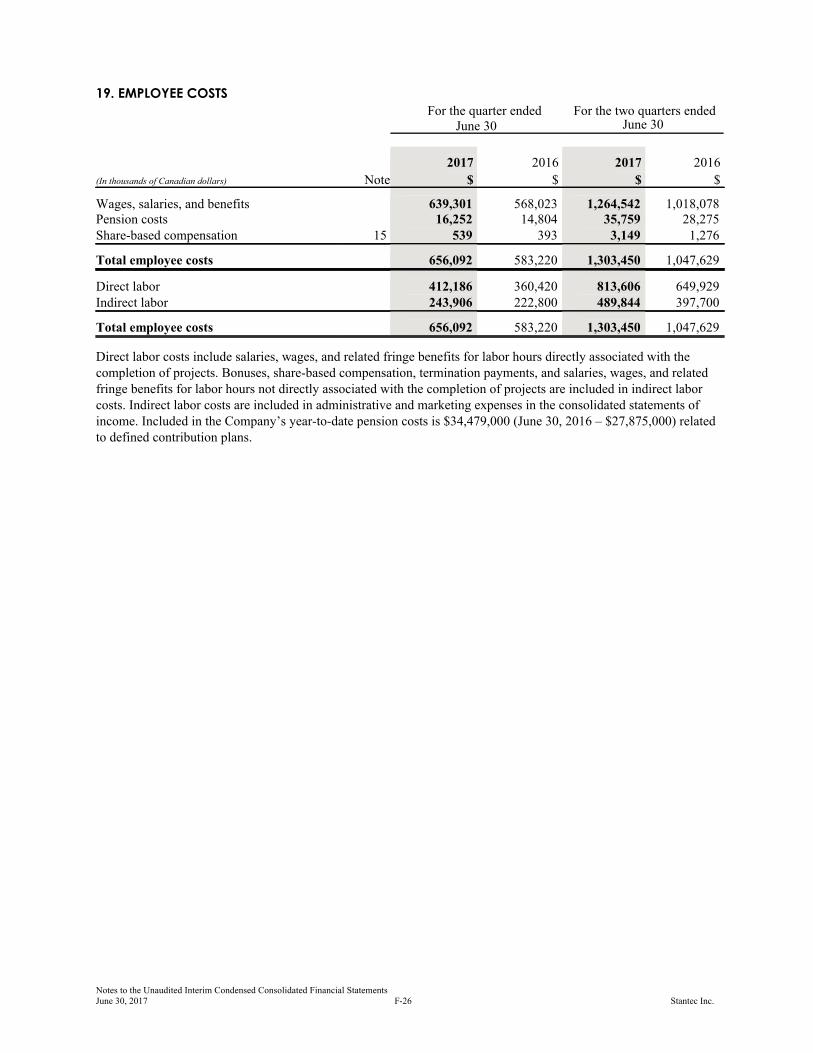
19. EMPLOYEE COSTS
For the quarter ended For the two quarters endedJune 30 June 30
2017 2016 2017 2016
(In thousands of Canadian dollars) Note $ $ $ $
Wages, salaries, and benefits 639,301 568,023 1,264,542 1,018,078Pension costs 16,252 14,804 35,759 28,275Share-based compensation 15 539 393 3,149 1,276
Total employee costs 656,092 583,220 1,303,450 1,047,629
Direct labor 412,186 360,420 813,606 649,929Indirect labor 243,906 222,800 489,844 397,700
Total employee costs 656,092 583,220 1,303,450 1,047,629
Direct labor costs include salaries, wages, and related fringe benefits for labor hours directly associated with thecompletion of projects. Bonuses, share-based compensation, termination payments, and salaries, wages, and relatedfringe benefits for labor hours not directly associated with the completion of projects are included in indirect laborcosts. Indirect labor costs are included in administrative and marketing expenses in the consolidated statements ofincome. Included in the Company’s year-to-date pension costs is $34,479,000 (June 30, 2016 – $27,875,000) relatedto defined contribution plans.
Notes to the Unaudited Interim Condensed Consolidated Financial Statements June 30, 2017 F-26 Stantec Inc.
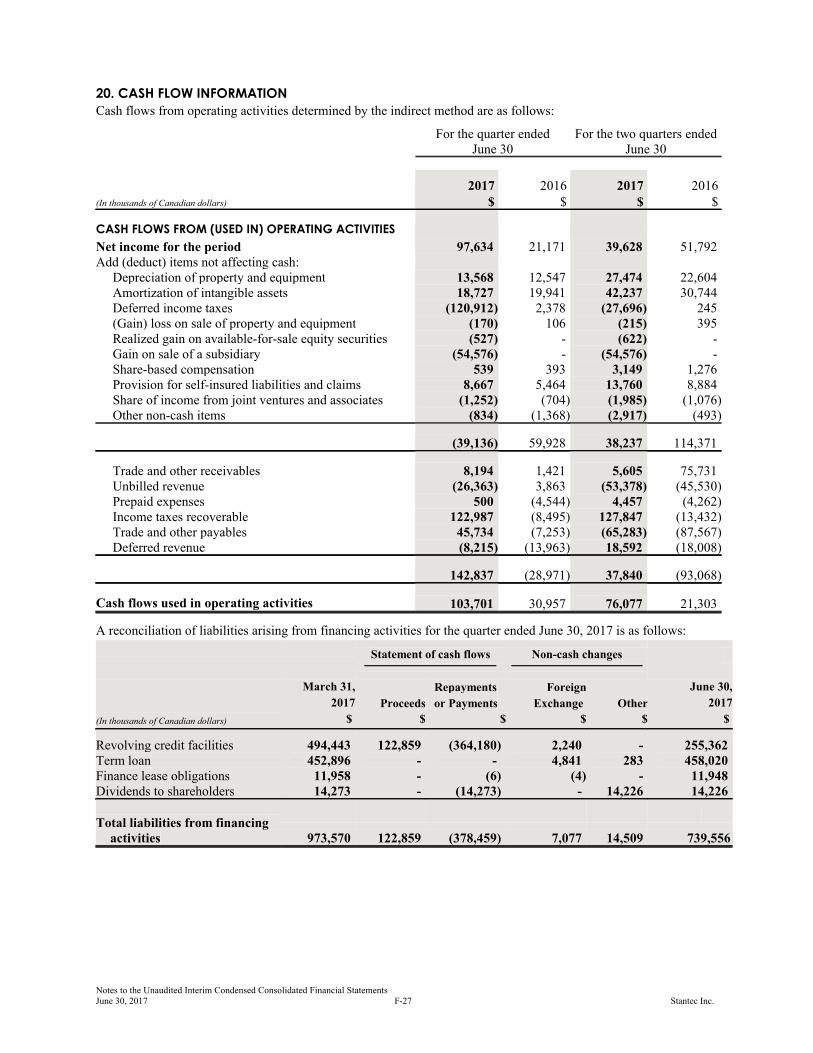
20. CASH FLOW INFORMATION
Cash flows from operating activities determined by the indirect method are as follows:
For the quarter ended For the two quarters endedJune 30 June 30
2017 2016 2017 2016(In thousands of Canadian dollars) $ $ $ $
CASH FLOWS FROM (USED IN) OPERATING ACTIVITIES
Net income for the period 97,634 21,171 39,628 51,792Add (deduct) items not affecting cash: Depreciation of property and equipment 13,568 12,547 27,474 22,604 Amortization of intangible assets 18,727 19,941 42,237 30,744 Deferred income taxes (120,912) 2,378 (27,696) 245 (Gain) loss on sale of property and equipment (170) 106 (215) 395 Realized gain on available-for-sale equity securities (527) - (622) - Gain on sale of a subsidiary (54,576) - (54,576) - Share-based compensation 539 393 3,149 1,276 Provision for self-insured liabilities and claims 8,667 5,464 13,760 8,884 Share of income from joint ventures and associates (1,252) (704) (1,985) (1,076) Other non-cash items (834) (1,368) (2,917) (493)
(39,136) 59,928 38,237 114,371
Trade and other receivables 8,194 1,421 5,605 75,731 Unbilled revenue (26,363) 3,863 (53,378) (45,530) Prepaid expenses 500 (4,544) 4,457 (4,262) Income taxes recoverable 122,987 (8,495) 127,847 (13,432) Trade and other payables 45,734 (7,253) (65,283) (87,567) Deferred revenue (8,215) (13,963) 18,592 (18,008)
142,837 (28,971) 37,840 (93,068)
Cash flows used in operating activities 103,701 30,957 76,077 21,303
A reconciliation of liabilities arising from financing activities for the quarter ended June 30, 2017 is as follows:
Statement of cash flows Non-cash changes
(In thousands of Canadian dollars)
March 31,
2017
$
Proceeds
$
Repayments
or Payments
$
Foreign
Exchange
$
Other
$
June 30,
2017
$
Revolving credit facilities 494,443 122,859 (364,180) 2,240 - 255,362Term loan 452,896 - - 4,841 283 458,020Finance lease obligations 11,958 - (6) (4) - 11,948Dividends to shareholders 14,273 - (14,273) - 14,226 14,226
Total liabilities from financingactivities 973,570 122,859 (378,459) 7,077 14,509
739,556
Notes to the Unaudited Interim Condensed Consolidated Financial Statements June 30, 2017 F-27 Stantec Inc.
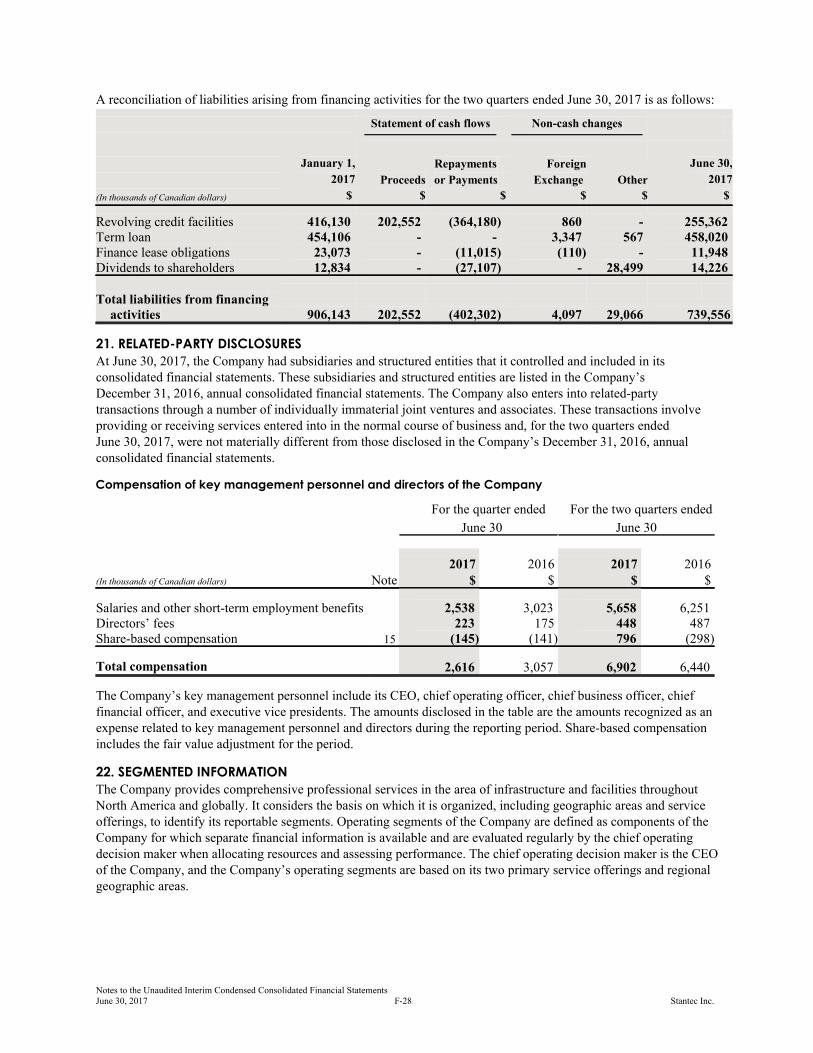
A reconciliation of liabilities arising from financing activities for the two quarters ended June 30, 2017 is as follows:
Statement of cash flows Non-cash changes
(In thousands of Canadian dollars)
January 1,
2017
$
Proceeds
$
Repayments
or Payments
$
Foreign
Exchange
$
Other
$
June 30,
2017
$
Revolving credit facilities 416,130 202,552 (364,180) 860 - 255,362Term loan 454,106 - - 3,347 567 458,020Finance lease obligations 23,073 - (11,015) (110) - 11,948Dividends to shareholders 12,834 - (27,107) - 28,499 14,226
Total liabilities from financingactivities 906,143 202,552 (402,302) 4,097 29,066
739,556
21. RELATED-PARTY DISCLOSURES
At June 30, 2017, the Company had subsidiaries and structured entities that it controlled and included in itsconsolidated financial statements. These subsidiaries and structured entities are listed in the Company’s December 31, 2016, annual consolidated financial statements. The Company also enters into related-partytransactions through a number of individually immaterial joint ventures and associates. These transactions involveproviding or receiving services entered into in the normal course of business and, for the two quarters ended June 30, 2017, were not materially different from those disclosed in the Company’s December 31, 2016, annualconsolidated financial statements.
Compensation of key management personnel and directors of the Company
For the quarter ended For the two quarters ended
June 30 June 30
2017 2016 2017 2016(In thousands of Canadian dollars) Note $ $ $ $
Salaries and other short-term employment benefits 2,538 3,023 5,658 6,251Directors’ fees 223 175 448 487Share-based compensation 15 (145) (141) 796 (298)
Total compensation 2,616 3,057 6,902 6,440
The Company’s key management personnel include its CEO, chief operating officer, chief business officer, chieffinancial officer, and executive vice presidents. The amounts disclosed in the table are the amounts recognized as anexpense related to key management personnel and directors during the reporting period. Share-based compensationincludes the fair value adjustment for the period.
22. SEGMENTED INFORMATION
The Company provides comprehensive professional services in the area of infrastructure and facilities throughoutNorth America and globally. It considers the basis on which it is organized, including geographic areas and serviceofferings, to identify its reportable segments. Operating segments of the Company are defined as components of theCompany for which separate financial information is available and are evaluated regularly by the chief operatingdecision maker when allocating resources and assessing performance. The chief operating decision maker is the CEOof the Company, and the Company’s operating segments are based on its two primary service offerings and regionalgeographic areas.
Notes to the Unaudited Interim Condensed Consolidated Financial Statements June 30, 2017 F-28 Stantec Inc.
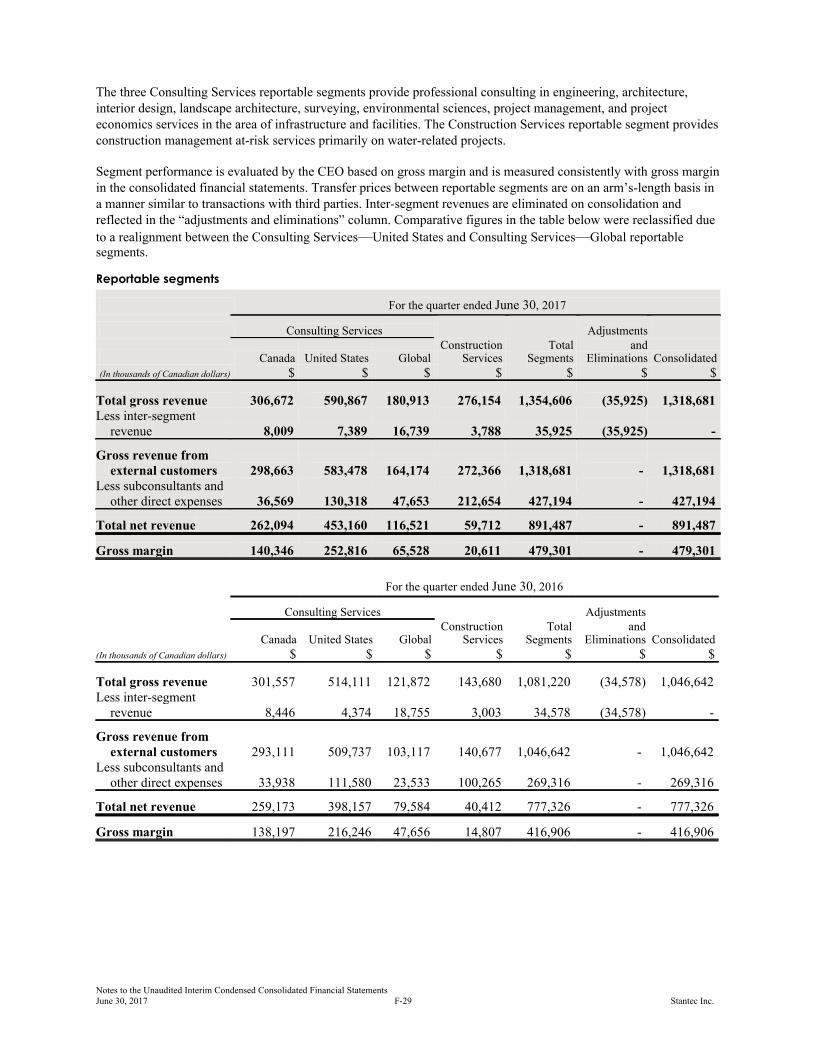
The three Consulting Services reportable segments provide professional consulting in engineering, architecture,interior design, landscape architecture, surveying, environmental sciences, project management, and projecteconomics services in the area of infrastructure and facilities. The Construction Services reportable segment providesconstruction management at-risk services primarily on water-related projects.
Segment performance is evaluated by the CEO based on gross margin and is measured consistently with gross marginin the consolidated financial statements. Transfer prices between reportable segments are on an arm’s-length basis ina manner similar to transactions with third parties. Inter-segment revenues are eliminated on consolidation andreflected in the “adjustments and eliminations” column. Comparative figures in the table below were reclassified due
to a realignment between the Consulting Services—United States and Consulting Services—Global reportablesegments.
Reportable segments
For the quarter ended June 30, 2017
Consulting Services Adjustments
Canada United States Global Construction
Services Total
Segments andEliminations Consolidated
(In thousands of Canadian dollars) $ $ $ $ $ $ $
Total gross revenue 306,672 590,867 180,913 276,154 1,354,606 (35,925) 1,318,681Less inter-segment
revenue 8,009 7,389 16,739 3,788 35,925 (35,925) -
Gross revenue fromexternal customers 298,663 583,478 164,174 272,366 1,318,681 - 1,318,681
Less subconsultants andother direct expenses 36,569 130,318 47,653 212,654 427,194 - 427,194
Total net revenue 262,094 453,160 116,521 59,712 891,487 - 891,487
Gross margin 140,346 252,816 65,528 20,611 479,301 - 479,301
For the quarter ended June 30, 2016
Consulting Services Adjustments
Canada United States Global Construction
Services Total
Segments andEliminations Consolidated
(In thousands of Canadian dollars) $ $ $ $ $ $ $
Total gross revenue 301,557 514,111 121,872 143,680 1,081,220 (34,578) 1,046,642Less inter-segment
revenue 8,446 4,374 18,755 3,003 34,578 (34,578) -
Gross revenue fromexternal customers 293,111 509,737 103,117 140,677 1,046,642 - 1,046,642
Less subconsultants andother direct expenses 33,938 111,580 23,533 100,265 269,316 - 269,316
Total net revenue 259,173 398,157 79,584 40,412 777,326 - 777,326
Gross margin 138,197 216,246 47,656 14,807 416,906 - 416,906
Notes to the Unaudited Interim Condensed Consolidated Financial Statements June 30, 2017 F-29 Stantec Inc.
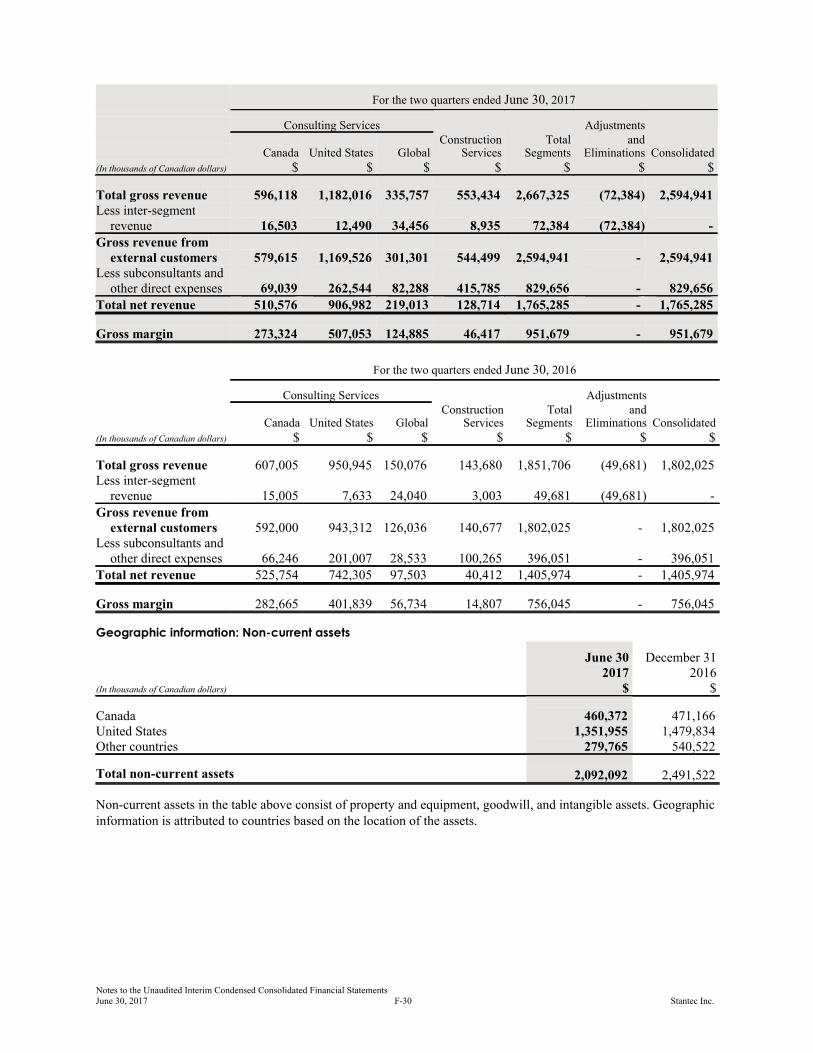
For the two quarters ended June 30, 2017
Consulting Services Adjustments
Canada United States Global Construction
Services Total
Segments andEliminations Consolidated
(In thousands of Canadian dollars) $ $ $ $ $ $ $
Total gross revenue 596,118 1,182,016 335,757 553,434 2,667,325 (72,384) 2,594,941Less inter-segment
revenue 16,503 12,490 34,456 8,935 72,384 (72,384) -
Gross revenue fromexternal customers 579,615 1,169,526 301,301 544,499 2,594,941 - 2,594,941
Less subconsultants andother direct expenses 69,039 262,544 82,288 415,785 829,656 - 829,656
Total net revenue 510,576 906,982 219,013 128,714 1,765,285 - 1,765,285
Gross margin 273,324 507,053 124,885 46,417 951,679 - 951,679
For the two quarters ended June 30, 2016
Consulting Services Adjustments
Canada United States Global Construction
Services Total
Segments andEliminations Consolidated
(In thousands of Canadian dollars) $ $ $ $ $ $ $
Total gross revenue 607,005 950,945 150,076 143,680 1,851,706 (49,681) 1,802,025Less inter-segment
revenue 15,005 7,633 24,040 3,003 49,681 (49,681) -
Gross revenue fromexternal customers 592,000 943,312 126,036 140,677 1,802,025 - 1,802,025
Less subconsultants andother direct expenses 66,246 201,007 28,533 100,265 396,051 - 396,051
Total net revenue 525,754 742,305 97,503 40,412 1,405,974 - 1,405,974
Gross margin 282,665 401,839 56,734 14,807 756,045 - 756,045
Geographic information: Non-current assets
June 30 December 312017 2016
(In thousands of Canadian dollars) $ $
Canada 460,372 471,166United States 1,351,955 1,479,834Other countries 279,765 540,522
Total non-current assets 2,092,092 2,491,522
Non-current assets in the table above consist of property and equipment, goodwill, and intangible assets. Geographicinformation is attributed to countries based on the location of the assets.
Notes to the Unaudited Interim Condensed Consolidated Financial Statements June 30, 2017 F-30 Stantec Inc.
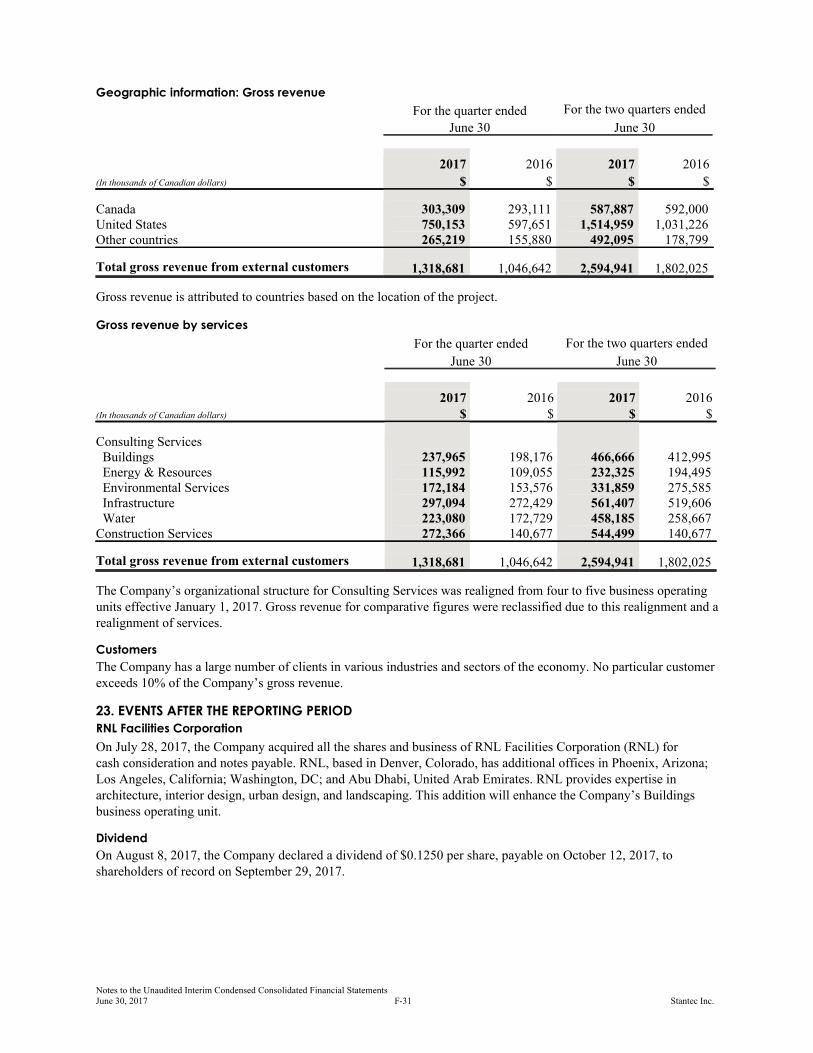
Geographic information: Gross revenue
For the quarter ended For the two quarters ended
June 30 June 30
2017 2016 2017 2016
(In thousands of Canadian dollars) $ $ $ $
Canada 303,309 293,111 587,887 592,000United States 750,153 597,651 1,514,959 1,031,226Other countries 265,219 155,880 492,095 178,799
Total gross revenue from external customers 1,318,681 1,046,642 2,594,941 1,802,025
Gross revenue is attributed to countries based on the location of the project.
Gross revenue by services
For the quarter ended For the two quarters ended
June 30 June 30
2017 2016 2017 2016(In thousands of Canadian dollars) $ $ $ $
Consulting Services Buildings 237,965 198,176 466,666 412,995 Energy & Resources 115,992 109,055 232,325 194,495 Environmental Services 172,184 153,576 331,859 275,585 Infrastructure 297,094 272,429 561,407 519,606 Water 223,080 172,729 458,185 258,667Construction Services 272,366 140,677 544,499 140,677
Total gross revenue from external customers 1,318,681 1,046,642 2,594,941 1,802,025
The Company’s organizational structure for Consulting Services was realigned from four to five business operatingunits effective January 1, 2017. Gross revenue for comparative figures were reclassified due to this realignment and arealignment of services.
Customers
The Company has a large number of clients in various industries and sectors of the economy. No particular customerexceeds 10% of the Company’s gross revenue.
23. EVENTS AFTER THE REPORTING PERIOD
RNL Facilities Corporation
On July 28, 2017, the Company acquired all the shares and business of RNL Facilities Corporation (RNL) for cash consideration and notes payable. RNL, based in Denver, Colorado, has additional offices in Phoenix, Arizona;Los Angeles, California; Washington, DC; and Abu Dhabi, United Arab Emirates. RNL provides expertise inarchitecture, interior design, urban design, and landscaping. This addition will enhance the Company’s Buildingsbusiness operating unit.
Dividend
On August 8, 2017, the Company declared a dividend of $0.1250 per share, payable on October 12, 2017, toshareholders of record on September 29, 2017.
Notes to the Unaudited Interim Condensed Consolidated Financial Statements June 30, 2017 F-31 Stantec Inc.
Head Office 200, 10160 – 112 Street Edmonton, Alberta T5K 2L6 Canada
Ph: (780) 917-7000 Fx: (780) 917-7330 [email protected]
Transfer Agent Computershare Calgary, Alberta
Auditor Ernst & Young LLP Chartered Professional Accountants Edmonton, Alberta
Principal Bank Canadian Imperial Bank of Commerce
Securities Exchange Listing Stantec shares are listed on the Toronto Stock Exchange and the New York Stock Exchange under the symbol STN.
Shareholder Information