Interim Financial Report - Home –...
66
Interim Financial Report Half Year ended June 30, 2014
Transcript of Interim Financial Report - Home –...

Interim Management Report 1
Interim Financial ReportHalf Year ended June 30, 2014

2 Interim Management Report
Table of contents
Interim management reportCompany overview ________________________________________________________________ 3Message from the Chairman and CEO __________________________________________________ 4Business overview _________________________________________________________________ 5Recent developments ______________________________________________________________ 30Corporate governance _____________________________________________________________ 33Cautionary statement regarding forward-looking statements ______________________________ 35Chief executive officer and chief financial officer’s responsibility statement ___________________ 36
Financial statementsCondensed consolidated financial statements for the six months ended June 30, 2014Condensed consolidated statements of financial position _________________________________ 37Condensed consolidated statements of operations _______________________________________ 38Condensed consolidated statements of other comprehensive income _______________________ 39Condensed consolidated statements of changes in equity _________________________________ 40Condensed consolidated statements of cash flows _______________________________________ 41Notes to the condensed consolidated financial statements ________________________________ 42
Report of the réviseur d’entreprises agréé - interim financial statements ____________________ 59
Recast explanatory information_______________________________________________________ 60
Updated disclosure of segment and geographic information included in note 27 to the consolidated financial statements for the year ended December 31, 2013 ____________________________________ 61
Report of the réviseur d’entreprises agréé on the updated disclosure of segment and geographic information _______________________________________________________________________ 65
2

Interim Management Report 3
Company overview
Company overview ArcelorMittal including its subsidiaries (“ArcelorMittal” or the “Company”) is the world’s leading integrated steel and mining company, with annual achievable production capacity of approximately 119 million tonnes of crude steel. ArcelorMittal had sales of $40.5 billion, steel shipments of 42.4 million tonnes, crude steel production of 46.1 million tonnes, iron ore production from own mines of 31.4 million tonnes and coal production from own mines of 3.6 million tonnes in the six months ended June 30, 2014 as compared to sales of $39.9 billion, steel shipments of 41.4 million tonnes, crude steel production of 44.9 million tonnes, iron ore production from own mines of 28.1 million tonnes and coal production from own mines of 4.0 million tonnes in the six months ended June 30, 2013. The Company had sales of $79.4 billion, steel shipments of 82.6 million tonnes, crude steel production of 91.2 million tonnes, iron ore production from own mines of 58.4 million tonnes and coal production from own mines of 8.0 million tonnes for the year ended December 31, 2013. As of June 30, 2014, ArcelorMittal had approximately 230,000 employees.
ArcelorMittal has steel-making operations in 20 countries on four continents, including 57 integrated, mini-mill and integrated mini-mill steel-making facilities. ArcelorMittal is the largest steel producer in North and South America, Europe and Africa, a significant steel producer
in the Commonwealth of Independent States (“CIS”) region and has a growing presence in Asia, including investments in China and India. ArcelorMittal produces a broad range of high-quality steel finished and semi-finished products. Specifically, ArcelorMittal produces flat steel products, including sheet and plate, long steel products, including bars, rods and structural shapes. ArcelorMittal also produces pipes and tubes for various applications. ArcelorMittal sells its steel products primarily in local markets and through its centralized marketing organization to a diverse range of customers in over 170 countries including the automotive, appliance, engineering, construction and machinery industries.
ArcelorMittal has a global portfolio of 16 operating units with mines in operation and development and is among the largest iron ore producers in the world. The Company currently has iron ore mining activities in Algeria, Brazil, Bosnia, Canada, Kazakhstan, Liberia, Mexico, Ukraine and the United States and has projects under development or prospective development in Canada and India. The Company currently has coal mining activities in Kazakhstan, Russia and the United States. The Company also produces various types of mining products including iron ore lump, fines, concentrate and sinter feed, as well as coking coal, Pulverized Coal Injection (“PCI”) and thermal coal.
Corporate and other informationArcelorMittal is a public limited liability company (société anonyme) that was incorporated for an unlimited period under the laws of the Grand Duchy of Luxembourg on June 8, 2001. ArcelorMittal is registered with the Luxembourg Register of Commerce and Companies (Registre du Commerce et des Sociétés) under number B 82.454.
Individual investors who have any questions or document requests may contact: [email protected].
Institutional investors who have any questions or document requests may contact: [email protected].
The mailing address and telephone number of ArcelorMittal’s registered office are: ArcelorMittal, 19, avenue de la Liberté, L-2930 Luxembourg, Grand Duchy of Luxembourg, telephone: +352 4792-3746.
ArcelorMittal’s agent for U.S. federal securities law purposes is ArcelorMittal USA LLC, 1 South Dearborn Street, 19th Floor, Chicago, Illinois 60603, United States of America, telephone +1 312-899-3985.

4 Interim Management Report
Dear Shareholders,
The first six months of 2014 have been a period of steady progress as the global economic recovery takes hold in our most important markets. Growth in demand for steel has been particularly encouraging in Europe and in the United States after several years of contraction. Demand growth in China has eased to a level that can be sustained in the medium to long-term.
EBITDA for the first half of 2014 was $3.5 billion, an increase of 7.7 percent over the first six months of 2013, reflecting an improvement in trading conditions and efficiency gains.
During the first half, the Company entered into a 50/50 joint venture partnership with Nippon Steel & Sumitomo Metal Corporation (“NSSMC”) to acquire ThyssenKrupp Steel USA in Calvert, Alabama, for $1.55 billion. The acquisition means we
now own, together with NSSMC, the most modern steel finishing facility in the world, which will allow us to meet rising demand for steel in the automotive, energy and other important NAFTA markets.
In June, Valin ArcelorMittal Automotive Steel Co (“VAMA”), a joint venture between the Company and Hunan Iron & Steel Co., inaugurated its newest advanced automotive steel plant in Loudi, Hunan Province, China close to Lianyuan, one of the most important automotive clusters in the country. The plant will produce high-strength automotive steel which has been historically imported for the Chinese market, the world’s largest and fastest growing market for cars. VAMA’s customers will be global brands such as Volkswagen, GM, Ford and Toyota as well as domestic manufacturers.
Looking ahead, we are confident that we are well placed to benefit from the continued economic recovery in our core markets while continuing to maintain a tight grip on costs and further operational improvements.
Lakshmi N. Mittal Chairman and CEO
Message from the Chairman and CEO
Interim Management Report 5
Business overview
The following discussion and analysis should be read in conjunction with ArcelorMittal’s consolidated financial statements and related notes appearing in its Annual Report for the year ended December 31, 2013 and the unaudited condensed consolidated financial statements for the six months ended June 30, 2014 included in this report.
Key factors affecting results of operationsThe steel industry, and the iron ore and coal mining industries, which provide its principal raw materials, have historically been highly cyclical. They are significantly affected by general economic conditions, as well as worldwide production capacity and fluctuations in international steel trade and tariffs. In particular, this is due to the cyclical nature of the automotive, construction, machinery and equipment and transportation industries that are the principal customers of steel. After a period of continuous growth between 2004 and 2008, the sharp fall in demand resulting from the global economic crisis demonstrated the steel market’s vulnerability to volatility and sharp corrections. The last quarter of 2008 and the first half of 2009 were characterized by a deep slump in demand, as consumers used up existing inventories rather than buying new stock. The iron ore and steel market began a gradual recovery in the second half of 2009 that continued in most countries through 2010 and in the first three quarters of 2011, in line with global economic activity. The subsequent onset of the Eurozone crisis and significant destocking caused demand to weaken during the fourth quarter of 2011. Similarly, 2012 was again characterized by early optimism and restocking but contraction in Europe and a slowdown in China caused iron ore prices to fall as did then both steel prices and margins. Global demand excluding China (ex-China) was subsequently
impacted by more destocking, and, for the first time since 2009, global ex-China steel demand experienced a decline year-on-year during the fourth quarter of 2012. In Europe, after a significant decline in steel demand during 2012, there was continued weakness in demand, particularly in the first half of 2013, which led to a further, albeit mild, decrease in demand in 2013 to levels more than 30% below the 2007 peak. Steel demand in North America also declined slightly in 2013, compared to the robust level of demand experienced during 2012, reflecting a weaker first half of the year and a strong second half due to stronger underlying demand and a turning of the inventory cycle. In comparison, demand in China has experienced different dynamics, with a slowdown in demand taking place in the first half of 2012 in response to policy tightening directed principally toward the real estate market. This was followed by a significant increase in demand beginning in the fourth quarter of 2012 that continued through 2013 as a result of an acceleration in infrastructure approvals and an increase in newly started construction. Despite some renewed weakness in demand during the fourth quarter of 2013, China experienced a 6.9% increase in steel demand in 2013 and was largely responsible for the overall 3.7% increase in global steel demand in 2013. During the first half of 2014, Chinese steel demand growth slowed to only 2.6% year-on-year, impacted by renewed weakness in the real estate market. In contrast, steel demand in the developed markets of North America and Europe, which account for a majority of ArcelorMittal deliveries, rebounded during the first half of 2014. Overall global demand ex-China is estimated to have grown over 3% year-on-year through the first half of 2014, while it was up only 1.1% year-on-year in 2013.
ArcelorMittal’s sales are predominantly derived from the sale of flat steel products, long steel products, and tubular products as well as of iron ore and coal. Prices of steel products, iron ore and coal, in general, are sensitive to changes in worldwide and regional demand, which, in turn, are affected by worldwide and country-specific economic conditions and available production capacity.
Unlike many commodities, steel is not completely fungible due to wide differences in shape, chemical composition, quality, specifications and application, all of which affect sales prices. Accordingly, there is still limited exchange trading of steel or uniform pricing, whereas there is increasing trading of steel raw materials, particularly iron ore. Commodity spot prices may vary, and therefore sales prices from exports fluctuate as a function of the worldwide balance of supply and demand at the time sales are made. ArcelorMittal’s sales are made on the basis of shorter-term purchase orders as well as some longer-term contracts to some industrial customers, particularly in the automotive industry. Sales of iron ore to external parties continued to increase in 2013, rising to 11.6 million tonnes for the year. Sales of iron ore to external parties amounted to 6.7 million tonnes in the first half of 2014. Steel price surcharges are often implemented on steel sold pursuant to long-term contracts in order to recover increases in input costs. However, spot market steel, iron ore and coal prices and short-term contracts are more driven by market conditions.
One of the principal factors affecting the Company’s operating profitability is the relationship between raw material prices and steel selling prices. Profitability depends in part on the extent to which steel selling prices exceed raw material prices, and, in particular,
the extent to which changes in raw material prices are passed through to steel selling prices. Complicating factors include the extent of the time lag between (a) the raw material price change and the steel selling price change and (b) the date of the raw material purchase and the actual sale of the steel product in which the raw material was used (average cost basis). In recent periods, steel selling prices have tended to react quickly to changes in raw material prices, due in part to the tendency of distributors to increase purchases of steel products early in a rising cycle of raw material prices and to hold back from purchasing as raw material prices decline. With respect to (b), as average cost basis is used to determine the cost of the raw materials incorporated, inventories must first be worked through before a decrease in raw material prices translates into decreased operating costs. In some of ArcelorMittal’s segments, in particular Europe and NAFTA, there are several months between raw material purchases and sales of steel products incorporating those materials. Although this lag has been reduced recently by changes to the timing of pricing adjustments in iron ore contracts, it cannot be eliminated and exposes these segments’ margins to changes in steel selling prices in the interim (known as a “price-cost squeeze”). In addition, decreases in steel prices may outstrip decreases in raw material costs in absolute terms, as occurred for example in the fourth quarter of 2008, the first half of 2009, the third quarter of 2012 and the second quarter of 2013.
Given this overall dynamic, the Company’s operating profitability has been particularly sensitive to fluctuations in raw material prices, which have become more volatile since the iron ore industry moved away from annual benchmark pricing to quarterly pricing in 2010. In the second half
6 Interim Management Report
of 2009 and the first half of 2010, steel selling prices followed raw material prices higher, resulting in higher operating income as the Company benefitted from higher prices while still working through relatively lower-cost raw materials inventories acquired in 2009. This was followed by a price-cost squeeze in the second half of 2010, as steel prices retreated but the Company continued to work through higher-priced raw material stocks acquired during the first half of the year. Iron ore prices have experienced significant volatility over the past few years, for example falling over 30% in October 2011 and similarly, after averaging over $140 per tonne (/t) cost inclusive of freight (CFR) China during the first half of 2012, prices then fell below $90/t by early September 2012. Iron ore prices were relatively stable in 2013, averaging $135/t but have since fallen back to lows of $90-95/t in June 2014, averaging $120/t and $103/t during the first and second quarters of 2014, respectively. If iron ore and metallurgical coal markets continue to be volatile with steel prices following suit, overhangs of previously-acquired raw material inventories will continue to produce more volatile margins and operating results quarter-to-quarter. With respect to iron ore and coal supply, ArcelorMittal’s growth strategy in the mining business is an important natural hedge against raw material price volatility. Volatility on steel margins aside, the results of the Company’s mining segment are also directly impacted by iron ore prices, which were weaker in the first half of 2014, averaging $111/t. As the mining segment’s production and external sales grow, the Company’s exposure to the impact of iron ore price fluctuations also increases. This means, among other things, that any significant slowdown of Chinese steel production could have a significant negative impact on iron ore selling prices over the next few years.
Economic environment1
Global GDP growth picked up to 3.0% year-on-year in the final quarter of 2013 and has remained around that pace over in the first half of 2014, driven by advanced economies, despite some setbacks and relative weakness in many emerging markets. Global GDP growth had eased slightly to 2.5% in 2013, from 2.6% in 2012 and 3.1% in 2011.
GDP growth in the United States was 1.9% in 2013 and 2.8% in 2012, but bad weather, an inventory correction, and a widening of the trade deficit, contributed to a contraction in real GDP of 2.9% (annual rate) in the first quarter of 2014. Nonetheless, sector-specific fundamentals remain sound and most indicators suggest that economic activity has bounced back strongly in the second quarter, with estimates suggesting growth of 3.5 to 4% (annual rate). The clearest indication of the underlying strength of the economy is that during the first half of 2014 an average over 230,000 net new jobs were created per month. In the five months to May, construction spending increased by 8.1% year-on-year as underlying demand, rising incomes, improving confidence supported residential construction in particular. Having deleveraged significantly households have seen good access to credit, which has supported light vehicle sales averaging over 16 million units (annual rate) in the first half of 2014, the strongest for seven years even after the weak start to the year. US manufacturing output finally regained its pre-crisis level, increasing by 3% year-on-year in the first half of 2014. With the rebound in GDP growth and particularly the strengthening in the job market, the Federal Reserve has continued to taper its monthly asset purchases (part of its quantitative easing program), reducing its monthly asset purchases by a further $10 billion to $35 billion per month,
down from $85 billion at the end of 2013.
Driven by a strong recovery in the UK, European Union (EU) GDP has picked up over the first half of 2014, growing by around 1.4% year-on-year, after stagnating in 2013 (+0.2%) and falling by 0.3% in 2012. EU Passenger car registrations increased to an average of 12.4 million units (annual rate) in the first half of 2014, up from 11.9 million in 2013. The Eurozone economy is gradually recovering from recession as the acute risk of a crisis has eased; indicated by vulnerable countries’ bond yields reaching record lows. GDP growth in the second quarter is likely to have edged up, to around 0.3% quarter-on-quarter, from the 0.2% expansion achieved in the first quarter. Remaining above 50 the manufacturing Purchasing Managers’ Index (PMI) still indicates expansion, but eased to an average of 52.4 in the second quarter, down from the first-quarter average of 53.4. Germany and Spain built some positive momentum in the second quarter, whereas the pace of improvement ebbed slightly in France and Italy where less has been done to improve competitiveness. Relatively healthy consumer confidence (still at its second highest level since October 2007 in June) and very low consumer price inflation will underpin consumer spending. Nevertheless, credit conditions are still tight, unemployment remains elevated but is falling gradually, and private and public debt levels are still high. At the Eurozone level fiscal tightening amounted to 1.3% of GDP in 2013, and though the pace of consolidation is easing, several “core” countries (Belgium, France and Netherlands) now need to implement more ambitious cuts to meet European Commission deficit targets. The Eurozone faces the risk of deflation, with CPI inflation falling to 0.5% year-on-year in June. To address this risk, the European Central Bank (ECB) announced a
series of measures in June, cutting interest rates, boosting liquidity and encouraging bank lending, but banks may hesitate to expand their lending to the private sector until the ECB’s bank stress tests are completed later this year.
Much like 2013, GDP growth at the beginning of this year has been weak in emerging markets. First-quarter GDP growth in China came in at 7.4% year-on-year, a six-quarter low, but GDP growth has since picked up to 7.5% in the second quarter. The construction sector in China weakened in the first half of 2014, with residential construction starts falling by almost 20% year-on-year in the first half of the year, while property sales declined by 7.5% year-on-year in the second quarter. In response, some local governments have begun to relax restrictions on housing purchases and the central government has introduced stimulus measures, including faster deployment of public infrastructure projects and increased public housing construction. The central bank also lowered bank reserve requirements. Recent data show relatively steady growth rates for industrial production and fixed investment, while retail sales and export growth have picked up, suggesting that Chinese GDP growth stabilized in the second quarter. The Russian economy was looking weak, even before the invasion of Crimea and the crisis in Ukraine, which led to significant capital flight and has further discouraged investment. Several factors have converged to make the beginning of 2014 difficult for Brazilian industry: interest rate hikes, the end of tax exemptions on purchases of certain goods, and rising production costs. In contrast, economic prospects have improved in India as the incoming government has won a parliamentary majority in the lower house, which breaks the long run of coalition governments, and is expected
1 GDP and industrial production data and estimates sourced from IHS Global Insight July 15, 2014
Business overviewcontinued
Interim Management Report 7
to allow for significant economic reforms.
In line with economic growth, OECD industrial production picked up during 2013 and has continued to grow in the first half of 2014, increasing by an estimated 3.0% year-on-year. Growth continued to shift away from emerging markets towards the developed world in the first half of 2014. Industrial Production growth in non-OECD countries is estimated at 4.0% year-on-year in the first half of 2014, having eased back from 4.6% in the second half of 2013.
Despite weaker growth in China and declining iron ore and coal prices during the first half of 2014 global ex-China apparent steel consumption (ASC) is estimated to have grown by 3.2% over the same period in 2013. This is much stronger than the 1.1% growth in demand in the world ex-China during 2013 as apparent steel consumption is estimated to have grown by over 5% year-on-year in both Europe and the United States. Chinese ASC has in comparison decelerated during the first half of 2014 and is up only 2.4% year-on-year, following growth of almost 7% last year.
Steel production2
World crude steel production, which had bottomed in 2009 at 1.2 billion tonnes, recovered to just over 1.4 billion tonnes for the year 2010 (+15.8% year-on-year ) and rose in excess of 1.5 billion tonnes in 2011 (+7.3% year-on-year). There was a further rise to 1.56 billion tonnes in 2012 and 1.61 billion tonnes in 2013, driven by Chinese growth.
Steel output in China set another record in 2013, reaching 784 million tonnes (+7.3% higher than 2012), although output was slightly weaker during the second half of 2013 due to softening demand conditions. In the first half of 2013, Chinese output growth was also supported by the
strength of the real estate and construction sectors and by rising steel exports, up 10.2% year-on-year. Chinese output as a share of global production rose to a record 49.4% in 2013, up from 47.1% in 2012.
Global production increased by 3.1% to 1.61 billion tonnes during 2013 led by growth in Chinese production, as output ex-China remained unchanged at 828 million tonnes, about 29 million tonnes below the pre-crisis peak of 857 million tonnes recorded in 2007. Indeed the only regions to have grown in comparison to 2007 are the Middle East (60.2%) and Asia ex-China (12.8%), whereas output is down 10.2% in NAFTA, 21.1% in EU27, 4.6% in South America, 12.3% in CIS and 14.1% in Africa.
During the first half 2014, annualized global steel production increased by 2.5% to 1.65 billion tonnes mainly driven by Chinese production, which increased by 2.9% year-on-year. Global production outside of China has also improved during the first half of 2014 mainly due to a rebound in Europe and NAFTA. EU annualized output rose by 3.7% to 176 million tonnes reflecting strengthening industrial activity. In NAFTA, output increased by 1.7% during the first half of 2014 to an annualized rate of 119 million tonnes despite reduced utilization in the USA at the start of the year due to severe weather conditions. Production in Asia ex-China has also remained strong, particularly in South Korea, where annualized output increased by 9.1% year-on-year to 73 million tonnes in the first half of 2014. Over the same period, India recorded a 1.3% increase in crude steel production to 83 million tones annualized, whereas output in Japan also increased by 0.9% to 111 million tonnes annualized. Production faltered in South America, falling by 2.6% year-on-year to annualized output of 45 million tonnes; and in CIS, where annualized output decreased by
1.0% year-on-year 109 million tonnes.
Steel prices3
Steel prices in Northern Europe remained steady during the first quarter of 2014, relative to the fourth quarter of 2013, with spot hot rolled coil (“HRC”) prices around €445-455 ($610-620) /t. In Southern Europe, prices were also stable quarter on quarter with spot HRC prices around €425-440 ($585-610) /t. Expectations were for prices to increase during the quarter and some deals at €460 ($625) in Northern Europe were achieved in late February and early March 2014, but the price trend reversed by the end of the first quarter as lower raw material costs were incorporated into prices by foreign and domestic competitors.
Economic activity continued to recover in Europe during the second quarter of 2014 and overall steel demand saw a slight increase, but did not result in price increases. Spot HRC prices stabilized at €420-430 ($575-595)/t in Northern Europe and €410-420 ($565-575)/t in Southern Europe, despite falling raw material costs as import prices remained relatively unattractive.
In the United States, steel prices during the first quarter of 2014 showed a decreasing trend from $740-760 per tonne in January to $700/t in March following the significant downward correction in Scrap #1 Busheling from $440 per gross tonne(/GT) in January to $388/GT in March and despite steady level of demand.
Price increases announced by domestic producers in the United States at beginning of April were achieved, supported by steady demand, increases in scrap cost and some supply disruptions. HRC spot prices increased by $40 in April relative to March, to
$730-750/t and reached a high of $770/t in May.
Expectations for better seasonal demand in China, failed to materialize during the first half of 2014 and prices remained under heavy downward pressure due to tight credit and falling raw material costs. Spot HRC prices averaged $479/t during the first quarter and dropped to $463/t in the second quarter.
Long products demand for construction in Europe was better in the first half of 2014, than same period last year, but downward pressure on pricing has continued due to falling scrap prices. Overall, rebar and medium section prices have declined since the beginning of 2014. From a peak of €480-500 ($660-680)/t in January, rebar prices fell to €450-470 ($625-645)/t by the end of the first quarter and €440-460 ($600-620)/t by the end of the second quarter. Similarly, prices of medium section peaked in January 2014 at €550-570 ($755-775)/t, dropped to €515-535 ($720-740)/t by end of first quarter and €505-525 ($690-710) /t by the end of the second quarter.
Prices of scrap imported into Turkey, dropped substantially during the first months of 2014, from $400/t CFR in January to $350/t CFR by end of February, and then stabilized at around $370-380/t throughout the second quarter. Export prices for Turkish rebar followed the trend in scrap prices: after ending 2013 at $580-590/t rebar prices decreased during the first quarter to $560-570, before remaining stable during the second quarter.
Industrial long product prices remained stable throughout the first half of 2014, around the same level as during the fourth quarter of 2013. However, without robust demand and given abundant supply, prices came under
Business overviewcontinued
2 Global production data is for all countries for which production data is collected by the World steel. Except data for 2014, which only includes 66 countries for which monthly production data is available, prior years include other countries for which only annual data is collected.
3 Source: Steel Business Briefing (SBB)

8 Interim Management Report
renewed pressure by end of the second quarter of 2014.
Current and anticipated trends in steel production and pricesGlobal steel production grew year-on-year during the first half of 2014, driven by growth in ArcelorMittal’s major markets of EU28 and NAFTA as the economic recovery persisted and also in comparison to the year-on-year declines during the first half of 2013. In Europe, with the gradual recovery in the steel consuming sectors expected to continue, steel production is likely to show year-on-year growth during the second half of 2014. ArcelorMittal forecasts steel demand growth to be between 3 and 4% in 2014, helped by the strength of deliveries in the first half, whereas the rate of production growth is expected to slow in the second half, as the impetus from restocking wanes. In 2013, United States steel production declined for the first time since 2009 as demand declined, amplified by destocking. Demand has since rebounded strongly during the first half of 2014 as stockists began to re-stock from low inventory levels at the end of 2013. However, crude steel production in the first half of 2014 was up only around 1% year-on- year as finished imports and production rolled from semi finished imports, rose more strongly. Robust economic growth is expected to support continued strong growth in steel demand during the second half of 2014, which in turn is likely to lead to further growth in steel production as import growth slows. Despite the weakness seen in many emerging markets, especially in CIS and South America, World ex-China steel production increased, supported by Europe, NAFTA and Developed Asia. Steel production is expected to continue growing in the second half of 2014 due to a gradual improvement in the output in developing markets,
whereas growth in developed regions is expected to slow. In China, steel production has already slowed from the strong growth observed during 2013, as domestic demand growth has weakened, but supported by the strength of steel exports. The combination of continued property market weakness, and increasing trade protection slowing export growth, is likely to keep steel production growth muted in the second half of 2014.
Despite the weakness of steel prices, the gradual pick-up in world ex-China steel demand growth during the first half of 2014 has led to a mild increase in steel margins as steel prices have not declined as much as raw material prices. Ultimately steel prices will depend on the strength of underlying raw material prices, which are a function of both the demand and supply of each commodity. Any significant slowdown in steel demand due to deterioration in the debt sustainability of Eurozone nations, a realization of the many geo-political risks or a hard landing in China would dampen raw material prices, eventually impacting steel prices globally.
Raw materialsThe primary inputs for a steelmaker are iron ore, solid fuels, metallics (e.g., scrap), alloys, electricity, natural gas and base metals. ArcelorMittal is exposed to price volatility in each of these raw materials with respect to its purchases in the spot market and under its long-term supply contracts. In the longer term, demand for raw materials is expected to continue to correlate closely with the steel market, with prices fluctuating according to supply and demand dynamics. Since most of the minerals used in the steel-making process are finite resources, they may also rise in response to any perceived scarcity of remaining accessible
supplies, combined with the evolution of the pipeline of new exploration projects to replace depleted resources.
As with other commodities, the spot market prices for most raw materials used in the production of steel saw their recent lows during the global financial crisis of 2008/2009, but have since recovered with a greater degree of volatility. The main driver for the rise in input prices has been robust demand from China, the world’s largest steel producing country. For example, in each of years between 2011 and 2014, iron ore reached high levels well above $100 per tonne (e.g. $193 on February 2011, $140 in December 2012, $160 in February 2013 and $135 in January 2014).
Until the 2008-2009 market downturn, ArcelorMittal had largely been able to reflect raw material price increases in its steel selling prices. However, from 2009 onwards, ArcelorMittal has not been able to fully pass raw materials cost increases onto customers as its steel markets are structurally oversupplied and fragmented. This has resulted in a partial decoupling of raw material costs (mainly driven by Asian market demand) from steel selling prices achieved in the European market, and consequently increased risk of margin squeeze.
Until the 2010 changes in raw materials pricing systems described below under “—Iron Ore”, benchmark prices for iron ore and coal in long-term supply contracts were set annually, and some of these contracts contained volume commitments. In the first half of 2010, the traditional annual benchmark pricing mechanism was abandoned, with the big three iron ore suppliers (Vale, Rio Tinto and BHP Billiton) adopting a quarterly index-based pricing model. The new model operates on the basis of the average spot price for iron
ore supplied to China, quoted in a regularly published iron ore index. The new system has since generally been adopted by other suppliers although some iron ore suppliers continue to offer an annual prices for their long-term contracts. The price trend as well as pricing mechanism for coking coal has followed a similar trend, with the annual benchmark pricing system being replaced by a quarterly pricing system as from the second quarter of 2010 and with a monthly pricing system introduced by BHP Billiton for coal from Australia in 2011. Following this transition to shorter-term pricing mechanisms that are either based on or influenced by spot prices for iron ore and coking coal imports to China, price dynamics generally have experienced shorter cycles and greater volatility. Pricing cycles were further shortened in 2012 and 2013 as high volatility of prices continued. Since 2012, quarterly and monthly pricing systems have been the main type of contract pricing mechanism, but spot purchases also appear to have gained a greater share of pricing mechanisms as steelmakers have developed strategies to benefit from increasing spot market liquidity and volatility. In 2013 and the first half of 2014, the trend toward shorter-term pricing cycles continued, with spot purchases further increasing their share of pricing mechanisms.
Iron ore In the first quarter of 2013, iron ore prices increased dramatically as a result of restocking in China before the New Year holiday and a seasonally weaker supply due to weather-related disruptions in production in Brazil and Australia. In the second quarter of 2013, iron ore prices declined significantly as a result of stock cuts stemming from uncertainties about the Chinese market outlook, reaching a low of $110 per tonne in May and averaging $126 per tonne for the quarter.
Business overviewcontinued

Interim Management Report 9
In the third quarter of 2013, iron ore spot prices recovered, averaging $132 per tonne for the quarter, as a result of strong crude steel production rates in China and significant restocking at Chinese steel mills through the end of August. Despite a strong seaborne supply coming on-stream from the third quarter of 2013 onwards, the spot price remained above $130 per tonne. In the fourth quarter of 2013, the iron ore market stabilized within a consolidated range of $130 to $140 per tonne with no clear price direction as the increasing supply availability was matched with a higher demand on the winter season restock.
Short term rallies in the seaborne market are mainly driven by Chinese mills’ stocking and destocking activities which are due to a high uncertainty on the Chinese steel market outlook.
In the first half of 2014 iron ore spot prices declined by 31% from $134.5 per tonne on January 1, 2014 to $93.25 per tonne on June 30, 2014. This downward price trend was due to increasing supply pressures in the seaborne market and financial weakness in the Chinese steel sector. Credit market tightness combined with stretched cash flow at Chinese mills resulted in a strong destocking trend at Chinese mills from the beginning of the year through the end of the second quarter. Rising iron ore import inventory at Chinese ports was reflective of stronger seaborne supply while real iron ore demand in the Chinese off-shore market remained relatively stable. As a result of significant variations of iron ore inventory at Chinese mills the iron ore spot price volatility remained very significant.
Coking coal and cokePricing for coking coal has been affected by changes to the seaborne pricing system,
with the annual benchmark pricing system being replaced by a quarterly pricing system as from the second quarter of 2010 and with a monthly pricing system introduced by BHP Billiton for coal from Australia in 2011. Pricing cycles have further shortened from 2012 and beyond, as the spot market has developed rapidly.
Due to a continued strong supply and weak demand outlook, the spot coking coal market remained weak in 2013. Better-than-average supply conditions during the Australian wet season in early 2013 contributed to a decrease in hard coking coal prices in the first half of 2013, with premium coking coal prices reaching a low of $130 per tonne (FOB Australia) by the end of the second quarter. Spurred by Chinese demand, hard coking coal prices began to increase at the beginning of the third quarter of 2013, peaking at $152 per tonne in mid-September. However, despite high imports of coking coal to China, the seaborne coking coal market remained weak until the end of 2013, largely as a result of relatively weak ex-China seaborne demand, an improved supply base from Australia and strong domestic production in China. The premium coking coal spot price was $131 per tonne on December 31, 2013.
In 2013, the quarterly contract price for hard coking coal progressed from $165 per tonne in the first quarter to $172 per tonne in the second quarter, $145 per tonne in the third quarter, and $152 per tonne in the fourth quarter.
Due to the combined effects of strong Australian coking coal production performance and weaker seaborne demand in key importing regions, the coking coal spot market has been on a downward trend since the beginning of 2014. The spot
price of a premium hard coking coal from Australia declined from $132-133 per tonne FOB Australia at the beginning of January 2014 to $110-111 per tonne by the end of June 2014. The quarterly benchmark contract settlement price followed this downtrend and settled at $120 per tonne for the second quarter, down $23 per tonne from the first quarter settlement price of $143 per tonne FOB Australia.
Low seaborne prices in 2013 and the first half of 2014 put pressure on the profits of seaborne suppliers and affected the cash flows of big miners, resulting in the closure of certain high-cost mines in Australia and the United States.
ArcelorMittal continues to leverage its extensive supply chain, diversified supply portfolio and contracts flexibility to capture a maximum value from the market price volatility and rapidly changing pricing environment.
Scrap As in 2013, scrap prices increased by €4 per tonne in January (€285 per tonne for demolition scrap) and then came down by €16 per tonne in February 2014. Another price decline occurred in March 2014 (down €15 per tonne), which was partially recovered in April 2013 (up €12 per tonne). The market then remained stable in May (price roll-over at €266 per tonne) and in June (real Eurofer Index at €265 per tonne). Prices have therefore stayed relatively stable since the beginning of the second quarter of 2014.
The Eurofer Index for demolition scrap was at an average of €267 in the first half of 2014 (i.e., down €12 as compared to full year 2013). In NAFTA, prices followed a different trend and, unlike in 2013, have been quite variable and higher than those in Europe. The average price for HMS 1&2 CFR Turkey was $373 per tonne
for the first half of 2014, down $7 per tonne compared to the full year 2013. In NAFTA, the decrease between the peak price in January to the lowest price in June was $56 per tonne, while in Europe the gap between the peak price in January and the lowest price in March was €31 per tonne.
Turkey is still the number one importer of scrap with 19.7 million tonnes of scrap imported in 2013, even though this represented a 12% decrease from values in 2012. Imports represented 65% of total demand in Turkey in the first five months of 2014 (i.e., 7% higher than in the same period in 2013): 7.9 million tonnes in the period from January 2014 to May 2014, compared to 7.4 million tonnes during January 2013 to May 2013.
China is the number one scrap consumer in the world but ranks only 7th or 8th with respect to imports of scraps, with 4.5 million tonnes imported in 2013. In 2014, imports into China have continued to decline, which has been the trend since 2011, as the market adapts to the price gap between scrap and iron ore, with imports amounting to 1.0 million tonnes in the period from January to May 2014 (representing a decrease of 46% compared to the same period in 2013).
Alloys (manganese) and base metals The underlying price driver for manganese alloys is the price of manganese ore, which decreased by 17.1% from the level of $5.25 per dry metric tonne unit (“dmtu”) (for 44% lump ore) on Cost, Insurance and Freight (“CIF”) China in January 2014 to $4.35 per dmtu in June 2014, due to oversupply from South Africa coupled with depreciation of the local currency against US dollar.
Business overviewcontinued
10 Interim Management Report
During the first half of 2014, prices for manganese alloys did not follow the trend of manganese ore due to disruption in supply. Prices of high carbon ferro manganese increased by 1.57% (from $1,027 to $1,043 per ton), and prices of silicon manganese also increased by 3.53% (from $1,181 to $1,223 per tonne). Prices for medium carbon ferro manganese increased by 5.98% (from $1,571 to $1,665 per tonne).
Base metals used by ArcelorMittal are zinc and tin for coating, and aluminum for deoxidization of liquid steel. ArcelorMittal partially hedges its exposure to its base metal inputs in accordance with its risk management policies.
The average price of zinc in the first half of 2014 was $2,051 per tonne, representing an increase of 7.4% as compared to the average price for full year 2013 ($1,909 per tonne). The January average price was $2,038 per tonne while the June average price was $2,127 per tonne, with a first half low at $1,942 per tonne on March 24, 2014. Stocks registered at the London Metal Exchange (“LME”) warehouses stood at 668,475 tonnes as of June 30, 2014, representing a decrease of 265,000 (28.4%) tonnes compared to December 31, 2013 (when stocks registered stood at 933,475 tonnes) due to a change in LME warehousing rules in response to a surfeit in stocks in 2012 and increased demand of zinc.
EnergyElectricityIn most of the countries where ArcelorMittal operates, electricity prices have moved in line with other commodities. In North America, prices in 2014 were impacted by historically cold winter conditions in the first quarter (see “--Natural Gas” below) and Clean Air Act potential extension to CO2
ignited a strong debate on the future of coal power plants. In Europe, the market continues to be affected by poor demand and highly erratic renewable production, which resulted in keeping spot prices below €40 per MWh. The need for investment in replacement and additional power generating capacity by providers and in improved electricity grid stability due to volatility from renewable suppliers remains clear and continues to fuel “capacity market” debates, but is still not apparent in light of current economic conditions.
Natural gasNatural gas is priced regionally. European prices were historically linked with petroleum prices but continuous spot market development is now prevailing in almost all countries except in poorly integrated markets (e.g., Spain, Portugal) or not yet fully open markets (e.g., Poland ). North American natural gas prices trade independently of oil prices and are set by spot and future contracts, traded on the NYMEX exchange or over-the-counter. Elsewhere, prices are set on an oil derivative or bilateral basis, depending on local market conditions. International oil prices are dominated by global supply and demand conditions and are also influenced by geopolitical factors, which are currently focused on the Middle East, in particular Bassorah (Iraq).
So far, in 2014, the Liquefied Natural Gas (“LNG”) market has continued to grow in Asia, although at a slower pace than in 2013. The market remains depressed in Europe, and after having reached record levels for LNG reloading to Asia, the arbitrage window remained opened most of the first half of 2014.
New LNG production facilities have started in the Pacific basin
during the first half of 2014, which helps to rebalance the market, pressuring spot LNG prices down to the $12-13 per MMBtu level in early July. New major start-ups are scheduled for the end of 2014 or early 2015 (gas already committed), which, together with potential nuclear power plant restarts, should help keeping prices reasonable.
In the United States, despite the coldest winter in decades, unconventional gas production proved more than robust, and storage level deficit end of October should be limited to 400 bcf (billion standard cubic feet). Therefore, steam coal continues to be challenged as a fuel to produce power, and projects to build liquefaction facilities for export to Asia continue to be developed, with production expected to start in early 2016. In this context, natural gas prices in North American markets have continued to increase from 2012 lows, averaging in 2014 at $4.3 per MMBtu and up from $3.7 per MMBtu in 2013.
In Europe, gas demand remains depressed and the gap between long-term oil-indexed contracts and spot gas prices increased in the second quarter of 2014 despite continuing contract renegotiation, as spot prices strongly decreased down to $8.5 per MMBtu in the first half of 2014, and have continued to decrease.
Ocean freight4
Ocean freight market rates increased in the first half of 2014 compared to the first half of 2013. Total iron ore imports by China increased 19% compared to the first half of 2014. Both Australian and Brazilian iron ore exports were up compared to the prior year. However, coal and other sectors such as grain did not experience as much growth and combined with easing of congestion, the result was an
improved vessel turnaround and increase in efficiency in ports. Therefore, freight rates were at lower levels than were expected at the beginning of the year because of increased demand from trade growth and a slower delivery of new ships.
The Baltic Dry Index (“BDI”) averaged 1,179 points in the first half of 2014, representing a 40% increase compared to the first half of 2013, driven most notably by the Capesize sector which averaged at $14,135/day in the first half of 2014 (compared to $6,136/day in the first half of 2013). The smaller vessels saw a less significant increase as a result of the Indonesian ban on bauxite and nickel ore exports, delayed South American grain exports and a weaker coal trade. Panamax rates averaged at $8,399/day in the first half of 2014 (compared to$7,415/day for the first half of 2013).
Impact of exchange rate movements The first half of 2014 delivered a very favorable mix of improving developed world growth, ample central bank liquidity and evidence of adjustment in some large emerging markets. In this context of low volatility, the €/$ exchange rate has remained in the range of 1.35-1.40 since the beginning of the year. Regarding the emerging market economies, the first half of the year has been mixed. The first quarter saw an emerging markets currencies crisis with the South African rand reaching a 5-year low (local strike and negative growth outlook), the Kazak tenge (i.e., the National Bank 19% devaluation of the tenge ), Argentinean peso (20% devaluation) and Turkish Lira reaching historical lows. In addition, geopolitical tensions weighed heavily on the Ukraine and Russia, generating significant downside risks to both the Russian and Ukrainian economy with their currencies depreciating
4 Sources: Baltic Daily Index, Clarksons Shipping Intelligence Network, RS Platou. ACM
Business overviewcontinued

Interim Management Report 11
Business overviewcontinued
against the U.S dollar as a result. However, a slight recovery has been seen in the second quarter as emerging markets currencies have enjoyed a robust rally, gaining 3.2% on average against the U.S dollar. In central Europe, the U.S dollar was relatively steady against both the Polish zloty and the Czech koruna.
Because a substantial portion of ArcelorMittal’s assets, liabilities, sales and earnings are denominated in currencies other than the U.S. dollar (its reporting currency), ArcelorMittal has exposure to fluctuations in the values of these currencies relative to the U.S. dollar. These currency fluctuations, especially the fluctuations of the U.S. dollar relative to the euro, as well as fluctuations in the currencies of the other countries in which ArcelorMittal has significant operations and sales, can have a material impact on its results of operations. In order to minimize its currency exposure, ArcelorMittal enters into hedging transactions to lock-in a set exchange rate, as per its risk management policies.
In June 2008, ArcelorMittal entered into a transaction in order to hedge U.S. dollar-denominated raw material purchases until 2012. The hedge involved a combination of forward contracts and options that initially covered between 60% and 75% of the U.S. dollar outflow from the Company’s European subsidiaries based on then-current raw materials prices, amounting to approximately $20 billion. The transaction was unwound during the fourth quarter of 2008, resulting in a deferred gain of approximately $2.6 billion recorded in shareholders’ equity and of $349 million recorded in operating income. The gain recorded in equity along with the recording of
hedged expenses was recycled in the consolidated statements of operations during the period from 2009 through the first quarter of 2013; of this amount, the last installment of $92 million was recorded as income within cost of sales during the six months ended June 30, 2013.
Trade and import competitionEurope5
Import competition in the EU28 steel market reached a high of 38.0 million tonnes of finished goods during 2007, equal to 18.6% of steel demand. As demand decreased, imports also declined, reaching a low of 15.3 million tonnes in 2009, equal to an import penetration ratio (ratio of imports to market supply) of 13.3%. Since 2009, import ratios have fluctuated.
In 2010, imports recovered to 18.6 million tonnes, but an increase in domestic deliveries resulted in an import penetration ratio of 12.6%. In 2011, finished steel imports rose strongly to 23.3 million tonnes, as a result of which the import penetration ratio increased to 14.8%. In 2012, steel demand in Europe declined, but imports fell more sharply to 16.6 million tonnes, down 28.7% year-on-year, resulting in a penetration ratio of only 12.0% for 2012.
In 2013, despite a slight decline in steel demand, imports rose, particularly from China, Russia and Turkey, to total approximately 18.4 million tonnes in 2013, or 10.5% higher than in 2012. As a result, the penetration ratio increased to 13.1% for the year.
During the first half of 2014, finished steel imports are estimated to have increased by 10.3% year-on-year, around 21.9 million tonnes annualized, with shipments originating mainly from Commonwealth of
Independent States (CIS) and China. The penetration rate for the first half of 2014 is estimated at approximately 14.4%.
United States6
After reaching a record level of 32.6 million tonnes in 2006, or an import penetration ratio of 26.9%, total finished imports bottomed at 12.9 million tonnes in 2009, representing an import penetration ratio of 21.8%. Over the next two years, imports rose to 19.8 million tonnes in 2011 but import penetration remained relatively stable at 21.8%, due to stronger finished steel consumption.
Steel demand rose strongly in 2012 as did steel imports, rising to an import penetration of 23.2%. As demand weakened during 2013, finished steel imports and in particular pipe and tube, fell 3.9% year-on-year to an import penetration of 23.2%.
During the first half of 2014, finished steel imports were up 26.8% year-on-year, compared to a 9.1% year-on-year decline over the same period last year. Penetration increased to 27.4%, the highest level over the same period since 2006, compared to an 8.1% year-on-year increase in apparent steel demand during the first half of 2014. Overall steel imports were up 34.8% during the first half of 2014, as imports of semis increased by over 64% year-on-year.
Consolidation in the steel and mining industriesThe global steel and mining industries have experienced a consolidation trend over the past ten years. After pausing during the credit crisis and global economic downturn of 2008-2009, merger and acquisition activity of various steel and mining players, including Chinese and Indian companies,
has increased at a rapid pace. However, given the current economic uncertainties in the developed economies, combined with a slowdown in emerging regions such as China and India, consolidation transactions decreased significantly in terms of number and value in the past two years and this trend is expected to continue in 2014, unless and until prices stabilize and supply and demand balance out in the context of worldwide structural overcapacity.
Apart from Mittal Steel’s acquisition of Arcelor in 2006 and their merger in 2007, notable mergers and acquisitions in the steel business in recent years include the merger of Tata Steel and Corus (itself the result of a merger between British Steel and Hoogovens); U.S. Steel’s acquisitions in Slovakia and Serbia; Evraz and Severstal’s acquisitions in North America, Europe and South America; and expansion in North and South America by Brazilian steel company Gerdau. Most recently, on October 1, 2012, Japanese steelmakers Nippon Steel Corp. and Sumitomo Metals Industries Ltd. completed their merger and created the world’s second-largest steel company. On December 28, 2012, Outokumpu and Inoxum, ThyssenKrupp’s stainless steel division, completed their merger in order to create the worldwide leader in stainless steel.
As developed markets continued to present fewer opportunities for consolidation, steel industry consolidation also began to slow down substantially in China in 2012. Despite being a key initiative of the five-year plan issued in March 2011, the concentration process of the steel industry that is expected to reduce overcapacity, rationalize steel production based on
5 Source: Eurostat trade data to April 2014, estimates for May and June 2014.6 Source: U.S. Department of Commerce, customs census data up to May 2014 and license data for June 2014.
12 Interim Management Report
obsolete technology, improve energy efficiency, achieve environmental targets and strengthen the bargaining position of Chinese steel companies in price negotiations for iron ore declined as a result of the slowing economy. This situation could affect the Chinese government’s objective for the top ten Chinese steel producers to account for 60% of national production by 2015 and for at least two producers to reach 100 million ton capacity in the next few years. However, the Chinese government is considering scrapping a ban on overseas control which was imposed in 2005, enabling non-Chinese companies to make acquisitions in China, which could drive merger and acquisition activity if implemented.
Merger and acquisition activity is expected to remain active in the Indian steel and mining industry though at a lower pace considering the current economic slowdown. The country has become the world’s third largest steel consumer after China and the United States and is expected to become soon the world’s second largest steel producer worldwide. The integration of Ispat Industries into JSW Steel was a major consolidation step in 2010.
Recent and expected future industry consolidation should foster the ability of the steel industry to maintain more consistent performance through industry cycles by achieving greater efficiencies and economies of scale, and should lead to improved bargaining power relative to customers and, crucially, suppliers, which tend to have a higher level of consolidation. The wave of steel industry consolidation in the previous years has followed the lead of raw materials
suppliers, which occurred in an environment of rising prices for iron ore and most other minerals used in the steel-making process. The merger of Cliffs Natural Resources and Consolidated Thompson in 2011 was a significant consolidation move in North America which, at the same time, strengthened vertical relationships into the Chinese steel market. In the context of volatile prices and an overall decline since 2011, which is expected to continue in 2014 given the large additional supply expected to come on line, iron ore producers continue to seek consolidation that would strengthen their options whatever the direction of future price trends. There are still only four primary iron ore suppliers in the world market. Consolidation among other mining companies has continued, as evidenced by the completion of the merger between Xstrata and Glencore on May 2, 2013.
Operating results ArcelorMittal reports its operations in five segments: NAFTA, Brazil, Europe, ACIS and Mining. On January 1, 2014, ArcelorMittal implemented changes to its organizational structure which provide a greater geographical focus. The principal benefits of the changes are to reduce organizational complexity and layers; simplification of processes; regional synergies and taking advantage of the scale effect within the regions.
As a result of the organizational changes, ArcelorMittal’s reportable segments changed to NAFTA, Brazil, Europe, ACIS and Mining. NAFTA includes the Flat, Long and Tubular operations of the United States, Canada and Mexico. Brazil includes the Flat operations of Brazil, and the Long and Tubular operations of Brazil and its neighboring countries including Argentina,
Costa Rica, Trinidad and Tobago and Venezuela. Europe comprises the Flat, Long and Tubular operations of the European business, as well as Distribution Solutions (AMDS). The ACIS segment is largely unchanged except the addition of some Tubular operations. The Mining segment remains unchanged. Prior period information has been recast to reflect this new segmentation. The reportable segments have been revised to reflect ArcelorMittal’s change in organizational structure and managing its business and retrospectively adjusted in conformity with IFRS.
Key IndicatorsThe key performance indicators that ArcelorMittal’s management uses to analyze operations are sales, average steel selling prices, steel shipments, iron ore and coal production and operating income. Management’s analysis of liquidity and capital resources is driven by operating cash flows.
Six months ended June 30, 2014 as compared to six months ended June 30, 2013
Sales, steel shipments and average steel selling prices and mining production
ArcelorMittal’s sales were higher at $40.5 billion for the six months ended June 30, 2014, up from $39.9 billion for the six months ended June 30, 2013, primarily due to an increase in steel shipments offset by a decrease in average steel selling prices.
ArcelorMittal’s steel shipments increased by 2.5% to 42.4 million tonnes for the six months ended June 30, 2014, from 41.4 million tonnes for the six months ended June 30, 2013. Average steel selling prices decreased by 2% for the six months ended June
30, 2014 as compared to the six months ended June 30, 2013.
ArcelorMittal had iron ore and coal production (own production of iron ore and coal, excluding supplies sourced under strategic contracts) of 31.4 million tonnes and 3.6 million tonnes, respectively, for the six months ended June 30, 2014, an increase of 11.7% and decrease of 10%, as compared to 28.1 million tonnes and 4.0 million tonnes, respectively, for the six months ended June 30, 2013. The increase in iron ore production resulted primarily from expanded operations in Canada while the decrease in coal production was mainly related to very difficult geological conditions that limited underground extraction in the Company’s Russian coal operations and lower production at the Company’s USA coal operations (Princeton).
Business overviewcontinued

Interim Management Report 13
The following tables provide a summary of sales at ArcelorMittal by reportable segment and mining production for the six months ended June 30, 2014 as compared to the six months ended June 30, 2013.
Segment Sales for the six months
ended June 30*, Changes in
2013 (in $ millions)
2014 (in $ millions)
Sales (%)
Steel Shipments
(%)
Average Steel Selling
Price (%)NAFTA 9,681 10,351 7 4 1Brazil 5,080 4,787 (6) (5) (3)Europe 20,750 20,840 - 3 (1)ACIS 4,303 4,307 - 5 (7)Mining 2,550 2,639 3 - -Total 39,949 40,492 1 2 (2)
* Amounts are prior to inter-company eliminations (except for total) and include non-steel sales
Mining shipments (million tonnes)1 Six months ended
June 30, 2013 Six months ended
June 30, 2014
Total iron ore shipments2 26.8 30.2Iron ore shipped externally and internally and reported at market price3 15.5 19.8Iron ore shipped externally 4.3 6.7Iron ore shipped internally and reported at market price3 11.2 13.1
Iron ore shipped internally and reported at cost-plus3 11.3 10.4Total coal shipments4 3.8 3.7Coal shipped externally and internally and reported at market price3 2.4 2.1Coal shipped externally 1.7 1.0Coal shipped internally and reported at market price3 0.7 1.1
Coal shipped internally and reported at cost-plus3 1.4 1.61 There are three categories of sales: (1) “External sales”: mined product sold to third parties at market price; (2) “Market-priced tonnes”: internal sales of mined product to
ArcelorMittal facilities reported at prevailing market prices; (3) “Cost-plus tonnes”: internal sales of mined product to ArcelorMittal facilities on a cost-plus basis. The determinant of whether internal sales are reported at market price or reported at cost-plus is whether or not the raw material could practically be sold to third parties (i.e., there is a potential market for the product and logistics exist to access that market).
2 Total of all finished products of fines, concentrate, pellets and lumps and includes tonnes shipped externally and internally and reported at market price as well as tonnes shipped internally on a cost-plus basis.
3 Market-priced tonnes represent amounts of iron ore and coal from ArcelorMittal mines that could practically be sold to third parties. Market-priced tonnes that are transferred from the Mining segment to the Company’s steel producing segments are reported at the prevailing market price. Shipments of raw materials that do not constitute market-priced tonnes are transferred internally on a cost-plus basis.
4 Total of all finished products of coal and includes tonnes shipped externally and internally and reported at market price as well as tonnes shipped internally on a cost-plus basis.
Business overviewcontinued

14 Interim Management Report
Iron ore production (million metric tonnes)1 Type Product
Six months ended June 30,
2013
Six months ended June 30,
2014
Own mines North America2 Open pit Concentrate, lump, fines and pellets 15.1 17.7South America Open pit Lump and fines 1.9 2.2Europe Open pit Concentrate and lump 1.0 1.1Africa Open pit / Underground Fines 2.6 3.0Asia, CIS & Other Open pit / Underground Concentrate, lump, fines and sinter feed 7.5 7.4Total own iron ore production 28.1 31.4Strategic long-term contracts - iron ore North America3 Open pit Pellets 3.1 2.8Africa4 Open pit Lump and fines 2.4 2.8Total strategic long-term contracts - iron ore 5.5 5.6Total 33.6 37.01 Total of all finished production of fines, concentrate, pellets and lumps.2 Includes own mines and share of production from Hibbing (United States, 62.30%) and Peña (Mexico, 50%).3 Consists of a long-term supply contract with Cleveland Cliffs for purchases made at a previously set price, adjusted for changes in certain steel prices and inflation factors.4 Includes purchases under a strategic agreement with Sishen/Thabazambi (South Africa). Prices for purchases under the July 2010 interim agreement with Kumba (as extended and
amended several times) have been on a fixed-cost basis since March 1, 2010. On November 5, 2013, ArcelorMittal announced that its 51% subsidiary, ArcelorMittal South Africa, had reached an agreement with Sishen Iron Ore Company Ltd (SIOC), a subsidiary of Kumba, relating to the long-term supply of iron ore. The agreement, which became effective as of January 1, 2014, allows ArcelorMittal South Africa to purchase up to 6.25 million tonnes per year of iron ore from SIOC, complying with agreed specifications and lump-fine ratios. This volume of 6.25 million tonnes per year of iron ore includes any volumes delivered by SIOC to ArcelorMittal from the Thabazimbi mine, the operational and financial risks of which will pass from ArcelorMittal to Kumba under the terms of this agreement.
Coal production (million metric tonnes)
Six months ended June 30,
2013
Six months ended June 30,
2014
Own mines North America 1.39 1.03Asia, CIS & Other 2.63 2.53Total own coal production 4.02 3.56North America1 0.17 0.18Africa2 0.17 0.20Total strategic long-term contracts - coal 0.34 0.38Total 4.36 3.941 Includes strategic agreement - prices on a fixed price basis.2 Includes long term lease - prices on a cost-plus basis.
NAFTASales in the NAFTA segment increased 7% to $10.4 billion for the six months ended June 30, 2014, from $9.7 billion for the six months ended June 30, 2013, mainly due to a 4% increase in steel shipments and 1% increase in average steel selling prices.
Total steel shipments in the NAFTA segment increased 4% to 11.4 million tonnes for the six months ended June 30, 2014, from 11.0 million tonnes for the six months ended June 30, 2013. Steel shipments for the six months ended June 30, 2014 were impacted by severe weather conditions during the first half of 2014 in the United States. Steel shipments for the six months ended June 30, 2013 was negatively affected by labor issues at Burns Harbor and operational incidents at Indiana Harbor East and West, for which reductions in inventory and supplies from other NAFTA units partially mitigated the market impact.
Average steel selling price in the NAFTA segment increased 1% to $848 per tonne for the six months
ended June 30, 2014 from $838 per tonne for the six months ended June 30, 2013, which reflected increased demand.
BrazilSales in the Brazil segment were $4.8 billion for the six months ended June 30, 2014 as compared to $5.1 billion for the six months ended June 30, 2013, primarily due to lower volumes and average selling prices.
Total steel shipments in the Brazil segment were 4.6 million tonnes for the six months ended June 30, 2014 as compared to 4.9 million tonnes for the six months ended June 30, 2013. The decrease was primarily due to operational issues in the hot strip mill in Tubarão and lower exports from the Point Lisas operating facility in Trinidad.
Average steel selling price in the Brazil segment decreased 3% to $914 per tonne for the six months ended June 30, 2014 from $942 per tonne for the six months ended June 30, 2013, promarily driven by currency devaluation in Brazil, Argentina and Venezuela.
EuropeSales in the Europe segment remained relatively flat at $20.8 billion for the six months ended June 30, 2014 as compared to the six months ended June 30, 2013, primarily due to a 3% increase in steel shipments offset by a 1% decrease in average steel selling prices.
Total steel shipments in the Europe segment increased 3% to 20.2 million tonnes for the six months ended June 30, 2014, from 19.5 million tonnes for the six months ended June 30, 2013. The increase was primarily driven by improved demand compared to the first half of 2013.
Average steel selling price in the Europe segment decreased 1% to $804 per tonne for the six months ended June 30, 2014 from $813 per tonne for the six months ended June 30, 2013, which reflected strong competition and decreasing trend in raw material prices.
ACISSales in the ACIS segment remained relatively flat at $4.3 billion for the six months ended June 30, 2014 as compared to the six months ended June 30, 2013, primarily due to a 5% increase in steel shipments offset by a 7% decrease in average steel selling prices.
Total steel shipments in the ACIS segment increased 5% to 6.5 million tonnes for the six months ended June 30, 2014, from 6.2 million tonnes for the six months ended June 30, 2013. Steel shipments for
the six months ended June 30, 2014 were positively impacted by improved shipments in Kazakhstan with stable operations. Steel shipments for the six months ended June 30, 2013 were negatively affected by lower volumes in South Africa, caused by fire disruption at the Vanderbijlpark site, and Kazakhstan.
Average steel selling price in the ACIS segment decreased 7% to $580 per tonne for the six months ended June 30, 2014 from $626 per tonne for the six months ended June 30, 2013, primarily due to lower international prices driven by lower raw material prices, and partially due to currency devaluation.
MiningOwn iron ore production (not including supplies under strategic long-term contracts) in the six months ended June 30, 2014 was 31.4 million metric tonnes, 11.7% higher than in the six months ended June 30, 2013, primarily due to higher production at the Company’s Canadian operations.
Own coal production (not including supplies under strategic long-term contracts) in the six months ended June 30, 2014 was 3.6 million metric tonnes, representing a decrease of 10% compared to the six months ended June 30, 2013, due to very difficult geological conditions that limited underground extraction in the Company’s Russian coal operations and lower production at the Company’s USA coal operations (Princeton).
Business overviewcontinued

Interim Management Report 15
Sales in the Mining segment increased 3.5% to $2.64 billion for the six months ended June 30, 2014 from $2.55 billion for the six months ended June 30, 2013. Sales of marketable iron ore and coal (internal market-priced and sales to external customers) increased 10.5% to $2.1 billion for the six months ended June 30, 2014 from $1.9 billion for the six months ended June 30, 2013. Sales to external customers were $0.71 billion for the six months ended June 30, 2014 representing a 10.9% increase compared to $0.64 billion for the six months ended June 30, 2013. The increase in sales to external customers was primarily due to higher shipments from own mines for iron ore, partially offset by lower average selling prices of iron ore and coal in line with decreases in international reference prices and lower shipments from own mines for coal. Higher shipments to external customers for iron ore accounted for approximately $0.24 billion of the increase in sales partially offset by lower selling prices for iron ore and coal of $0.09 billion and lower shipments from own mines for coal of $0.09 billion. Iron ore shipments to external customers increased by 55.8% from 4.3 million tonnes for the six months ended June 30, 2013 to 6.7 million tonnes for the six months ended June 30, 2014. Sales of marketable iron ore (internal market-priced and sales to external customers) increased by 28% from
15.5 million tonnes for the six months ended June 30, 2013 to 19.8 million tonnes for the six months ended June 30, 2014. The increase in external shipments was due to additional quantity from our Canadian operations post completion of the project to expand to annual production of 24 million tonnes. Coal shipments to external customers decreased 42.9% from 1.75 million tonnes to 1.0 million tonnes. With respect to lower average selling prices, for example, the average iron ore spot price of $111 per tonne CFR China and the average spot price for hard coking coal FOB Australia at $117 per tonne were 19% and 24% lower for the six months ended June 30, 2014 than for the six months ended June 30, 2013, respectively. It should be noted, however, that there may be no direct correlation between benchmark prices and actual selling prices in various regions at a given time.
Operating incomeArcelorMittal’s operating income for the six months ended June 30, 2014 amounted to $1,506 million, compared to operating income of $756 million for the six months ended June 30, 2013.
During the six months ended June 30, 2014, ArcelorMittal’s operating income was improved by higher steel shipments offset by lower average steel selling prices.
Operating income for the six months ended June 30, 2014 was positively affected by a decrease in depreciation as a result of a change in useful lives of plant and equipment. The Company performed a review of the useful lives of its assets and determined its maintenance and operating practices enabled a change in the useful lives of plant and equipment. As a result, the useful lives of certain of the Company’s existing assets have been and will be used longer than previously anticipated and therefore, the estimated useful lives of certain plant and equipment have been lengthened prospectively. In addition, there were no impairment charges or restructuring charges for the six months ended June 30, 2014. Operating income for the six months ended June 30, 2014 was negatively affected by a $90 million charge following the settlement of antitrust litigation in the United States.
Operating income for the six months ended June 30, 2013 was negatively affected by impairment charges of $39 million primarily relating to the closure of the organic coating and tin plate lines in Florange (Europe segment) and restructuring charges of $173 million, primarily related to $137 million of costs incurred for the long term idling of the Florange liquid phase (including voluntary separation scheme costs, site rehabilitation/safeguarding
costs, and take or pay obligations) as well as by a $67 million loss caused by fire disruption at the Vanderbijlpark site in South Africa.
Operating income for the six months ended June 30, 2013 was positively affected by a $47 million fair valuation gain relating to the acquisition of an additional ownership interest in DJ Galvanizing in Canada in the NAFTA segment and $92 million related to the Dynamic Delta Hedge income.
Cost of sales consists primarily of purchases of raw materials necessary for steel-making (iron ore, coke and coking coal, scrap and alloys) and electricity cost. Cost of sales for the six months ended June 30, 2014 was $37.5 billion, remaining relatively flat as compared to $37.7 billion for the six months ended June 30, 2013, which was driven by a decline in raw material prices, offset by higher production. Selling, general and administrative expenses (“SG&A”) for the six months ended June 30, 2014 were $1.5 billion remaining flat as compared to $1.5 billion for the six months ended June 30, 2013. SG&A represented 3.6% of sales for the six months ended June 30, 2014, as compared to 3.7% for the six months ended June 30, 2013.
The following table summarizes by reportable segment the operating income and operating margin of ArcelorMittal for the six months ended June 30, 2014 as compared with the six months ended June 30, 2013:
Operating income for the six months ended June 30,1
Operating margin for the six months ended June 30,1
2013 (in $ millions)
2014 (in $ millions)
2013 (%)
2014 (%)
NAFTA 193 77 2 1Brazil 542 592 11 12Europe (256) 414 (1) 2ACIS (140) 5 (3) -Mining 572 507 22 19Total adjustments to segment operating income and other 2 (155) (89) Total consolidated operating income 756 1,506 1 Segment amounts are prior to inter-segment eliminations. 2 Total adjustments to segment operating income and other reflects certain adjustments made to operating income of the segments to reflect corporate costs, income from non-steel
operations (e.g. energy, logistics and shipping services) and the elimination of stock margins between the segments. See table below.
Six months ended June 30, 2013 (in $ millions)
Six months ended June 30, 2014 (in $ millions)
Corporate and shared services1 (62) (75) Real estate and financial activities 2 (6) Shipping and logistics (23) (4) Intragroup stock margin eliminations (53) 17 Depreciation and impairment (19) (21) Total adjustments to segment operating income and other (155) (89) 1 Includes primarily staff and other holding costs and results from shared service activities.
Business overviewcontinued

16 Interim Management Report
NAFTAOperating income for the NAFTA segment for the six months ended June 30, 2014 was $77 million, as compared with operating income of $193 million for the six months ended June 30, 2013.
Operating income for the six months ended June 30, 2014 was negatively affected by a $90 million charge following the settlement of antitrust litigation in the United States and the severe weather conditions during the first half of 2014. Operating income for the six months ended June 30, 2013 was positively affected by a $47 million fair valuation gain relating to DJ Galvanizing in Canada, a joint operation in which the Company acquired the remaining 50% interest held by the other joint operator.
Operating income for the six months ended June 30, 2014 was positively affected by higher volumes and higher average selling prices compared to the six months ended June 30, 2013.
BrazilOperating income for the Brazil segment for the six months ended June 30, 2014 was $592 million, as compared with operating income of $542 million for the six months ended June 30, 2013.
Operating income for the six months ended June 30, 2014 was negatively affected by lower shipments and lower average steel selling prices. Operating income was positively impacted by a decrease in depreciation which was $247 million and $358 million for the six months ended June 30, 2014 and June 30, 2013, respectively, mainly due to the change in asset lives of certain plant and equipment.
EuropeOperating income for the Europe segment for the six months ended June 30, 2014 was $414 million, as compared with operating loss of $256 million for the six months ended June 30, 2013.
Operating income for the six months ended June 30, 2014 was positively impacted by improved market conditions and the realized benefits of cost optimization efforts as well as increased shipments, offset slightly by lower average steel selling prices.
Operating income for the six months ended June 30, 2014 was positively impacted by improved market conditions and the realized benefits of cost optimization efforts as well as increased shipments, offset slightly by lower average steel selling prices. In addition, operating income was positively impacted by a decrease in depreciation which was $810 million and $978 million for the six months ended June 30, 2014 and June 30, 2013, respectively, mainly due to the change in asset lives of certain plant and equipment.
Operating loss for the six months ended June 30, 2013 included restructuring costs amounting to $164 million including $137 million associated with the long term idling of the liquid phase at the Florange site in France. The operating loss for the first half of 2013 also included a $92 million non-cash gain relating the unwinding of hedges on raw material purchases.
ACIS Operating income for the ACIS segment for the six months ended June 30, 2014 was $5 million, as compared with operating loss of $140 million for the six months ended June 30, 2013. Operating income for the six months ended June 30, 2014 reflected improved performance in the CIS countries resulting in higher shipments, offset by weaker South African profitability due to weak economic growth and associated domestic challenges.
Operating loss for the six months ended June 30, 2013 was negatively affected by a $67 million loss caused by fire disruption at the Vanderbijlpark site in South Africa.
Mining Operating income attributable to the mining segment for the six months ended June 30, 2014 was $507 million, as compared with operating income of $572 million for the six months ended June 30, 2013 primarily driven by higher volumes offset by lower selling prices. In terms of selling prices, as noted above, the market price of iron ore and coal decreased on average year-on-year. Iron ore marketable volume for the six months ended June 30, 2014 was 19.8 million tonnes, compared to 15.5 million tonnes for the six months ended June 30, 2013, representing an increase of 28%. Coal marketable volume for the six months ended June 30, 2014 was 2.1 million tonnes, compared to 2.4 million tonnes for the six months ended June 30, 2013, representing a decrease of 13%. Cost of sales was stable at $2.0 billion for the six months ended June 30, 2014 and $1.9 billion for the six months ended June 30, 2013.
Investments in associates, joint ventures and other investmentsIncome from investments in associates, joint ventures and other investments was $154 million for the six months ended June 30, 2014, compared to a loss of $42 million for the six months ended June 30, 2013. The income was primarily related to the annual dividend received from Erdemir, improved performance of Spanish entities and the share of profits of the Calvert operations. The loss for the six months ended June 30, 2013 was primarily due to the payment of contingent consideration of $56 million with respect to the Gonvarri Brasil acquisition made in 2008 and weaker performance of European associates.
Financing costsNet financing costs include net interest expense, revaluation of financial instruments, net foreign exchange income/expense (i.e., the net effects of transactions in a foreign currency other than the functional currency of a subsidiary) and other financing costs. Net financing costs for the
six months ended June 30, 2014 were $1.5 billion as compared with $1.6 billion recorded for the six months ended June 30, 2013.
Net interest expense (interest expense less interest income) decreased to $809 million for the six months ended June 30, 2014 as compared to $949 million for the six months ended June 30, 2013, primarily due to savings incurred following the repayment of the EUR and USD convertible bonds in April and May of 2014.
Foreign exchange and other net financing costs (which includes foreign currency swaps, bank fees, interest on pensions, impairments of financial instruments and revaluation of derivative instruments, and other charges that cannot be directly linked to operating results) for the six months ended June 30, 2014 amounted to $707 million, as compared to costs of $685 million for the six months ended June 30, 2013. The first half of 2014 amount includes a payment following the termination of the Senegal greenfield project, non-cash charges for the premiums related to call options on treasury shares expired following the maturity of EUR convertible bonds and hedging instruments.
Foreign exchange and other net financing costs for the six months ended June 30, 2013 was negatively affected by a 8% devaluation of the Brazilian Real versus U.S. dollar, which impacted loans and payables denominated in foreign currency.
Income taxArcelorMittal’s consolidated income tax expense (benefit) is affected by the income tax laws and regulations in effect in the various countries in which it operates and the pre-tax results of its subsidiaries in each of these countries, which can vary from year to year. ArcelorMittal operates in jurisdictions, mainly in Eastern Europe and Asia, which have a structurally lower corporate income tax rate than the statutory tax rate as in effect in Luxembourg (29.22%), as well as in jurisdictions, mainly in
Business overviewcontinued
Interim Management Report 17
Business overviewcontinued
Western Europe and the Americas which have a structurally higher corporate income tax rate.
ArcelorMittal recorded a consolidated income tax expense of $217 million for the six months ended June 30, 2014, as compared to a consolidated income tax expense of $196 million for the six months ended June 30, 2013.
Non-controlling interestsNet income attributable to non-controlling interests for the six months ended June 30, 2014 was $80 million as compared with net income attributable to non-controlling interests of $9 million for the six months ended June 30, 2013. Net income attributable to non-controlling interests primarily relate to the minority shareholders’ share of net income recorded in ArcelorMittal Mines Canada.
Net income attributable to equity holders of the parent ArcelorMittal’s net loss attributable to equity holders of the parent for the six months ended June 30, 2014 was $153 million as compared to net loss attributable to equity holders of the parent of $1.1 billion for the six months ended June 30, 2013, for the reasons discussed above.
Liquidity and capital resources ArcelorMittal’s principal sources of liquidity are cash generated from its operations and its credit facilities at the corporate level.
Because ArcelorMittal is a holding company, it is dependent upon the earnings and cash flows of, and dividends and distributions from, its operating subsidiaries to pay expenses and meet its debt service obligations. Significant cash or cash equivalent balances may be held from time to time at the Company’s international operating subsidiaries, including in particular those in France, where the Company maintains a cash management system under which most of its cash and cash equivalents are centralized, and in Argentina, Brazil, China, Kazakhstan, Morocco, South Africa, Ukraine
and Venezuela. Some of these operating subsidiaries have debt outstanding or are subject to acquisition agreements that impose restrictions on such operating subsidiaries’ ability to pay dividends, but such restrictions are not significant in the context of ArcelorMittal’s overall liquidity. Repatriation of funds from operating subsidiaries may also be affected by tax and foreign exchange policies in place from time to time in the various countries where the Company operates, though none of these policies is currently significant in the context of ArcelorMittal’s overall liquidity.
In management’s opinion, ArcelorMittal’s credit facilities are adequate for its present requirements.
As of June 30, 2014, ArcelorMittal’s cash and cash equivalents, including restricted cash amounted to $4.4 billion as compared to $6.2 billion as of December 31, 2013. In addition, ArcelorMittal had available borrowing capacity of $6.0 billion under its credit facilities as of June 30, 2014, unchanged from December 31, 2013.
As of June 30, 2014, ArcelorMittal’s total debt, which includes long-term debt and short-term debt, was $21.8 billion, compared to $22.3 billion as of December 31, 2013. The repayments of the €1.25 billion Convertible Bonds upon maturity in April, 2014 and the $800 million of Convertible Notes upon maturity in May 2014 were partly offset by the issuance of €750 million 3.00% Notes in March, 2014, a $1 billion loan agreement with a credit institution in June 2014 and proceeds from the draw-down of the $300 million term loan facility in February 2014. Net debt (defined as long-term debt plus short-term debt, less cash and cash equivalents and restricted cash) was $17.4 billion as of June 30, 2014, up from $16.1 billion at December 31, 2013. Net debt increased period-on-period primarily due to the repayment of the perpetual capital securities and
capital expenditures which were partially offset by cash flows from operating activites . Most of the external debt is borrowed by the parent company on an unsecured basis and bears interest at varying levels based on a combination of fixed and variable interest rates. Gearing (defined as net debt divided by total equity) at June 30, 2014 was 33% as compared to 30% at December 31, 2013.
The margin applicable to ArcelorMittal’s principal credit facilities and the coupons on its outstanding bonds are subject to adjustment in the event of a change in its long-term credit ratings. Due, among other things, to the weak steel industry outlook and ArcelorMittal’s credit metrics and level of debt, Standard & Poor’s, Moody’s and Fitch downgraded the Company’s rating to below “investment grade” in August, November and December 2012, respectively, and Standard & Poor’s and Moody’s currently have ArcelorMittal’s credit rating on negative outlook. These downgrades triggered the interest rate “step-up” clauses in most of the Company’s outstanding bonds, resulting in an incremental interest expense of $50 million for the six months ended June 30, 2014 and $40 million for the six months ended June 30, 2013 compared to interest expense expected prior to the downgrades.
ArcelorMittal’s principal credit facilities, which are (i) the syndicated revolving credit facility maturing on March 18, 2016 (the “$3.6 Billion Facility”) and (ii) the syndicated revolving credit facility maturing on November 6, 2018 (the “$2.4 Billion Facility”), contain restrictive covenants. Among other things, these covenants limit encumbrances on the assets of ArcelorMittal and its subsidiaries, the ability of ArcelorMittal’s subsidiaries to incur debt and the ability of ArcelorMittal and its subsidiaries to dispose of assets in certain circumstances. These agreements also require compliance with a financial covenant, as summarized below.
The Company must ensure that the ratio of “Consolidated Total Net Borrowings” (consolidated total borrowings less consolidated cash and cash equivalents) to “Consolidated EBITDA” (the consolidated net pre-taxation profits of the ArcelorMittal group for a Measurement Period, subject to certain adjustments as set out in the facilities) does not, at the end of each “Measurement Period” (each period of 12 months ending on the last day of a financial half-year or a financial year of the Company), exceed a certain ratio, referred to by the Company as the “Leverage ratio”. ArcelorMittal’s principal credit facilities set this ratio to 4.25 to one, whereas certain facilities have a ratio of 3.5 to one. As of June 30, 2014, the Company was in compliance with both ratios.
Non-compliance with the covenants in the facilities described above would entitle the lenders under such facilities to accelerate the Company’s repayment obligations. The Company was in compliance with the financial covenants in the agreements related to all of its borrowings as of June 30, 2014.
As of June 30, 2014, ArcelorMittal had guaranteed approximately $1.2 billion of debt of its operating subsidiaries and $0.6 billion of total debt of ArcelorMittal Finance. ArcelorMittal’s debt facilities have provisions whereby the acceleration of the debt of another borrower within the ArcelorMittal group could, under certain circumstances, lead to acceleration under such facilities.

18 Interim Management Report
The following table summarizes the repayment schedule of ArcelorMittal’s outstanding indebtedness, which includes short-term and long-term debt, as of June 30, 2014.
Repayment Amounts per Year (in billions of $)Type of Indebtedness as of June 30, 2014 Q314 Q414 2015 2016 2017 2018 2019 >2019 Total
Bonds 0.1 0.5 2.2 1.9 2.8 2.2 2.5 6.0 18.2Long-term revolving credit lines - $3.6 billion syndicated credit facility - - - - - - - - -- $2.4 billion syndicated credit facility - - - - - - - - -Commercial paper 1 0.1 - - - - - - - 0.1Other loans 0.5 0.1 1.3 0.9 0.1 0.1 0.1 0.4 3.5 Total Debt 0.7 0.6 3.5 2.8 2.9 2.3 2.6 6.4 21.81 Commercial paper is expected to continue to be rolled over in the normal course of business.
The average debt maturity of the Company was 6.2 years as of June 30, 2014, as compared to 6.2 years as of December 31, 2013.
The following table summarizes the amount of credit available as of June 30, 2014 under ArcelorMittal’s principal credit facilities.
Credit lines availableFacilityamount Drawn Available
$3.6 Billion Facility $ 3.6 - $ 3.6$2.4 Billion Facility $ 2.4 - $ 2.4Total committed lines $ 6.0 - $ 6.0
Financings
Principal credit facilities On March 18, 2011, ArcelorMittal entered into a $6 billion facility (now defined herein as the $3.6 Billion Facility), a syndicated revolving credit facility which may be utilized for general corporate purposes and which matures in 2016. On November 26, 2013, the facility was amended and reduced to $3.6 billion. As of June 30, 2014, the $3.6 Billion Facility remains fully available. On May 6, 2010, ArcelorMittal entered into a $4 billion facility (now defined herein as the $2.4 Billion Facility), a syndicated revolving credit facility which may be utilized for general corporate purposes. On November 26, 2013, the facility was amended and reduced to $2.4 billion and the maturity date extended from May 6, 2015 to November 6, 2018. As of June 30, 2014, the $2.4 Billion Facility remains fully available.
On September 30, 2010, ArcelorMittal entered into the $500 million revolving multi-currency letter of credit facility (the “Letter of Credit Facility”). The Letter of Credit Facility is used by the Company and its subsidiaries for the issuance of letters of credit and other instruments and matures on September 30, 2016. The terms of the letters of credit and other instruments contain certain restrictions as to duration. The Letter of Credit Facility was amended on October 26, 2012 to reduce its amount to $450 million.
On December 20, 2013, ArcelorMittal entered into a term loan facility in an aggregate amount of $300 million, maturing on December 20, 2016, under which amounts repaid may not be re-borrowed. As of June 30, 2014, the term loan facility was fully drawn.
2014 Capital Markets Transactions and Other Outstanding Loans and Debt Securities
On January 17, 2014, ArcelorMittal extended the conversion date for the $1 billion privately placed mandatory convertible bond (“MCB”) issued on December 28, 2009 by one of its wholly-owned Luxembourg subsidiaries. The mandatory conversion date of the bond has been extended to January 29, 2016. The other main features of the MCB remain unchanged. The bond was placed privately with a Luxembourg affiliate of Crédit Agricole Corporate and Investment Bank and is not listed. In connection with the extension of the conversion date of the MCB, ArcelorMittal also extended the maturities of the equity-linked notes in which the proceeds of the MCB issuance are invested.
On February 20, 2014, ArcelorMittal redeemed all of its outstanding $650 million subordinated perpetual capital securities following the occurrence of a “Ratings Agency
Event”, as defined in the terms of the securities. The notes were redeemed for $657 million at a redemption price of 101% of the principal amount thereof, plus interest accrued.
On March 25, 2014, ArcelorMittal completed the offering of €750 million 3.00 per cent Notes due March 25, 2019 issued under the €3 billion wholesale Euro Medium Term Notes Programme. The proceeds of the issuance were used for general corporate purposes.
On June 10, 2014, ArcelorMittal entered into a loan agreement for $1 billion. The loan was funded upon closing. The credit institution has the right to demand repayment of the loan once per year beginning February 2015 until the final maturity of the agreement on April 20, 2017.
On July 4, 2014, ArcelorMittal completed the offering of €600 million 2.875 per cent Notes due July 6, 2020 issued under
Business overviewcontinued

Interim Management Report 19
Business overviewcontinued
Sources and uses of cashThe following table summarizes cash flows of ArcelorMittal for the six months ended June 30, 2014 and 2013:
Summary of Cash FlowSix months ended
June 30, 2013(in $ millions)
Six months ended June 30, 2014(in $ millions)
Net cash provided by operating activities 2,057 1,077Net cash used in investing activities (1,520) (1,697)Net cash (used in) provided by financing activities 1,897 (1,118)
Net cash provided by operating
activities For the six months ended June 30, 2014, net cash provided by operating activities was $1.1 billion as compared with net cash provided by operating activities of $2.1 billion for the six months ended June 30, 2013. Net cash provided by operating activities for the six months ended June 30, 2013 was positively impacted by a release of working capital. Net cash provided by operating activities for the six months ended June 30, 2014, included a $50 million increase in working capital (consisting of inventories plus accounts receivable less accounts payable), primarily related to a decrease in payables of $56 million and a decrease in inventories of $380 million, partly offset by an
increase in accounts receivables of $374 million, as compared to a $0.7 billion decrease in working capital a year earlier. The reduction in inventories is mainly related to lower raw material prices for the six months ended June 30, 2014 as the average benchmark iron ore price per tonne of $111 CFR China and the average benchmark price for hard coking coal FOB Australia were 19% and 24% lower than in 2013, respectively, leading to a lower carrying value of raw materials and finished steel products in inventory.Net cash provided by operating activities for the six months ended June 30, 2014 was negatively affected by payments made relating to the settlement of antitrust litigation in the United States and termination of the Senegal greenfield project.
Net cash used in investing
activities Net cash used in investing activities for the six months ended June 30, 2014 was $1.7 billion as compared with net cash used in investing activities of $1.5 billion for the six months ended June 30, 2013.
Capital expenditures were $1.6 billion for the six months ended June 30, 2014, remaining flat as compared with $1.6 billion for the six months ended June 30, 2013. The Company currently expects that capital expenditures for the year ended 2014 will amount to approximately $3.8-$4.0 billion, involving mainly sustaining capital expenditures with a slight increase compared to the prior year as well as the continuation of the phase II Liberia project.
ArcelorMittal’s major growth capital expenditures in the six months ended June 30, 2014 included the following major projects: Capacity expansion in Liberia; Monlevade expansion plan downstream part.
the €3 billion wholesale Euro Medium Term Notes Programme. The proceeds of the issuance were used for general corporate purposes.
During the first half of 2014, ArcelorMittal entered into short-term committed bilateral credit facilities totaling approximately $0.9 billion. As of June 30, 2014, the facilities remain fully available.
Additional information regarding the Company’s outstanding loans and debt securities is set forth in Note 17 of ArcelorMittal’s consolidated financial statements for the year ended December 31, 2013 and Note 8 of ArcelorMittal’s
condensed consolidated financial statements for the period ended June 30, 2014.
True sale of receivables (“TSR”) programsThe Company has established a number of programs for sales without recourse of trade accounts receivable to various financial institutions (referred to as True Sale of Receivables (“TSR”)) for an aggregate amount of $5,607 million as of June 30, 2014. This amount represents the maximum amounts of unpaid receivables that may be sold and outstanding at any given time. Of this amount, the Company has utilized $5,368 million and $5,370 million as
of December 31, 2013 and as of June 30, 2014, respectively. Through the TSR programs, certain operating subsidiaries of ArcelorMittal surrender the control, risks and benefits associated with the accounts receivable sold; therefore, the amount of receivables sold is recorded as a sale of financial assets and the balances are removed from the consolidated statements of financial position at the moment of sale. The total amount of receivables sold under TSR programs and derecognized in accordance with IAS 39 for the six months ended June 30, 2013 and 2014 was $17.1 billion and $19.4 billion, respectively (with amounts of receivables sold
converted to U.S. dollars at the monthly average exchange rate). Expenses incurred under the TSR programs (reflecting the discount granted to the acquirers of the accounts receivable) recognized in the consolidated statements of operations for the six months ended June 30, 2013 and 2014 were $91 million and $80 million, respectively.

20 Interim Management Report
Other investing activities for the six months ended June 30, 2014 included an inflow of $183 million from the sale of ATIC Services S.A. (“ATIC”) and the steel cord business ($144 million and $39 million, respectively) as well as proceeds from the exercise of the second put option in Hunan Valin. Other investing activities for the six months ended June 30, 2014 included an outflow of $258 million associated with the acquisition of ThyssenKrupp Steel USA through the joint venture with Nippon Steel & Sumitomo Metal Corporation (“NSSMC”).
The following tables summarize the Company’s principal growth and optimization projects involving significant capital expenditures completed in the last half of 2013 and in the current year, as well as those that are ongoing.
Segment Site Project Capacity / particulars Actual completionCompleted Projects
Mining ArcelorMittal Mines Canada Expansion projectIncrease concentrator capacity by 8mt/ year
(16 to 24mt/ year) Q2 20131
Segment Site Project Capacity / particulars Forecast CompletionOngoing Projects2
Mining Liberia Phase 2 expansion projectIncrease production capacity to 15mt/ year
(high grade sinter feed) 20153
NAFTA ArcelorMittal Dofasco (Canada)
Construction of a heavy gauge Galvanizing line #6
to optimize Galvanizing operations
Optimize cost and increase shipment of galvanized products by 0.3mt / year 20154
Brazil ArcelorMittal Vega Do Sul (Brazil) Expansion project
Increase hot dipped galvanizing (HDG) capacity by 0.6mt / year and cold rolling (CR)
capacity by 0.7mt / year On hold
Brazil Monlevade (Brazil) Wire rod production
expansion Increase in capacity of finished products by
1.1mt / year 20155
Brazil Juiz de Fora (Brazil)Rebar and meltshop
expansion Increase in rebar capacity by 0.4mt / year;
Increase in meltshop capacity by 0.2mt / year 20155
Brazil Monlevade (Brazil) Sinter plant, blast furnace
and melt shopIncrease in liquid steel capacity by 1.2mt /
year; Sinter feed capacity of 2.3mt / year On hold5
Brazil Acindar (Argentina) New rolling millIncrease in rolling capacity by 0.4mt / year for
bars for civil construction 20166
Country Site Project Capacity / particulars Actual completionJoint venture projects
China Hunan Province VAMA auto steel JV
Capacity of 1.5mt pickling line, 0.9mt continuous annealing line and 0.5mt of hot
dipped galvanizing auto steel H2 20147
Canada Baffinland Early revenue phase Production capacity 3.5mt/ year (iron ore) 20158
1 Final capex for the AMMC expansion project was $1.6 billion. The ramp-up of expanded capacity at AMMC hit a run-rate of 24mt by year end 2013. Stretch opportunity to 30mtpa concentrate through debottlenecking of existing operations has been identified but remains subject to board approval.
2 Ongoing projects refer to projects for which construction has begun (excluding various projects that are under development), or have been placed on hold pending improved operating conditions. 3 The Phase 2 expansion of the Liberia project to a production capacity of 15 million tonnes per annum sinter feed is underway. The first sinter feed production is expected at the end of 2015.
Stretch opportunity to 20mtpa including 5mtpa DSO has been identified but remains subject to board approval. Phase 2 is expected to require capex of $1.7 billion. 4 During Q3 2013, the Company restarted the construction of a heavy gauge galvanizing line #6 (capacity 660ktpy) at Dofasco. On completion of this project in 2015, the older and smaller
galvanizing line #2 (capacity 400ktpy) will be closed. The project is expected to benefit EBITDA through increased shipments of galvanized product (260ktpy), improved mix and optimized costs. The line #6 will also incorporate Advanced High Strength Steel (AHSS) capability and is the key element in a broader program to improve Dofasco’s ability to serve customers in the automotive, construction, and industrial markets.
5 During Q2 2013, the Company restarted its Monlevade expansion project in Brazil. The project is expected to be completed in two phases with the first phase (investment in which has now been approved) focused mainly on downstream facilities and consisting of a new wire rod mill in Monlevade with additional capacity of 1,050 ktpy of coils with capex estimated at a total of $280 million; and Juiz de Fora rebar capacity increase from 50 to 400ktpy (replacing some wire rod production capacity) and meltshop capacity increase by 200ktpy. This part of the overall investment is expected to be finished in 2015. A decision whether to invest in Phase 2 of the project, focusing on the upstream facilities in Monlevade (sinter plant, blast furnace and meltshop), will be taken at a later date.
6 During Q3 2013, Acindar Industria Argentina de Aceros S.A. (Acindar) announced its intention to invest $100 million in a new rolling mill (with production capacity of 400ktpy of rebars from 6 to 32mm) in Santa Fe province, Argentina devoted to the manufacturing of civil construction products. The new rolling mill will also enable ArcelorMittal Acindar to optimize production at its special bar quality (SBQ) rolling mill in Villa Constitución, which in the future will only manufacture products for the automotive and mining industries. The project is expected to take up to 24 months to build, with operations expected to start in 2016.
7 Valin ArcelorMittal Automotive Steel (“VAMA”), a downstream automotive steel joint venture between ArcelorMittal and Valin Group, of which the Company owns 49%, will produce steel for high-end applications in the automobile industry and supply international automakers and first-tier Chinese car manufacturers as well as their supplier networks for the rapidly growing Chinese market. The project involves the construction of state of the art pickling line tandem CRM (1.5mt), continuous annealing line (0.9mt) and hot dipped galvanised line (0.5mt). Total capital invest-ment is $832 million (100% basis) with the first automotive coil to be produced in H2 2014.
8 The Company’s Board of Directors has approved the Early Revenue Phase (“ERP”) at Baffinland, which requires less capital investment than the full project as originally proposed. Implementation of the ERP is now underway and environmental approvals are in place. The goal is to reach a 3.5mt per annum production rate during the open water shipping season by the end of 2015. The budget for the ERP is approximately $730 million and requires upgrading of the road that connects the port in Milne Inlet to the mine site.
Business overviewcontinued
Interim Management Report 21
Net cash (used in) provided by
financing activities Net cash used in financing activities was $1.1 billion for the six months ended June 30, 2014, as compared to cash provided by financing activities of $1.9 billion for the six months ended June 30, 2013.
During the six months ended June 30, 2014, the Company repaid debt in the amount of $2.7 billion (primarily €1.25 billon for the 7.25% convertible bonds due April 1, 2014 and $800 million for the 5.00% convertible bonds due May 15, 2014) and redeemed subordinated perpetual capital securities for $657 million. These payments were offset by the receipts of $1.0 billion from a loan agreement with a financial institution, proceeds of $1.3 billion from the issuance of a €750 million 3.00% Notes due March 25, 2019 under its €3 billion wholesale Euro Medium Term Notes Programme, and proceeds from new 3-year $300 million financing provided by EDC (Export Development Canada).
Dividends paid to non-controlling shareholders in subsidiaries and payments to holders of subordinated perpetual capital securities during the six months ended June 30, 2014 amounted to $40 million and $22 million, respectively as compared to $9 million and $28 million, respectively for the six months ended June 30, 2013.
EquityEquity attributable to the equity holders of the parent decreased to $48.9 billion at June 30, 2014, compared with $49.8 billion at December 31, 2013, primarily due to the redemption of subordinated perpetual capital securities, the declaration of the dividend to ArcelorMittal shareholders, and
the divestitures of ATIC, Bekaert and the steel cord business and partially offset by net results from the period.
Earnings distributions On May 8, 2014 at the Annual General Shareholders’ meeting, the shareholders approved the Company’s dividend of $0.20 per share. The dividend amounted to $333 million and was paid on July 15, 2014.
Treasury shares ArcelorMittal held 11,785,524 shares in treasury at June 30, 2014, down from 11,792,674 shares at December 31, 2013 as a result of allocations to employees under incentive plans. At June 30, 2014, the number of treasury shares represented approximately 0.71% of the total issued number of ArcelorMittal shares.
Research and development, patents and licenses Research and development expense (included in selling, general and administrative expenses) was $150 million for the six months ended June 30, 2014 as compared to $119 million for the six months ended June 30, 2013.
Trend information All of the statements in this “Trend information” section are subject to and qualified by the information set forth under the “Cautionary statement regarding forward-looking statements”. See also “—Key factors affecting results of operations” above.
OutlookThe 2014 operating income guidance framework remains valid. Reflecting the weaker than
expected iron ore price, this underlying assumption has been adjusted to $105/t (from $120/t previously) implying a second-half average of $100/t. All other components of the framework remain unchanged. As a result the Company now expects 2014 operating income plus depreciation and impairment to be in excess of $7.0 billion. The key assumptions behind this framework are discussed below.
Based on the current economic outlook, ArcelorMittal continues to expect global apparent steel consumption (“ASC”) to increase by approximately 3-3.5% in 2014. Steel demand growth has been strong in Europe and we have upgraded our ASC growth in 2014 to 3-4%. Despite the impact of severe weather in the US on demand in Q1 2014, data for Q2 2014 has been strong and US ASC growth in 2014 has also been upgraded to a forecast range of 5-6%. In China, we see signs of stabilization due to the government’s targeted stimulus, and expect steel demand in the range of 3-3.5%. While risks remain to steel demand in the CIS and other emerging markets including Brazil, the stronger fundamentals in our key developed world markets continue to support our expectation that steel shipments should increase by approximately 3% in 2014 as compared to 2013.Following the successful ramp up of expanded capacity at ArcelorMittal Mines Canada, year-on-year increases in market priced iron ore shipments are expected. This should underpin a 15% expansion of marketable iron ore volumes for the Company in 2014 as compared to 2013.
Following the successful ramp up of expanded capacity at ArcelorMittal Mines Canada,
year-on-year increases in market priced iron ore shipments are expected. This should underpin a 15% expansion of marketable iron ore volumes for the Company in 2014 as compared to 2013.
The working assumption behind the revised 2014 operating income plus depreciation and impairment guidance is an average iron ore price of approximately $105/t (for 62% Fe CFR China).
Due to improved industry utilization rates, and the further contribution of the Company’s Asset Optimization and Management Gains cost optimization programs, steel margins are expected to improve in 2014. This improvement is forecasted despite the negative weather related impact on NAFTA performance at the beginning of the year, which resulted in increased costs of approximately $350 million in the H1 2014.
Furthermore, the Company expects net interest expense to be approximately $1.6 billion in 2014 as compared to $1.8 billion in 2013 due primarily to lower average debt.
Capital expenditure is expected to be approximately $3.8-4.0 billion, a slight increase over 2013, with some of the expected spending from last year rolling into 2014 as well as the continuation of the phase II Liberia project.
As previously communicated, the Company does not intend to ramp-up any major steel growth capex or increase dividends until the medium term $15 billion net debt target has been achieved and market conditions improve.
Business overviewcontinued
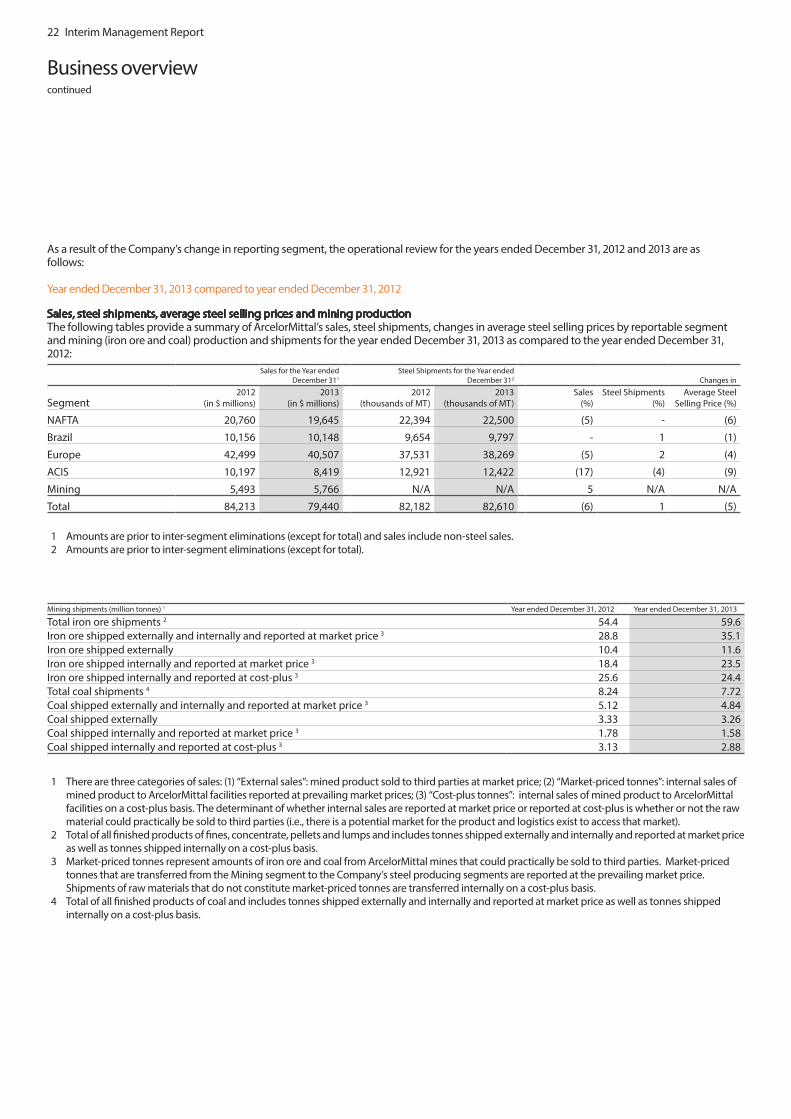
22 Interim Management Report
As a result of the Company’s change in reporting segment, the operational review for the years ended December 31, 2012 and 2013 are as follows:
Year ended December 31, 2013 compared to year ended December 31, 2012
Sales, steel shipments, average steel selling prices and mining productionThe following tables provide a summary of ArcelorMittal’s sales, steel shipments, changes in average steel selling prices by reportable segment and mining (iron ore and coal) production and shipments for the year ended December 31, 2013 as compared to the year ended December 31, 2012:
Sales for the Year ended
December 311Steel Shipments for the Year ended
December 312 Changes in
Segment2012
(in $ millions)2013
(in $ millions) 2012
(thousands of MT)2013
(thousands of MT) Sales
(%)Steel Shipments
(%)Average Steel
Selling Price (%)
NAFTA 20,760 19,645 22,394 22,500 (5) - (6)
Brazil 10,156 10,148 9,654 9,797 - 1 (1)
Europe 42,499 40,507 37,531 38,269 (5) 2 (4)
ACIS 10,197 8,419 12,921 12,422 (17) (4) (9)
Mining 5,493 5,766 N/A N/A 5 N/A N/A
Total 84,213 79,440 82,182 82,610 (6) 1 (5)
Mining shipments (million tonnes) 1 Year ended December 31, 2012 Year ended December 31, 2013
Total iron ore shipments 2 54.4 59.6Iron ore shipped externally and internally and reported at market price 3 28.8 35.1Iron ore shipped externally 10.4 11.6Iron ore shipped internally and reported at market price 3 18.4 23.5Iron ore shipped internally and reported at cost-plus 3 25.6 24.4Total coal shipments 4 8.24 7.72Coal shipped externally and internally and reported at market price 3 5.12 4.84Coal shipped externally 3.33 3.26Coal shipped internally and reported at market price 3 1.78 1.58Coal shipped internally and reported at cost-plus 3 3.13 2.88
1 Amounts are prior to inter-segment eliminations (except for total) and sales include non-steel sales.2 Amounts are prior to inter-segment eliminations (except for total).
1 There are three categories of sales: (1) “External sales”: mined product sold to third parties at market price; (2) “Market-priced tonnes”: internal sales of mined product to ArcelorMittal facilities reported at prevailing market prices; (3) “Cost-plus tonnes”: internal sales of mined product to ArcelorMittal facilities on a cost-plus basis. The determinant of whether internal sales are reported at market price or reported at cost-plus is whether or not the raw material could practically be sold to third parties (i.e., there is a potential market for the product and logistics exist to access that market).
2 Total of all finished products of fines, concentrate, pellets and lumps and includes tonnes shipped externally and internally and reported at market price as well as tonnes shipped internally on a cost-plus basis.
3 Market-priced tonnes represent amounts of iron ore and coal from ArcelorMittal mines that could practically be sold to third parties. Market-priced tonnes that are transferred from the Mining segment to the Company’s steel producing segments are reported at the prevailing market price. Shipments of raw materials that do not constitute market-priced tonnes are transferred internally on a cost-plus basis.
4 Total of all finished products of coal and includes tonnes shipped externally and internally and reported at market price as well as tonnes shipped internally on a cost-plus basis.
Business overviewcontinued

Interim Management Report 23
Coal production (million metric tonnes)Year ended
December 31, 2012Year ended
December 31, 2013
Own mines North America 2.44 2.62Asia, CIS & Other 5.77 5.43Total own coal production 8.21 8.05North America 1 0.36 0.37Africa 2 0.35 0.42Total strategic long-term contracts - coal 0.72 0.79Total 8.93 8.84
Iron ore production (million metric tonnes) 1 Type ProductYear ended
December 31, 2012Year ended
December 31, 2013
Own mines North America 2 Open pit Concentrate, lump, fines and pellets 30.3 32.5South America Open pit Lump and fines 4.1 3.9Europe Open pit Concentrate and lump 2.1 2.1Africa Open pit / Underground Fines 4.7 4.8Asia, CIS & Other Open pit / Underground Concentrate, lump, fines and sinter feed 14.7 15.0Total own iron ore production 55.9 58.4Strategic long-term contracts - iron ore North America 3 Open pit Pellets 7.6 7.0Africa 4 Open pit Lump and fines 4.7 4.7Total strategic long-term contracts - iron ore 12.3 11.7Total 68.1 70.1
1 Total of all finished production of fines, concentrate, pellets and lumps.2 Includes own mines and share of production from Hibbing (United States, 62.30%) and Peña (Mexico, 50%).3 Consists of a long-term supply contract with Cleveland Cliffs for purchases made at a previously set price, adjusted for changes in certain steel prices
and inflation factors.4 Includes purchases under an interim strategic agreement with Sishen Iron Ore Company (Proprietary) Limited (“SIOC”) which was entered into on
December 13, 2012 and became effective on January 1, 2013, pursuant to which SIOC supplied a maximum annual volume of 4.8 million tonnes of iron ore at a weighted average price of $65 per tonne. Since 2010, SIOC and ArcelorMittal have entered into a series of strategic agreements that established interim pricing arrangements for the supply of iron ore to ArcelorMittal on a fixed-cost basis. On November 5, 2013, ArcelorMittal and SIOC entered into an agreement establishing long-term pricing arrangements for the supply of iron ore by SIOC to ArcelorMittal. Pursuant to the terms of the agreement, which became effective on January 1, 2014, ArcelorMittal may purchase from SIOC up to 6.25 million tonnes iron ore per year, complying with agreed specifications and lump-fine ratios. The price of iron ore sold to ArcelorMittal by SIOC is determined by reference to the cost (including capital costs) associated with the production of iron ore from the DMS Plant at the Sishen mine plus a margin of 20%, subject to a ceiling price equal to the Sishen Export Parity Price at the mine gate. While all prices are referenced to Sishen mine costs (plus 20%) from 2016, the parties agreed to a different price for certain pre-determined quantities of iron ore for the first two years of the 2014 Agreement.
1 Includes strategic agreement - prices on a fixed price basis.2 Includes long term lease - prices on a cost-plus basis.
Business overviewcontinued

24 Interim Management Report
Business overviewcontinued
ArcelorMittal had sales of $79.4 billion for the year ended December 31, 2013, representing a decrease of 6% from sales of $84.2 billion for the year ended December 31, 2012, primarily due to lower average steel selling prices (which were down 5%) reflecting lower raw material prices, partially offset by improved marketable mining shipments (which were up 22%). Sales in 2012 also included $0.9 billion related to the divested operations Paul Wurth and Skyline Steel. In the first half of 2013, sales of $39.9 billion represented a 12% decrease from sales of $45.2 billion in the first half of 2012, primarily due to a drop in average steel prices and lower shipments, resulting from weaker market conditions compared to 2012. Sales for the first half of 2013 did not include any contribution from Paul Wurth and Skyline Steel, which amounted to $0.7 billion in the first half of 2012. In the second half of 2013, sales of $39.5 billion represented an increase of 1% from sales of $39.0 billion in second half of 2012 primarily driven by an increase in steel shipments of 5% offset by a drop in average steel prices of 3%. The latter includes lower average steel prices during the third quarter of 2013 as a result of weaker market conditions in Europe for flat and long products and higher average prices in the fourth quarter of 2013 due in particular to stronger market conditions in the Americas.
ArcelorMittal had steel shipments of 82.6 million tonnes for the year ended December 31, 2013, representing an increase of 1% from steel shipments of 82.2 million tonnes for the year ended December 31, 2012. Average steel selling price for the year ended December 31, 2013 decreased 5% compared to the year ended December 31, 2012, following continued weakness in demand in Europe, a slight decline of demand in North America combined with increased competition in international markets. Average steel selling price in the first half of 2013 decreased by 6% from the
same period in 2012, while average steel selling price in the second half of the year was down 3% from the same period in 2012.
ArcelorMittal had own iron ore production of 58.4 million tonnes for the year ended December 31, 2013, an increase of 4% as compared to 55.9 million tonnes for the year ended December 31, 2012. ArcelorMittal had own coking coal production of 8.1 million tonnes for the year ended December 31, 2013, a decrease of 2% as compared to 8.2 million tonnes for the year ended December 31, 2012. The increase in iron ore production resulted primarily from expanded operations in Canada.
NAFTASales in the NAFTA segment were $19.6 billion for the year ended December 31, 2013, representing a decrease of 5% as compared to $20.8 billion for the year ended December 31, 2012. Sales decreased primarily due to a 6% decrease in average steel selling prices as shipments were relatively flat. Sales in the first half of 2013 were $9.7 billion, down 12% from the same period in 2012 primarily driven by a 4% decrease in shipments and 8% decrease in average steel selling prices. In the second half of the year sales were $10 billion, up 2% from the same period in 2012 primarily driven by a 5% increase in shipments along with a 3% decrease in average steel selling prices.
Total steel shipments were 22.5 million tonnes for the year ended December 31, 2013 and remained relatively flat compared to the year ended December 31, 2012. Shipments were 11.0 million tonnes in the first half of 2013, down 4% from the same period in 2012, while shipments in the second half of the year were 11.5 million tonnes, up 5% from the same period in 2012. The decrease in steel shipments in the first half of 2013 reflected lower crude steel production in the United States due
to labor issues at Burns Harbor and operational incidents at Indiana Harbor East and West, partially offset by the use of inventory and supplies from other NAFTA units. The increase in the second half of the year reflected the resolution of the labor issues and operational incidents that had affected the second quarter of 2013.
Average steel selling price decreased 6% for the year ended December 31, 2013 as compared to the year ended December 31, 2012. Average steel selling price in the first half of 2013 was down 8% from the same period in 2012 (which reflected slightly lower demand and decreasing trend in raw material prices and subdued market sentiment), while average steel selling price in the second half of the year was down 3% from the same period in 2012, although average steel selling price in the fourth quarter of 2013 was flat as compared to the fourth quarter of 2012.
BrazilIn the Brazil segment, sales were $10.1 billion for the year ended December 31, 2013 which was relatively flat compared to the year ended December 31, 2012. Sales in the first half of 2013 were $5.1 billion, down 3% from the same period in 2012, while sales in the second half of the year were $5 billion, up 3% from the same period in 2012.
Total steel shipments reached 9.8 million tonnes for the year ended December 31, 2013, which was a 1% increase from steel shipments for the year ended December 31, 2012. Shipments were 4.9 million tonnes in the first half of 2013, which remained relatively flat compared to the same period in 2012, while shipments in the second half of the year were up by 4% as compared to the second half of 2012.
Average steel selling price decreased 1% for the year ended December 31, 2013 as compared
to the year ended December 31, 2012. Average steel selling price in the first half of 2013 was down 2% from the same period in 2012 due to currency devaluation in Venezuelan and lower production and selling prices for the Tubular business. The average steel selling price in the second half of the year was down 1% from the same period in 2012, although average steel selling price in the fourth quarter of 2013 was 7% higher as compared to fourth quarter of 2012.
EuropeSales in the Europe segment were $40.5 billion for the year ended December 31, 2013, representing a decrease of 5% as compared to $42.5 billion for the year ended December 31, 2012. The decrease was primarily due to a 4% decrease in average steel selling price while steel shipments increased by 2%. Sales for the year ended December 31, 2012 also included a $0.4 billion contribution from Skyline Steel, which was disposed of in June 2012. Sales in the first half of 2013 were $20.8 billion, down 10% from the same period in 2012, and in the second half of the year sales were $19.8 billion, up 2% from the same period in 2012.
Total steel shipments were 38.3 million tonnes for the year ended December 31, 2013, an increase of 2% from steel shipments for the year ended December 31, 2012. Shipments were 19.5 million tonnes in the first half of 2013, down 3% from the same period in 2012, while shipments in the second half of the year were 18.7 million tonnes, up 8% from the same period in 2012. The decrease in the first half of 2013 was primarily driven by continued decline in demand due to macroeconomic conditions. The increase in the second half of 2013 resulted in particular from recovery in demand following an improvement in market sentiment.
Average steel selling price decreased 4% for the year ended
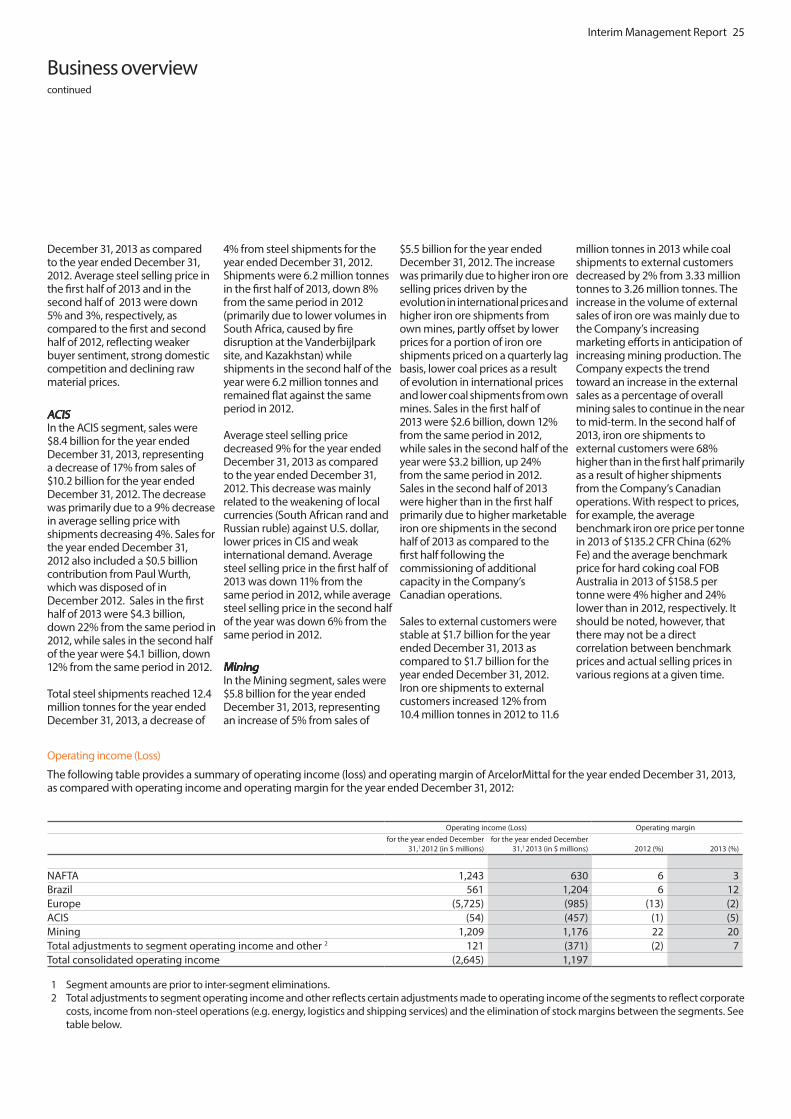
Interim Management Report 25
December 31, 2013 as compared to the year ended December 31, 2012. Average steel selling price in the first half of 2013 and in the second half of 2013 were down 5% and 3%, respectively, as compared to the first and second half of 2012, reflecting weaker buyer sentiment, strong domestic competition and declining raw material prices.
ACISIn the ACIS segment, sales were $8.4 billion for the year ended December 31, 2013, representing a decrease of 17% from sales of $10.2 billion for the year ended December 31, 2012. The decrease was primarily due to a 9% decrease in average selling price with shipments decreasing 4%. Sales for the year ended December 31, 2012 also included a $0.5 billion contribution from Paul Wurth, which was disposed of in December 2012. Sales in the first half of 2013 were $4.3 billion, down 22% from the same period in 2012, while sales in the second half of the year were $4.1 billion, down 12% from the same period in 2012.
Total steel shipments reached 12.4 million tonnes for the year ended December 31, 2013, a decrease of
4% from steel shipments for the year ended December 31, 2012. Shipments were 6.2 million tonnes in the first half of 2013, down 8% from the same period in 2012 (primarily due to lower volumes in South Africa, caused by fire disruption at the Vanderbijlpark site, and Kazakhstan) while shipments in the second half of the year were 6.2 million tonnes and remained flat against the same period in 2012.
Average steel selling price decreased 9% for the year ended December 31, 2013 as compared to the year ended December 31, 2012. This decrease was mainly related to the weakening of local currencies (South African rand and Russian ruble) against U.S. dollar, lower prices in CIS and weak international demand. Average steel selling price in the first half of 2013 was down 11% from the same period in 2012, while average steel selling price in the second half of the year was down 6% from the same period in 2012.
MiningIn the Mining segment, sales were $5.8 billion for the year ended December 31, 2013, representing an increase of 5% from sales of
$5.5 billion for the year ended December 31, 2012. The increase was primarily due to higher iron ore selling prices driven by the evolution in international prices and higher iron ore shipments from own mines, partly offset by lower prices for a portion of iron ore shipments priced on a quarterly lag basis, lower coal prices as a result of evolution in international prices and lower coal shipments from own mines. Sales in the first half of 2013 were $2.6 billion, down 12% from the same period in 2012, while sales in the second half of the year were $3.2 billion, up 24% from the same period in 2012. Sales in the second half of 2013 were higher than in the first half primarily due to higher marketable iron ore shipments in the second half of 2013 as compared to the first half following the commissioning of additional capacity in the Company’s Canadian operations.
Sales to external customers were stable at $1.7 billion for the year ended December 31, 2013 as compared to $1.7 billion for the year ended December 31, 2012. Iron ore shipments to external customers increased 12% from 10.4 million tonnes in 2012 to 11.6
million tonnes in 2013 while coal shipments to external customers decreased by 2% from 3.33 million tonnes to 3.26 million tonnes. The increase in the volume of external sales of iron ore was mainly due to the Company’s increasing marketing efforts in anticipation of increasing mining production. The Company expects the trend toward an increase in the external sales as a percentage of overall mining sales to continue in the near to mid-term. In the second half of 2013, iron ore shipments to external customers were 68% higher than in the first half primarily as a result of higher shipments from the Company’s Canadian operations. With respect to prices, for example, the average benchmark iron ore price per tonne in 2013 of $135.2 CFR China (62% Fe) and the average benchmark price for hard coking coal FOB Australia in 2013 of $158.5 per tonne were 4% higher and 24% lower than in 2012, respectively. It should be noted, however, that there may not be a direct correlation between benchmark prices and actual selling prices in various regions at a given time.
Operating income (Loss)
The following table provides a summary of operating income (loss) and operating margin of ArcelorMittal for the year ended December 31, 2013, as compared with operating income and operating margin for the year ended December 31, 2012:
Operating income (Loss) Operating marginfor the year ended December
31,1 2012 (in $ millions)for the year ended December
31,1 2013 (in $ millions) 2012 (%) 2013 (%)
NAFTA 1,243 630 6 3Brazil 561 1,204 6 12Europe (5,725) (985) (13) (2)ACIS (54) (457) (1) (5)Mining 1,209 1,176 22 20Total adjustments to segment operating income and other 2 121 (371) (2) 7Total consolidated operating income (2,645) 1,197
1 Segment amounts are prior to inter-segment eliminations.2 Total adjustments to segment operating income and other reflects certain adjustments made to operating income of the segments to reflect corporate
costs, income from non-steel operations (e.g. energy, logistics and shipping services) and the elimination of stock margins between the segments. See table below.
Business overviewcontinued
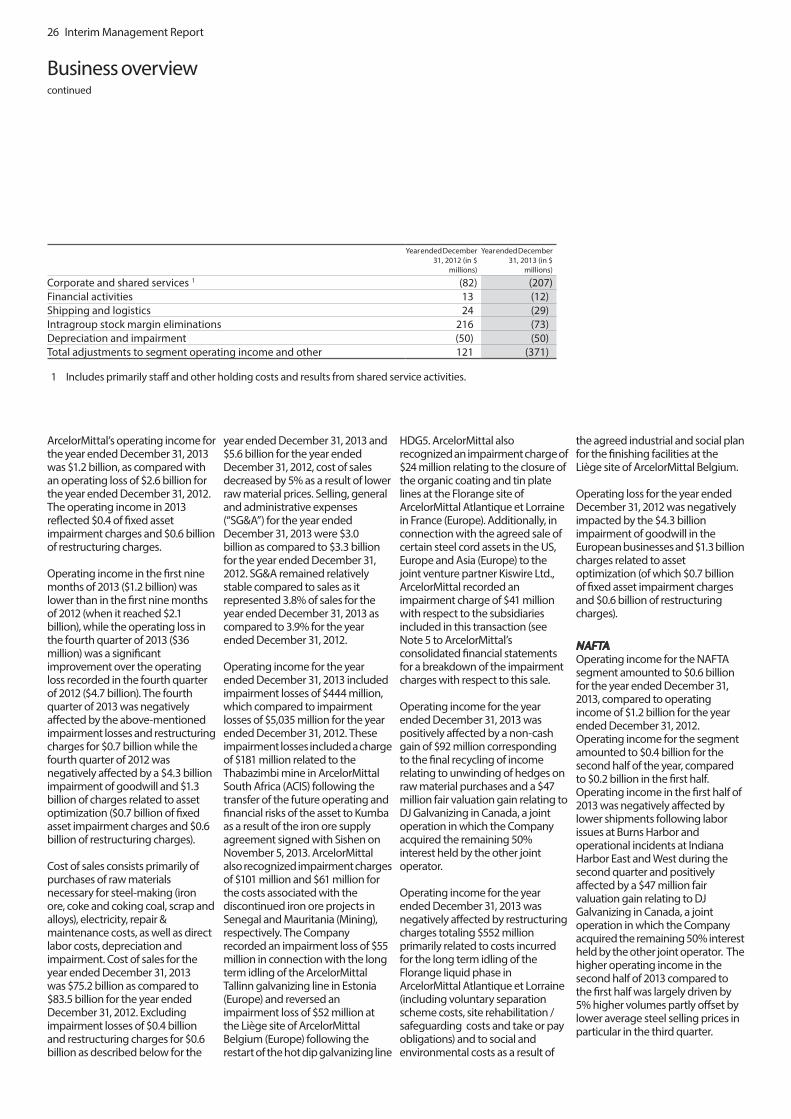
26 Interim Management Report
Business overviewcontinued
ArcelorMittal’s operating income for the year ended December 31, 2013 was $1.2 billion, as compared with an operating loss of $2.6 billion for the year ended December 31, 2012. The operating income in 2013 reflected $0.4 of fixed asset impairment charges and $0.6 billion of restructuring charges.
Operating income in the first nine months of 2013 ($1.2 billion) was lower than in the first nine months of 2012 (when it reached $2.1 billion), while the operating loss in the fourth quarter of 2013 ($36 million) was a significant improvement over the operating loss recorded in the fourth quarter of 2012 ($4.7 billion). The fourth quarter of 2013 was negatively affected by the above-mentioned impairment losses and restructuring charges for $0.7 billion while the fourth quarter of 2012 was negatively affected by a $4.3 billion impairment of goodwill and $1.3 billion of charges related to asset optimization ($0.7 billion of fixed asset impairment charges and $0.6 billion of restructuring charges).
Cost of sales consists primarily of purchases of raw materials necessary for steel-making (iron ore, coke and coking coal, scrap and alloys), electricity, repair & maintenance costs, as well as direct labor costs, depreciation and impairment. Cost of sales for the year ended December 31, 2013 was $75.2 billion as compared to $83.5 billion for the year ended December 31, 2012. Excluding impairment losses of $0.4 billion and restructuring charges for $0.6 billion as described below for the
year ended December 31, 2013 and $5.6 billion for the year ended December 31, 2012, cost of sales decreased by 5% as a result of lower raw material prices. Selling, general and administrative expenses (“SG&A”) for the year ended December 31, 2013 were $3.0 billion as compared to $3.3 billion for the year ended December 31, 2012. SG&A remained relatively stable compared to sales as it represented 3.8% of sales for the year ended December 31, 2013 as compared to 3.9% for the year ended December 31, 2012.
Operating income for the year ended December 31, 2013 included impairment losses of $444 million, which compared to impairment losses of $5,035 million for the year ended December 31, 2012. These impairment losses included a charge of $181 million related to the Thabazimbi mine in ArcelorMittal South Africa (ACIS) following the transfer of the future operating and financial risks of the asset to Kumba as a result of the iron ore supply agreement signed with Sishen on November 5, 2013. ArcelorMittal also recognized impairment charges of $101 million and $61 million for the costs associated with the discontinued iron ore projects in Senegal and Mauritania (Mining), respectively. The Company recorded an impairment loss of $55 million in connection with the long term idling of the ArcelorMittal Tallinn galvanizing line in Estonia (Europe) and reversed an impairment loss of $52 million at the Liège site of ArcelorMittal Belgium (Europe) following the restart of the hot dip galvanizing line
HDG5. ArcelorMittal also recognized an impairment charge of $24 million relating to the closure of the organic coating and tin plate lines at the Florange site of ArcelorMittal Atlantique et Lorraine in France (Europe). Additionally, in connection with the agreed sale of certain steel cord assets in the US, Europe and Asia (Europe) to the joint venture partner Kiswire Ltd., ArcelorMittal recorded an impairment charge of $41 million with respect to the subsidiaries included in this transaction (see Note 5 to ArcelorMittal’s consolidated financial statements for a breakdown of the impairment charges with respect to this sale.
Operating income for the year ended December 31, 2013 was positively affected by a non-cash gain of $92 million corresponding to the final recycling of income relating to unwinding of hedges on raw material purchases and a $47 million fair valuation gain relating to DJ Galvanizing in Canada, a joint operation in which the Company acquired the remaining 50% interest held by the other joint operator.
Operating income for the year ended December 31, 2013 was negatively affected by restructuring charges totaling $552 million primarily related to costs incurred for the long term idling of the Florange liquid phase in ArcelorMittal Atlantique et Lorraine (including voluntary separation scheme costs, site rehabilitation / safeguarding costs and take or pay obligations) and to social and environmental costs as a result of
the agreed industrial and social plan for the finishing facilities at the Liège site of ArcelorMittal Belgium.
Operating loss for the year ended December 31, 2012 was negatively impacted by the $4.3 billion impairment of goodwill in the European businesses and $1.3 billion charges related to asset optimization (of which $0.7 billion of fixed asset impairment charges and $0.6 billion of restructuring charges).
NAFTAOperating income for the NAFTA segment amounted to $0.6 billion for the year ended December 31, 2013, compared to operating income of $1.2 billion for the year ended December 31, 2012. Operating income for the segment amounted to $0.4 billion for the second half of the year, compared to $0.2 billion in the first half. Operating income in the first half of 2013 was negatively affected by lower shipments following labor issues at Burns Harbor and operational incidents at Indiana Harbor East and West during the second quarter and positively affected by a $47 million fair valuation gain relating to DJ Galvanizing in Canada, a joint operation in which the Company acquired the remaining 50% interest held by the other joint operator. The higher operating income in the second half of 2013 compared to the first half was largely driven by 5% higher volumes partly offset by lower average steel selling prices in particular in the third quarter.
Year ended December 31, 2012 (in $
millions)
Year ended December 31, 2013 (in $
millions)
Corporate and shared services 1 (82) (207) Financial activities 13 (12) Shipping and logistics 24 (29) Intragroup stock margin eliminations 216 (73) Depreciation and impairment (50) (50) Total adjustments to segment operating income and other 121 (371)
1 Includes primarily staff and other holding costs and results from shared service activities.
Interim Management Report 27
Operating income for the year ended December 31, 2012 was positively affected by the curtailment gain of $285 million resulting from the changes to the pension plan and health and dental benefits in ArcelorMittal Dofasco in Canada and included a charge of $72 million corresponding to one-time signing bonus and actuarial losses related to post retirement benefits following the conclusion of the new US labor agreement.
BrazilOperating income for the Brazil segment for the year ended December 31, 2013 was $1.2 billion compared to $0.6 billion for the year ended December 31, 2012. Operating income for the segment amounted to $0.7 billion for the second half of the year, compared to operating income of $0.5 billion in the first half of the year. Operating income improved by $0.6 billion in 2013 as compared to 2012 primarily due to a positive price cost squeeze and improved profitability in South America.
EuropeOperating loss for the Europe segment for the year ended December 31, 2013 was $1.0 billion compared to operating loss of $5.7 billion for the year ended December 31, 2012. Operating loss for the segment amounted to $0.7 billion for the second half of the year, compared to operating loss of $0.3 billion in the first half of the year. Despite the continuous difficult economic environment in Europe reflected in lower average steel selling prices in 2013 compared to 2012 (which represented a decrease of approximately €50/tonne for flat products), shipments increased by 2% in 2013 as a result of a mild pick-up in demand particularly in the second half of 2013. Excluding impairment and restructuring charges, gain on sale of carbon dioxide credits and unwinding of hedges on raw
material purchases, operating income improved by $0.4 billion reflecting higher shipment volumes and benefits from management gains and asset optimization.
Europe’s operating loss included restructuring costs amounting to $517 million, including $137 million of costs incurred for the long term idling of the Florange liquid phase in ArcelorMittal Atlantique et Lorraine (including voluntary separation scheme costs, site rehabilitation / safeguarding costs and take or pay obligations) and $354 million (including social and environmental costs) as a result of the agreed industrial and social plan for the finishing facilities at the Liège site of ArcelorMittal Belgium. These charges were partially offset by a reversal of provisions of $38 million in France and Spain following the revision of certain assumptions. Europe’s operating loss was reduced by a non-cash gain of $92 million corresponding to the final recycling of income relating to unwinding of hedges on raw material purchases.
Europe’s operating loss included also impairment charges of $86 million, of which was $55 million in connection with the long term idling of the ArcelorMittal Tallinn galvanizing line in Estonia largely offset by the reversal of an impairment loss of $52 million at the Liège site of ArcelorMittal Belgium following the restart of the hot dip galvanizing line HDG5, $24 million primarily relating to the closure of the organic coating and tin plate lines at the Florange site of ArcelorMittal Atlantique et Lorraine in France and an impairment charge of $41 million with respect to the subsidiaries included in the agreed sale of certain steel cord assets in the US, Europe and Asia to the joint venture partner Kiswire Ltd..
Europe’s operating loss for the year ended December 31, 2012 mainly resulted from a $4,308 million ($2,493, $1,010 and $805 million for the former Flat Carbon Europe,
Long Carbon Americas and Europe and Distribution Solutions segments, respectively) impairment charge of goodwill and $502 million impairment losses related to property, plant and equipment in the framework of asset optimization, including $130 million in respect of the long term idling of the liquid phase at the Florange site of ArcelorMittal Atlantique et Lorraine in France, $296 million with respect to the intention to permanently close the coke plant and six finishing lines at the Liège site of ArcelorMittal Belgium and $61 million related to the extended idling of the electric arc furnace and continuous caster at the Schifflange site in Luxembourg. Impairment losses also included a charge of $222 million relating to facilities in Spain and North Africa in the Long Carbon Europe operating segment; in determining these expenses, the Company analyzed the recoverable amount of these facilities based on their value in use and determined that the recoverable amount from these facilities was less than their carrying amount. In addition, operating loss for the year ended December 31, 2012 was increased by restructuring costs amounting to $587 million as part of asset optimization, of which $231 million related to the closure of the primary facilities at the Liège site of ArcelorMittal Belgium and $64 million associated with separation schemes primarily relating to ArcelorMittal Poland. These charges were partially offset by a gain of $220 million recorded on the sale of carbon dioxide credits (the proceeds of which will be re-invested in energy saving projects), a non-cash gain of $566 million relating to unwinding of hedges on raw material purchases and the $331 million gain on disposal of Skyline Steel.
ACISOperating loss for the ACIS segment for the year ended December 31, 2013 was $0.5 billion, compared to operating loss of $0.1 billion for the
year ended December 31, 2012. Lower profitability in 2013 was primarily due to a negative price-cost squeeze, lower average steel selling prices, which declined 9% compared to 2012 and lower shipments (down 4% as compared to 2012). Operating loss for the segment amounted to $317 million for the second half of the year, compared to $140 million in the first half. Operating loss in the second half included a charge of $181 million related to the Thabazimbi mine in ArcelorMittal South Africa following the transfer of the operating and financial risks of the asset to Kumba as a result of the iron ore supply agreement signed with Sishen on November 5, 2013. Operating loss for the first half of 2013 was increased by the impact of the fire that occurred in February at the Vanderbijlpark plant in ArcelorMittal South Africa. It caused extensive damage to the steel making facilities resulting in an immediate shutdown of the facilities. No injuries were reported as a result of the incident. Repairs were completed and full operations resumed during the second week of April 2013. An estimated 361,000 tonnes of production volumes was lost as a result of the incident. The resulting operating loss net of insurance indemnification is currently estimated at $56 million.
Operating loss for the year ended December 31, 2012 included the gain on disposal of Paul Wurth for $242 million.
MiningOperating income for the Mining segment for the year ended December 31, 2013 was stable at $1.2 billion, compared to operating income of $1.2 billion for the year ended December 31, 2012. The stability in operating income in 2013 generally reflected slightly improved iron ore prices partly offset by lower coal selling prices. As noted above, the average reference price of iron ore increased from $130/tonne CFR China for 62% Fe in 2012 to
Business overviewcontinued

28 Interim Management Report
Business overviewcontinued
$135.2/tonne in 2013. Coal prices decreased by $51/tonne between 2012 and 2013. Iron ore marketable volume for the year ended December 31, 2013 was 35.1 million tonnes, compared to 28.8 million tonnes for the year ended December 31, 2012. Coal marketable volume for the year ended December 31, 2013 was slightly lower at 4.8 million tonnes, compared to 5.1 million tonnes for the year ended December 31, 2012. Operating income for the year ended December 31, 2013 was negatively impacted by impairment charges of $0.2 billion including $101 million and $61 million for the costs associated with the discontinued iron ore projects in Senegal and Mauritania, respectively. The increase in cost of sales from $4.0 billion in 2012 to $4.4 billion in 2013 resulted from the $0.2 billion impairment charge mentioned above and the remaining increase by 5% was primarily related to higher shipments.
Operating income for the segment amounted to $0.6 billion for the second half of the year, compared to $0.6 billion in the first half. Operating income for the second half of 2013 was negatively affected by the above mentioned impairment charges.
Income (loss) from associates, joint ventures and other investmentsArcelorMittal recorded a loss of $442 million from associates, joint ventures and other investments for the year ended December 31, 2013, as compared with income from associates, joint ventures and other investments of $185 million for the year ended December 31, 2012. Loss for the year ended December 31, 2013 included impairment charges for a total amount of $422 million, of which $200 million related to the Company’s 47% stake in the associate China Oriental as a result of current expectations regarding future performance. In addition, the
Company recorded an impairment charge of $111 million relating to the Company’s 50% interest in the associate Kiswire ArcelorMittal Ltd in the framework of the agreed sale of certain steel cord assets to the joint venture partner Kiswire Ltd. (with another impairment charge recorded in cost of sales in the Europe segment as described above and in note 5 to ArcelorMittal’s consolidated financial statements). Loss for the year ended December 31, 2013 also included an impairment charge of $111 million relating to the associate Coal of Africa as a result of lower profitability and decline in market value. Loss for the year ended December 31, 2013 included a charge of $57 million following the disposal of a 6.66% interest in Erdemir shares by way of a single accelerated bookbuilt offering to institutional investors. In addition, loss for the year ended December 31, 2013 included a $56 million expense for contingent consideration with respect to the Gonvarri Brasil acquisition made in 2008 partly offset by a gain of $45 million with respect to the sale of a 10% interest in Hunan Valin Steel Tube and Wire Co. Ltd. (“Hunan Valin”) following the exercise of the first and second put options. On February 8, 2014, the Company exercised the third put option and decreased its interest in Hunan Valin to 15.05%.
Income from associates, joint ventures and other investments for the year ended December 31, 2012 included a net gain of $101 million on the disposal of a 6.25% stake in Erdemir and an impairment loss of $185 million, reflecting the reduction of the carrying amount of the investment in Enovos to the net proceeds from the sale.
Financing costs - netNet financing costs include net interest expense, revaluation of financial instruments, net foreign exchange income/expense (i.e., the net effects of transactions in a
foreign currency other than the functional currency of a subsidiary) and other net financing costs (which mainly include bank fees, accretion of defined benefit obligations and other long term liabilities). Net financing costs were slightly higher for the year ended December 31, 2013, at $3.1 billion, as compared with $2.9 billion for the year ended December 31, 2012.
Net interest expense (interest expense less interest income) was $1.8 billion for the year ended December 31, 2013 as compared to $1.9 billion for the year ended December 31, 2012. Interest expense was slightly lower for the year ended December 31, 2013 at $1.9 billion, compared to interest expense of $2.0 billion for the year ended December 31, 2012, primarily due to the positive effect of lower debt following the tender and repayment of bonds and privately placed notes at the end of June 2013, partly offset by step-ups in the interest rate payable on most of the Company’s outstanding bonds as a result of the Company’s rating downgrades in the second half of 2012. Interest income for the year ended December 31, 2013 amounted to $0.1 billion, compared to $0.2 billion for the year ended December 31, 2012.
Foreign exchange and other net financing costs (which include bank fees, interest on pensions and fair value adjustments of derivative instruments) increased slightly from $0.9 billion for the year ended December 31, 2012 to $1.3 billion for the year ended December 31, 2013. Foreign exchange and other net financing costs for the year ended December 31, 2013 included an expense of $80 million relating to interest and penalties with respect to the settlement of a tax amnesty program in Brazil.
Income tax expense (benefit)ArcelorMittal recorded a consolidated income tax expense of
$0.2 billion for the year ended December 31, 2013, as compared to a consolidated income tax benefit of $1.9 billion for the year ended December 31, 2012. The full year 2013 income tax expense includes an expense of $222 million related to the settlement of two tax amnesty programs in Brazil. For additional information related to ArcelorMittal’s income taxes, see Note 21 to ArcelorMittal’s consolidated financial statements.
ArcelorMittal’s consolidated income tax expense (benefit) is affected by the income tax laws and regulations in effect in the various countries in which it operates and the pre-tax results of its subsidiaries in each of these countries, which can vary from year to year. ArcelorMittal operates in jurisdictions, mainly in Eastern Europe and Asia, which have a structurally lower corporate income tax rate than the statutory tax rate as in effect in Luxembourg (29.22%), as well as in jurisdictions, mainly in Western Europe and the Americas, which have a structurally higher corporate income tax rate.
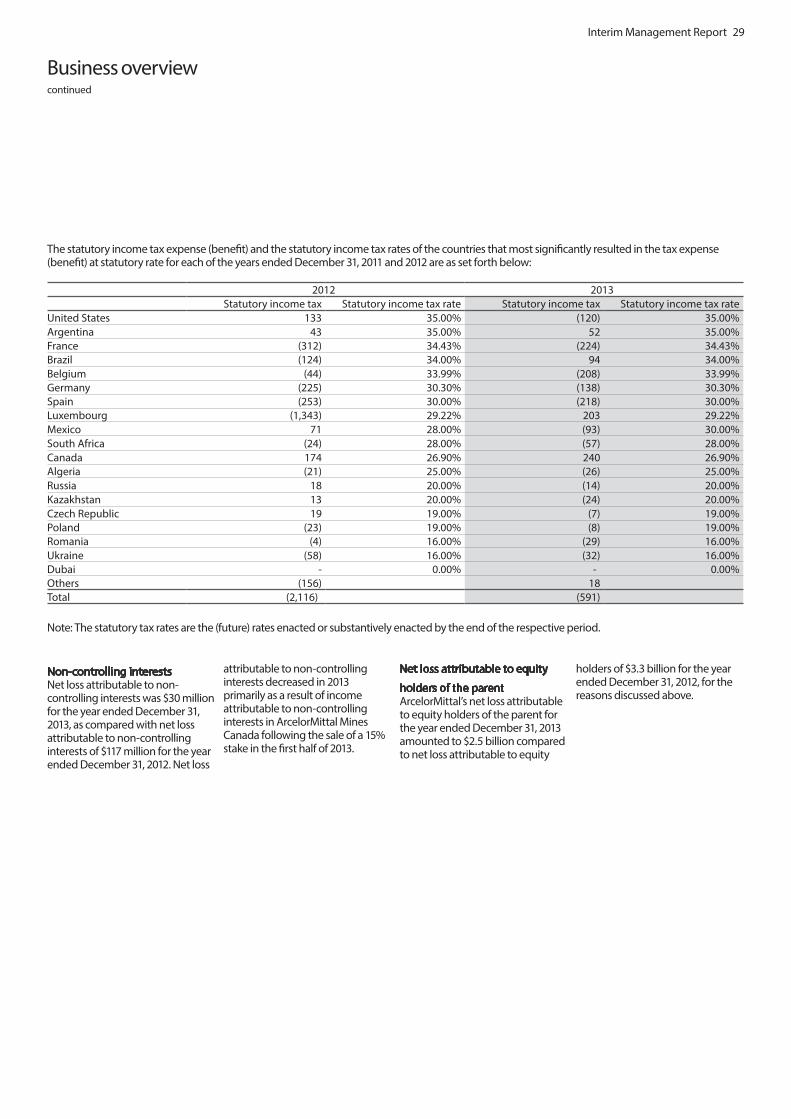
Interim Management Report 29
Non-controlling interestsNet loss attributable to non-controlling interests was $30 million for the year ended December 31, 2013, as compared with net loss attributable to non-controlling interests of $117 million for the year ended December 31, 2012. Net loss
attributable to non-controlling interests decreased in 2013 primarily as a result of income attributable to non-controlling interests in ArcelorMittal Mines Canada following the sale of a 15% stake in the first half of 2013.
Net loss attributable to equity
holders of the parentArcelorMittal’s net loss attributable to equity holders of the parent for the year ended December 31, 2013 amounted to $2.5 billion compared to net loss attributable to equity
holders of $3.3 billion for the year ended December 31, 2012, for the reasons discussed above.
2012 2013 Statutory income tax Statutory income tax rate Statutory income tax Statutory income tax rateUnited States 133 35.00% (120) 35.00%Argentina 43 35.00% 52 35.00%France (312) 34.43% (224) 34.43%Brazil (124) 34.00% 94 34.00%Belgium (44) 33.99% (208) 33.99%Germany (225) 30.30% (138) 30.30%Spain (253) 30.00% (218) 30.00%Luxembourg (1,343) 29.22% 203 29.22%Mexico 71 28.00% (93) 30.00%South Africa (24) 28.00% (57) 28.00%Canada 174 26.90% 240 26.90%Algeria (21) 25.00% (26) 25.00%Russia 18 20.00% (14) 20.00%Kazakhstan 13 20.00% (24) 20.00%Czech Republic 19 19.00% (7) 19.00%Poland (23) 19.00% (8) 19.00%Romania (4) 16.00% (29) 16.00%Ukraine (58) 16.00% (32) 16.00%Dubai - 0.00% - 0.00%Others (156) 18 Total (2,116) (591)
Note: The statutory tax rates are the (future) rates enacted or substantively enacted by the end of the respective period.
The statutory income tax expense (benefit) and the statutory income tax rates of the countries that most significantly resulted in the tax expense (benefit) at statutory rate for each of the years ended December 31, 2011 and 2012 are as set forth below:
Business overviewcontinued
30 Interim Management Report
Recent Developments
Recent Developments
• OnJuly29,2014,ArcelorMittaland Billiton Guinea B.V. (“BHP Billiton”) have signed a sale and purchase agreement for the acquisition by ArcelorMittal of a 43.5% stake in Euronimba Limited (“Euronimba”), which holds a 95% indirect interest in the Mount Nimba iron ore project in Guinea (“Project”). The Project comprises a 935 million tonne direct shipped ore resource with an average grade of 63.1% Fe and is located approximately 40 kilometres from ArcelorMittal Liberia’s mine and infrastructure operations. ArcelorMittal has simultaneously entered into a sale and purchase agreement with Compagnie Française de Mines et Métaux (a member of the Areva group) for the acquisition of its 13% stake in Euronimba. The closing of these two transactions would give ArcelorMittal a 56.5% ownership of Euronimba. The remaining 43.5% of Euronimba is owned by Newmont LaSource S.A.S. (“Newmont”). As part of the transaction, ArcelorMittal has granted Newmont a limited duration option which, if exercised, would result in Newmont and ArcelorMittal owning equal stakes in Euronimba. The transaction is subject to certain closing conditions, including merger control clearance and certain approvals from the Government of Guinea.
• OnJuly10,2014,ArcelorMittalsigned an agreement with Doosan Corporation, a South Korean conglomerate, for the sale of all of the shares of Circuit Foil Luxembourg, which manufactures electrodeposited copper foils for the electronics industry, and certain of its subsidiaries for cash consideration of $50 million. The sale was completed on July 31, 2014.
• OnJuly4,2014,ArcelorMittalissued €600 million 2.875% Notes due July 6, 2020 under its €3 billion wholesale Euro Medium Term Notes Programme.
The uses of proceeds from the issuance are for general corporate purposes.
• OnJune30,2014,ArcelorMittalcompleted the sale of its 78% stake in the European port handling and logistics company ATIC for €155 million ($144 million net of cash of $68 million disposed of ) to H.E.S. Beheer N.V., who held the remaining 22% non-controlling interest. The transaction is consistent with ArcelorMittal’s stated strategy of selective divestment of non-core assets.
• OnJune10,2014,ArcelorMittalentered into a loan agreement with a financial institution for $1.0 billion. The financial institution has the right to request early repayment once per year beginning in February 2015 until the final maturity on April 20, 2017.
• OnMay30,2014,theCompanycompleted the disposal of its 50% stake in the joint venture ArcelorMittal Kiswire Ltd in South Korea and certain other entities of its steel cord business in the United States, Europe and Asia to Kiswire Ltd. The Company received a preliminary cash consideration of $55 million ($39 million net of cash of $16 million disposed of) to be adjusted upon final determination of the net debt and working capital balance at closing date. The Company’s existing intra group debt of $102 million was assumed by Kiswire Ltd. and will be repaid at the latest during the first half of 2015. The Company will receive an additional consideration for the net debt outstanding at closing date.
• OnApril30,2014,theCompanycompleted the extension of its partnership in Latin America to Costa Rica and Ecuador with Bekaert Group (“Bekaert”), a worldwide market and technology leader in steel wire transformation and coatings. ArcelorMittal became a minority shareholder in the Ideal Alambrec Ecuador wire plant
controlled by Bekaert, transferred the steel wire products business of ArcelorMittal Costa Rica and its 55% interest in Cimaf Cabos, a cable business in Osasco (São Paulo) Brazil that is currently a branch of Belgo Bekaert Arames (“BBA”) to Bekaert. The transaction also included wire rod supply agreements between the Company and Bekaert, and a cable wire supply agreement between BBA and Bekaert.
• OnMarch25,2014,ArcelorMittalissued €750 million 3.00% Notes due March 25, 2019 under its €3 billion wholesale Euro Medium Term Notes Programme. The uses of proceeds from the issuance were for general corporate purposes.
• OnFebruary26,2014,ArcelorMittal, together with NSSMC, completed the acquisition of ThyssenKrupp Steel USA (“TK Steel USA”), a steel processing plant in Calvert, Alabama, having received all necessary regulatory approvals. The transaction – a 50/50 joint venture, AM/NS Calvert (“Calvert”), with NSSMC – was completed for an agreed price of $1,550 million plus working capital and net debt adjustment. The Calvert plant has a total capacity of 5.3 million tonnes including hot rolling, cold rolling, coating and finishing lines. The transaction was financed through a combination of debt at the joint venture level and equity, of which $258 million was paid by the Company. The transaction includes a six-year agreement to purchase two million tonnes of slab annually from TK CSA, an integrated steel mill complex located in Rio de Janeiro, Brazil, using a market-based price formula. TK CSA has an option to extend the agreement for an additional three years on terms that are more favorable to the joint venture, as compared with the initial time period. The remaining slab balance will be sourced from ArcelorMittal plants in the US, Brazil and Mexico. ArcelorMittal
will be principally responsible for marketing the product on behalf of the joint venture. The price ArcelorMittal will receive for its slabs will be determined by the volume, price and cost performance of the joint venture.
• OnFebruary20,2014,ArcelorMittal redeemed all of its outstanding $650 million subordinated perpetual capital securities following the occurrence of a “Ratings Agency Event”, as defined in the terms of the securities. The notes were redeemed at a redemption price of 101% of the principal amount thereof, plus any interest accrued to but excluding the redemption date.
• OnJanuary17,2014,ArcelorMittal extended the conversion date for the $1 billion privately placed MCB issued on December 28, 2009 by one of its wholly-owned Luxembourg subsidiaries. The mandatory conversion date of the bond has been extended to January 29, 2016. The other main features of the MCB remain unchanged. The bond was placed privately with a Luxembourg affiliate of Crédit Agricole Corporate and Investment Bank and is not listed. The subsidiary has simultaneously executed amendments providing for the extension of the outstanding notes into which it invested the proceeds of the bond issuance, which are linked to shares of the listed companies Eregli Demir Va Celik Fab. T. AS of Turkey and China Oriental, both of which are held by ArcelorMittal subsidiaries.
Recent Developments in Legal Proceedings
Tax Claims
BrazilIn 2011, ArcelorMittal Brasil received a tax assessment for corporate income tax (known as IRPJ) and social contributions on net profits (known as CSL) in relation to (i) the amortization of goodwill on the acquisition of Mendes Júnior Siderurgia (for the
Interim Management Report 31
2006 and 2007 fiscal years), (ii) the amortization of goodwill arising from the mandatory tender offer (MTO) made by ArcelorMittal to minority shareholders of Arcelor Brasil following the two-step merger of Arcelor and Mittal Steel N.V. (for the 2007 tax year), (iii) expenses related to pre-export financing used to finance the MTO, which were deemed by the tax authorities to be unnecessary for ArcelorMittal Brasil since it was used to buy the shares of its own company; and (iv) CSL over profits of controlled companies in Argentina and Costa Rica. The amount claimed totals $583.4 million. On January 31, 2014, the administrative tribunal of first instance found in partial favor of ArcelorMittal Brasil, reducing the penalty component of the assessment from, according to ArcelorMittal Brasil’s calculations, $265.5 million to $140.6 million (as calculated at the time of the assessment), while upholding the remainder of the assessment. The Brazilian Federal Revenue Service has appealed the administrative tribunal’s decision to reduce the amount of the original penalty. ArcelorMittal Brasil has also appealed the administrative tribunal’s decision to uphold the tax authority’s assessment (including the revised penalty component).
In April 2014, Comércio Exterior S.A. (“Comex”), a Brazilian subsidiary of ArcelorMittal, received a tax assessment in the amount of $76.9 million concerning certain deductions made by Comex in relation to the Fundap financial tax incentive; the Brazilian Federal Revenue Service considers that Comex owes corporate income tax (known as IRPJ) and social contributions on net profits (known as CSL) on the amounts deducted. Comex filed its defense in June 2014.
In May 2014, ArcelorMittal Comercializadora de Energia received a tax assessment from the state of Minas Gerais alleging that the company did not
correctly calculate tax credits on interstate sales of electricity from the February 2012 to December 2013 period. The amount claimed totals $59.6 million. ArcelorMittal Comercializadora de Energia filed its defense in June 2014.
Competition/Antitrust Claims
United StatesOn September 12, 2008, Standard Iron Works filed a purported class action complaint in the U.S. District Court in the Northern District of Illinois against ArcelorMittal, ArcelorMittal USA LLC, and other steel manufacturers, alleging that the defendants had conspired to restrict the output of steel products in order to fix, raise, stabilize and maintain prices at artificially high levels in violation of U.S. antitrust law. Other similar direct purchaser lawsuits were also filed in the same court and were consolidated with the Standard Iron Works lawsuit. In 2009, the court denied a motion by ArcelorMittal and the other defendants to dismiss the direct purchaser claims. A hearing on class certification of the direct purchaser claims took place in March/ April 2014 and a decision remains pending. On May 29, 2014, ArcelorMittal entered into an agreement to settle the direct purchaser claims. ArcelorMittal may terminate the settlement agreement if more than a certain percentage of members of the purported plaintiffs’ class opt-out of the settlement. In addition to any opt-out direct purchaser claimants who may pursue their claims, two putative class actions on behalf of indirect purchasers have been filed and are not covered by the settlement of the direct purchaser claims. On June 13, 2014, the court gave its preliminary approval of the settlement and scheduled a hearing for final approval on October 17, 2014.
South AfricaOn September 1, 2009, the South African Competition Commission referred a complaint against four
producers of long carbon steel in South Africa, including ArcelorMittal South Africa, and the South African Iron and Steel Institute to the Competition Tribunal. The complaint referral followed an investigation into alleged collusion among the producers initiated in April 2008, on-site inspections conducted at the premises of some of the producers and a leniency application by Scaw South Africa, one of the producers under investigation. The Competition Commission recommended that the Competition Tribunal impose an administrative penalty against ArcelorMittal South Africa, Cape Gate and Cape Town Iron Steel Works in the amount of 10% of their annual revenues in South Africa and exports from South Africa for 2008. ArcelorMittal filed an application to access the file of the Competition Commission that was rejected. ArcelorMittal is appealing the decision to reject the application, and has applied for a review of that decision and a suspension of the obligation to respond to the referral on the substance pending final outcome on the application for access to the documents. The appeal was upheld by the Competition Appeals Court (CAC) and the matter was referred back to the Competition Tribunal for a determination of confidentiality and scope of access to the documents. The Competition Commission appealed the decision of the CAC, and, on May 31, 2013, the Supreme Court of Appeal dismissed the appeal of the Competition Commission and confirmed the decision of the CAC. In 2014, ArcelorMittal South Africa requested the documents from the Competition Commission, which provided an index thereof. On July 7, 2011, ArcelorMittal filed an application before the Competition Tribunal to set aside the complaint referral based on procedural irregularities. It is too early for ArcelorMittal to assess the potential outcome of the procedure, including the financial impact.
Other Legal Claims
ArgentinaOver the course of 2007 to 2013, the Argentinian Customs Office Authority (Aduana) notified the Company of certain inquiries that it is conducting with respect to prices declared by the Company’s Argentinian subsidiary, Acindar related to iron ore imports. The Customs Office Authority is seeking to determine whether Acindar incorrectly declared prices for iron ore imports from several different Brazilian suppliers and from ArcelorMittal Sourcing on 35 different shipments made between 2002 and 2012. The aggregate amount claimed by the Customs Office Authority in respect of all of the shipments is approximately $165 million. The investigations are subject to the administrative procedures of the Customs Office Authority and are at different procedural stages depending on the filing date of the investigation. By February 2014, in 17 cases, the administrative branch of the Customs Office Authority ruled against Acindar (representing total claims of $29.8 million). These decisions have been appealed to the Argentinian National Fiscal Court.
CanadaIn 2008, two complaints filed by Canadian Natural Resources Limited (“CNRL”) in Calgary, Alberta against ArcelorMittal, ArcelorMittal USA LLC, Mittal Steel North America Inc. and ArcelorMittal Tubular Products Roman S.A were filed. CNRL alleges negligence in both complaints, seeking damages of $56 million and $25 million, respectively. The plaintiff alleges that it purchased a defective pipe manufactured by ArcelorMittal Tubular Products Roman and sold by ArcelorMittal Tubular Products Roman and Mittal Steel North America Inc. In May 2009, in agreement with CNRL, ArcelorMittal and ArcelorMittal USA were dismissed from the cases without prejudice to CNRL’s right to reinstate the parties later if justified. In April 2014, the
Recent Developmentscontinued

32 Interim Management Report
Recent Developmentscontinued
parties participated in a mediation procedure and reached a settlement subject to certain conditions, which have now been satisfied. The proceedings before the Calgary court were formally discontinued in June 2014 and the case is therefore now closed.
ItalyIn January 2010, ArcelorMittal received notice of a claim filed by Finmasi S.p.A. relating to a memorandum of agreement (“MoA”) entered into between ArcelorMittal Distribution Services France (“AMDSF”) and Finmasi in 2008. The MoA provided that AMDSF would acquire certain of Finmasi’s businesses for an amount not to exceed €93 million, subject to the satisfaction of certain conditions precedent, which, in AMDSF’s view, were not fulfilled. Finmasi sued for (i) enforcement of the MoA, (ii) damages of €14 million to €23.7 million or (iii) recovery costs plus quantum damages for Finmasi’s alleged lost opportunity to sell to another
buyer. In September 2011, the court rejected Finmasi’s claims other than its second claim. The court appointed an expert to determine the quantum of damages. In May 2013, the expert’s report was issued and valued the quantum of damages in the range of €37.5 million to €59.5 million. ArcelorMittal appealed the decision on the merits. In May 2014, the Court of Appeals issued a decision rejecting ArcelorMittal’s appeal. On June 20, 2014, ArcelorMittal filed an appeal of the Court of Appeal’s judgment with the Italian Court of Cassation. A hearing in relation to the quantum of damages took place on June 24, 2014 and the judge set a deadline of October 8, 2014 for the parties to file their briefs.
SenegalIn 2007, ArcelorMittal Holdings AG entered into an agreement with the State of Senegal relating to an integrated iron ore mining and related infrastructure project. The Company announced at the time that
implementation of the project would entail an aggregate investment of $2.2 billion. Project implementation did not follow the originally anticipated schedule after initial phase studies and related investments.
The Company engaged in discussions with the State of Senegal about the project over a long period. In early 2011, the parties engaged in a conciliation procedure, as provided for under their agreement, in an attempt to reach a mutually acceptable outcome. Following the unsuccessful completion of this procedure, in May 2011 the State of Senegal commenced an arbitration before the Court of Arbitration of the International Chamber of Commerce, claiming breach of contract and provisionally estimating damages of $750 million. In September 2013, the arbitral tribunal issued its first award ruling that Senegal was entitled to terminate the 2007 agreements. The arbitral tribunal also ruled that a new arbitration phase would be held
relating to the potential liability of ArcelorMittal as well as the amount of any damages which could be awarded to Senegal. The parties have since agreed to settle the dispute.

Interim Management Report 33
Corporate Governance
Please refer to the “Corporate Governance” section of our 2013 Annual Report for a complete overview of our corporate governance practices. The purpose of the present section is solely to describe the events and changes affecting the corporate governance of ArcelorMittal between December 31, 2013 and June 30, 2014.
For a description of the changes to the board of directors of the Company (the “Board of Directors”) after the annual general meeting of shareholders held on May 8, 2014, please refer to “—Board of Directors” below.
Annual general meeting of shareholders held on May 8, 2014
Equity-based compensation The May 8, 2014 annual general meeting of shareholders authorized the Board of Directors to allocate up to 5 million of the Company’s fully paid-up ordinary shares (the “2014 Cap”), and to adopt any rules or measures to implement the Group Management Board Performance Share Unit Plan (the “GMB PSU Plan”).
The GMB PSU Plan is designed to enhance the long-term performance of the Company and align the members of our Group Management Board (“GMB”) to the Company’s objectives. The GMB PSU Plan complements ArcelorMittal’s existing program of annual performance-related bonuses, which is the Company’s reward system for short-term performance and achievements. The main objective of the GMB PSU Plan is to be an effective performance-enhancing scheme for GMB members based on the achievement of ArcelorMittal’s strategy aimed at creating measurable long-term shareholder value.
The members of the GMB including the Chief Executive Officer will be eligible for
Performance Share Unit (“PSU”) grants. The GMB PSU Plan provides for cliff vesting on the third year anniversary of the grant date, under the condition that the relevant GMB member continues to be actively employed by the ArcelorMittal group on that date. If the GMB member is retired on that date or in case of an early retirement by mutual consent, the relevant GMB member will not automatically forfeit PSUs and pro rata vesting will be considered at the end of the vesting period at the sole discretion of the Appointments, Remuneration & Corporate Governance Committee of the Board of Directors. Awards under the GMB PSU Plan are subject to the fulfillment of cumulative performance criteria over a three-year period from the date of the PSU grant. The value of the grant at grant date will equal one year of base salary for the Chief Executive Officer and 80% of base salary for the other GMB members. Each PSU may give right to up to one and half (1.5) shares of the Company, compared to two (2) shares on the previously approved GMB PSU plan.
Fifty percent of the PSUs granted to each GMB member will be eligible to vest based on the Company’s Total Shareholder Return (TSR) defined as the share price at the end of period minus the share price at start of period plus any dividend paid divided by the share price at the start of the period. “Start of period” and “end of period” will be defined by the Appointments, Remuneration & Corporate Governance Committee of the Board of Directors. The TSR will then be compared with the TSR of a peer group of companies and the TSR of the companies forming the S&P 500 Index, each counting for half of the weighting.
• For25%ofPSUs,performanceis compared to the peer group. The percentage of PSUs vesting
will be 50% for achieving 80% of the median TSR, 100% for achieving the median TSR and up to a maximum of 150% for achieving 120% of the median TSR, compared to 200% on the previously approved GMB PSU plan. None of the PSUs will vest if the Company’s TSR performance is below 80% of that of the peer group.
• For25%ofPSUs,performanceis compared to the median of the S&P 500 companies. The percentage of PSUs vesting will be 50% for achieving performance equal to 80% of the median of the S&P 500 companies, 100% for achieving a performance equal to the median of the S&P 500 companies and up to a maximum of 150% for achieving a performance equal to the median of the S&P 500 companies plus an annual outperformance of 2%, compared to 200% and 5% on the previously approved GMB PSU plan. None of the PSUs will vest if the Company’s TSR performance is below 80% of that of the median of the S&P 500 companies.
The other 50% of the criteria to be met to trigger vesting of the PSUs is based on the development of Earnings Per Share (EPS), defined as the amount of earnings per share outstanding compared to a peer group of companies. The percentage of PSUs vesting will be 50% for achievement of 80% of the median EPS, 100% for achieving the median EPS, and up to a maximum of 150% for achieving 120% of the median EPS, compared to 200% on the previously approved GMB PSU plan.
An explanatory presentation is available on www.arcelormittal.com under Investors – Equity investors – Shareholders’ meetings – Annual General Meeting May 8, 2014.
The allocation of PSUs to eligible GMB members is reviewed by the Appointments, Remuneration & Corporate Governance Committee of the Board of Directors, which is comprised of four independent directors, and which makes a proposal and recommendation to the full Board of Directors. The vesting criteria of the PSUs are also monitored by the Appointments, Remuneration & Corporate Governance Committee. The Company will report in its annual reports on the progress of meeting the vesting criteria on each grant anniversary date as well as on the applicable peer group.
The 2014 Cap for the number of PSUs that may be allocated to the GMB members and other retention based grants below the GMB level, if any, is proposed to be set at a maximum of 5 million shares, representing less than 0.28% on a diluted basis and 0.30% of the Company’s issued share capital (net of treasury shares) on an outstanding basis.
Board of Directors The May 8, 2014 annual general meeting of shareholders acknowledged the expiration of the mandates of Mr. Lakshmi N. Mittal, Mr. Lewis B. Kaden, Mr. Antoine Spillmann, Mr. Bruno Lafont and HRH Prince Guillaume of Luxembourg as directors, elected Mr. Michel Wurth as director and re-elected Mr. Lakshmi N. Mittal, Mr. Lewis B. Kaden, Mr. Antoine Spillmann and Mr. Bruno Lafont for a three-year term that will automatically expire at the annual general meeting of shareholders to be held in 2017.
The Board of Directors is composed of 11 directors, of whom ten are non-executive directors and seven are independent directors. The 11 directors are Mr. Lakshmi N. Mittal, Ms. Vanisha Mittal Bhatia, Mr. Antoine Spillmann, Mr. Wilbur
34 Interim Management Report
L. Ross, Mr. Lewis B. Kaden, Mr. Narayanan Vaghul, Mr. Jeannot Krecké, Ms. Suzanne Nimocks, Mr. Bruno Lafont, Mr. Tye Burt and Mr. Michel Wurth. The four non independent directors are Mr. Lakshmi N. Mittal, Ms. Vanisha Mittal Bhatia, Mr. Jeannot Krecké and Mr. Michel Wurth. The Board of Directors comprises one executive director: Mr. Lakshmi N. Mittal, the Chairman and Chief Executive Officer of ArcelorMittal.
None of the members of the Board of Directors, including the executive director, have entered into service contracts with ArcelorMittal or any of its subsidiaries that provide for benefits upon the termination of their mandate.
For additional information on the functioning of the Board of Directors and the composition of its committees, please refer to the 2013 annual report of ArcelorMittal available on www.arcelormittal.com under “Investors – Financial reports – Annual reports.”
Share CapitalShare buy-backThe share buy-back authorization approved by the annual general meeting in May 2010 is valid for five years, i.e., until May 11, 2015, or until the date of its renewal by a resolution of the general meeting of shareholders if such renewal date is prior to the expiration the five-year period. The maximum number of own shares that ArcelorMittal may hold at any time directly or indirectly may not have the effect of reducing its net assets (“actif net”) below the amount mentioned in paragraphs 1 and 2 of Article 72-1 of the Law. The total amount allocated for the Company’s share repurchase program may not in any event exceed the amount of the Company’s then available equity.
In accordance with the Luxembourg laws transposing Directive 2003/6/EC regarding insider dealing and market manipulation (“market abuse”) and EC Regulation 2273/2003 regarding exemptions for buyback programs and stabilization of financial
instruments, any acquisitions, disposals, exchanges, contributions and transfers of shares may be carried out by all means, on or off the market, including by a public offer to buy back shares or by the use of derivatives or option strategies. The fraction of the capital acquired or transferred in the form of a block of shares may amount to the entire program. Buy-back transactions may be carried out at any time, including during a tender offer period. Any share buy-backs on the New York Stock Exchange must be performed in compliance with Section 10(b) and Section 9(a)(2) of the Securities Exchange Act of 1934, as amended (the “Exchange Act”), and Rule 10b-5 promulgated under the Exchange Act.
The purchase price per share paid may not represent more than 125% of the trading price of the shares on the New York Stock Exchange and on the Euronext markets where the Company is listed, the Luxembourg Stock Exchange or the Spanish stock exchanges of Barcelona, Bilbao,
Madrid and Valencia, depending on the market on which the purchases are made, and no less than one cent. For off-market transactions, the maximum purchase price is 125% of the price on the Euronext markets where the Company is listed. The reference price will be deemed to be the average of the final listing prices per share on the relevant stock exchange during 30 consecutive days on which the relevant stock exchange is open for trading preceding the three trading days prior to the date of purchase.
Corporate Governancecontinued

Interim Management Report 35
Cautionary Statement Regarding Forward-Looking Statements
This document may contain forward-looking information and statements about ArcelorMittal and its subsidiaries. These statements include financial projections and estimates and their underlying assumptions, statements regarding plans, objectives and expectations with respect to future operations, products and services, and statements regarding future performance. Forward-looking statements may be identified by the words “believe,” “expect,”
“anticipate,” “target” or similar expressions. Although ArcelorMittal’s management believes that the expectations reflected in such forward-looking statements are reasonable, investors and holders of ArcelorMittal’s securities are cautioned that forward-looking information and statements are subject to numerous risks and uncertainties, many of which are difficult to predict and generally beyond the control of ArcelorMittal, that could cause
actual results and developments to differ materially and adversely from those expressed in, or implied or projected by, the forward-looking information and statements. These risks and uncertainties include those discussed or identified in the filings with the Luxembourg financial and stock market regulator (Commission de Surveillance du Secteur Financier) and the United States Securities and Exchange Commission (the “SEC”).
ArcelorMittal undertakes no obligation to publicly update its forward looking statements, whether as a result of new information, future events, or otherwise.

36 Interim Management Report
We confirm, to the best of our knowledge, that:
1. the condensed consolidated financial statements of ArcelorMittal presented in this Half Year Report 2014, prepared in conformity with International Financial Reporting Standards as issued by the International Accounting Standards Board and as adopted by the European Union, give a true and fair view of the assets, liabilities, financial position, profit or loss of the Company and significant off balance sheet arrangements.
2. the interim management report includes a fair review of the material events that occurred in the first six months of the financial year 2014 and their impact on the interim condensed consolidated financial statements, of the main related party transactions, and a description of the principal risks and uncertainties for the remaining six months of the year.
By order of the Board of Directors
Chief Executive Officer Mr. Lakshmi N. Mittal August 4, 2014
Chief Financial Officer Mr. Aditya Mittal August 4, 2014
Chief executive officer and chief financial officer’s responsibility statement
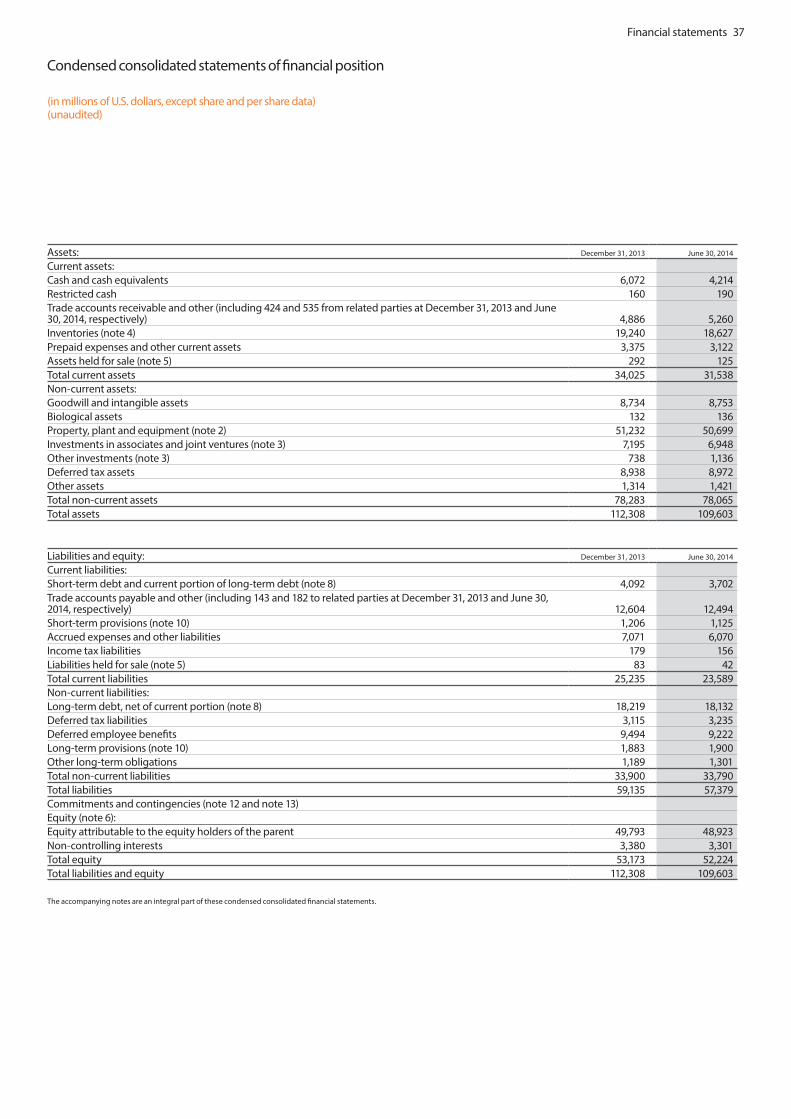
Financial statements 37
(in millions of U.S. dollars, except share and per share data)(unaudited)
Condensed consolidated statements of financial position
Assets: December 31, 2013 June 30, 2014
Current assets:Cash and cash equivalents 6,072 4,214Restricted cash 160 190Trade accounts receivable and other (including 424 and 535 from related parties at December 31, 2013 and June 30, 2014, respectively) 4,886 5,260Inventories (note 4) 19,240 18,627Prepaid expenses and other current assets 3,375 3,122Assets held for sale (note 5) 292 125Total current assets 34,025 31,538Non-current assets:Goodwill and intangible assets 8,734 8,753Biological assets 132 136Property, plant and equipment (note 2) 51,232 50,699Investments in associates and joint ventures (note 3) 7,195 6,948Other investments (note 3) 738 1,136Deferred tax assets 8,938 8,972Other assets 1,314 1,421Total non-current assets 78,283 78,065Total assets 112,308 109,603
Liabilities and equity: December 31, 2013 June 30, 2014
Current liabilities:Short-term debt and current portion of long-term debt (note 8) 4,092 3,702Trade accounts payable and other (including 143 and 182 to related parties at December 31, 2013 and June 30, 2014, respectively) 12,604 12,494Short-term provisions (note 10) 1,206 1,125Accrued expenses and other liabilities 7,071 6,070Income tax liabilities 179 156Liabilities held for sale (note 5) 83 42Total current liabilities 25,235 23,589Non-current liabilities:Long-term debt, net of current portion (note 8) 18,219 18,132Deferred tax liabilities 3,115 3,235Deferred employee benefits 9,494 9,222Long-term provisions (note 10) 1,883 1,900Other long-term obligations 1,189 1,301Total non-current liabilities 33,900 33,790Total liabilities 59,135 57,379Commitments and contingencies (note 12 and note 13)Equity (note 6):Equity attributable to the equity holders of the parent 49,793 48,923Non-controlling interests 3,380 3,301Total equity 53,173 52,224Total liabilities and equity 112,308 109,603
The accompanying notes are an integral part of these condensed consolidated financial statements.

38 Financial statements
(in millions of U.S. dollars, except share and per share data)(unaudited)
Condensed consolidated statements of operations
Six months ended June 30, 2013
Six months ended June 30, 2014
Sales (including 2,417 and 3,111 of sales to related parties for 2013 and 2014, respectively) 39,949 40,492Cost of sales (including depreciation and impairment of 2,336 and 2,011 and purchases from related parties of 635 and 655 for 2013 and 2014, respectively) 37,708 37,517Gross margin 2,241 2,975Selling, general and administrative expenses 1,485 1,469Operating income 756 1,506Income (loss) from investments in associates, joint ventures and other investments (42) 154Financing costs - net (1,634) (1,516)Income (loss) before taxes (920) 144Income tax expense (note 7) 196 217Net income (loss) (including non-controlling interests) (1,116) (73)Net income (loss) attributable to:Equity holders of the parent (1,125) (153)Non-controlling interests 9 80Net income (loss) (including non-controlling interests) (1,116) (73)
Six months ended June 30, 2013
Six months ended June 30, 2014
Earnings (loss) per common share (in U.S. dollars):Basic (0.65) (0.09)Diluted (0.65) (0.09)Weighted average common shares outstanding (in millions):Basic 1,769 1,791Diluted 1,770 1,793
The accompanying notes are an integral part of these condensed consolidated financial statements.

Financial statements 39
(in millions of U.S. dollars, except share and per share data)(unaudited)
Condensed consolidated statements of other comprehensive income
Six months ended June 30, 2013 Six months ended June 30, 2014
Net income (loss) (including non-controlling interests) (1,116) (73)Items that can be recycled to the condensed consolidated statements of operationsAvailable-for-sale investments:Gain (loss) arising during the period (114) 253Reclassification adjustments for (gain) loss included in the condensed consolidated statements of operations - 56
(114) 309Derivative financial instruments: Gain (loss) arising during the period 39 87Reclassification adjustments for (gain) loss included in the condensed consolidated statements of operations (132) 5
(93) 92Exchange differences arising on translation of foreign operations:Gain (loss) arising during the period (1,501) 145Reclassification adjustments for (gain) loss included in the condensed consolidated statements of operations (10) (18)
(1,511) 127Share of other comprehensive income (loss) related to associates and joint ventures:Gain (loss) arising during the period (171) (85)Reclassification adjustments for (gain) loss included in the consolidated statements of operations - (54)
(171) (139)Income tax benefit (expense) related to components of other comprehensive income that can be recycled to the condensed consolidated statements of operations 82 (7)Total other comprehensive income (loss) (1,807) 382
Total other comprehensive income (loss) attributable to:Equity holders of the parent (1,598) 388Non-controlling interests (209) (6)
(1,807) 382Total comprehensive income (loss) (2,923) 309Total comprehensive income (loss) attributable to: Equity holders of the parent (2,723) 235Non-controlling interests (200) 74Total comprehensive income (loss) (2,923) 309The accompanying notes are an integral part of these condensed consolidated financial statements.

40 Financial statements
(in millions of U.S. dollars, except share and per share data)(unaudited)
Condensed consolidated statements of changes in equity
Reserves
Items that can be recycled to the condensed consolidated statements of
operations
Items that cannot be
recycled to the
condensed consolidated
statements of operations
Shares1,2Share
capitalTreasury
shares
Subordinated perpetual
capital securities
Mandatorily convertible
notes
Additional paid-in capital
Retained earnings
Foreigncurrency
translationadjustments
Unrealized gains (losses) on derivative
financial instruments
Unrealized gains (losses) on available-
for-sale securities
Recognized actuarial
losses
Equity attributable
to the equity holders of the parent
Non-controlling
interests Total equity
Balance at December 31, 2012 1,549 9,403
(414) 650 - 19,082 26,186 (2,244) (214) (173) (5,260) 47,016 3,450
50,466
Net loss (including non-controlling interests) - - - - - - (1,125) - - - - (1,125) 9 (1,116)Other comprehensive loss - - - - - - - (1,393) (80) (125) - (1,598) (209) (1,807)Total comprehensive loss - - - - - -
(1,125) (1,393) (80) (125) - (2,723) (200) (2,923)
Offering of common shares 105 608 - - - 1,148 - - - - - 1,756 - 1,756Mandatorily convertible notes - - - - 1,838 - - - - - - 1,838 - 1,838Disposal of 15% interest in ArcelorMittal Mines Canada - - - - - - 726 - - - - 726 374 1,100Dilution in Baffinland - - - - - - - - - - - - (208) (208)Recognition of share based payments - - - - - 9 - - - - - 9 - 9Dividend (0.20 per share) - - - - - - (332) - - - - (332) (9) (341)Coupon on subordinated perpetual capital securities - - - - - - (28) - - - - (28) - (28)Other movements - - - - - - 1 - - - - 1 (7) (6)Balance at June 30, 2013 1,654 10,011
(414) 650 1,838
20,239
25,428 (3,637) (294) (298) (5,260)
48,263 3,400 51,663
Balance at December 31, 2013 1,654 10,011
(414) 650 1,838
20,248
24,037 (2,910) (324) (105) (3,238) 49,793 3,380 53,173
Net income (loss) (including non-controlling interests) - - - - - - (153) - - - - (153) 80 (73)Other comprehensive income (loss) - - - - - - - 7 66 315 - 388 (6) 382Total comprehensive income (loss) - - - - - - (153) 7 66 315 - 235 74 309Redemption of subordinated perpetual capital securities (note 6) - - - (650) - - (7) - - - - (657) - (657)Mandatory convertible bonds extension (see note 6) - - - - - - - - - - - - (47) (47)Option premiums on treasury shares (note 6) - - - - - - (309) - 309 - - - - - Recognition of share based payments - - - - - 12 - - - - - 12 - 12Dividend (0.2 per share) - - - - - - (333) - - - - (333) (49) (382)Coupon on subordinated perpetual capital securities - - - - - (22) - - - - (22) - (22)Other changes in non-controlling interests - - - - - - (40) - - - - (40) (52) (92)Other movements - - - - - - (65) - - - - (65) (5) (70)Balance at June 30, 2014 1,654 10,011 (414) - 1,838
20,260 23,108 (2,903) 51 210 (3,238) 48,923 3,301 52,224
The accompanying notes are an integral part of these condensed consolidated financial statements.
1 Excludes treasury shares2 In million of shares
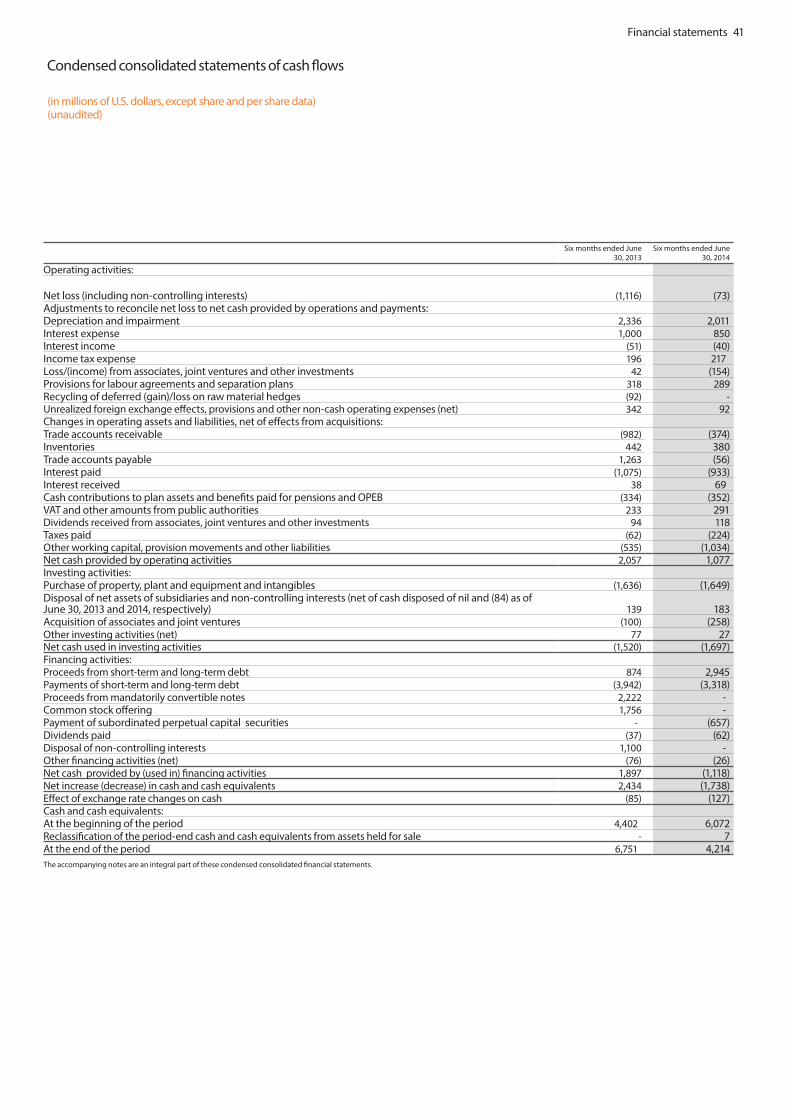
Financial statements 41
(in millions of U.S. dollars, except share and per share data)(unaudited)
Condensed consolidated statements of cash flows
Six months ended June 30, 2013
Six months ended June 30, 2014
Operating activities:
Net loss (including non-controlling interests) (1,116) (73)Adjustments to reconcile net loss to net cash provided by operations and payments:Depreciation and impairment 2,336 2,011Interest expense 1,000 850Interest income (51) (40)Income tax expense 196 217Loss/(income) from associates, joint ventures and other investments 42 (154)Provisions for labour agreements and separation plans 318 289Recycling of deferred (gain)/loss on raw material hedges (92) - Unrealized foreign exchange effects, provisions and other non-cash operating expenses (net) 342 92Changes in operating assets and liabilities, net of effects from acquisitions:Trade accounts receivable (982) (374)Inventories 442 380Trade accounts payable 1,263 (56)Interest paid (1,075) (933)Interest received 38 69Cash contributions to plan assets and benefits paid for pensions and OPEB (334) (352)VAT and other amounts from public authorities 233 291Dividends received from associates, joint ventures and other investments 94 118Taxes paid (62) (224)Other working capital, provision movements and other liabilities (535) (1,034)Net cash provided by operating activities 2,057 1,077Investing activities:Purchase of property, plant and equipment and intangibles (1,636) (1,649)Disposal of net assets of subsidiaries and non-controlling interests (net of cash disposed of nil and (84) as of June 30, 2013 and 2014, respectively) 139 183Acquisition of associates and joint ventures (100) (258)Other investing activities (net) 77 27Net cash used in investing activities (1,520) (1,697)Financing activities:Proceeds from short-term and long-term debt 874 2,945Payments of short-term and long-term debt (3,942) (3,318)Proceeds from mandatorily convertible notes 2,222 - Common stock offering 1,756 - Payment of subordinated perpetual capital securities - (657)Dividends paid (37) (62)Disposal of non-controlling interests 1,100 - Other financing activities (net) (76) (26)Net cash provided by (used in) financing activities 1,897 (1,118)Net increase (decrease) in cash and cash equivalents 2,434 (1,738)Effect of exchange rate changes on cash (85) (127)Cash and cash equivalents:At the beginning of the period 4,402 6,072Reclassification of the period-end cash and cash equivalents from assets held for sale - 7At the end of the period 6,751 4,214The accompanying notes are an integral part of these condensed consolidated financial statements.

42 Financial statements
(in millions of U.S. dollars, except share and per share data)(unaudited)
Note 1: Basis of presentation and accounting policiesPreparation of the condensed consolidated financial statements
The condensed consolidated financial statements of ArcelorMittal and Subsidiaries (“ArcelorMittal” or the “Company”) as of December 31, 2013 and June 30, 2014 as well as for the six months ended June 30, 2013 and 2014 (the “Interim Financial Statements”) have been prepared in accordance with International Accounting Standard (“IAS”) No. 34, “Interim Financial Reporting”. They should be read in conjunction with the annual consolidated financial statements and the notes thereto in the Company’s Annual Report for the year ended December 31, 2013, which have been prepared in accordance with International Financial Reporting Standards (“IFRS”) as issued by the International Accounting Standards Board (“IASB”) and as adopted by the European Union. The Interim Financial Statements are unaudited. They were authorized for issuance on July 31, 2014 by the Company’s Board of Directors.
Accounting policies
The Interim Financial Statements have been prepared on a historical cost basis, except for available for sale financial assets, derivative financial instruments and biological assets, which are measured at fair value less cost to sell, and inventories, which are measured at the lower of net realizable value or cost. Unless specifically described herein, the accounting policies used to prepare the Interim Financial Statements are the policies described in note 2 of the consolidated financial statements for the year ended December 31, 2013.
On January 1, 2014, the Company implemented changes to its organizational structure which has a greater geographical focus. The principal benefits of the changes are to reduce organizational
complexity and layers; simplification of processes; regional synergies and taking advantage of the scale effect within the regions.
As a result of the organizational changes, the Company’s reportable segments changed to NAFTA, Brazil, Europe, ACIS and Mining. NAFTA includes the Flat, Long and Tubular operations of the USA, Canada and Mexico. Brazil includes the Flat operations of Brazil and the Long and Tubular operations of Brazil and its neighboring countries including Argentina, Costa Rica, Trinidad and Tobago and Venezuela. Europe is comprised of the Flat, Long and Tubular operations of the European business, as well as Distribution Solutions (AMDS). The ACIS segment is largely unchanged except the addition of some Tubular operations and distribution activities (ArcelorMittal International). The Mining segment remains unchanged. The changes in reportable segments are presented in note 11.
Adoption of new IFRS standards and interpretations applicable from January 1, 2014
On January 1, 2014, the Company adopted the following amendments and interpretation which did not have any material impact on the financial statements of the Company:
• AmendmentstoIAS32“Financial Instruments: Presentation”, issued on December 16, 2011, clarifies the application of the offsetting of financial assets and financial liabilities requirement.
• AmendmentstoIFRS10“Consolidated Financial Statements”, IFRS 12 “Disclosure of Interests in Other Entities” and IAS 27 “Separate Financial Statements”, issued on October 31, 2012, clarifies the definition and measurement of investment entities.
• OnMay20,2013,theIASBissuedIFRIC Interpretation 21 “Levies”, issued on May 20, 2013, clarifies
the recognition and measurement of levies.
• OnJune27,2013,theIASBpublished Amendments to IAS 39 “Financial Instruments: Recognition and Measurement”, issued on June 27, 2013, clarifies the treatment of hedge accounting.
The preparation of consolidated financial statements in conformity with IFRS recognition and measurement principles requires the use of estimates and assumptions that affect the reported amounts of assets, liabilities, revenues and expenses. Management reviews its estimates on an ongoing basis using currently available information. Changes in facts and circumstances or obtaining new information or more experience may result in revised estimates, and actual results could differ from those estimates.
Notes to the condensed consolidated financial statements for the six months ended June 30, 2014

Financial statements 43
(in millions of U.S. dollars, except share and per share data)(unaudited)
Note 2: Property, plant and equipmentDuring the period ended June 30, 2014, the Company performed a review of the useful lives of its assets and determined its maintenance and operating practices have enabled a change in the useful lives of plant and equipment. Maintenance practices employed have served to preserve and extend
the operating life of certain of these assets, while operating practices in the current economic environment have also contributed to the extension of asset useful life beyond previous estimates. The Company thus revised the useful lives due to its determination that certain of its existing assets have been used longer than previously anticipated and therefore, the estimated useful lives of certain
plant and equipment have been lengthened. The previously applied useful lives and the revised ones are presented in the table below. The Company applied this change in accounting estimate prospectively as of January 1, 2014, in accordance with IAS 8 “Accounting Policies, Changes in Accounting Estimates and Errors”. The reduction of depreciation charge as a result of changes in estimated useful lives for
the six months ended June 30, 2014 was approximately 350. The Company expects the depreciation charge for the current year and future years to decrease by approximately 700 as compared to the amounts that would have been charged if no change in estimate occurred.
Note 3: Investments in associates, joint ventures and other investmentsOn April 30, 2014, following simultaneously with the exercise by Deutsche Bank of its put option with respect to a 7.5% stake in China Oriental Group Company Ltd (“China Oriental”) acquired on April 30, 2008 from ArcelorMittal in connection with a sale and purchase agreement it entered into with ArcelorMittal to restore the restoration of the public float of China Oriental on the Hong Kong Stock Exchange (“HKSE”), the Company sold this investment to Macquarie Bank and entered into a put option arrangement with the latter maturing on April 30, 2015. The Company extended the existing put option agreement with ING in relation to a further 9.9% stake in China Oriental for one year. Accrued expenses and other liabilities and prepaid expenses and other current assets decreased by 312 as a result of these changes. The Company has not derecognized the 17.4% stake in respect of China Oriental as it has retained its exposure to that the significant risk and rewards of the investment through the put options.
On February 8, 2014, the Company’s interest in the associate Hunan Valin Steel Tube and Wire Co. Ltd. (“Hunan Valin”) decreased from 20% to 15% following the exercise of the third put option granted by Hunan Valin Iron & Steel Group Co, Ltd. Accordingly, the Company discontinued the accounting for its investment under the equity method and reclassified its interest as available-for-sale within other investments in the statement of financial position. The resulting loss on disposal was recorded as income (loss) from investments in associates, joint ventures and other investments and amounted to 76. This amount consisted of a gain of 13 on disposal of the 5% stake and the reclassification of the accumulated positive foreign exchange translation difference from other comprehensive income to the statements of operations of 61, offset by a loss of 150 with respect to the remeasurement at fair value of the remaining interest of 15%. As of June 30, 2014, the fair value and the other comprehensive income related to Hunan Valin investment were 141 and 5, respectively. The Company also recognized a gain of 64 in relation to the fourth and last put option
with an exercise date August 6, 2014, which is a level 2 financial instrument with a carrying value of 64 as of June 30, 2014.
On February 26, 2014, the Company together with Nippon Steel & Sumitomo Metal Corporation (“NSSMC”) completed the acquisition of ThyssenKrupp Steel USA (“TK Steel USA”), a steel processing plant in Calvert, Alabama, USA, for a total consideration of 1,550 financed through a combination of debt at entity level and equity, of which 258 was paid by ArcelorMittal. The Company concluded that it has joint control of the arrangement, AM/NS Calvert (“Calvert”), together with NSSMC and accounted for its 50% interest in the joint venture under the equity method. The transaction includes a six-year agreement to purchase two million tonnes of slab annually from TK CSA, an integrated steel mill complex located in Rio de Janeiro, Brazil, using a market-based price formula. TK CSA has an option to extend the agreement for an additional three years on terms that are more favorable to the joint venture, as compared with the initial time period. The remaining
slab balance will be sourced from ArcelorMittal plants in the US, Brazil and Mexico. ArcelorMittal will be principally responsible for marketing the product on behalf of the joint venture. The price ArcelorMittal will receive for its slabs will be determined by the volume, price and cost performance of the joint venture. The carrying amount and the net income of Calvert were 297 as of June 30, 2014 and 33 for the six months ended June 30, 2014, respectively.
The Company concluded that its investment in Ereğli Demir ve Çelik Fabrikalari T.A.S. (“Erdemir”) experienced a prolonged decline in fair value that remained continuously below cost for more than two years. Accordingly, it recorded an impairment charge of 56 in income from investments in associates, joint ventures and other investments. Following the subsequent increase in the fair value of Erdemir, the Company recorded a revaluation gain of 213 in other comprehensive income at June 30, 2014.
Asset Category Former Useful Life Range Revised Useful Life RangeLand Not depreciated Not depreciatedBuildings 10 to 50 years 10 to 50 yearsProperty plant & equipment 15 to 30 years 15 to 50 yearsAuxiliary facilities 15 to 30 years 15 to 40 yearsOther facilities 5 to 20 years 5 to 20 years
There were no impairment charges recorded during the six months ended June 30, 2014. Impairment charges for the six months ended June 30, 2013 amounted to 39 and were primarily related to the closure of the organic coating and tin plate lines in the Florange site in France, which is part of the Europe reportable segment.
Notes to the condensed consolidated financial statements for the six months ended June 30, 2014continued

44 Financial statements
(in millions of U.S. dollars, except share and per share data)(unaudited)
Note 4: Inventories Inventory, net of the allowance for slow-moving inventory, excess of cost over net realizable value and obsolescence as of December 31, 2013 and June 30, 2014, is comprised of the following:
December 31, 2013 June 30, 2014
Finished products 6,523 6,857Production in process 4,350 4,054Raw materials 6,590 5,896Manufacturing supplies, spare parts and other 1,777 1,820Total 19,240 18,627
The amount of write-downs of inventories to net realizable value recognized as an expense was 447 and 363 during the six months ended June 30, 2013 and 2014, respectively.
Note 5: Assets and liabilities held for saleOn July 10, 2014, the Company signed an agreement to sell its wholly-owned subsidiary Circuit Foil Luxembourg, which manufactures electrodeposited copper foils for the electronics industry, and certain of its subsidiaries (“Circuit Foil”) to Doosan Corporation, a South Korean conglomerate. Accordingly, the related assets and liabilities were classified as held for sale at June 30, 2014. The agreed cash consideration amounts to 50. Circuit Foil was included in the Europe reportable segment.
On June 30, 2014, ArcelorMittal completed the sale of its 78% stake in the European port handling and logistics company ATIC Services S.A. (“ATIC”) for €155 million (144 net of cash of 68 disposed of) to H.E.S. Beheer, who held the remaining 22% non-controlling interest. ATIC was part of the Europe reportable segment.
On May 30, 2014, the Company completed the disposal of its 50% stake in the joint venture Kiswire ArcelorMittal Ltd. (“Kiswire”) in South Korea and certain other entities of its steel cord business in the US, Europe and Asia to Kiswire Ltd. These various entities were part of the Europe reportable segment. On the closing date, the Company received a preliminary cash consideration of 55 (39 net of cash of 16 disposed of) subject to revision upon final determination of
net debt and working capital situation on closing date. The existing intra group debt of the sold subsidiaries of 102 was assumed by Kiswire and will be repaid at the latest during the first half of 2015.
On April 30, 2014, the Company completed the extension of its partnership with Bekaert Group (“Bekaert”) in Latin America to Costa Rica and Ecuador. It transferred 73% of the wire business of ArcelorMittal Costa Rica and its 55% interest in Cimaf Cabos, a cable business in Osasco (São Paulo) Brazil, previously a branch of Belgo Bekaert Arames (“BBA”), to Bekaert. ArcelorMittal acquired a 27% non-controlling interest in the Ideal Alambrec Ecuador plant controlled by Bekaert. The two transferred businesses were part of the Brazil reportable segment.
The result on disposal for the above mentioned disposals was immaterial. The aggregate net assets disposed of amounted to 198.
Note 6: EquityShare capitalFollowing the completion of an offering of ordinary shares on January 14, 2013, ArcelorMittal increased share capital by €455 (608) from €6,428 (9,403) to €6,883 (10,011) through the issuance of 104,477,612 new shares fully paid up. The aggregate number of shares issued and fully paid up increased to 1,665,392,222. The
ordinary shares do not have a nominal value.
Authorized share capitalAt the Extraordinary General Meeting held on May 8, 2013, the shareholders approved an increase of the authorized share capital of ArcelorMittal by €524 million represented by 223 million shares, or approximately 8% of ArcelorMittal’s outstanding capital. Following this approval, which is valid for five years, the total authorized share capital was €8.2 billion represented by 1,996 million shares without nominal value.
Treasury sharesArcelorMittal held, indirectly and directly, approximately 11.8 million and 11.8 million treasury shares as of December 31, 2013 and June 30, 2014, respectively.
DividendsThe dividend for the full year of 2014 amounted to 333 and was paid on July 15, 2014. For the six months ended June 30, 2013, dividend payments of 332 were made on July 15, 2013.
Option premium on USD convertible bondsThe Company reclassified from reserves to retained earnings premiums paid for an amount of 435 (309 net of tax) with respect to expired USD denominated call options on treasury shares acquired on December 18, 2010 in order to hedge its obligations arising from the potential conversion of the 800
Convertible Senior Notes into ArcelorMittal shares.
Mandatorily convertible notesOn January 16, 2013, ArcelorMittal issued mandatorily convertible subordinated notes (“MCNs”) with net proceeds of 2,222. The notes have a maturity of 3 years, were issued at 100% of the principal amount and are mandatorily converted into ordinary shares of ArcelorMittal at maturity unless converted earlier at the option of the holders or ArcelorMittal or upon specified events in accordance with the terms of the MCNs. The MCNs pay a coupon of 6.00% per annum, payable quarterly in arrears. The minimum conversion price of the MCNs was set at $16.75, corresponding to the placement price of shares in the concurrent ordinary shares offering as described above, and the maximum conversion price was set at approximately 125% of the minimum conversion price (corresponding to $20.94). The minimum and maximum conversion prices are subject to adjustment upon the occurrence of certain events, and were, as of June 30, 2014, $16.28 and $20.36, respectively. The Company determined the notes met the definition of a compound financial instrument and as such determined the fair value of the financial liability component of the bond was 384 on the date of issuance and recognized it as long-term obligation. The value of the equity component of 1,838 was determined based upon the difference of the cash proceeds
Notes to the condensed consolidated financial statements for the six months ended June 30, 2014continued

Financial statements 45
(in millions of U.S. dollars, except share and per share data)(unaudited)
received from the issuance of the bond and the fair value of the financial liability component on the date of issuance and is included in equity.
Subordinated perpetual capital securitiesOn September 28, 2012, the Company issued subordinated perpetual capital securities for a nominal amount of 650 and a coupon of 8.75%, which was to be reset periodically over the life of the securities. As the Company had no obligation to redeem the securities and the coupon payment was to be deferred by the Company under certain circumstances, it classified the net proceeds from the issuance of subordinated perpetual capital securities (642 net of transaction costs) as equity. Coupon payments to holders of subordinated perpetual capital securities for the six month periods ended June 30,
2013 and 2014 were 28 and 22, respectively.
On February 20, 2014, ArcelorMittal redeemed all of its outstanding 650 subordinated perpetual capital securities following the occurrence of a “Ratings Agency Event”, as defined in the terms of the securities. The notes were redeemed for 657, at a redemption price of 101% of the principal amount, plus accrued interest of 22.
Mandatory convertible bondsOn January 17, 2014, the conversion date of the 1,000 mandatory convertible bonds was extended from January 31, 2014 to January 29, 2016. The Company determined that this transaction led to the extinguishment of the existing compound instrument and the recognition of a new compound instrument including non-controlling interests for 902 (net of tax and fees) and debt for 91. The
difference between the carrying amount of the previous instrument and the fair value of the new instrument amounted to 49 and was recognized as financing costs in the consolidated statements of operations.
Note 7: Income taxThe tax expense for the period is based on an estimated annual effective rate, which requires management to make its best estimate of annual pre-tax income for the year. During the year, management regularly updates its estimates based on changes in various factors such as geographical mix of operating profit, prices, shipments, product mix, plant operating performance and cost estimates, including labor, raw materials, energy and pension and other postretirement benefits.
The income tax expense was 196 and 217 for the six months ended June 30, 2013 and 2014, respectively.
Note 8: Short-term and long-term debt Short-term debt, including the current portion of long-term debt, consisted of the following:
December 31, 2013 June 30, 2014
Short-term bank loans and other credit facilities including commercial paper* 545 1,581Current portion of long-term debt 3,491 2,059Lease obligations 56 62Total 4,092 3,702
* The weighted average interest rate on short term borrowings outstanding were 4.1% and 5.6% as of December 31, 2013 and June 30, 2014, respectively.
Short-term bank loans and other credit facilities include short-term loans, overdrafts and commercial paper.
During the six months ended June 30, 2014, ArcelorMittal entered into short-term committed bilateral credit facilities totaling approximately $0.9 billion. As of June 30, the facilities remain fully available.
On June 10, 2014, ArcelorMittal entered into a new bank loan for an amount of $1 billion. The credit institution has the right to demand repayment of the loan once per year, starting February 2015, until the final maturity date on April 20, 2017. Accordingly, the loan was classified as current liabilities.
Notes to the condensed consolidated financial statements for the six months ended June 30, 2014continued

46 Financial statements
(in millions of U.S. dollars, except share and per share data)(unaudited)
Notes to the condensed consolidated financial statements for the six months ended June 30, 2014continued
The Company’s long-term debt consisted of the following: Year of maturity Type of interest Interest rate1 December 31, 2013 June 30, 2014
Corporate 3.6 billion Revolving Credit Facility 2016 Floating - - 2.4 billion Revolving Credit Facility 2018 Floating - - €1.25 billion Convertible Bonds 2014 Fixed 7.25% 1,692 - 800 Convertible Senior Notes 2014 Fixed 5.00% 780 - €0.1 billion Unsecured Bonds 2014 Fixed 5.50% 138 137€0.36 billion Unsecured Bonds 2014 Fixed 4.63% 497 492750 Unsecured Notes 2015 Fixed 9.50% 747 7491.0 billion Unsecured Bonds 2015 Fixed 4.25% 996 997500 Unsecured Notes 2015 Fixed 4.25% 499 499500 Unsecured Notes 2016 Fixed 4.25% 498 499€1.0 billion Unsecured Bonds 2016 Fixed 10.63% 1,373 1,361€1.0 billion Unsecured Bonds 2017 Fixed 5.88% 1,371 1,3591.4 billion Unsecured Notes 2017 Fixed 5.00% 1,394 1,3951.5 billion Unsecured Notes 2018 Fixed 6.13% 1,500 1,500€0.5 billion Unsecured Notes 2018 Fixed 5.75% 686 6791.5 billion Unsecured Notes 2019 Fixed 10.35% 1,471 1,473€750 billion Unsecured Bonds 2019 Fixed 3.00% - 1,0161.0 billion Unsecured Bonds 2020 Fixed 5.75% 986 9871.5 billion Unsecured Notes 2021 Fixed 6.00% 1,487 1,4881.1 billion Unsecured Notes 2022 Fixed 6.75% 1,089 1,0891.5 billion Unsecured Bonds 2039 Fixed 7.50% 1,465 1,4651.0 billion Unsecured Notes 2041 Fixed 7.25% 983 983Other loans 2014-2021 Fixed 3.46%-3.75% 77 69EBRD loans 2015 Floating 1.24% 25 17EIB loan 2016 Floating 1.71% 345 341300 Term Loan Facility 2016 Floating 2.08% - 300ICO loan 2017 Floating 2.83% 68 57Other loans 2015-2035 Floating 0.00%-2.47% 177 160Total Corporate 20,344 19,112Americas600 Senior Unsecured Notes 2014 Fixed 6.50% 188 - Other loans 2014-2026 Fixed/ Floating 0.78%-15.08% 448 366Total Americas 636 366Europe, Asia & AfricaOther loans 2014-2025 0.00%-13.75% 31 46Total Europe, Asia & Africa Fixed/ Floating 31 46Total 21,011 19,524Less current portion of long-term debt (3,491) (2,059)Total long-term debt (excluding lease obligations) 17,520 17,465Lease obligations 2 699 667Total long-term debt, net of current portion 18,219 18,132
1 Rates applicable to balances outstanding at June 30, 2014.2 Net of current portion of 56 and 62 as of December 31, 2013 and June 30, 2014, respectively.

Financial statements 47
(in millions of U.S. dollars, except share and per share data)(unaudited)
Notes to the condensed consolidated financial statements for the six months ended June 30, 2014continued
Corporate 3.6 billion Revolving Credit Facility On March 18, 2011, ArcelorMittal entered into a $6 billion facility, a syndicated revolving credit facility which may be utilized for general corporate purposes and which matures in 2016. On November 26, 2013, the facility was amended and reduced to $3.6 billion. As of June 30, 2014, the $3.6 billion Revolving Credit Facility remains fully available.
2.4 billion Revolving Credit Facility On May 6, 2010, ArcelorMittal entered into a $4 billion facility, a syndicated revolving credit facility which may be utilized for general corporate purposes. On November 26, 2013, the facility was amended and reduced to $2.4 billion and the maturity date extended to November 6, 2018. As of June 30, 2014, the $2.4 billion Revolving Credit Facility remains fully available.
Bonds On March 25, 2014, ArcelorMittal completed the offering of €750 million 3% Notes due March 25, 2019 issued under the €3 billion wholesale Euro Medium Term Notes Programme. The proceeds of the issuance were used for general corporate purposes.
On April 1, 2014, at maturity, ArcelorMittal repaid its €1.25 billion 7.25% unsecured and unsubordinated Convertible bonds. Additional information on the call options on the €1.25 billion Convertible bonds is set forth in Note 9.
On April 15, 2014, at maturity, ArcelorMittal repaid the remaining outstanding amount of 188.5 of its 600 6.50% Unsecured Notes.
On May 15, 2014, at maturity, ArcelorMittal repaid its 800 5.00% unsecured and unsubordinated Convertible Senior Notes. Additional information on the call options on the 800 Convertible Senior Notes is set forth in Note 6.
On July 4, 2014, ArcelorMittal completed the offering of €600 million 2.875% Notes due July 6, 2020 issued under the €3 billion wholesale Euro Medium Term Notes Programme. The proceeds of the issuance were used for general corporate purposes.
Other On December 20, 2013, ArcelorMittal entered into a term loan facility in an aggregate amount of 300, with a final repayment date on December 20, 2016. The facility may be used by the Group for general corporate purposes and amounts repaid under the agreement may not be re-borrowed. As of June 30, 2014, the term loan facility was fully drawn.
Certain debt agreements of the Company or its subsidiaries contain certain restrictive covenants. Among other things, these covenants limit encumbrances on the assets of ArcelorMittal and its subsidiaries, the ability of ArcelorMittal’s subsidiaries to incur debt and ArcelorMittal’s ability to dispose of assets in certain circumstances. Certain of these agreements also
require compliance with a financial covenant.
The Company’s principal credit facilities (2.4 billion Revolving Credit Facility, 3.6 billion Revolving Credit Facility and certain borrowing agreements) include the following financial covenant: the Company must ensure that the ratio of “Consolidated Total Net Borrowings” (consolidated total borrowings less consolidated cash and cash equivalents) to “Consolidated EBITDA” (the consolidated net pre-taxation profits of the Company for a Measurement Period, subject to certain adjustments as defined in the facilities) does not, at the end of each “Measurement Period” (each period of 12 months ending on the last day of a financial half-year or a financial year of the Company), exceed a certain ratio, currently 4.25 to 1 and 3.5 to 1 depending on the borrowing agreement.
The Company was in compliance with the financial covenants contained in the agreements related to all of its borrowings as of June 30, 2014.

48 Financial statements
(in millions of U.S. dollars, except share and per share data)(unaudited)
Notes to the condensed consolidated financial statements for the six months ended June 30, 2014continued
Note 9: Financial instruments The Company enters into derivative financial instruments to manage its exposure to fluctuations in interest rates, exchange rates and the price of raw materials, energy and emission rights allowances arising from operating, financing and investment activities.
Fair values versus carrying amounts The estimated fair values of certain financial instruments have been determined using available market information or other valuation methodologies that require judgment in interpreting market data and developing estimates. The following tables summarize assets and liabilities based on their categories at June 30, 2014.
Carrying amount in
statements of financial
position
Non-financial assets and
liabilitiesLoan and
receivables
Liabilities at amortized
cost
Fair value recognized in
profit or lossAvailable-for-
sale assets DerivativesASSETS Current assets: Cash and cash equivalents 4,214 - 4,214 - - - - Restricted cash 190 - 190 - - - - Trade accounts receivable and other 5,260 - 5,260 - - - - Inventories 18,627 18,627 - - - - -
Prepaid expenses and other current assets 3,122 1,778 1,138 206Assets held for sale 125 125 - - - - Total current assets 31,538 20,530 10,802 - - - 206
Non-current assets:Goodwill and intangible assets 8,753 8,753 - - - - - Biological assets 136 - - - 136 - - Property, plant and equipment 50,699 50,699 - - - - - Investments in associates and joint ventures 6,948 6,948 - - - - - Other investments 1,136 - - - - 1,136 - Deferred tax assets 8,972 8,972 - - - - - Other assets 1,421 506 816 - - - 99Total non-current assets 78,065 75,878 816 - 136 1,136 99Total assets 109,603 96,408 11,618 - 136 1,136 305
LIABILITIES AND EQUITY
Current liabilities:Short-term debt and current portion of long-term debt 3,702 - - 3,702 - - - Trade accounts payable and other 12,494 - - 12,494 - - - Short-term provisions 1,125 1,103 - 22 - - - Accrued expenses and other liabilities 6,070 1,410 - 4,567 - - 93Income tax liabilities 156 156 - - - - - Liabilities held for sale 42 42 - - - - - Total current liabilities 23,589 2,711 - 20,785 - - 93
Non-current liabilities:Long-term debt, net of current portion 18,132 - - 18,132 - - - Deferred tax liabilities 3,235 3,235 - - - - - Deferred employee benefits 9,222 9,222 - - - - - Long-term provisions 1,900 1,877 - 23 - - - Other long-term obligations 1,301 412 - 887 - - 2Total non-current liabilities 33,790 14,746 - 19,042 - - 2
Equity:Equity attributable to the equity holders of the parent 48,923 48,923 - - - - - Non-controlling interests 3,301 3,301 - - - - - Total equity 52,224 52,224 - - - - - Total liabilities and equity 109,603 69,681 - 39,827 - - 95

Financial statements 49
(in millions of U.S. dollars, except share and per share data)(unaudited)
Notes to the condensed consolidated financial statements for the six months ended June 30, 2014continued
The following table summarizes the reconciliation of the fair value of the call option on the 1,000 mandatory convertible bonds as of December 31, 2013 and June 30, 2014:
€1.25 billion convertible
bondEuro-denominated call
option on treasury sharesCall option on 1,000 mandatory
convertible bonds Total
Balance as of December 31, 2012 (25) 25 12 12 Change in fair value 14 (14) (11) (11)Foreign exchange - - - - Balance as of June 30, 2013 (11) 11 1 1 Balance as of December 31, 2013 - - - - Balance of MCB call option as of January 17, 2014 (extension) 32 32 Change in fair value - - 51 51 Balance as of June 30, 2014 - - 83 83
As a result of the repayment of the €1.25 billion Convertible Bonds on April 1, 2014, the euro-denominated call options on treasury shares acquired on December 14, 2010 expired.
The following tables summarize the bases used to measure certain assets and liabilities at their fair value.
As of December 31, 2013 As of June 30, 2014 Level 1 Level 2 Level 3 Total Level 1 Level 2 Level 3 TotalAssets at fair value: Available-for-sale financial assets 522 - - 522 919 - - 919Derivative financial current assets - 64 - 64 - 206 - 206Derivative financial non-current assets - 7 - 7 - 16 83 99Total assets at fair value 522 71 - 593 919 222 83 1,224Liabilities at fair value:Derivative financial current liabilities - 206 - 206 - 93 - 93Derivative financial non-current liabilities - 1 - 1 - 2 - 2Total liabilities at fair value - 207 - 207 - 95 - 95
Available-for-sale financial assets classified as Level 1 refer to listed securities quoted in active markets. A quoted market price in an active market provides the most reliable evidence of fair value and is used without adjustment to measure fair value whenever available, with limited exceptions. The total fair value is either the price of the most recent trade at the time of the market close or the official close price as defined by the exchange on which the asset is most actively traded on the last trading day of the period, multiplied by the number of units held without consideration of transaction costs. The increase in the available-for-sale financial assets is related to the reclassification of Hunan Valin under this account following the decrease in the Company’s stake in February 2014, and an increase in the share price of Erdemir.
Derivative financial assets and liabilities classified as Level 2 refer to instruments to hedge fluctuations in interest rates, foreign exchange rates, raw materials (base metal), freight, energy, emission rights and equity. The total fair value is based on the price a dealer would pay or receive for the security or similar securities, adjusted for any terms specific to that asset or liability. Market inputs are obtained from well-established and recognized vendors of market data and the fair value is calculated using standard industry models based on significant observable market inputs such as foreign exchange rates, commodity prices, swap rates and interest rates.
Derivative financial assets classified as Level 3 refer to the call option on the 1,000 mandatory convertible bonds. The fair valuation of Level 3 derivative instruments is established at each reporting date in relation to which an analysis is performed in respect of changes in the fair value measurement since the last period. ArcelorMittal’s valuation policies for Level 3 derivatives are an integral part of its internal control procedures and have been reviewed and approved according to the Company’s principles for establishing such procedures. In particular, such procedures address the accuracy and reliability of input data, the accuracy of the valuation model and the knowledge of the staff performing the valuations.
ArcelorMittal establishes the fair valuation of the 1,000 mandatory convertible bonds (“MCB”) through the use of binomial valuation models. Binomial valuation models use an iterative procedure to price options, allowing for the specification of nodes, or points in time, during the time span between the valuation date and the option’s expiration date. In contrast to the Black-Scholes model, which provides a numerical result based on inputs, the binomial model allows for the calculation of the asset and the option for multiple periods along with the range of possible results for each period. On January 17, 2014, the Company extended the conversion date of the mandatory convertible bonds and the maturity date of the call option on the mandatory convertible bonds from January 31, 2014, to January 29, 2016.
Observable input data used in the valuations include zero coupon yield curves, stock market prices, European Central Bank foreign exchange fixing rates and Libor interest rates. Unobservable inputs are used to measure fair value to the extent that relevant observable inputs are not available. Specifically the Company computes unobservable volatility data based mainly on the movement of stock market prices observable in the active market over 90 working days.

50 Financial statements
(in millions of U.S. dollars, except share and per share data)(unaudited)
Portfolio of Derivatives The Company manages the counter-party risk associated with its instruments by centralizing its commitments and by applying procedures which specify, for each type of transaction and underlying, risk limits and/or the characteristics of the counter-party. The Company does not generally grant to or require from its counter-parties guarantees of the risks incurred. Allowing for exceptions, the Company’s counter-parties are part of its financial partners and the related market transactions are governed by framework agreements (mainly of the International Swaps and Derivatives Association agreements which allow netting only in case of counter-party default). Accordingly, derivative assets and derivative liabilities are not offset.
The portfolio associated with derivative financial instruments classified as Level 2 as of December 31, 2013 is as follows:
Assets Liabilities Notional Amount Fair Value Average Rate* Notional Amount Fair Value Average Rate*Interest rate swaps - fixed rate borrowings/loans 188 3 4.55% 339 (11) 1.17%Other interest rate instruments - - 20 - Total interest rate instruments 3 (11)Foreign exchange rate instrumentsForward purchase of contracts 49 2 5,323 (85)Forward sale of contracts 396 13 83 (2)Currency swaps purchases 641 5 641 (72)Exchange option purchases 184 12 - - Exchange options sales - 167 (11)Total foreign exchange rate instruments 32 (170)Raw materials (base metal), freight, energy, emission rightsTerm contracts sales 44 4 153 (16)Term contracts purchases 458 32 196 (10)Total raw materials (base metal), freight, energy, emission rights 36 (26)Total 71 (207)
* The average rate is determined for fixed rate instruments on the basis of the U.S. dollar and foreign currency rates and for the variable rate instruments generally on the basis of Euribor or Libor.
Notes to the condensed consolidated financial statements for the six months ended June 30, 2014continued

Financial statements 51
(in millions of U.S. dollars, except share and per share data)(unaudited)
Notes to the condensed consolidated financial statements for the six months ended June 30, 2014continued
The portfolio associated with derivative financial instruments classified as Level 2 as of June 30, 2014 is as follows:
Assets Liabilities
Notional Amount Fair Value Average Rate* Notional Amount Fair Value Average Rate*Interest rate swaps - fixed rate borrowings/loans 1,249 4 6.14% 50 (1) 1.60%Total interest rate instruments 4 (1)Equity InstrumentsEquity option purchases 370 64 - Total equity instruments 64 - Foreign exchange rate instrumentsForward purchase of contracts 3,366 37 4,231 (18)Forward sale of contracts 1,632 11 346 (4)Currency swaps purchases 546 22 330 (48)Exchange option purchases 143 7 23 - Exchange options sales 14 - 152 (5)Total foreign exchange rate instruments 77 (75)Raw materials (base metal), freight, energy, emission rightsTerm contracts sales 58 3 214 (16)Term contracts purchases 581 74 103 (3)Total raw materials (base metal), freight, energy, emission rights 77 (19)Total 222 (95)
* The average rate is determined for fixed rate instruments on the basis of the U.S. dollar and foreign currency rates and for the variable rate instruments generally on the basis of Euribor or Libor.
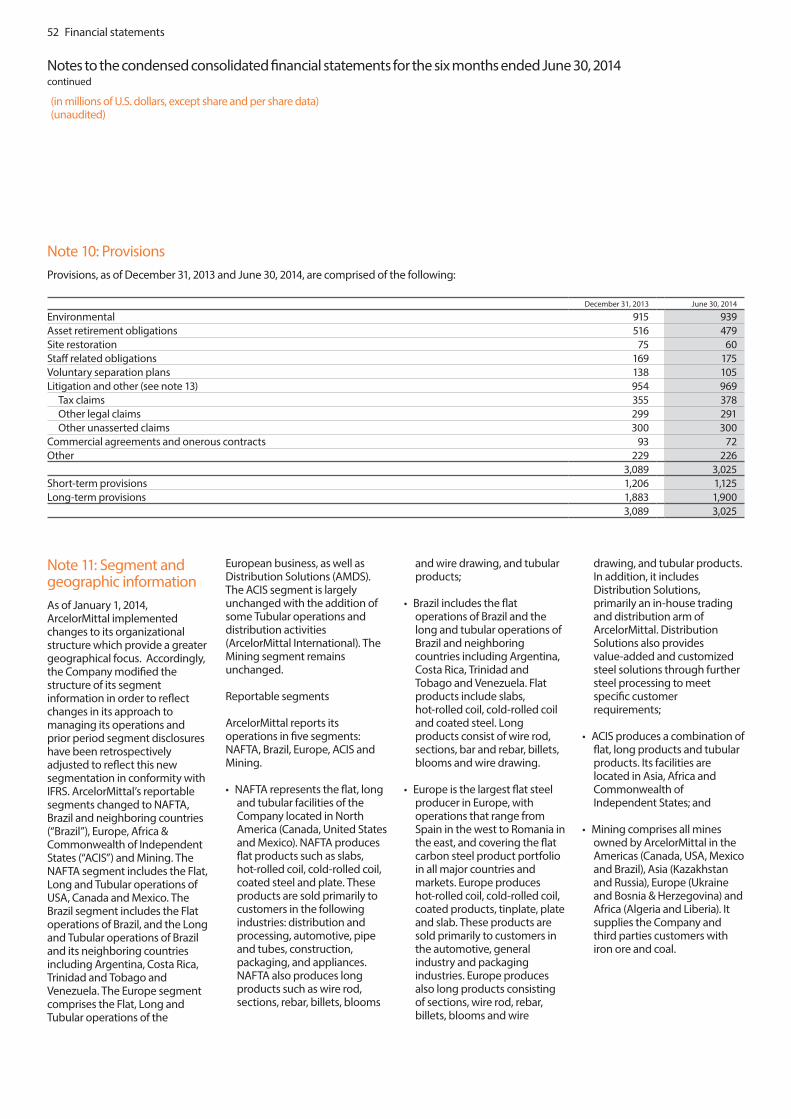
52 Financial statements
(in millions of U.S. dollars, except share and per share data)(unaudited)
Note 10: Provisions Provisions, as of December 31, 2013 and June 30, 2014, are comprised of the following:
December 31, 2013 June 30, 2014
Environmental 915 939Asset retirement obligations 516 479Site restoration 75 60Staff related obligations 169 175Voluntary separation plans 138 105Litigation and other (see note 13) 954 969 Tax claims 355 378 Other legal claims 299 291 Other unasserted claims 300 300Commercial agreements and onerous contracts 93 72Other 229 226
3,089 3,025Short-term provisions 1,206 1,125Long-term provisions 1,883 1,900
3,089 3,025
Notes to the condensed consolidated financial statements for the six months ended June 30, 2014continued
Note 11: Segment and geographic informationAs of January 1, 2014, ArcelorMittal implemented changes to its organizational structure which provide a greater geographical focus. Accordingly, the Company modified the structure of its segment information in order to reflect changes in its approach to managing its operations and prior period segment disclosures have been retrospectively adjusted to reflect this new segmentation in conformity with IFRS. ArcelorMittal’s reportable segments changed to NAFTA, Brazil and neighboring countries (“Brazil”), Europe, Africa & Commonwealth of Independent States (“ACIS”) and Mining. The NAFTA segment includes the Flat, Long and Tubular operations of USA, Canada and Mexico. The Brazil segment includes the Flat operations of Brazil, and the Long and Tubular operations of Brazil and its neighboring countries including Argentina, Costa Rica, Trinidad and Tobago and Venezuela. The Europe segment comprises the Flat, Long and Tubular operations of the
European business, as well as Distribution Solutions (AMDS). The ACIS segment is largely unchanged with the addition of some Tubular operations and distribution activities (ArcelorMittal International). The Mining segment remains unchanged.
Reportable segments
ArcelorMittal reports its operations in five segments: NAFTA, Brazil, Europe, ACIS and Mining.
• NAFTArepresentstheflat,longand tubular facilities of the Company located in North America (Canada, United States and Mexico). NAFTA produces flat products such as slabs, hot-rolled coil, cold-rolled coil, coated steel and plate. These products are sold primarily to customers in the following industries: distribution and processing, automotive, pipe and tubes, construction, packaging, and appliances. NAFTA also produces long products such as wire rod, sections, rebar, billets, blooms
and wire drawing, and tubular products;
• Brazilincludestheflatoperations of Brazil and the long and tubular operations of Brazil and neighboring countries including Argentina, Costa Rica, Trinidad and Tobago and Venezuela. Flat products include slabs, hot-rolled coil, cold-rolled coil and coated steel. Long products consist of wire rod, sections, bar and rebar, billets, blooms and wire drawing.
• Europeisthelargestflatsteelproducer in Europe, with operations that range from Spain in the west to Romania in the east, and covering the flat carbon steel product portfolio in all major countries and markets. Europe produces hot-rolled coil, cold-rolled coil, coated products, tinplate, plate and slab. These products are sold primarily to customers in the automotive, general industry and packaging industries. Europe produces also long products consisting of sections, wire rod, rebar, billets, blooms and wire
drawing, and tubular products. In addition, it includes Distribution Solutions, primarily an in-house trading and distribution arm of ArcelorMittal. Distribution Solutions also provides value-added and customized steel solutions through further steel processing to meet specific customer requirements;
• ACISproducesacombinationofflat, long products and tubular products. Its facilities are located in Asia, Africa and Commonwealth of Independent States; and
• Miningcomprisesallminesowned by ArcelorMittal in the Americas (Canada, USA, Mexico and Brazil), Asia (Kazakhstan and Russia), Europe (Ukraine and Bosnia & Herzegovina) and Africa (Algeria and Liberia). It supplies the Company and third parties customers with iron ore and coal.

Financial statements 53
(in millions of U.S. dollars, except share and per share data)(unaudited)
Notes to the condensed consolidated financial statements for the six months ended June 30, 2014continued
The following table summarizes certain financial data relating to ArcelorMittal’s operations in its different reportable segments:
NAFTA Brazil Europe ACIS Mining Others* Eliminations Total
Six months ended June 30, 2013Sales to external customers 9,592 4,903 20,532 4,213 637 72 - 39,949Intersegment sales** 89 178 218 90 1,913 289 (2,777) - Operating income 193 542 (256) (140) 572 (116) (39) 756Depreciation 383 358 978 266 293 19 - 2,297Impairment - - 24 15 - - - 39Capital expenditures 160 122 473 188 687 6 - 1,636Six months ended June 30, 2014Sales to external customers 10,300 4,581 20,692 4,158 707 54 - 40,492Intersegment sales** 51 206 148 149 1,932 233 (2,719) - Operating income 77 592 414 5 507 (122) 33 1,506Depreciation 359 247 810 260 314 21 - 2,011Capital expenditures 226 241 518 215 429 20 - 1,649
* Others include all other operational and non-operational items which are not segmented, such as corporate and shared services, financial activities, and shipping and logistics.** Transactions between segments are reported on the same basis of accounting as transactions with third parties except for certain mining products shipped internally and
reported on a cost plus basis.
The reconciliation from operating income to net income is as follows:
Six months ended June 30, 2013
Six months ended June 30, 2014
Operating income 756 1,506Income (loss) from investments in associates, joint ventures and other investments (42) 154Financing costs - net (1,634) (1,516)Income (loss) before taxes (920) 144Income tax (expense) (196) (217)Net income (loss) (including non-controlling interests) (1,116) (73)

54 Financial statements
(in millions of U.S. dollars, except share and per share data)(unaudited)
Geographical information Sales (by destination)
Six months ended June 30, 2013
Six months ended June 30, 2014
AmericasUnited States 7,646 8,345Brazil 3,500 3,295Canada 1,604 1,725Argentina 608 596Mexico 1,031 1,144Others 1,011 788Total Americas 15,400 15,893EuropeGermany 3,516 3,570France 2,449 2,573Spain 2,023 2,222Poland 1,633 1,868Italy 1,422 1,447Turkey 1,273 1,177United Kingdom 716 771Belgium 683 653Czech Republic 822 819Romania 396 369Netherlands 463 487Russia 876 371Others 2,625 2,602Total Europe 18,897 18,929Asia & AfricaSouth Africa 1,569 1,348Kazakhstan 415 718China 560 497India 187 107Others 2,921 3,000Total Asia & Africa 5,652 5,670Total 39,949 40,492
The table below presents sales to external customers by product type. In addition to steel produced by the Company, amounts include material purchased for additional transformation and sold through distribution services. Others include mainly non-steel sales and services.
Product segmentation Sales (by products)
Six months ended
June 30, 2013Six months ended
June 30, 2014
Flat products 22,191 22,377Long products 9,856 9,778Tubular products 1,117 1,181Mining products 637 707Others 6,148 6,449Total 39,949 40,492
Notes to the condensed consolidated financial statements for the six months ended June 30, 2014continued

Financial statements 55
(in millions of U.S. dollars, except share and per share data)(unaudited)
Notes to the condensed consolidated financial statements for the six months ended June 30, 2014continued
Note 12: CommitmentsThe Company’s commitments consist of the following:
December 31, 2013 June 30, 2014Purchase commitments 18,557 25,074Guarantees, pledges and other collateral 3,290 4,219Non-cancellable operating leases 2,235 2,099Capital expenditure commitments 1,060 731Other commitments 3,354 3,381Total 28,496 35,504
Purchase commitments Purchase commitments consist primarily of major agreements for procuring iron ore, coking coal, coke and hot metal. The Company also has a number of agreements for electricity, industrial and natural gas, scrap and freight contracts. The increase in purchase commitments is mainly related to Calvert slab purchases. Purchase commitments include commitments given to associates for 641 and 507 as of December 31, 2013 and June 30, 2014, respectively. Purchase commitments include commitments given to joint ventures for nil and 101 as of December 31, 2013 and June 30, 2014, respectively.
Guarantees, pledges and other collateral Guarantees related to financial debt and credit lines given on behalf of third parties were 89 and 154 as of December 31, 2013 and June 30, 2014, respectively. Additionally, 32 and 21 were related to guarantees given on behalf of associates and guarantees of 320 and 943 were given on behalf of joint ventures as of December 31, 2013 and June 30, 2014, respectively. Pledges and other collateral mainly relate to mortgages entered into by the Company’s operating subsidiaries. The increase is mainly related to the guarantee issued on behalf of Calvert.Other sureties, first demand guarantees, letters of credit, pledges and other collateral included 3 and nil of commitments given on the behalf of associates as of December 31, 2013 and June 30, 2014.
Non-cancellable operating leasesNon-cancellable operating leases mainly relate to commitments for the long-term use of various facilities, land and equipment belonging to third parties.
Capital expenditure commitmentsCapital expenditure commitments mainly relate to commitments associated with investments in expansion and improvement projects by various subsidiaries.
Other commitmentsOther commitments given comprise mainly commitments incurred for undrawn credit lines confirmed to customers and gas supply to electricity suppliers.

56 Financial statements
(in millions of U.S. dollars, except share and per share data)(unaudited)
Note 13: Contingencies ArcelorMittal may be involved in litigation, arbitration or other legal proceedings. Provisions related to legal and arbitral proceedings are recorded in accordance with the principles described in note 2 to consolidated financial statements for the year ended December 31, 2013.
Most of these claims involve highly complex issues. Often these issues are subject to substantial uncertainties and, therefore, the probabilities of loss and an estimate of damages are difficult to ascertain. Consequently, for a large number of these claims, the Company is unable to make a reasonable estimate of the expected financial effect that will result from ultimate resolution of the proceeding. In those cases, the Company has disclosed information with respect to the nature of the contingency. The Company has not accrued a reserve for the potential outcome of these cases.
In cases in which quantifiable fines and penalties have been assessed or the Company has otherwise been able to reasonably estimate the amount of probable loss, the Company has indicated the amount of such fine or penalty or the amount of provision accrued.
In a limited number of ongoing cases, the Company is able to make a reasonable estimate of the expected loss or range of possible loss and has accrued a provision for such loss, but believe that publication of this information on a case-by-case basis would seriously prejudice the Company’s position in the ongoing legal proceedings or in any related settlement
discussions. Accordingly, in these cases, the Company has disclosed information with respect to the nature of the contingency, but has not disclosed the estimate of the range of potential loss nor the recorded as a loss.
These assessments can involve a series of complex judgments about future events and can rely heavily on estimates and assumptions. These assessments are based on estimates and assumptions that have been deemed reasonable by management. The Company believes that the aggregate provisions recorded for the above matters are adequate based upon currently available information. However, given the inherent uncertainties related to these cases and in estimating contingent liabilities, the Company could, in the future, incur judgments that could have a material effect on its results of operations in any particular period. The Company considers it highly unlikely, however, that any such judgments could have a material adverse effect on its liquidity or financial condition.
Tax Claims
BrazilIn 2011, ArcelorMittal Brasil received a tax assessment for corporate income tax (known as IRPJ) and social contributions on net profits (known as CSL) in relation to (i) the amortization of goodwill on the acquisition of Mendes Júnior Siderurgia (for the 2006 and 2007 fiscal years), (ii) the amortization of goodwill arising from the mandatory tender offer (MTO) made by ArcelorMittal to minority shareholders of Arcelor Brasil following the two-step merger of Arcelor and Mittal Steel N.V. (for the 2007 tax year), (iii) expenses related to pre-export financing used to finance the MTO, which were deemed by the
tax authorities to be unnecessary for ArcelorMittal Brasil since the financing was used to buy the shares of its own company; and (iv) CSL over profits of controlled companies in Argentina and Costa Rica. The amount claimed totals 584. On January 31, 2014, the administrative tribunal of first instance found in partial favor of ArcelorMittal Brasil, reducing the penalty component of the assessment from, according to ArcelorMittal Brasil’s calculations, 266 to 141 (as calculated at the time of the assessment), while upholding the remainder of the assessment. The Brazilian Federal Revenue Service has appealed the administrative tribunal’s decision to reduce the amount of the original penalty. ArcelorMittal Brasil has also appealed the administrative tribunal’s decision to uphold the tax authority’s assessment (including the revised penalty component).In April 2014, Comércio Exterior S.A. (“Comex”), a Brazilian subsidiary of ArcelorMittal, received a tax assessment in the amount of 76.9 concerning certain deductions made by Comex in relation to the Fundap financial tax incentive; the Brazilian Federal Revenue Service considers that Comex owes corporate income tax (known as IRPJ) and social contributions on net profits (known as CSL) on the amounts deducted. Comex filed its defense in June 2014.
In May 2014, ArcelorMittal Comercializadora de Energia received a tax assessment from the state of Minas Gerais alleging that the company did not correctly calculate tax credits on interstate sales of electricity from the February 2012 to December 2013 period. The amount claimed totals 60. ArcelorMittal Comercializadora de Energia filed its defense in June 2014.
Competition/Antitrust Claims
United StatesOn September 12, 2008, Standard Iron Works filed a purported class action complaint in the U.S. District Court in the Northern District of Illinois against ArcelorMittal, ArcelorMittal USA LLC, and other steel manufacturers, alleging that the defendants had conspired to restrict the output of steel products in order to fix, raise, stabilize and maintain prices at artificially high levels in violation of U.S. antitrust law. Other similar direct purchaser lawsuits were also filed in the same court and were consolidated with the Standard Iron Works lawsuit. In 2009, the court denied a motion by ArcelorMittal and the other defendants to dismiss the direct purchaser claims. A hearing on class certification of the direct purchaser claims took place in March/ April 2014 and a decision remains pending. On May 29, 2014, ArcelorMittal entered into an agreement to settle the direct purchaser claims for an amount of 90 recognized in cost of sales. ArcelorMittal may terminate the settlement agreement if more than a certain percentage of members of the purported plaintiffs’ class opt-out of the settlement. In addition to any opt-out direct purchaser claimants who may pursue their claims, two putative class actions on behalf of indirect purchasers have been filed and are not covered by the settlement of the direct purchaser claims. On June 13, 2014, the court gave its preliminary approval of the settlement and scheduled a hearing for final approval on October 17, 2014.
South AfricaOn September 1, 2009, the South African Competition Commission referred a complaint against four producers of long carbon steel in
Notes to the condensed consolidated financial statements for the six months ended June 30, 2014continued
Financial statements 57
(in millions of U.S. dollars, except share and per share data)(unaudited)
Notes to the condensed consolidated financial statements for the six months ended June 30, 2014continued
South Africa, including ArcelorMittal South Africa, and the South African Iron and Steel Institute to the Competition Tribunal. The complaint referral followed an investigation into alleged collusion among the producers initiated in April 2008, on-site inspections conducted at the premises of some of the producers and a leniency application by Scaw South Africa, one of the producers under investigation. The Competition Commission recommended that the Competition Tribunal impose an administrative penalty against ArcelorMittal South Africa, Cape Gate and Cape Town Iron Steel Works in the amount of 10% of their annual revenues in South Africa and exports from South Africa for 2008. ArcelorMittal filed an application to access the file of the Competition Commission that was rejected. ArcelorMittal is appealing the decision to reject the application, and has applied for a review of that decision and a suspension of the obligation to respond to the referral on the substance pending final outcome on the application for access to the documents. The appeal was upheld by the Competition Appeals Court (CAC) and the matter was referred back to the Competition Tribunal for a determination of confidentiality and scope of access to the documents. The Competition Commission appealed the decision of the CAC, and, on May 31, 2013, the Supreme Court of Appeal dismissed the appeal of the Competition Commission and confirmed the decision of the CAC. In 2014, ArcelorMittal South Africa requested the documents from the Competition Commission, which provided an index thereof. On July 7, 2011, ArcelorMittal filed an application before the Competition Tribunal to set aside the complaint referral based on procedural irregularities. It is too early for ArcelorMittal to assess the potential outcome of the procedure, including the financial impact.
Other Legal Claims
ArgentinaOver the course of 2007 to 2013, the Argentinian Customs Office Authority (Aduana) notified the Company of certain inquiries that it is conducting with respect to prices declared by the Company’s Argentinian subsidiary, Acindar related to iron ore imports. The Customs Office Authority is seeking to determine whether Acindar incorrectly declared prices for iron ore imports from several different Brazilian suppliers and from ArcelorMittal Sourcing on 35 different shipments made between 2002 and 2012. The aggregate amount claimed by the Customs Office Authority in respect of all of the shipments is approximately 165. The investigations are subject to the administrative procedures of the Customs Office Authority and are at different procedural stages depending on the filing date of the investigation. By February 2014, in 17 cases, the administrative branch of the Customs Office Authority ruled against Acindar (representing total claims of 30million). These decisions have been appealed to the Argentinian National Fiscal Court.
CanadaIn 2008, two complaints filed by Canadian Natural Resources Limited (“CNRL”) in Calgary, Alberta against ArcelorMittal, ArcelorMittal USA LLC, Mittal Steel North America Inc. and ArcelorMittal Tubular Products Roman S.A were filed. CNRL alleges negligence in both complaints, seeking damages of 56 and 25, respectively. The plaintiff alleges that it purchased a defective pipe manufactured by ArcelorMittal Tubular Products Roman and sold by ArcelorMittal Tubular Products Roman and Mittal Steel North America Inc. In May 2009, in agreement with CNRL, ArcelorMittal and ArcelorMittal USA were dismissed from the cases without prejudice
to CNRL’s right to reinstate the parties later if justified. In April 2014, the parties participated in a mediation procedure and reached a settlement subject to certain conditions, which have now been satisfied. The proceedings before the Calgary court were formally discontinued in June 2014 and the case is therefore now closed.
ItalyIn January 2010, ArcelorMittal received notice of a claim filed by Finmasi S.p.A. relating to a memorandum of agreement (“MoA”) entered into between ArcelorMittal Distribution Services France (“AMDSF”) and Finmasi in 2008. The MoA provided that AMDSF would acquire certain of Finmasi’s businesses for an amount not to exceed €93 million, subject to the satisfaction of certain conditions precedent, which, in AMDSF’s view, were not fulfilled. Finmasi sued for (i) enforcement of the MoA, (ii) damages of €14 million to €24 million or (iii) recovery costs plus quantum damages for Finmasi’s alleged lost opportunity to sell to another buyer. In September 2011, the court rejected Finmasi’s claims other than its second claim. The court appointed an expert to determine the quantum of damages. In May 2013, the expert’s report was issued and valued the quantum of damages in the range of €38 million to €60 million. ArcelorMittal appealed the decision on the merits. In May 2014, the Court of Appeals issued a decision rejecting ArcelorMittal’s appeal. On June 20, 2014, ArcelorMittal filed an appeal of the Court of Appeal’s judgment with the Italian Court of Cassation. A hearing in relation to the quantum of damages took place on June 24, 2014 and the judge set a deadline of October 8, 2014 for the parties to file their briefs.
SenegalIn 2007, ArcelorMittal Holdings AG entered into an agreement with the State of Senegal relating to an integrated iron ore mining and related infrastructure project. The Company announced at the time that implementation of the project would entail an aggregate investment of 2.2 billion. Project implementation did not follow the originally anticipated schedule after initial phase studies and related investments.
The Company engaged in discussions with the State of Senegal about the project over a long period. In early 2011, the parties engaged in a conciliation procedure, as provided for under their agreement, in an attempt to reach a mutually acceptable outcome. Following the unsuccessful completion of this procedure, in May 2011 the State of Senegal commenced an arbitration before the Court of Arbitration of the International Chamber of Commerce, claiming breach of contract and provisionally estimating damages of 750. In September 2013, the arbitral tribunal issued its first award ruling that Senegal was entitled to terminate the 2007 agreements. The arbitral tribunal also ruled that a new arbitration phase would be held relating to the potential liability of ArcelorMittal as well as the amount of any damages which could be awarded to Senegal. The parties have since agreed to settle the dispute with the amount of the settlement being included within “Financing costs – net”.

58 Financial statements
Notes to the condensed consolidated financial statements for the six months ended June 30, 2014continued
(in millions of U.S. dollars, except share and per share data)(unaudited)
Note 14: Subsequent events On July 29, 2014, ArcelorMittal and Billiton Guinea B.V. (“BHP Billiton”) signed a sale and purchase agreement for the acquisition by ArcelorMittal of a 43.5% stake in Euronimba Limited (“Euronimba”), which holds a 95% indirect interest in the Mount Nimba iron ore project in Guinea (“the Project”). ArcelorMittal has simultaneously entered into a sale and purchase agreement with Compagnie Française de Mines et Métaux (a member of the Areva group) for the
acquisition of its 13% stake in Euronimba. The closing of these two transactions would give ArcelorMittal a 56.5% ownership of Euronimba. The remaining 43.5% of Euronimba is owned by Newmont LaSource S.A.S. (“Newmont”). As part of the transaction, ArcelorMittal has granted Newmont a limited duration option which, if exercised, would result in Newmont and ArcelorMittal owning equal stakes in Euronimba. The transaction is subject to certain closing conditions, including merger control clearance and certain
approvals from the Government of Guinea.

Financial statements 59
To the shareholders of ArcelorMittal19, avenue de la LibertéL-2930 LuxembourgLuxembourg
REPORT ON REVIEW OF INTERIM FINANCIAL STATEMENTS
Introduction
We have reviewed the accompanying condensed consolidated statement of financial position of ArcelorMittal and its subsidiaries as of June 30, 2014 and the related condensed consolidated statements of operations, other comprehensive income, changes in equity and cash flows for the six month period then ended (collectively, the “interim financial statements”). The Board of Directors is responsible for the preparation and fair presentation of the interim financial statements in accordance with International Accounting Standard 34, Interim Financial Reporting, as adopted by the European Union. Our responsibility is to express a conclusion on the interim financial statements based on our review.
Scope of Review
We conducted our review in accordance with International Standard on Review Engagements 2410, Review of Interim Financial Information Performed by the Independent Auditor of the Entity, as adopted by the Institut des Réviseurs d’Entreprises. A review of interim financial information consists of making inquiries, primarily of persons responsible for financial and accounting matters, and applying analytical and other review procedures. A review is substantially less in scope than an audit conducted in accordance with International Standards on Auditing and consequently does not enable us to obtain assurance that we would become aware of all significant matters that might be identified in an audit. Accordingly, we do not express an audit opinion.
Conclusion
Based on our review, nothing has come to our attention that causes us to believe that the accompanying interim financial statements are not prepared, in all material respects, in accordance with International Accounting Standard 34, Interim Financial Reporting, as adopted by the European Union.
Emphasis of Matter
As discussed in Notes 1 and 11 to the interim financial statements, the accompanying interim financial statements have been retrospectively adjusted for a change in the composition of reportable segments. Our conclusion is not qualified in respect of this matter.
For Deloitte Auditsociété à responsabilité limitée
Cabinet de révision agréé
Vafa Moayed, Réviseur d’entreprises agréé
Partner
August 4, 2014560, rue de NeudorfL-2220 Luxembourg
Report of the Réviseur d’entreprises agréé on review of interim financial information

60 Financial statements
Recast explanatory information
On January 1, 2014, ArcelorMittal implemented changes to its organizational structure which provide a greater geographical focus. Accordingly, the Company modified the structure of its segment information in order to reflect changes in its approach to managing its operations and internal reporting. ArcelorMittal’s reportable segments changed to NAFTA, Brazil and neighboring countries (“Brazil”), Europe, Africa & Commonwealth of Independent States (“ACIS”) and Mining. The NAFTA segment includes the Flat, Long and Tubular operations of USA, Canada and Mexico. The Brazil segment includes the Flat operations of Brazil, and the Long and Tubular operations of Brazil and its neighboring countries including Argentina, Costa Rica, Trinidad and Tobago and
Venezuela. The Europe segment comprises the Flat, Long and Tubular operations of the European business, as well as Distribution Solutions (AMDS). The ACIS division is largely unchanged with the addition of some Tubular operations and distribution activities (ArcelorMittal International). The Mining segment remains unchanged.
US Securities and Exchange Commission (“SEC”) rules require that, following the issuance of interim financial statements reflecting new reportable segments (which will occur for the interim financial statements for the six months ended June 30, 2014), a US SEC registrant must recast and re-file its most recent annual financial statements to include the effects of the retrospective
application of the revised reportable segments for all periods presented in order to keep access to the US capital markets until the next annual financial statements are filed. Such recast financial statements must also be audited by the Company’s independent auditor for purposes of the SEC filing.
The US SEC rule results in early presentation of the audited retrospective impacts of the new reportable segments which would normally be reported by a company in its next set of annual financial statements, in conformity with IFRS (i.e. for the year ending December 31, 2014). ArcelorMittal has filed the audited recast financial statements for the three years ended December 31, 2013 with the SEC.
The US SEC filing will provide to US investors early information about the impacts of the new reportable segments on previous annual periods. In order to ensure that European investors have the benefit of access to the full impact of the new reportable segments for all periods, similar to US investors, the Company presents hereafter recast Note 27 to the annual consolidated financial statements for the year ended December 31, 2013 as supplementary information to its Interim Financial Report for the half year ended June 30, 2014 filed with the Commission de Surveillance du Secteur Financier (“CSSF”).

Financial statements 61
Updated disclosure of segment and geographic information included in note 27 to the consolidated financial statements for the year ended December 31, 2013
Note 27: Segment and Geographic InformationAs from January 1, 2014, ArcelorMittal implemented changes to its organizational structure which provide a greater geographical focus. Accordingly, the Company modified the structure of its segment information in order to reflect changes in its approach to managing its operations and prior period segment disclosures have been recast to reflect this new segmentation, in conformity with IFRS. ArcelorMittal’s reportable segments changed to NAFTA, Brazil and neighboring countries(“Brazil”), Europe, Africa & Commonwealth of Independent States (“ACIS”) and Mining. The NAFTA segment includes the Flat, Long and Tubular operations of USA, Canada and Mexico. The Brazil segment includes the Flat operations of Brazil, and the Long and Tubular operations of Brazil and its neighboring countries including Argentina, Costa Rica, Trinidad and Tobago and Venezuela. The Europe segment comprises the Flat, Long and Tubular operations of the European business, as well as Distribution Solutions (AMDS). The ACIS division is largely unchanged
with the addition of some Tubular operations and distribution activities (ArcelorMittal International). The Mining segment remains unchanged.
ArcelorMittal has a high degree of geographic diversification relative to other steel companies. During 2013, ArcelorMittal shipped its products to customers in over 170 countries, with its largest markets in Flat and Long products in Americas and Europe. ArcelorMittal conducts its business through its Operating Subsidiaries. Many of these operations are strategically located with access to on-site deep water port facilities, which allow for cost-efficient import of raw materials and export of steel products.
Reportable segments
ArcelorMittal reports its operations in five segments: NAFTA, Brazil, Europe, ACIS and Mining.
• NAFTArepresentstheflat,longand tubular facilities of the Company located in North America (Canada, United States and Mexico). NAFTA produces flat products such as slabs, hot-rolled coil, cold-rolled coil,
coated steel and plate. These products are sold primarily to customers in the following industries: distribution and processing, automotive, pipe and tubes, construction, packaging, and appliances. NAFTA also produces long products such as wire rod, sections, rebar, billets, blooms and wire drawing, and tubular products;
• Brazilincludestheflatoperationsof Brazil and the long and tubular operations of Brazil and neighboring countries including Argentina, Costa Rica, Trinidad and Tobago and Venezuela. Flat products include slabs, hot-rolled coil, cold-rolled coil and coated steel. Long products consist of wire rod, sections, bar and rebar, billets, blooms and wire drawing.
• Europeisthelargestflatsteelproducer in Europe, with operations that range from Spain in the west to Romania in the east, and covering the flat carbon steel product portfolio in all major countries and markets. Europe produces hot-rolled coil, cold-rolled coil, coated products, tinplate, plate and slab. These products are sold primarily to customers in the automotive,
general industry and packaging industries. Europe produces also long products consisting of sections, wire rod, rebar, billets, blooms and wire drawing, and tubular products. In addition, it includes Distribution Solutions, primarily an in-house trading and distribution arm of ArcelorMittal. Distribution Solutions also provides value-added and customized steel solutions through further steel processing to meet specific customer requirements;
• ACISproducesacombinationofflat, long products and tubular products. Its facilities are located in Asia, Africa and Commonwealth of Independent States; and
• Miningcomprisesallminesowned by ArcelorMittal in the Americas (Canada, USA, Mexico and Brazil), Asia (Kazakhstan and Russia), Europe (Ukraine and Bosnia & Herzegovina) and Africa (Algeria and Liberia). It supplies the Company and third parties customers with iron ore and coal.
The following table summarizes certain financial data relating to ArcelorMittal’s operations in its different reportable segments.
NAFTA Brazil Europe ACIS Mining Others* Elimination Total
Year ended December 31, 2012 Sales to external customers 20,576 9,902 41,996 9,976 1,674 89 - 84,213Intersegment sales** 185 255 503 221 3,819 592 (5,575) - Operating income (loss) 1,243 561 (5,725) (54) 1,209 (95) 216 (2,645)Depreciation 776 729 1,944 657 546 50 - 4,702Impairment (5) - 5,032 8 - - - 5,035Capital expenditures 494 600 1,207 436 1,883 97 - 4,717Year ended December 31, 2013 Sales to external customers 19,416 9,877 40,086 8,254 1,659 148 - 79,440Intersegment sales** 229 271 421 164 4,107 606 (5,798) - Operating income (loss) 630 1,204 (985) (457) 1,176 (298) (73) 1,197Depreciation 767 691 2,003 542 642 50 - 4,695Impairment - - 86 196 162 - - 444Capital expenditures 422 276 990 398 1,342 24 - 3,452
* Others include all other operational and non-operational items which are not segmented, such as corporate and shared services, financial activities, and shipping and logistics.** Transactions between segments are reported on the same basis of accounting as transactions with third parties except for certain mining products shipped internally and reported
on a cost plus basis.
(in millions of U.S. dollars, except share and per share data)

62 Financial statements
Year Ended December 31,2012
Year Ended December 31,2013
Americas United States 16,539 15,625Canada 3,617 3,299Brazil 6,376 6,576Argentina 1,236 1,279Mexico 2,337 2,081Others 2,209 2,181Total Americas 32,314 31,041 Europe France 5,062 4,764Spain 3,764 3,900Germany 7,645 6,834Romania 779 755Poland 3,614 3,523Belgium 1,262 1,264Italy 2,671 2,771United Kingdom 1,654 1,442Turkey 2,577 2,469Czech Republic 1,660 1,608Netherlands 978 904Russia 1,770 1,618Others 5,105 5,071Total Europe 38,541 36,923 Asia & Africa South Africa 3,338 2,908China 1,218 1,395Kazakhstan 659 791India 686 406Others 7,457 5,976Total Asia & Africa 13,358 11,476 Total 84,213 79,440
Geographical information Sales (by destination)
Updated disclosure of segment and geographic information included in note 27 to the consolidated financial statements for the year ended December 31, 2013
The reconciliation from operating income (loss) to net income is as follow:Year Ended
December 31,2012Year Ended
December 31,2013
Operating income (loss) (2,645) 1,197Income from investments in associates and joint ventures 185 (442)Financing costs - net (2,915) (3,115)Income (loss) before taxes (5,375) (2,360)Income tax expense (benefit) (1,906) 215Discontinued operations - -Net income (including non-controlling interests) (3,469) (2,575)
The Company does not regularly provide assets for each reportable segment to the CODM. The table which follows presents the reconciliation of segment assets to total assets as required by IFRS 8.
Year Ended December 31,2012
Year Ended December 31,2013
Assets allocated to segments 96,818 93,993Cash and cash equivalents, including restricted cash 4,540 6,232Deferred tax assets 8,221 8,938Assets held for sale - 292Other unallocated assets and eliminations 4,419 2,853Total assets 113,998 112,308
(in millions of U.S. dollars, except share and per share data)

Financial statements 63
Non-current assetsAs of December 31,
2012
Non-current assetsAs of December 31,
2013
Americas Brazil 7,775 6,524United States 5,986 6,027Canada 6,526 5,985Mexico 1,563 1,491Trinidad and Tobago 251 221Venezuela 202 195Argentina 267 192Others 41 31Total Americas 22,611 20,666 Europe France 5,801 5,806Ukraine 4,182 3,959Germany 3,301 3,355Spain 3,265 3,170Belgium 3,306 3,047Poland 2,635 2,712Luxembourg 1,686 1,886Czech Republic 816 854Romania 818 799Bosnia and Herzegovina 256 259Italy 263 253Others 761 554Total Europe 27,090 26,654 Asia & Africa Kazakhstan 2,056 2,126South Africa 1,910 1,424Liberia 1,040 1,144Morocco 189 178Others 510 171Total Africa & Asia 5,705 5,043 Unallocated assets 26,810 25,920Total 82,216 78,283
Revenues from external customers attributed to the country of domicile (Luxembourg) were 217 and 118 as of December 31, 2012 and 2013, respectively.
Non-current assets* per significant country:
* Non-current assets do not include goodwill (as it is not allocated to the geographic regions), deferred tax assets, other investments or receivables and other non-current financial assets. Such assets are presented under the caption “Unallocated assets”.
Updated disclosure of segment and geographic information included in note 27 to the consolidated financial statements for the year ended December 31, 2013
(in millions of U.S. dollars, except share and per share data)

64 Financial statements
Year Ended December 31,2012
Year Ended December 31,2013
Flat products 45,748 43,737Long products 20,686 19,331Tubular products 2,760 2,401Mining products 1,674 1,659Others 13,345 12,312Total 84,213 79,440
Product segmentation Sales (by products)
The table above presents sales to external customer by product type. In addition to steel produced by the Company, amounts include material purchased for additional transformation and sold through distribution services. Others include mainly non-steel sales and services.
Updated disclosure of segment and geographic information included in note 27 to the consolidated financial statements for the year ended December 31, 2013
(in millions of U.S. dollars, except share and per share data)
Financial statements 65
Report of the réviseur d’entreprises agréé on the updated disclosure of segment and geographic information
To the Shareholders ofArcelorMittal Société Anonyme19, Avenue de la LibertéL-2930 LuxembourgGrand Duchy of Luxembourg
Report on the Updated Disclosure of Segment and Geographic Information
Following our appointment by the General Meeting of the shareholders held on May 8, 2013, we have audited, in accordance with the International Standards on Auditing as adopted by Luxembourg by the Commission de Surveillance du Secteur Financier, the consolidated financial statements of ArcelorMittal and its subsidiaries, which comprise the consolidated statement of financial position as at December 31, 2013, and the consolidated statements of operations, other comprehensive income, changes in equity and cash flows, and a summary of significant accounting policies and other explanatory information for the year then ended and we have issued our report thereon dated March 12, 2014.
We have also audited the accompanying note which amends Note 27 to the aforementioned financial statements. This amendment to Note 27 presents the disclosures giving effect to the change in composition of operating and reportable segments for the years ended December 31, 2012 and 2013 (collectively the “Updated Disclosure of Segment and Geographic Information”).
Responsibility of the Board of Directors for the Updated Disclosure of Segment and Geographic Information
The Board of Directors is responsible for the preparation and fair presentation of the Updated Disclosure of Segment and Geographic Information in accordance with International Financial Reporting Standards 8 as adopted by the European Union, Operating Segment (“IFRS 8”) and for such internal control as the Board of Directors determines is necessary to enable the preparation of the Updated Disclosure of Segment and Geographic Information that are free from material misstatement, whether due to fraud or error.
Responsibility of the réviseur d’entreprises agréé
Our responsibility is to express an opinion on the Updated Disclosure of Segment and Geographic Information based on our audit. We conducted our audit in accordance with International Standards on Auditing as adopted for Luxembourg by the Commission de Surveillance du Secteur Financier. Those standards require that we comply with ethical requirements and plan and perform the audit to obtain reasonable assurance about whether the Updated Disclosure of Segment and Geographic Information is free from material misstatement.
An audit involves performing procedures to obtain audit evidence about the amounts and disclosures in the Updated Disclosure of Segment and Geographic Information. The procedures selected depend on the réviseur d’entreprises agréé’s judgement, including the assessment of the risks of material misstatement of the Updated Disclosure of Segment and Geographic Information, whether due to fraud or error. In making those risk assessments, the réviseur d’entreprises agréé considers internal control relevant to the entity’s preparation and fair presentation of the Updated Disclosure of Segment and Geographic Information in order to design audit procedures that are appropriate in the circumstances, but not for the purpose of expressing an opinion on the effectiveness of the entity’s internal control. An audit also includes evaluating the appropriateness of accounting policies used and the reasonableness of accounting estimates made by the Board of Directors, as well as evaluating the overall presentation of the Updated Disclosure of Segment and Geographic Information.
We believe that the audit evidence we have obtained is sufficient and appropriate to provide a basis for our audit opinion.
Opinion
In our opinion, the Updated Disclosure of Segment and Geographic Information gives a true and fair view of such information as it relates to the financial position and results of operations of ArcelorMittal and its subsidiaries as of and for the year ended December 31, 2013, in all material respects, in accordance with IFRS 8.
For Deloitte Auditsociété à responsabilité limitéeCabinet de révision agréé
Vafa Moayed, Réviseur d’entreprises agrééPartner
August 4, 2014560, rue de NeudorfL-2220 Luxembourg

66 Interim Management Report