Adjusting financial policy -...
23
Adjusting financial policy 16 September 2009 – Investor day – London & New York Aditya Mittal – Chief Financial Officer and member of GMB
Transcript of Adjusting financial policy -...

Adjusting financial policy
16 September 2009 – Investor day – London & New York
Aditya Mittal – Chief Financial Officer and member of GMB

1
Disclaimer
Forward-Looking Statements This document may contain forward-looking information and statements about
ArcelorMittal and its subsidiaries. These statements include financial projections and estimates and their underlying assumptions, statements regarding plans, objectives and expectations with respect to future operations, products and services, and statements regarding future performance. Forward-looking statements may be identified by the words “believe,” “expect,” “anticipate,”“target” or similar expressions. Although ArcelorMittal’s management believes that the expectations reflected in such forward-looking statements are reasonable, investors and holders of ArcelorMittal’s securities are cautioned that forward-looking information and statements are subject to numerous risks and uncertainties, many of which are difficult to predict and generally beyond the control of ArcelorMittal, that could cause actual results and developments to differ materially and adversely from those expressed in, or implied or projected by, the forward-looking information and statements. These risks and uncertainties include those discussed or identified in the filings with the Luxembourg Stock Market Authority for the Financial Markets (Commission de Surveillance du Secteur Financier) and the United States Securities and Exchange Commission (the “SEC”) made or to be made by ArcelorMittal, including ArcelorMittal’s Annual Report on Form 20-F for the year ended December 31, 2008 filed with the SEC. ArcelorMittal undertakes no obligation to publicly update its forward-looking statements, whether as a result of new information, future events, or otherwise.

2
Agenda
• Reaction to the financial crisis• Adjusting financial policy• What would profitability be post crisis?• Financing the post crisis growth

3
Reaction to the financial crisis

4
ArcelorMittal financial ratios pre-crisis
ArcelorMittal financial position pre-crisis
Net debt / EBITDA* Gearing
* Based on latest twelve months (LTM) EBITDA
0.0
0.5
1.0
1.5
2.0
2.5
3Q2006
4Q2006
1Q2007
2Q2007
3Q2007
4Q2007
1Q2008
2Q2008
3Q2008
Upper limit targets
Lower limit targets
30%
35%
40%
45%
50%
55%
3Q2006
4Q2006
1Q2007
2Q2007
3Q2007
4Q2007
1Q2008
2Q2008
3Q2008

5
Target of USD 10 billion of net debt reduction near ly achieved in 9 months
In addition to focus on cost reduction focus was put on debt reduction
Net debt and gearing Main initiatives
• Positive cash-flow from operations achieved throughout the crisis due to significant cash inflow from reduction in working capital (USD 5.5 billion over 9 months)
• 2009 CAPEX cut to USD 3 billion from the USD 9 billion initially planned
• Dividend cut to USD 0.75 per share from USD 1.50 (annual savings of USD 1.1 billion)
• USD 2.5 billion of cash gained from unwinding of raw material hedging transaction
• USD 1.4 billion of proceeds from asset disposals over 9 months
• Capital increase of USD 3.2 billion
20
25
30
35
3Q 2008 4Q 2008 1Q 2009 2Q 2009
30%
35%
40%
45%
50%
55%
Net Debt in billion of USD(LHS) Gearing (RHS)
USD 10 billion target reduction

6
In 9 months of financial crisis, liquidity has been improved by more than USD 10 billion
An improved liquidity
Liquidity (USD billion) Cash & Cash equivalent in % of liquidity
0
5
10
15
20
25
3Q 2008 4Q 2008 1Q 2009 2Q 2009
Cash & Equivalent Unused credit line
1213.4
11.6
22.7
20%
30%
40%
50%
60%
3Q 2008 4Q 2008 1Q 2009 2Q 2009

7
Approximately USD 11.4 billion of equity, convertibl e and bond financings successfully issued
Successful refinancing
Bank debt75%
Bonds15%
Commercial paper10%
Bank debt49%
Convertibles bonds
6%
Bonds38%
Commercial paper
7%
Gross debt structure
At 30/09/08 At 30/06/09
Main initiatives
• USD 6.0 billion of bank refinancing secured through Forward Start facilities in February and March 2009
• USD 1.6 billion (EUR 1.25 billion) of convertible bonds issued on April 1, 2009
• USD 3.2 billion of capital increase through an accelerated book building on May 6, 2009
• USD 0.8 billion of additional convertible bond issued on May 6, 2009
• USD 2.25 billion of bonds issued on May 20, 2009
• USD 3.5 billion (EUR 2.5 billion) of bonds issued on June 3, 2009New covenants for main bank facilities
� Amendment to the Net Debt / EBITDA covenant to 4.5x for December 2009, 4.0x for June 2010 and reverting to 3.5x for December 2010

8
Average debt maturity profile extended to 3.8 years
A longer maturity profile
Liquidity and debt profile at 30/09/08 Liquidity and debt profile at 30/06/09
*
* Pro forma liquidity includes cancellation of USD 3.2 billion of credit facilities and prepayment of USD 3.4 billion of bank debt
0
10
20
30
40
50
Q4 2008 2009 2010 2011 2012 2013 Thereafter
Cumulative gross debt repayment
Liquidity
0
10
20
30
40
50
H2 2009 2010 2011 2012 2013 2014 Thereafter
Cumulative gross debt repayment
Liquidity

9
Adjusting financial policy

10
ArcelorMittal profitability has shown resilience to economic slowdown and inventory downturn but not to major economic crisis
What we learned from the crisis
0
2
4
6
8
10
1Q 2
0062Q
2006
3Q 2
0064Q
2006
1Q 2
0072Q
2007
3Q 2
0074Q
2007
1Q 2
0082Q
2008
3Q 2
0084Q
2008
1Q 2
0092Q
2009
40
60
80
100
120
140
160
180
200
EBITDA in billion of USD (LHS) Steel turnover in base 100 (RHS)
0
5
10
15
20
25
30
2004 2005 2006 2007 2008
ArcelorMittal EBITDA* and steel price
*Pro-forma in 2004, 2005 and 2006 in billion of USD
HRC FOB US Midwest USD/t
ArcelorMittal EBITDA* and turnover

11
Target of a Net Debt / Average EBITDA to be betwee n 0.5x and 1.8x
Setting a leverage target based on an average profitability
Net Debt / average EBITDA** depending cost of financing and interest coverage
Net debt / EBITDA*
* Based on latest twelve months (LTM) EBITDA** Based on average EBITDA since 2004 and including 2009 (based on Bloomberg consensus)
0.0
0.2
0.4
0.6
0.8
1.0
1.2
1.4
1.6
1.8
2.0
6% 7% 8% 9% 10% 11% 12% 13%
Cost of financing
Net
deb
t /
Ave
rage
EB
ITD
A
Upper limit target
Lower limit target
Interest coverage
of 10x
Interest coverage of
15x
0.0
0.5
1.0
1.5
2.0
2.5
3Q 2
0064Q
2006
1Q 2
0072Q
2007
3Q 2
0074Q
2007
1Q 2
0082Q
2008
3Q 2
0084Q
2008
1Q 2
0092Q
2009
"Old" Upper limit targets
"Old" Lower limit targets

12
Gearing target of 25% to 40% in order to reduce equ ity volatility during crisis
Source Credit Suisse
Historical price to book value of the steel sector
Improve investment selectivity due to capital const rain
� Historical price to book of 0.75x during trough
Setting a new gearing target based on stock market trough
Gearing target for market capitalisation in trough to remain close to 2 times net debt
0%
10%
20%
30%
40%
50%
60%
70%
80%
1.0 1.5 2.0 2.5 3.0 3.5
Market capitalisation over net debt
Gea
ring
Gearing range

13
Committed to solid investment grade
Adjusted financial policy and new targets
Net debt over average EBITDA* Gearing
� Net Debt / average EBITDA between 0.5x and 1.8x � Gearing to be between 25% and 40%
* Based on average EBITDA since 2004 and including 2009 (based on Bloomberg consensus)
0.0
0.5
1.0
1.5
2.0
3Q2006
4Q2006
1Q2007
2Q2007
3Q2007
4Q2007
1Q2008
2Q2008
3Q2008
4Q2008
1Q2009
2Q2009
Target range
20%
25%
30%
35%
40%
45%
50%
55%
3Q2006
4Q2006
1Q2007
2Q2007
3Q2007
4Q2007
1Q2008
2Q2008
3Q2008
4Q2008
1Q2009
2Q2009
Target range

14
What would profitability be post crisis?

15
Despite the exceptional crisis steel industry funda mentals (growth, consolidation…) remain
Should we expect profitability to recover to previous levels?
Source WSA and ArcelorMittal estimates
ArcelorMittal shipments and EBITDA margin Global steel demand expectation (Mt)
600
800
1000
1200
1400
1600
2000
2001
2002
2003
2004
2005
2006
2007
2008
2009
E20
10E
2011
E20
12E
2013
E
The financial crisis
40
60
80
100
120
140
1Q 2
0062Q
2006
3Q 2
0064Q
2006
1Q 2
0072Q
2007
3Q 2
0074Q
2007
1Q 2
0082Q
2008
3Q 2
0084Q
2008
1Q 2
0092Q
2009
5%
10%
15%
20%
25%
30%
Shipments in base 100 (LHS) EBITDA Margin in % (RHS)

16
Historical average and peak/trough of EBITDA per to nne of around 150 USD/t
Historical profitability level
ArcelorMittal annual EBITDA per tonne ArcelorMittal peak and trough EBITDA per tonne
Annual Quarterly
*Analyst consensusSource Bloomberg
0
100
200
300
400
3Q 2008 1Q 2009
0
100
200
300
400
2008 2009E*0
10
20
30
2004 2005 2006 2007 2008 2009E*
0
100
200
300
400
EBITDA in USD billion (LHS) EBITDA in USD/t (RHS)
17
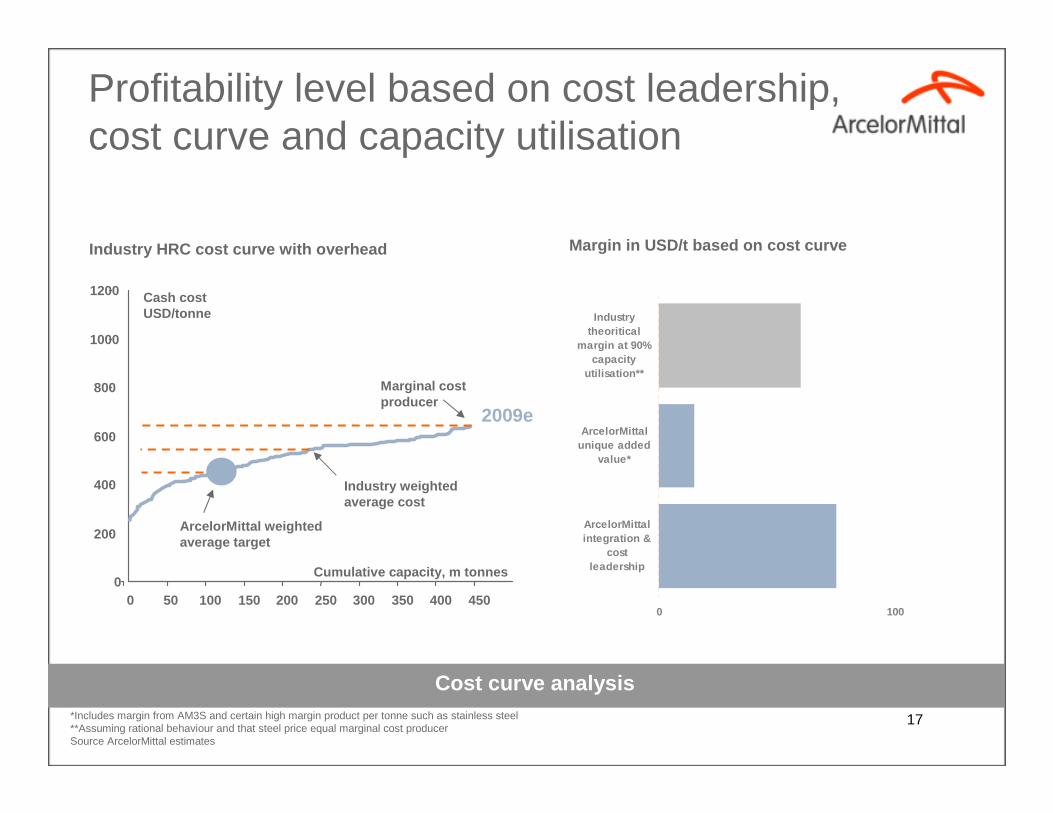
Profitability level based on cost leadership, cost curve and capacity utilisation
*Includes margin from AM3S and certain high margin product per tonne such as stainless steel**Assuming rational behaviour and that steel price equal marginal cost producerSource ArcelorMittal estimates
Margin in USD/t based on cost curveIndustry HRC cost curve with overhead
Cumulative capacity, m tonnes
Cash cost USD/tonne
0
200
400
600
800
1000
1200
0 50 100 150 200 250 300 350 400 450
2009e
ArcelorMittal weighted average target
Industry weighted average cost
Cost curve analysis
Marginal cost producer
0 100
ArcelorMittalintegration &
costleadership
ArcelorMittalunique added
value*
Industrytheoritical
margin at 90%capacity
utilisation**

18
Financing the post crisis growth

19
Over the last 3 years, ArcelorMittal has generated more than USD 38 billion of cash-flow from operation
Financing growth through cash-flow from operations
Cash-flow from operations (in billion USD)
0
1
2
3
4
5
6
7
1Q2006
2Q2006
3Q2006
4Q2006
1Q2007
2Q2007
3Q2007
4Q2007
1Q2008
2Q2008
3Q2008
4Q2008
1Q2009
2Q2009
USD 0.1bn
Net Debt increase since merger**
USD 22.2bn
M&A* since merger
USD 15.1bn
* Cash purchase price, assumed net debt and shares issued bought back** Since 30/06/06 to 31/12/08
CAPEX since merger

20
Growth CAPEX focus on key emerging markets such as South Americaand India, and Mining expansion
Growth CAPEX to be reinitiated cautiously
CAPEX plan pre-crisis (USD billion) New CAPEX plan (USD billion)
0
2
4
6
8
10
2005 2006 2007 2008 2009E
Grow th CAPEX planned pre-crisis
Grow th CAPEX realised
Maintenance CAPEX
0
2
4
6
8
10
2006 2007 2008 2009E 2010E
Grow th CAPEX planned
Grow th CAPEX realised
Maintenance CAPEX

Aceralia / Arbed / Usinor
Equity100%
21
ArcelorMittal to continue to create value through M& A leveraging leadership and integration know-how to deliver synergies
Targeted M&A opportunities to be re-examined
Financing of major historic Merger & Acquisition
Mittal Steel / ISG
Cash50% Equity
50%
Mittal Steel / Arcelor
Cash31%
Equity69%
ArcelorMittal / Arcelor Brasil
Cash31%
Equity69%

22
Q&A