Intergenerational earnings mobility: Changes across cohorts in Britain
Intergenerational earnings mobility among the children
of Canadian immigrants*
Abdurrahman Aydemir, Wen-Hao Chen, and Miles Corak
Family and Labour Studies Statistics Canada
Ottawa, Canada K1A 0T6
1st draft September 2004 2nd draft May 2005
Abstract We analyze the intergenerational income mobility of Canadians born to immigrants using the 2001 Census. A detailed portrait of the Canadian population is offered as are estimates of the degree of generational mobility among the children of immigrants from 70 countries. The degree of persistence as estimated in regression to the mean models is about the same for immigrants as for the entire population, and there is more generational mobility among immigrants in Canada than in the United States. We also use quantile regressions to distinguish between the role of social capital from other constraints limiting mobility and find that these are present and associated with father’s education. JEL classification: I30, I32, I38. Keywords: Immigrants, children, generational mobility * A first draft of this paper was presented to the Statistics Canada workshop on immigration issues held in March 2005, the meetings of the Canadian Economics Association held at McMaster University in May 2005, and the June 2005 meeting of the European Society of Population Economics in Paris. The authors thank the participants, and particularly Christopher Worswick, for helpful comments.
1
Intergenerational earnings mobility among the children
of Canadian immigrants
The degree of generational mobility—the relationship between a child’s adult labour market
and social success and his or her family background—is an important aspect of how societies
function. The extent to which children from impoverished backgrounds can realistically aspire
to better themselves, or conversely the extent to which children from the highest strata can
expect to inherit the same position as their parents, speaks to important social issues such as the
long term consequences of child poverty or more generally to equality of opportunity. Indeed,
beliefs about generational income and social mobility inform the defining metaphors of some
countries. This is a subject that has often been hotly debated among the broader public but also
in academia, as witnessed for example in Scott and Leonhardt (2005) and Wessel (2005) as
well as in a number of surveys and overviews (Björklund and Jäntti 2000, Bowles, Gintis and
Osborne 2005, Corak 2004a 2004b, Solon 1999 2002).
But this is a topic that is also particularly relevant to immigrants and their integration
into host countries. From the perspective of individuals and their families the sometimes very
large costs of emigrating and settling in a new land are often shouldered because of the
perceived benefits for the children. In this sense it is important to understand the long run
attainments of immigrant children. This issue is all the more pertinent since in some countries
there are heightened concerns about the extent to which immigrants have been able to
successfully integrate into the labour market. Aydemir and Skuterud (2005), for example,
2
document a marked deterioration in the earnings of successive cohorts of male immigrants to
Canada, with the most recent cohorts earning as much as 50 to 60% less than their native born
counterparts. The consequence of this is that low income rates among recent immigrants are
high and getting higher. In this context it is important to understand the inter-generational
process determining the long-run outcomes of children. A good deal of generational mobility
may imply that disadvantages in childhood will not echo into adulthood, while a lack of
generational mobility would suggest that the consequences of low income in the present are
even more costly as the next generation will grow up to be low income adults. Most of the
existing literature examines this relationship for the general population, with only a few studies
addressing the issue for immigrants.
The main objective of this paper is to provide evidence on intergenerational earnings
mobility between first and second generation Canadians. Although there are estimates of
intergenerational mobility for the Canadian population, the availability of new information on
family background in the 2001 Canadian Census offers the opportunity to examine this issue
for immigrants and their children. The large sample sizes in the Census also provide an
opportunity to highlight a number of methodological issues raised in existing studies using a
similar approach to estimating the correlation in the earnings and the educational attainments
between parents and children. We also offer some results that permit a comparison between the
degree of generational mobility among immigrants in Canada with those in the United States,
two of the world’s most important immigrant receiving countries.
An overview of the analytical framework and a description of the data are offered in the
next two sections. The subsequent two sections present the major results, which are organized
under three related themes. First, least squares estimates of standard regression to the mean
3
models of generational earnings mobility suggest that the elasticity between father and son
earnings is no different among immigrants and their children than among the Canadian
population at large. In line with the broader literature it is lower among Canadian immigrants
than those in the United States. We also find that there does not seem to be any statistically
significant relationship between father and daughter earnings, a result that is in contrast with
the prevailing Canadian literature. Second, a simple decomposition of the generational
elasticity suggests that it is, at least in the father-son case, driven by factors other than
educational attainment. This is in part due to a low estimated return to education, but mostly
because other channels are more important. Third, this result leads us to more explicitly
examine one possible channel often discussed in this literature, so-called “social” capital which
is measured by the average characteristics of community to which second generation
immigrants belong. Applying arguments from the literature on generational dynamics we use
quantile regressions to isolate the role of social capital from other broader societal constraints
that may influence its value in the labour market. The results are consistent with a view that
these constraints are present among the immigrant population. We also find that the education
levels of fathers, not just income, are important in overcoming them. In these regards the
father-son and father-daughter relationships are similar.
1. A framework for the analysis
Our empirical approach is motivated by the regression to the mean model of generational
mobility used in much of economic analysis to measure mobility in earnings and income. This
is depicted in equation (1), where Y represents an outcome of interest, in our case principally
permanent income, and t is an index of generations.
4
Yi,t = α + β Yi,t-1 + εi,t (1)
To use the example of income, in this equation the adult income (in natural logarithms) of
family i’s child would be Yi,t , which is equal to the average adult income of the children of
generation t, as represented by α, plus two factors determining the deviation from this average:
a fraction of parental permanent income (β Yi,t-1) and other influences not associated with
parental income (εi,t).
The average income of generations will evolve through time, and it may be that many
or all members of a generation will have incomes higher than what their parents had at a
similar age in the past. This is captured in equation (1) by the value of α. However, and just as
importantly, the equation reflects the idea that an individual’s income is nonetheless related to
his or her parents’ income. This is captured by the value of β, which represents the fraction of
income that is on average transmitted across the generations. In other words, β summarizes in a
single number the degree of generational income mobility in a society. It is often referred to as
the generational income elasticity, and could conceivably be any real number. A positive value
would indicate generational persistence of incomes in which higher parental income is
associated with higher child incomes; a negative number would indicate generational reversal
of incomes in which higher parental income is associated with lower child incomes. The
theoretical underpinning for this model is often motivated by Becker and Tomes (1979, 1986).
An extensive international literature on the degree of generational income and earnings
mobility using this framework has developed since the early 1990s, spurred by the availability
of sufficiently long panels of data and the publication of Solon (1989, 1992) and Zimmerman
(1992), which highlight the importance of measurement errors and methods to correct for them.
Many of these developments and issues are foreshadowed in Atkinson, Maynard and Trinder

5
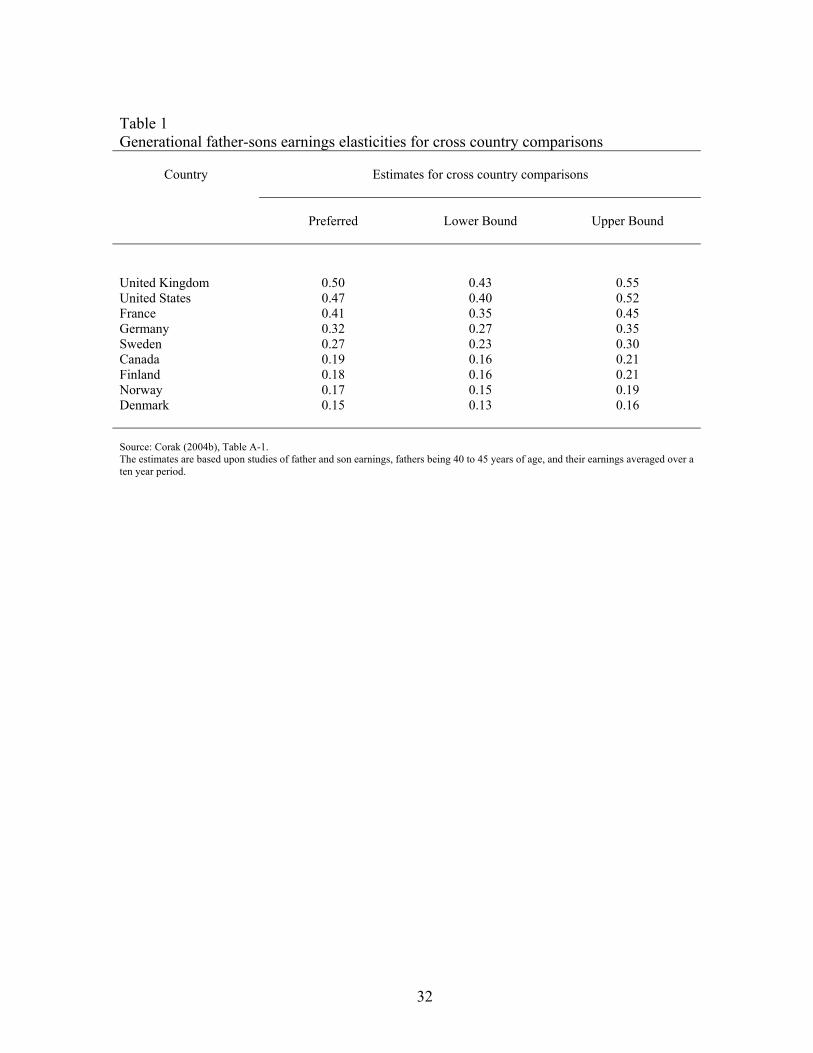
(1983). Corak (2004b) offers an overview of this literature and develops a set of internationally
comparable estimates of the earnings elasticity between fathers and sons. This information is
presented in Table 1. These results are based upon a meta-analysis of published estimates of
the intergenerational elasticity between father and sons’ earnings, accounting roughly for the
fact that published results differ according to the extent measurement errors are corrected, and
the point in the life cycle parental earnings are obtained. Information on daughters and on other
definitions of material resources is starting to become available in the literature but is still not
as extensive as the father-son relationship.
There is a good deal of variation across the rich countries in the degree to which
paternal earnings advantage is passed on to sons, by at least a factor of two from 20% or less to
40% or more. Further, in no country is the inherited parental advantage much lower than one-
fifth. The United States, the United Kingdom, and to a slightly lesser extent France, stand out
as being the least mobile societies, with 40 to 50% of fathers’ earnings advantage being passed
on to sons. At the other extreme are Denmark, Norway, Finland, and Canada with about 15 to
20% of earnings advantage passed across generations, and in an intermediate position Germany
and Sweden with about 30%.
There is little information of this sort directly related to the experience of immigrants.
The extent of generational mobility among immigrants may differ from that of native born
children for a number of reasons. First, there may also be differences in characteristics of
immigrant and native-born that are unobserved to the researcher, yet correlated with parental
income. The literature on immigration shows that immigrants may be a selected group along
not just their observed but also their unobserved (to the researcher) characteristics, reflecting
individual decisions to migrate and the administrative rules used by host countries (Aydemir
6
2003). Selection in unobserved traits such as ability or motivation may make immigrant
parents more or less efficient in human capital production of their children and thereby
influence their labour market outcomes. Immigrants may also be positively selected if there is a
dynastic motive in their migration decision, if they are more concerned about their children’s
outcomes than the average. To the extent that these unobservables are correlated with income
they will influence the estimated value of β in equation (1). Second, the degree of generational
mobility may differ among immigrants because of the role of what some analysts have referred
to as “ethnic” or “social” capital. Borjas (1993, 1994) points out that the estimates of β in
equation (1) may be higher for immigrants if the average value of Yi,t-1 over the members of the
community within which the child grows up plays a more important role in determining longer
run outcomes. The nature and degree of this influence may certainly vary across different
immigrant communities, but the presumption in the literature appears to be that on the whole it
is more important than for the population at large.1 Borjas (1992), for example, offers evidence
that this is the case in the United States.
Our approach to estimation is most closely related to that of Borjas (1992, 1993) and
particularly Card, DiNardo and Estes (2000). Using US data Borjas (1992) finds a significant
elasticity between parent and child education among both those born to immigrant parents and
those born to native-born parents. This relationship is weaker for the former, but he also finds
that, so-called, ethnic capital plays a major role in intergenerational mobility and more so for
immigrant children. This suggests that overall mobility among immigrants may be lower.
Similarly, Borjas (1993) finds strong intergenerational correlation between earnings of first and
1 Outcomes for second generation immigrants may also differ from the general population if immigrant parents differ from native-born parents in terms of the observed characteristics. For example, if immigrant parents have lower incomes then to the degree that generational mobility differs across the income distribution—to the degree, in other words, that the assumption of linearity embodied in equation (1) is in fact not correct—there may be differences in generational mobility between children born to immigrant parents and those of native-born parents.
7
second generation immigrant men. Card, DiNardo, and Estes (2000) using a similar method
find elasticities between the earnings of immigrant fathers and their children which—at about
0.5 to 0.6—are about the same or a bit higher as those reported in the existing US research on
the entire population. Card, DiNardo and Estes also find that children of immigrants tend to
have noticeably higher education and wages than the children of natives controlling for the
parental background. They also suggest that, at least for the more recent cohort under study,
this transmission of economic status across the generations works entirely through the impact
father’s education has on their children’s education and income.
The results of European research vary, though the focus is on educational attainment
and is informed by more than just the simple regression to the mean model depicted in
equation (1). Van Ours and Veenman (2003) study the Netherlands, Osterberg (2000) and
Rooth and Ekberg (2003) Sweden, Nielson (2003) Denmark, and Gang and Zimmerman
(2000), Riphan (2002 2003), and Fertig and Schmidt (2002) focus on Germany. In some cases,
like the Netherlands and Sweden, the educational attainment of second generation immigrants
is lower than children of native born parents and is related to parental education levels; in other
cases, like Denmark, it is lower but not related to parental education. However, in all of these
cases there seems to be little evidence suggesting that the degree of generational mobility is
different among immigrants than among the general population. In Germany the research
results are mixed, while for Sweden Osterberg (2000) also reports that intergenerational
education mobility is higher for immigrant men than for men with a Swedish background,
while the opposite is the case for the women.
The degree of generational mobility among immigrants has not been studied with
Canadian data. Corak and Heisz (1999) Corak (2001), Fortin and Lefebvre (1998), and Grawe
8
(2004a,b) present evidence for the general population, but the availability of appropriate data
have prevented an analysis focused on immigrants, though Sweetman and Dicks (2000) offer
an analysis by ethnicity. Our analysis is based upon a new question added to the 2001
Canadian Census that refers to the birthplace of the respondent’s parents. The so-called “Long
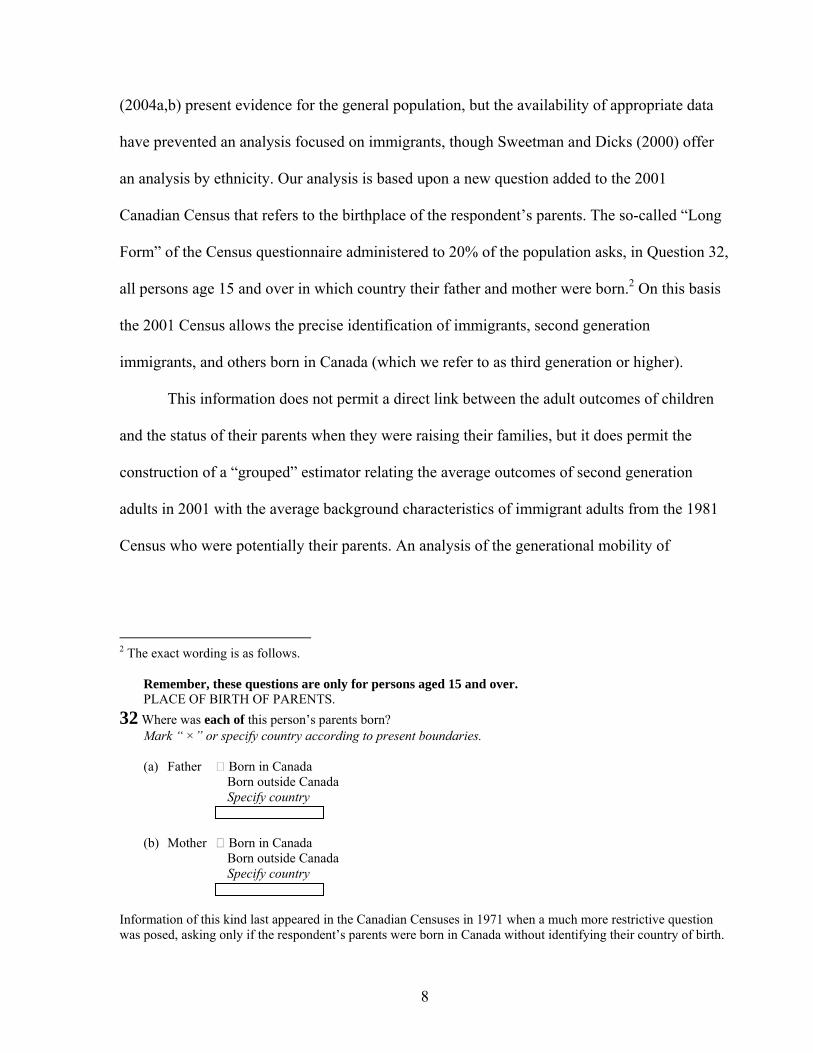
Form” of the Census questionnaire administered to 20% of the population asks, in Question 32,
all persons age 15 and over in which country their father and mother were born.2 On this basis
the 2001 Census allows the precise identification of immigrants, second generation
immigrants, and others born in Canada (which we refer to as third generation or higher).
This information does not permit a direct link between the adult outcomes of children
and the status of their parents when they were raising their families, but it does permit the
construction of a “grouped” estimator relating the average outcomes of second generation
adults in 2001 with the average background characteristics of immigrant adults from the 1981
Census who were potentially their parents. An analysis of the generational mobility of
2 The exact wording is as follows.
Remember, these questions are only for persons aged 15 and over. PLACE OF BIRTH OF PARENTS.
32 Where was each of this person’s parents born? Mark “ ×” or specify country according to present boundaries.
(a) Father Born in Canada
Born outside Canada Specify country
(b) Mother Born in Canada Born outside Canada Specify country
Information of this kind last appeared in the Canadian Censuses in 1971 when a much more restrictive question was posed, asking only if the respondent’s parents were born in Canada without identifying their country of birth.
9
immigrants using detailed country of origin along these lines is also offered in Borjas (1993)
and Card, DiNardo and Estes (2000).
We define first generation immigrants as those who immigrated to Canada regardless of
the age of arrival. For the most part we follow Card, DiNardo and Estes and define second
generation immigrants to be those Canadian born individuals whose mother and father were
both born outside of Canada.3 More specifically immigrant fathers are drawn from the 1981
Census and restricted to those individuals whose spouse is also an immigrant, and who have
children between the ages of 5 and 17 years. Using regression analysis average values of Yi,t-1
are calculated for each country of origin for individuals matching these criteria.
Correspondingly, the second generation sample consists of individuals between 25 and 37
years of age in 2001, and whose parents are both immigrants.4 Average values of Yi,t are
calculated for each country that the respondent report their fathers came from.
Since the variation in the outcome variables may arise from the differences in
demographic characteristics between country groups, we construct age- and region-adjusted
years of schooling and earnings outcomes for each country group of origin. For the immigrant
fathers, we regress the variable of interest (log weekly earnings) on age, age-squared, country
of origin dummies, province dummies, and country of origin dummies interacted with age and
age-squared. The inclusion of these interaction terms controls for differences in age-earnings
3 This said we test the sensitivity of the results to alternative definitions. In particular we re-classify first generation immigrants based on their age at immigration and the second generation immigrants based on whether one or both parents are foreign born. Borjas (1993) uses the less restrictive definition of second generation immigrants as those with at least one foreign born parent. We also restrict the sample to non-institutional residents aged 16 to 65 years. Individuals who resided outside the ten provinces and non-permanent residents are also excluded Non-permanent residents refer to persons in Canada on student or employment visas, Minister’s permits, or refugee claimants. 4 This is a tighter fit between the children of immigrants and their potential fathers than Card, DiNardo and Estes (2000) are able to construct with US data. For 30 source countries they relate the earnings and education of all immigrants in 1980 to all second generation individuals aged 16 to 65 in 2000. Our data permits us to examine the consequences of this slippage.

10
profiles across countries. We then calculate predicted schooling or earnings for each source
country at age 40. For the second generation sons and daughters we construct age- and region-
adjusted outcomes by regressing schooling or log weekly earnings on age, age-squared,
dummies for father’s country of origin, and region dummies; and then predicted outcomes for
each country group for a 31-year-old living in Ontario. These points in the life cycle
correspond roughly to that used in much of the generational earnings mobility literature, and in
particular the Canadian studies.
To avoid small sample size problems, we aggregate some countries in which
observations were less than 30 into groups and arrive at a total of 70 countries. This is done
separately for sons and daughters, and a list of these countries and summary statistics are
provided in Appendix Table 1. These 70 data points are used to estimate equation (1) for sons
and daughters using average weekly earnings as the outcome.
2. Descriptive overview
Since the 2001 Census marks the first time since 1971 that information on parental place of
birth is available we offer a descriptive overview of the Canadian population that places second
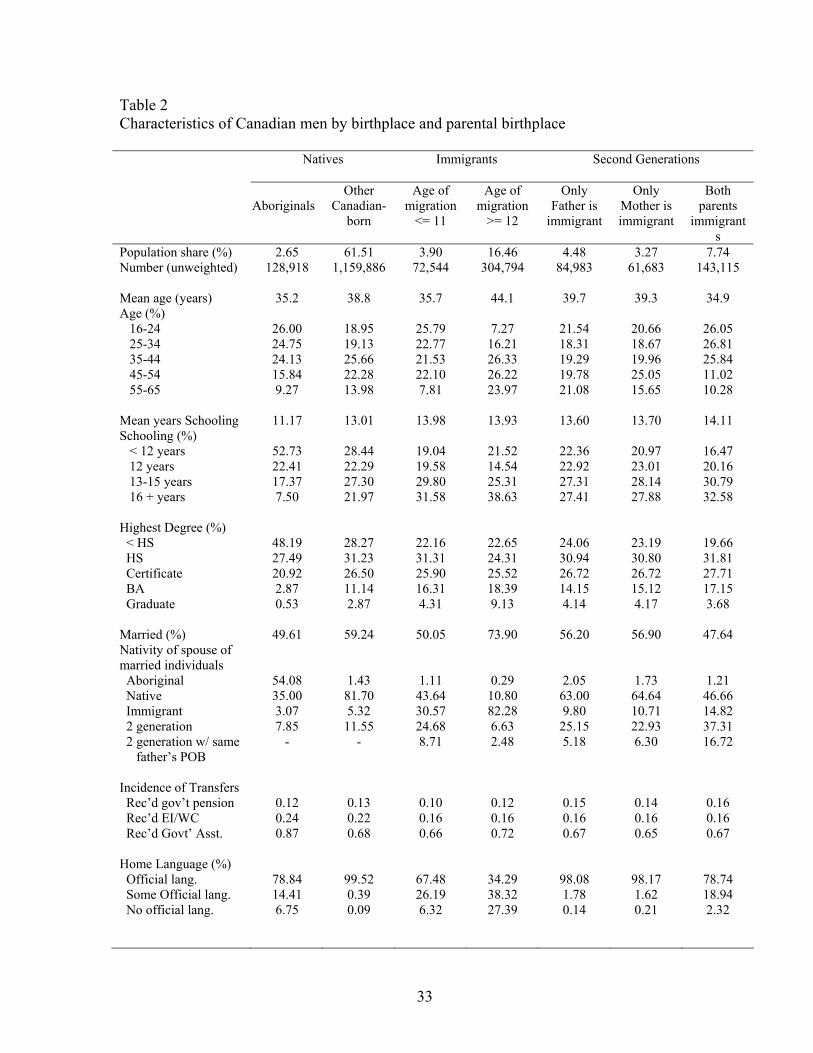
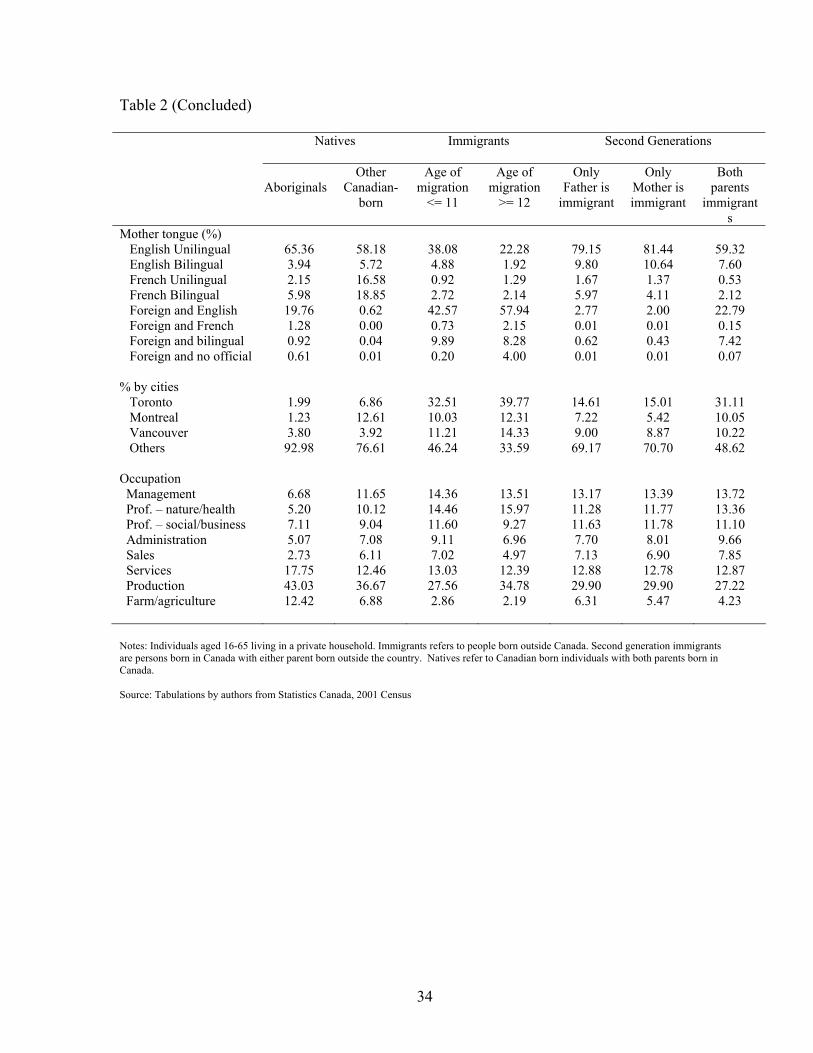
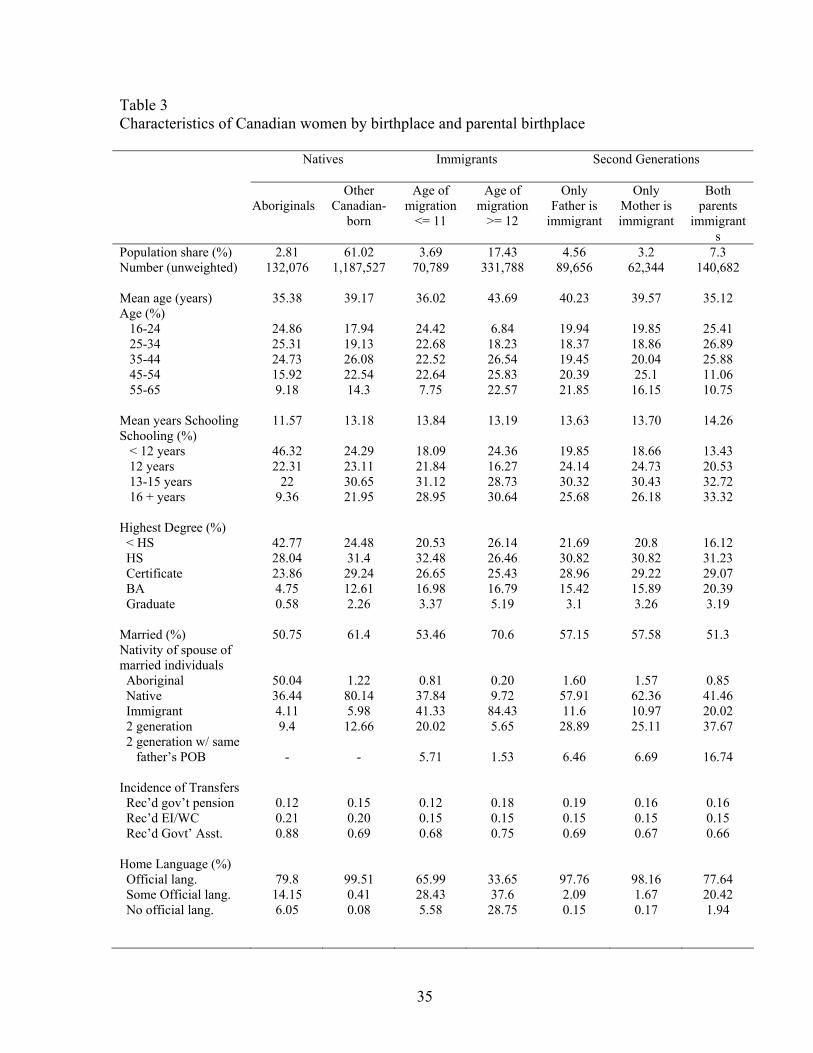
generation immigrants in a broader context. Tables 2 and 3 offer information on a number of
individual outcomes by parental origin respectively for men and women. The population is
classified into three broad groups: (1) so-called “native” Canadians, by which we mean either
those of aboriginal ancestry or those who are third generation or higher Canadians; (2)
immigrants, those born in a country other than Canada; and (3) second generation immigrants,
those born in Canada whose parents were born elsewhere. Since there is some suggestion in the
literature that long-run integration is related to language acquisition and age at migration we

11
divide the immigrant population into two groups, those arriving before the age of 12 and those
who were 12 or older when they arrived. The former group is likely to have spent some part of
their schooling in the Canadian elementary system and are more likely to have developed
better language skills. Studies have suggested that these are important considerations in
understanding the integration of immigrants (Worswick 2004). This could also mean they may
not differ in their adult outcomes from children who were actually born in Canada to
immigrant parents, the second generation group. We also categorize second generation
Canadians into three sub-groupings according to whether only the father is an immigrant, only
the mother, or both parents.
The weighted population shares suggest that in 2001 almost 65% of the Canadian
population aged 16 to 65 are “native”, in the neighbourhood of 20% are immigrants, and about
15% are born in Canada but have at least one parent born in another country. Immigrants and
second generation immigrants form, in other words, a sizable proportion of the Canadian
population. At the same time they tend to have more education than their native counterparts.5
Over 98% of second generation Canadians with one parent born elsewhere use either English
or French at the home, though at less than 80% this is noticeably lower for those with both
parents being immigrants. Further, this latter group is less likely to be married, and if they are
married much more likely than their native counterparts to have a spouse who is either an
immigrant or also a second generation Canadian.
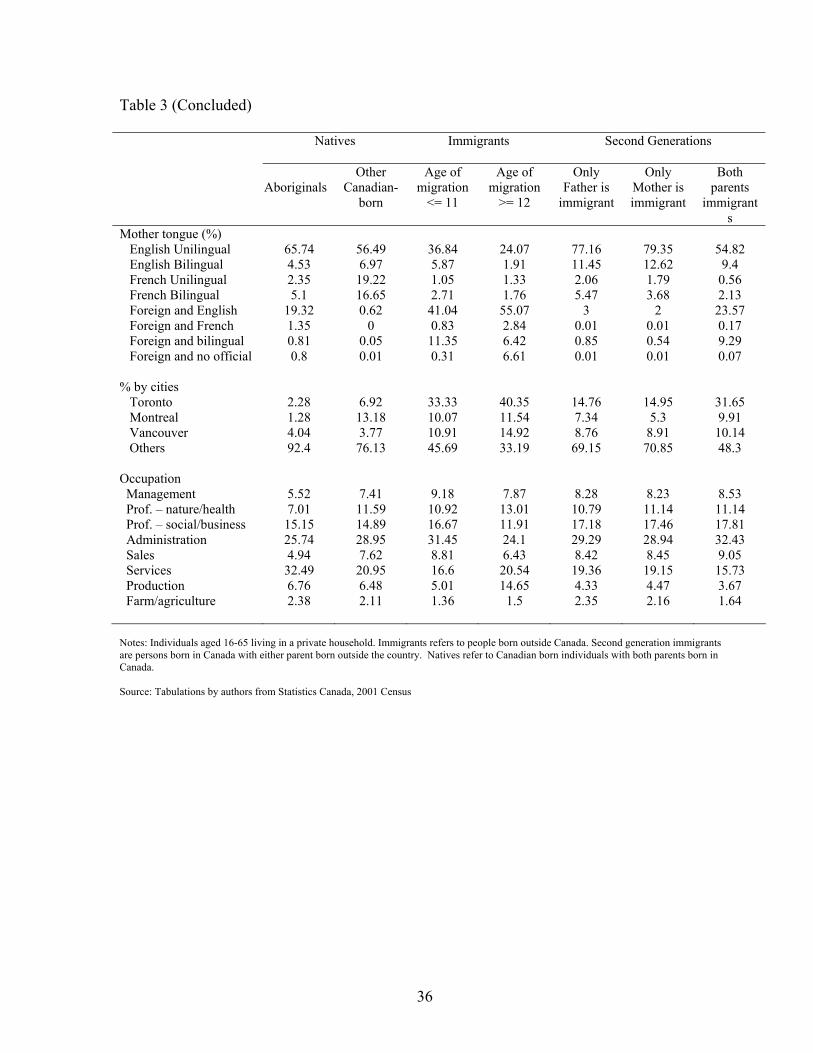
Tables 2 and 3 also show that second generation Canadians are not any more or less
likely to receive government income assistance, though less likely to receive other support
5 This is also the case when educational attainment is examined within finer age groupings. For example, among 25 to 34 year olds over 44% of second generation men with both parents born outside of Canada and about 50% of women have 16 or more years of schooling. This is the case for 30% of third generation or higher men and 35% of women. See Appendix Tables 2 and 3.
12
payments linked to the labour market such as unemployment insurance or disability payments.
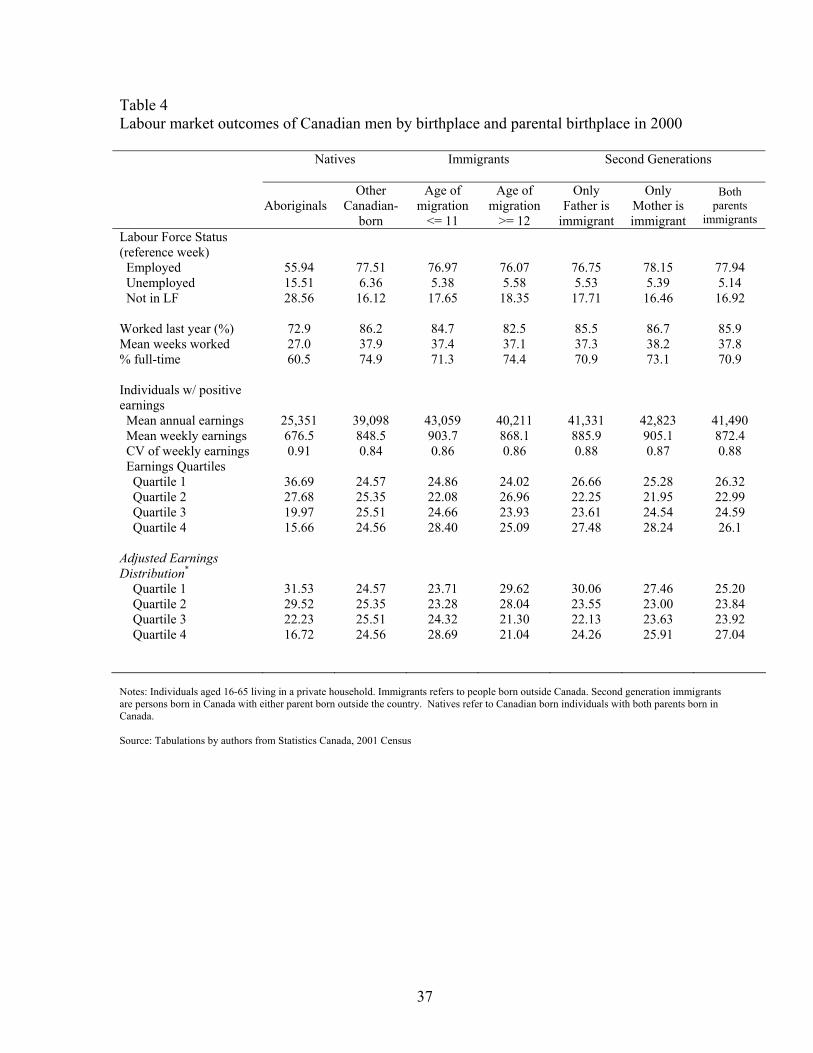
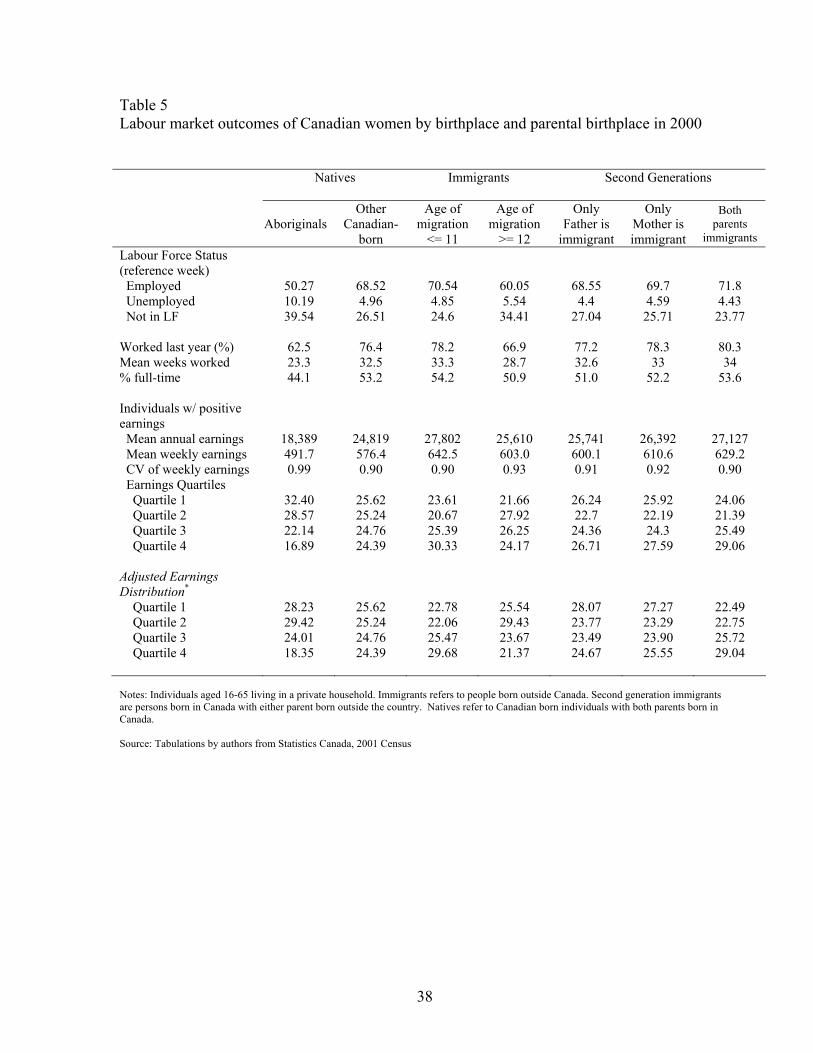
Tables 4 and 5 offer more detailed information on labour market outcomes. The labour market
engagement of the second generation group, however defined, is not any different than for third
or higher generation Canadians, whether measured by activity during the Census reference
week or activity during the year 2000. For women there is in fact a higher likelihood of
working in paid employment. Average annual earnings tend to be higher among immigrant and
second generation men, and noticeably more so for women. Second generation women whose
parents were both immigrants earned on average just over $27,000 in 2000 or about $630 per
week. In contrast third or higher generation Canadian women made less than $25,000 and
about $575 per week. These tables also offer the earnings distribution in quartiles. These
suggest that second generation Canadians are more likely to be in the bottom quartile if they
have only one parent born outside of Canada, but more likely to be in the top when both
parents were born elsewhere. Immigrants who arrived in the country before the age of 12 have
a similar distribution.
In sum, while this information is a very broad portrait of a very heterogeneous
population it does not suggest that second generation immigrants have inferior education and
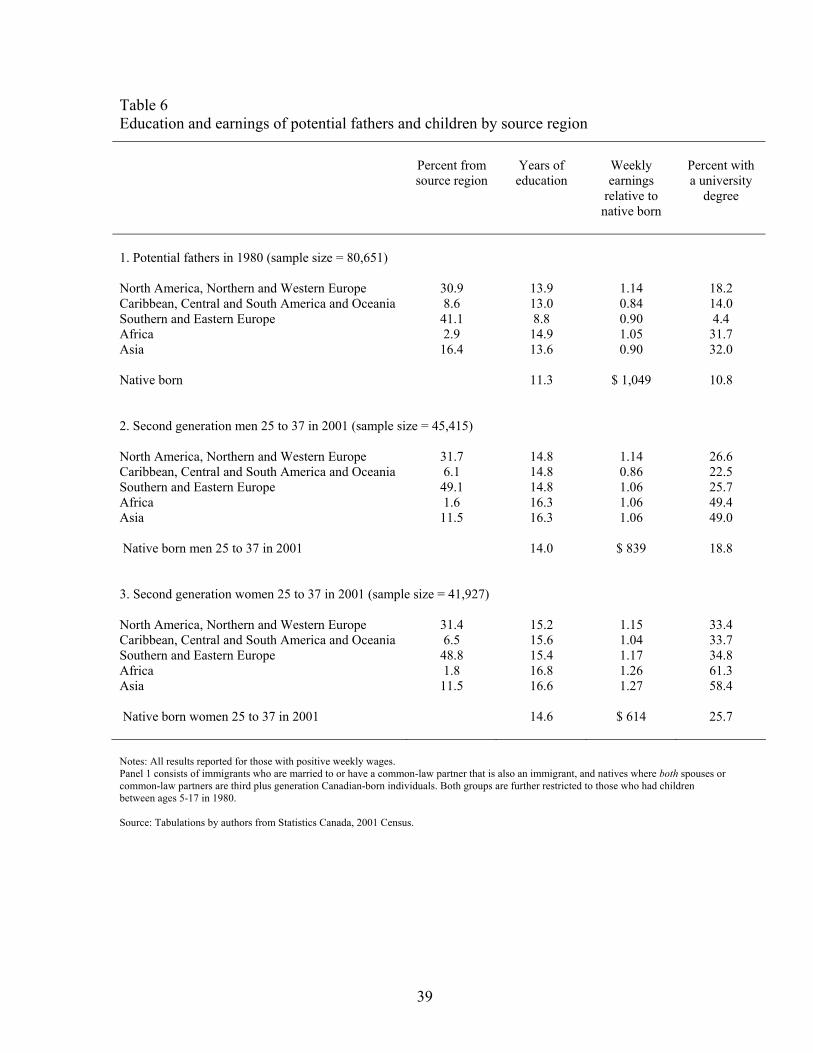
labour market outcomes than other Canadians, indeed likely just the opposite. Table 6 offers
information that is focused on the more finely defined sample of individuals that form the basis
for our intergenerational analysis: immigrants in the 1981 Census who had children 5 to 17
years of age, and second generation immigrants in the 2001 Census who were 25 to 37 years of
age. This information is offered by the region in which the parents were born. Generally these
outcomes are superior to those of the native population. With the exception of those from
Southern and Eastern Europe, immigrant fathers had more education and were more likely to

13
have a university degree than Canadian born fathers in 1981. Their weekly earnings, however,
were not on average as great with the clear exception of those from traditional source countries
of Canadian immigration. Those from North America, Northern Europe and Western Europe
earned 14% more than their native born counterparts; those from other parts of the world—
with the possible exception of Africa—earned 10 to 16% less.
This picture changes somewhat in the second generation. By 2001 those men 25 to 37
years of age who stated that their parents were born outside of Canada had more years of
schooling and a greater likelihood of holding a university degree than Canadians of the same
age whose parents were born in the country. With the exception of those from the Caribbean,
Central and South America, and Oceania they also had higher weekly earnings. The earnings
advantage is about 6% with the exception of those with parents from the traditional source
countries, where at 14% it is more than twice as great in spite of the fact that their schooling
advantage is not as great. A similar picture emerges for the potential daughters, though in this
case there is an education and earnings advantage regardless of the origins of the parents. Also
daughters with parents from the non traditional source countries have a higher earnings
advantage, one that for the most part matches or exceeds that of daughters with parents from
the traditional sources.
3. Least squares results of the average elasticity
Tables 7 and 8 offer a series of estimates of equation (1) using least squares for a number of
different sample selection rules, respectively for sons and daughters. The results in the first
three rows are all based on samples in which Canadian born individuals report that both of
their parents are born outside of Canada. They differ according to the age of these individuals,
14
and according to the age and family characteristics of their potential fathers who are drawn
from the 1981 Census. Our preferred estimates are in row 3, but this entire set of results is
intended to illustrate the impact of the potential slippage in associated sons with their actual
fathers by the use of a grouping estimator, and also to offer a basis for comparison with the US
literature.
The first two rows use a sample selection rule as similar as possible to those in Card,
DiNardo and Estes (2000). This is the broadest possible definition of second generation
immigrants and their potential fathers, using males between 16 and 65 years of age from the
two Censuses. The second row differs from the first in that we use the sons’ predicted earnings
at age 31 as the outcome of interest. This choice makes no difference to the estimated value of
β, which, focusing for the time being on men, is found to be 0.207. In contrast Card, DiNardo
and Estes (2000, table 6.7) report an elasticity of 0.44 for a fathers in 1940 and sons in 1970,
and 0.62 for fathers in 1970 and sons in 1995. As they note, and as suggested in Table 1, these
are in the range of reported estimates for the general US population. But they are significantly
higher than the estimate we obtain using their sample selection rules, though our larger sample
size of 70 is more than double the number they use.6
A more finely selected sample is used in row 3, with the ages of sons being narrowed to
include only 25 to 37 year olds and the sample of potential fathers including only immigrants
who are in a conjugal relationship and have children 5 to 17 years of age in 1981. This sample
is the tightest definition possible that links adult sons with their potential fathers. There will be
slippage in this sample if some immigrants and their families in the 1981 sample left the
country before 2001. This factor aside the estimate of β, at 0.267, suggests that the point
6 Their grouping estimator is based on 34 countries of origin for the 1940-1970 analysis and 33 for the 1970-1995 analysis.
15
estimates from the more broadly defined samples in rows 1 and 2 are an understatement of
about one-third. This said, the estimates are within one standard deviation of each other. The
only change introduced in row 4 is to broaden the sample of sons to include those with one
parent who was born in Canada, more akin to the definition used by Borjas (1993). The
estimate of the slope falls from 0.267 to 0.224, a difference of less than one standard error.
Finally row 5 reports the estimation results when the outcome of interest is defined to
be the natural logarithm of annual rather than weekly earnings. This is the outcome used in
much of the existing Canadian literature on generational earnings mobility as for example in
Corak and Heisz (1999) and Grawe (2004a,b), and as reported in Table 1. The resulting
estimate at 0.176 is almost exactly in line with these results.
In sum, the major conclusions from this table are: (1) that the best estimate of the
generational elasticity in father-son weekly earnings is 0.27; (2) that the generational elasticity
among the immigrant population in Canada is no different than for the population at large; and
(3) that this elasticity is lower, possibly about 50% lower, than in the United States.
Table 8 offers the least squares results for the father-daughter earnings relationship. All
of the estimated elasticities are not statistically different from zero, though the point estimates
suggest a very weak negative correlation. This is in contrast with both the existing Canadian
literature for the population at large and the findings of Card, DiNardo and Estes (2000). Two
Canadian based studies examine the generational mobility of daughters, focusing on annual
earnings. Fortin and Lefebvre (1998, table 4.3) use a similar estimator with Census data that is
based upon averages of occupational earnings to suggest that in 1994 the father-daughter
elasticity is in the neighbourhood of 0.22, though one of their estimates is as low as 0.14 it
remains statistically significant. Corak (2001, table 1) uses administrative data that directly link
16
fathers with their children and reports a father-daughter earnings elasticity of 0.20. Card,
DiNardo and Estes (2000, Table 6.7) report 0.21 for US immigrants using their 1940-70
sample, and 0.50 for their 1970-95 sample. The latter result is not significantly different from
the 0.62 reported for fathers and sons.7
Figures 1 and 2 are scatter plots of the 70 data points and the estimated regression lines
from rows 3 of Tables 7 and 8. The regression line is estimated with weighted observations so
the distance from the regression line in Figures 1 and 2 may not indicate the actual regression
residual. In order to draw further insights we identify any particularly influential data points by
successively dropping a single observation from the regression and re-estimating equation (1)
with the remaining 69 observations. We do this for each observation and obtain 69 separate
estimates of β, which are plotted in Figure 3 for sons and Figure 4 for daughters. The results
are always within one standard error of the preferred estimates in row 3 of Tables 7 and 8
based on all 70 observations. This exercise highlights that sons of fathers from China and the
UK have a noticeable impact on the point estimate, suggesting that they are more mobile than
the average. China also stands out in the results for daughters.8 The opposite is the case for
sons with fathers born in Greece. Though these observations stand out in Figure 3 it should
once again be stressed that the changes are not outside of the range of statistical uncertainty.
Accordingly our major conclusions are unchanged: in the case of the father-son relationship
none of these results are outside of the range of existing Canadian research; in the case of the
7 The estimates of the constant terms in these tables suggest that the weekly earnings of sons is on average about 5% higher than their fathers at a comparable stage in the life cycle, and that their annual earnings are between 8 and 9% higher. These results are a little higher for women, but roughly the same: weekly earnings that are 6 to 7% higher, and annual earnings that are 11% higher. 8 The relative shares of these countries in the entire population also determines the extent of the change in the estimated elasticity. For example, as Appendix Table 1 illustrates the UK has the second highest number of children in the data and therefore carries a relatively large weight in the weighted regressions.
17
father-daughter relationship none of the results are significantly different from zero; and finally
overall none of the results puts the estimate within the range of the US findings.9
We expand upon these results by talking a small first step in describing the
transmission of economic status across the generations. An often cited transmission mechanism
in determining intergenerational mobility is investment in education, and we explore the extent
to which these outcomes represent differential access to schooling in the following way.10 The
benefits of education in the labour market are represented as
Yi,t = ρ0 + ρ Ei,t + ui,t (2)
where ρ0 is a constant, Ei,t represents the number of years of education individual i has
obtained, ρ is the rate of return to an extra year, and ui,t represents influences on earnings other
than education. Education attainment is assumed to be dependent upon father’s earnings so
that
Ei,t = γ0 + γ Yi,t-1 + νi,t (3)
Together these relationships imply that Yi,t = (ρ0 + ργ0) + ργ Yi,t-1 + υi,t , where υi,t = ρ νi,t + ui,t .
This is in the form of equation (1) and implies that β = ργ + cov(Yi,t-1, ui,t)/var(Yi,t-1). In other
words the estimated magnitude of the generational earnings elasticity can be decomposed into
the influence of two components: those having to do with education (the return to education
and the influence of parental income on educational attainment), and those having to do with
the influence of family background through channels other than education.
9 For reference Figures 1 and 2 also include an observation for Canadian born men and women whose fathers were born in Canada. This observation is not used in the regression. In the case of Figure 1 this data point is below the regression line and in the lower right quadrant of all points, indicating that these parents have above average earnings but that the sons have below average adult outcomes. The earnings of the sons are lower than what their father’s income would predict from the relationship for second generation immigrants. This suggests that children from second generation families of the same earnings as those from Canadian born families will on average earn more, or equivalently that children from much lower earnings backgrounds will on average do better or no worse. 10 Similar decompositions are used in Blanden (2005), Blanden, Gregg and Machin (2005) and Österbacka (2004)
18
The results are presented in Table 9. First, the factors driving the overall estimates of
the generational elasticity are those running through pathways other than through educational
attainment. The relationship between father’s earnings and son’s educational attainment is
relatively weak, and the return to education for second generation men is low. The result is that
almost all of the 0.267 estimate for β is related to other channels. For daughters the return to
education is much higher, but access is less influenced by paternal earnings leaving a weak
correlation due to education that meshes with a weak negative influence from other familial
influences. There are no comparable results along these lines for the Canadian population at
large, but Blanden (2005, table 12) reports that in the UK, the US, and Germany from one-third
to one-half of the estimated generational elasticity is explained by influences associated with
educational attainment. Implicitly our results from this decomposition point to the importance
of other aspects of family background—unobserved characteristics or social capital—as
playing an important role in determining the degree of generational earnings mobility among
Canadian immigrants.
4. Social capital and equality of opportunity
In Borjas (1992) the impact of social capital is explicitly recognized by including the average
characteristics of the relevant community in equation (1) so that the estimating equation
becomes
Yi,t = α + β1 Yi,t-1 + β2 1−tY + εi,t (4)
Where 1−tY represents the average earnings of fathers from the same country. This is a
formulation for individual level data, and implies that our analysis based upon group averages
yields an estimate of β=(β1 + β2), making clear that this is potentially one reason why the
19
generational elasticity among immigrants may differ from the general population. However, as
Borjas (1992, p. 145) also makes clear the interpretation of this variable as social capital “is not
the only one consistent with the data. Such factors as discrimination or lack of access to
schools, credit markets, or other institutions can also generate a correlation between the skills
of children and the average skills of fathers in the ethnic group….” As such it would seem that
the focus on average outcomes, as estimated by least squares, obscures the role of social capital
with broader social factors that may also determine how group characteristics are valued by the
labour market.
This issue is similar to discussions in the generational earnings mobility literature of
interpreting β as an indictor of equality of opportunity. Roemer (2004, 1998) cautions that
estimates of regression to the mean models should not be taken as indicators of equality of
opportunity because parents influence their children through a hierarchy of circumstances.
Some of these will imply a correlation between earnings across the generations that most in
society would agree should not be eliminated.11 Least squares estimates focus on average
outcomes that blend all of these together.
Grawe (2004b) argues that this requires an estimation strategy explicitly addressing the
extent to which the outcomes of the highest-earning children of low-income families fall short
of the highest earnings children from high-income families. These are presumably individuals 11 To paraphrase his research, these circumstances are three in number: (1) through social connections that facilitate access to education and jobs; (2) through family culture and investments that influence skills, beliefs and motivation; and (3) through the genetic transmission of ability. The amount of parental income advantage passed on to children consistent with equality of opportunity is not self-apparent as each of these successively broader fields correspond to a broader definition of equality of opportunity. Roemer makes explicit that equating equality of opportunity with complete generational mobility implies that not only should the influence of social connections and also of family culture and investment be eliminated, but so should the genetic transmission of ability and the influence of family on the formation of preferences and goals among children. He suggests this is “a view that only a fraction of those who consider the issue would, upon reflection, endorse.” As such, this is a cautionary note to readers of generational income mobility studies. In other words, the view that the appropriate target for policy should be to eliminate entirely the income advantage that is passed on between parents and children—to aim for β=0 as a goal—would require a degree of intervention into the lives of children and families that the majority in most societies might find untenable.
20
who make the same type of choices, reflecting similar motivations and preferences. He applies
his argument to cross-country comparisons of the degree of equality of opportunity, and in
Grawe (2004a) tests for the presence of financial constraints in determining access to higher
education.
We paraphrase this reasoning to apply to immigrants with different kinds or levels of
social capital. Figure 1 can be used to illustrate the argument. The scatter plot is also divided
into four quadrants according to whether the weekly earnings are above and below the averages
for both fathers and sons. Countries in the lower left quadrant have below average paternal
earnings that are related with below average earnings for the sons, and in most cases below
what would be predicted by the regression line. Other countries, such as those in the upper left
quadrant with roughly similar paternal earnings are associated with much higher child
outcomes, and in some cases significantly above what would be predicted. If the unobserved
characteristics or social capital of these two communities differs significantly we would on
average expect different earnings outcomes among the children. The family and community
resources fostering beliefs and motivation or offering a network facilitating access to schooling
or particular jobs in a way valued by the Canadian labour market may be greater in one case
than in the other. If so we will expect the children from the relatively advantageous social
background to have higher earnings than their counterparts, and to be in the top left quadrant of
Figure 1.
We might also expect that these children are more likely to face any other barriers or
constraints in the way of economic success that might be imposed by society at large. In other
words, these broader social constraints might be more likely to be binding for this group. As
such if a researcher is interested in distinguishing the influence of social capital from the
21
barriers arising from the structures embedded in the education system or the labour market then
it makes some sense to focus on a best case scenario by examining the children who have the
most favourable stock of familial and community resources available to them. They are likely
to earn more than their counterparts from less advantaged backgrounds, but not as much as
they could have earned.
When applying this reasoning to testing the presence of credit constraints in the Becker-
Tomes model Grawe (2004b, pp. 822-23) suggests that quantile regressions offer an
appropriate methodological approach. If there is less than full equality of opportunity among
certain immigrant groups it will be identified by a strong generational elasticity among children
whose earnings are high conditional on their parent’s earnings. These elasticities should be
greater than those for children whose outcomes are low conditional on income. Grawe (2004b)
hypotheses that upper quantiles, in other words, should be steeper and be the factor driving the
generational elasticity calculated at the average through least squares.12 We therefore adopt this
approach with grouped data in order to begin a more detailed analysis of the least squares
results in a way that isolate the role of so-called “social capital” effects on the outcomes of
second generation children.
Tables 10 and 11 present the results for men and women respectively. The results for
the 25th, 50th, and 75th quantiles are offered and, for the sake of reference, the least squares
results from row 3 of Tables 7 and 8. Results from two models are presented, the first is
equation (1) and the second adds an additional co-variate, the average number of years of
education among fathers, to this equation. This latter formulation is meant to directly account
for one measure of potential social capital.
12 In addition to Grawe (2004a, b) quantile regression have also been used to study generational earnings mobility by Eide and Showalter (1999), but to the best of our knowledge they have not been used with specific reference to immigrants.
22
For men the quantile regression results suggest that the least squares estimate is in fact
driven by the upper part of the distribution. The generational earnings elasticity is about 0.18 at
the 25th and 50th quantiles, though the former is not statistically significant. This rises to 0.27 at
the 75th quantile, essentially the same value as the least squares results. Though, as Table 7
suggests, the least squares results may be roughly the same as the population as a whole, the
pattern in the quantile regression of an increasing elasticity is not. Grawe (2004, Table 4.3)
reports just the opposite tendency. In his sample the elasticity falls from 0.26 at the 25th
quantile, to 0.21 at the median, and finally to 0.16 at the 75th quantile.
Our results suggest that sons from low income immigrant backgrounds poised to be
higher income adults still do not do as well as those from higher income immigrant
backgrounds. Variations in social capital among the immigrant population may limit the degree
of generational mobility, but it also has something to do with the influence of broader social
institutions. This interaction is mediated by the average education levels of fathers. When this
covariate is added to the model the least squares results do not change appreciably, with the
generational earnings elasticity rising only slightly to 0.29. However, the quantile regression
results change in important ways. The estimates in the second panel of Table 10 suggest,
firstly, that the generational earnings elasticity is strongly positive at the lower end of the
income distribution, flat in the middle, and then turns negative at the top.
The estimated elasticity of 0.605 for the 25th quantile suggests that net of the influence
of parental education children from countries with on average low income backgrounds who
end up on average to have low income as adults are much more disadvantaged than their
counterparts from high income backgrounds. Further, the elasticity of -0.136 among the most
successful children of immigrants suggests there is an intergenerational reversal of earnings,
23
with the children of parents with below average earnings becoming above average earners in
the next generation. The change in the generational earnings elasticity across the two panels of
this table suggests that lower levels of parental education of the low income countries constrain
the outcomes of their most successful sons. It is as if having a more educated parent is
necessary to negotiate broader societal hurdles. The changes between the two panels is also
suggesting that parental education is important in ironing out the disadvantages that relatively
less successful sons from low income backgrounds experience relative to their counterparts
from high income backgrounds.
Table 11 presents the findings for women. The slopes of the quantiles are all very flat,
though positive at the bottom of the earnings distribution. Only the elasticity at the median is
statistically significant from zero, but at -0.08 it is small in magnitude. However, once paternal
years of education are controlled the results for women are in fact similar in kind to those for
men: positive at the lower end of the income distribution, flat in the middle, and then negative
at the top. The magnitudes are not as strong at the lower end as they are for sons, but stronger
at the upper end. For daughters the generational earnings elasticity of -0.723 suggests a strong
intergenerational reversal of earnings across the generations at the higher quantile so that net of
the influence of parental education the daughters from low income backgrounds are the high
income earners of the next generation. Thus, this is the major factor driving the differences
between the genders. Father’s education is correlated with income and plays a much stronger
role in determining daughter outcomes at the top end of the earnings distribution.
Taken together these patterns explain the results for the average derived from least
squares, distinguish the role of social capital from other community level influences, and paint
a more nuanced picture of the extent and nature of equality of opportunity among immigrants

24
and their children. The process determining the transmission of family background into adult
labour market success is very much mediated by aspects of family background other than
income. In particular the average years parental education among the previous generation plays
an important role in determining earnings and are an important dimension of social capital.
5. Conclusion
This paper examines the generational earnings mobility of Canadians born to immigrant
parents. The labour market assimilation of immigrants has long been a concern of both
research and policy, with the declining average earnings in a succession of recent cohorts
sparking a number of studies. In this context, however, it is also important to understand the
longer term implications and particularly the potential consequences for the adult labour
market success of children. If the degree of generational mobility is high, if in other words a
child’s adult earnings are only weakly correlated with parental earnings, then it may be that
relative disadvantages in childhood will not persist to the same extent in adulthood.
Generational mobility is in this sense an important aspect in gauging the labour market
integration of immigrants.
Our analysis uses new information from the 2001 Canadian Census and established
estimation procedures based on grouped averages to examine the strength of the link between
the weekly earnings of fathers and their sons and daughters. Second generation Canadians are a
significant proportion of the adult population, with at the broadest level about 15% of
Canadians having at least one parent born in another country. A descriptive overview of the
population suggests that the education attainments and labour market outcomes of second
generation Canadians are in the least no worse and in many ways better than those whose
25
parents were born in Canada. Second generation Canadians are less likely to lack high school
credentials and more likely to have a university degree; their incidence of reliance on
government transfer payments and rates of employment and unemployment are no different;
and their average earnings are greater.
We focus our analysis on a group of young adults whose parents were both born in a
country outside of Canada and examine the strength of the tie between their earnings from the
2001 Census and the earnings of immigrants in the 1981 census who are potentially their
fathers. Using group averages by country of birth we develop a sample that allows an unbiased
estimate of the earnings elasticity between fathers and children. On average second generation
children earn more than their parents did at a similar point in the life cycle. Their weekly
earnings are about 5 to 6 % higher, and their annual earnings are about 9 to 11% higher. At the
same time we find a statistically significant elasticity between father and son outcomes
suggesting that the son’s earnings will be about 2.7% higher for every 10% increase in father’s
earnings. This least squares estimate is less than half the value uncovered in comparable US
research. When measured in terms of annual earnings we find an intergenerational elasticity of
0.18, a result very similar to the findings for the general Canadian population in the existing
literature. The degree of generational earnings mobility between fathers and sons is on average
no different among the sons of immigrants to Canada than it is for the population as a whole.
Further, by international standards this is a relatively high degree of mobility. If it remained
unchanged it would imply there would on average be virtually no relationship between the
earnings of immigrants and the earnings of their grandchildren. We also find that there does not
appear to be any statistically significant relationship at all between father and daughter
earnings.

26
Our analysis suggests that the transmission of earnings across generations works only
slightly through the impact of paternal earnings on the education attainment of children. There
is a strong tie between the paternal earnings and the number of years son attends school, but the
return to education is relatively low so that only about 5% of the 0.27 elasticity is due directly
to educational attainment. Other channels between family background and adult earnings are
much more important.
Our use of grouped averages abstracts from within country variation in outcomes and
puts the focus on one often cited channel: the average characteristics of the community to
which the child belongs, so-called “social capital.” We find that a very important dimension of
this is the average level of paternal education. More educated communities are able to steer
their children through the barriers they may face in broader society in a way that gives them an
advantage. By using quantile regressions we find the generational elasticity calculated by least
squares for the average is driven by the upper part of the son’s earnings distribution. This result
is consistent with the idea that broader societal institutions limit the earnings prospective of the
most successful children from low earnings backgrounds. If average paternal education levels
are controlled we find a generational reversal of earnings, with sons from below average
backgrounds becoming above average earners in their adulthood. These results are similar in
kind for daughters.
In sum, relative earnings advantages and disadvantages in the first generation of
immigration to Canada are only weakly passed on to the second generation, suggesting that in
the past there has been a rapid integration of the children of immigrants into the mainstream of
the Canadian labour market. To the extent that there is a relationship between the generations it
comes mostly from the fact that the highest achieving sons of low income immigrants do not

27
earn as much as the highest achieving sons of high income immigrants. But it should be
stressed that by the very nature of the analysis these results refer to a group of young
Canadians whose parents came to Canada before 1980, and who came of age in the context of
the education system of the 1980s and the labour market of the 1990s. The extent to which
these patterns continue to hold into the future and remain relevant for the children of more
recent cohorts of immigrants is an important issue in understanding their prospects.
28
Bibliography Atkinson, A.B., A.K. Maynard, and C.G. Trinder (1983). Parents and Children: Incomes in
Two Generations. London: Heinemann. Aydemir, A. (2003). “Effects of Selection Criteria and Economic Opportunities on the
Characteristics of Immigrants.” Statistics Canada Research Paper, no. 182. Aydemir, A. and M. Skuterud (2005). “Explaining the Deteriorating Entry Earnings of
Canada’s Immigrant Cohorts: 1966-2000.” Canadian Journal of Economics. Vol. 38, pp. 641-71.
Becker, Gary S. and Nigel Tomes (1986). “Human Capital and the Rise and Fall of Families.”
Journal of Labor Economics. Vol. 4, pp. S1-S39. Becker, Gary S. and Nigel Tomes (1979). “An Equilibrium Theory of the Distribution of
Income and Intergenerational Mobility.” Journal of Political Economy. Vol. 87, pp. 1153-89.
Björklund, Anders and Markus Jäntti (2000). “Intergenerational Mobility of Economic Status
in Comparative Perspective.” Nordic Journal of Political Economy. Vol. 26, pp. 3-32. Blanden, Jo (2005). “International Evidence on Intergenerational Mobility.” London School of
Economics, Centre for Economic Performance, Unpublished paper. Blanden, Jo, Paul Gregg, and Stephen Machin (2005). “Intergenerational Mobility in Europe
and North America.” London School of Economics, Centre for Economic Performance, Unpublished paper.
Borjas, George J. (1994). “Long-Run Convergence of Ethnic Skill Differentials: The Children
and Grandchildren of the Great Migration.” Industrial and Labor Relations Review. Vol. 47, pp 553-73.
Borjas, George J. (1993). “The Intergenerational Mobility of Immigrants.” Journal of Labor
Economics. Vol. 11, pp 113-35. Borjas, George J. (1992). “Ethnic Capital and Intergenerational Mobility.” Quarterly Journal
of Economics. Vol. 107, pp. 123-50. Bowles, Samuel, Herbert Gintis, and Melissa Osborne Groves, editors (2005). Unequal
Chances: Family Background and Economic Success. New York: Russell Sage Foundation.
Card, Davd, John DiNardo and Eugena Estes (2000). “The More Things Change, Immigrants
and the Children of Immigrants in the 1940s, the 1970s, and the 1990s.” In G.
29
Borjas(editor), Issues in the Economics of Immigration. Chicago: NBER and University of Chicago Press.
Corak, Miles editor (2004a), Generational Income Mobility in North America and Europe.
Cambridge: Cambridge University Press. Corak, M.(2004b). “Do poor children become poor adults? Lessons for public policy from a
cross country comparison of generational earnings mobility.” Paper presented at Colloque Le Devenier des Enfants De Familes Défavourisées en France, April.
Corak, Miles (2001). “Are the Kids All Right? Intergenerational Mobility and Child Well-
Being in Canada.” In Keith Banting, Andrew Sharpe, and France St-Hiliare (editors), The Longest Decade: Canada in the 1990s, The Review of Economic Performance and Social Progress Vol. 1. Montreal: Institute for Research on Public Policy and Centre for the Study of Living Standards.
Corak, Miles and Andrew Heisz (1999). “The Intergenerational Earnings and Income Mobility
of Canadian Men: Evidence from Longitudinal Income Tax Data.” Journal of Human Resources. Vol. 34, pp. 504-33.
Eide, Eric R. and Mark H. Showalter (1999). “Factors Affecting the Transmission of Earnings
Across Generations: A Quantile Regression Approach.” Journal of Human Resources. Vol. 34, pp. 553-67.
Fertig M. and C.M. Schmidt (2002). “First- and Second-Generation Migrants in Germany –
What do We Know and What do People Think” In R. Rotte and P. Stein (editors), Migration Policy and the Economy: International Experiences (Studies and Comments 1). Munich: Hans Seidel-Stiftung.
Fortin, Nicole M. and Sophie Lefebvre (1998). “Intergenerational Income Mobility in Canada.”
In Miles Corak (editor), Labour Markets, Social Institutions, and the Future of Canada’s Children. Ottawa: Statistics Canada, catalogue no. 89-553.
Gang Ira N. and Klaus F. Zimmermann (2000). “Is Child Like Parent? Educational Attainment
and Ethnic Origin.” Journal of Human Resources. Vol. 35, pp. 550-569. Grawe, Nathan D. (2004a). “Reconsidering the Use of Nonlinearities in Intergenerational
Earnings Mobility as a Test for Credit Constraints.” Journal of Human Resources. Vol. 39, pp. 813-827.
Grawe, Nathan D. (2004b). “Intergenerational mobility for whom? The experience of high- and
low-earning sons in international perspective.” In Miles Corak (editor), Generational Income Mobility in North America and Europe. Cambridge: Cambridge University Press.
30
Nielsen, H.S., M. Rosholm, N. Smith and L. Husted (2003). “The School-to-Work Transition of 2nd Generation Immigrants in Denmark.” Journal of Population Economics. Vol. 16, pp. 755-86.
Österbacka, Eva (2004). It Runs in the Family: Empirical Analyses of Family Background and
Economic Status. PhD Thesis, Åbo Akademi Press. Osterberg, T. (2000). “Economic Perspectives on Immigrants and Intergenerational
Transmissions.” Ekomiska Studier. Vol. 102, Goteborgs Universitet, Sweden. Riphahn, R.T. (2002). “Residential Location and Youth Unemployment : The Economic
Geography of School-to-Work Transitions.” Journal of Population Economics. Vol. 15, pp. 115-135.
Riphahn, R.T. (2003). “Cohort Effects in the Educational Attainment of Second Generation
Immigrants in Germany: An Analysis of Census Data.” Journal of Population Economics. Vol. 16, pp. …
Roemer, John E. (2004). “Equal opportunity and intergenerational mobility: going beyond
intergenerational income transition matrices.” In Miles Corak (editor), Generational Income Mobility in North America and Europe. Cambridge: Cambridge University Press.
Roemer, John E. (1998). Equality of Opportunity. Cambridge, MA: Harvard University Press. Rooth, D-O and J. Ekberg (2003). “Unemployment and Earnings of second Generation
Immigrants in Sweden. Ethnic Background and Parent Composition.” Journal of Population Economics. Vol. 16, pp. 787-814.
Scott, Janny and David Leonhardt (2005). “Class in America: Shadowy Lines That Still
Divide.” New York Times. Vol. CLIV No. 53,215, May 15th, page 1. Solon, Gary (2002). “Cross-country Differences in Intergenerational Income Mobility.”
Journal of Economic Perspectives. Vol. 16, pp. 59-66. Solon, Gary (1999). “Intergenerational Mobility in the Labor Market.” In Orley C. Ashenfelter
and David Card (editors). Handbook of Labor Economics, Volume 3A. Amsterdam: Elsevier Science.
Solon, Gary (1992). “Intergenerational Income Mobility in the United States.” American
Economic Review. Vol. 82, pp. 393-408. Solon, Gary (1989). “Biases in the Estimation of Intergenerational Earnings Correlations.”
Review of Economics and Statistics. Vol. 71, pp. 172-74. Sweetman, Arthur and Gordon Dicks (2000). “Education and Ethnicity in Canada: An
Intergenerational Perspective.” Journal of Human Resources. Vol. 34, pp. 668-96.
31
Van Ours J.C., and J. Veenman (2003). “The Educational Attainment of Second Generation
Immigrants in the Netherlands.” Journal of Population Economics. Vol. 16, pp. … Worswick, Christopher J. (2004). “Adaptation and inequality: Children of immigrants in
Canadian Schools.” Canadian Journal of Economics. Vol. 37, pp. 53-77. Wessel, David (2005). “As Rich-Poor Gap Widens in the U.S., Class Mobility Stalls.” Wall
Street Journal. Vol. CCXLV no. 94, May 13th, page 1. Zimmerman, D. (1992). “Regression toward Mediocrity in Economic Stature.” American
Economic Review. Vol. 82, pp. 409-29.
32
Table 1 Generational father-sons earnings elasticities for cross country comparisons
Country
Estimates for cross country comparisons
Preferred
Lower Bound
Upper Bound
United Kingdom 0.50 0.43 0.55 United States 0.47 0.40 0.52 France 0.41 0.35 0.45 Germany 0.32 0.27 0.35 Sweden 0.27 0.23 0.30 Canada 0.19 0.16 0.21 Finland 0.18 0.16 0.21 Norway 0.17 0.15 0.19 Denmark 0.15 0.13 0.16 Source: Corak (2004b), Table A-1. The estimates are based upon studies of father and son earnings, fathers being 40 to 45 years of age, and their earnings averaged over a ten year period.
33
Table 2 Characteristics of Canadian men by birthplace and parental birthplace Natives Immigrants Second Generations
Aboriginals Other
Canadian-born
Age of migration
<= 11
Age of migration
>= 12
Only Father is
immigrant
Only Mother is immigrant
Both parents
immigrants
Population share (%) 2.65 61.51 3.90 16.46 4.48 3.27 7.74 Number (unweighted) 128,918 1,159,886 72,544 304,794 84,983 61,683 143,115 Mean age (years) 35.2 38.8 35.7 44.1 39.7 39.3 34.9 Age (%) 16-24 26.00 18.95 25.79 7.27 21.54 20.66 26.05 25-34 24.75 19.13 22.77 16.21 18.31 18.67 26.81 35-44 24.13 25.66 21.53 26.33 19.29 19.96 25.84 45-54 15.84 22.28 22.10 26.22 19.78 25.05 11.02 55-65 9.27 13.98 7.81 23.97 21.08 15.65 10.28 Mean years Schooling 11.17 13.01 13.98 13.93 13.60 13.70 14.11 Schooling (%) < 12 years 52.73 28.44 19.04 21.52 22.36 20.97 16.47 12 years 22.41 22.29 19.58 14.54 22.92 23.01 20.16 13-15 years 17.37 27.30 29.80 25.31 27.31 28.14 30.79 16 + years 7.50 21.97 31.58 38.63 27.41 27.88 32.58 Highest Degree (%) < HS 48.19 28.27 22.16 22.65 24.06 23.19 19.66 HS 27.49 31.23 31.31 24.31 30.94 30.80 31.81 Certificate 20.92 26.50 25.90 25.52 26.72 26.72 27.71 BA 2.87 11.14 16.31 18.39 14.15 15.12 17.15 Graduate 0.53 2.87 4.31 9.13 4.14 4.17 3.68 Married (%) 49.61 59.24 50.05 73.90 56.20 56.90 47.64 Nativity of spouse of married individuals Aboriginal 54.08 1.43 1.11 0.29 2.05 1.73 1.21 Native 35.00 81.70 43.64 10.80 63.00 64.64 46.66 Immigrant 3.07 5.32 30.57 82.28 9.80 10.71 14.82 2 generation 7.85 11.55 24.68 6.63 25.15 22.93 37.31 2 generation w/ same father’s POB
- - 8.71 2.48 5.18 6.30 16.72
Incidence of Transfers Rec’d gov’t pension 0.12 0.13 0.10 0.12 0.15 0.14 0.16 Rec’d EI/WC 0.24 0.22 0.16 0.16 0.16 0.16 0.16 Rec’d Govt’ Asst. 0.87 0.68 0.66 0.72 0.67 0.65 0.67 Home Language (%) Official lang. 78.84 99.52 67.48 34.29 98.08 98.17 78.74 Some Official lang. 14.41 0.39 26.19 38.32 1.78 1.62 18.94 No official lang. 6.75 0.09 6.32 27.39 0.14 0.21 2.32
34
Table 2 (Concluded) Natives Immigrants Second Generations
Aboriginals Other
Canadian-born
Age of migration
<= 11
Age of migration
>= 12
Only Father is
immigrant
Only Mother is immigrant
Both parents
immigrants
Mother tongue (%) English Unilingual 65.36 58.18 38.08 22.28 79.15 81.44 59.32 English Bilingual 3.94 5.72 4.88 1.92 9.80 10.64 7.60 French Unilingual 2.15 16.58 0.92 1.29 1.67 1.37 0.53 French Bilingual 5.98 18.85 2.72 2.14 5.97 4.11 2.12 Foreign and English 19.76 0.62 42.57 57.94 2.77 2.00 22.79 Foreign and French 1.28 0.00 0.73 2.15 0.01 0.01 0.15 Foreign and bilingual 0.92 0.04 9.89 8.28 0.62 0.43 7.42 Foreign and no official 0.61 0.01 0.20 4.00 0.01 0.01 0.07 % by cities Toronto 1.99 6.86 32.51 39.77 14.61 15.01 31.11 Montreal 1.23 12.61 10.03 12.31 7.22 5.42 10.05 Vancouver 3.80 3.92 11.21 14.33 9.00 8.87 10.22 Others 92.98 76.61 46.24 33.59 69.17 70.70 48.62 Occupation Management 6.68 11.65 14.36 13.51 13.17 13.39 13.72 Prof. – nature/health 5.20 10.12 14.46 15.97 11.28 11.77 13.36 Prof. – social/business 7.11 9.04 11.60 9.27 11.63 11.78 11.10 Administration 5.07 7.08 9.11 6.96 7.70 8.01 9.66 Sales 2.73 6.11 7.02 4.97 7.13 6.90 7.85 Services 17.75 12.46 13.03 12.39 12.88 12.78 12.87 Production 43.03 36.67 27.56 34.78 29.90 29.90 27.22 Farm/agriculture 12.42 6.88 2.86 2.19 6.31 5.47 4.23 Notes: Individuals aged 16-65 living in a private household. Immigrants refers to people born outside Canada. Second generation immigrants are persons born in Canada with either parent born outside the country. Natives refer to Canadian born individuals with both parents born in Canada. Source: Tabulations by authors from Statistics Canada, 2001 Census
35
Table 3 Characteristics of Canadian women by birthplace and parental birthplace Natives Immigrants Second Generations
Aboriginals Other
Canadian-born
Age of migration
<= 11
Age of migration
>= 12
Only Father is
immigrant
Only Mother is immigrant
Both parents
immigrants
Population share (%) 2.81 61.02 3.69 17.43 4.56 3.2 7.3 Number (unweighted) 132,076 1,187,527 70,789 331,788 89,656 62,344 140,682 Mean age (years) 35.38 39.17 36.02 43.69 40.23 39.57 35.12 Age (%) 16-24 24.86 17.94 24.42 6.84 19.94 19.85 25.41 25-34 25.31 19.13 22.68 18.23 18.37 18.86 26.89 35-44 24.73 26.08 22.52 26.54 19.45 20.04 25.88 45-54 15.92 22.54 22.64 25.83 20.39 25.1 11.06 55-65 9.18 14.3 7.75 22.57 21.85 16.15 10.75 Mean years Schooling 11.57 13.18 13.84 13.19 13.63 13.70 14.26 Schooling (%) < 12 years 46.32 24.29 18.09 24.36 19.85 18.66 13.43 12 years 22.31 23.11 21.84 16.27 24.14 24.73 20.53 13-15 years 22 30.65 31.12 28.73 30.32 30.43 32.72 16 + years 9.36 21.95 28.95 30.64 25.68 26.18 33.32 Highest Degree (%) < HS 42.77 24.48 20.53 26.14 21.69 20.8 16.12 HS 28.04 31.4 32.48 26.46 30.82 30.82 31.23 Certificate 23.86 29.24 26.65 25.43 28.96 29.22 29.07 BA 4.75 12.61 16.98 16.79 15.42 15.89 20.39 Graduate 0.58 2.26 3.37 5.19 3.1 3.26 3.19 Married (%) 50.75 61.4 53.46 70.6 57.15 57.58 51.3 Nativity of spouse of married individuals Aboriginal 50.04 1.22 0.81 0.20 1.60 1.57 0.85 Native 36.44 80.14 37.84 9.72 57.91 62.36 41.46 Immigrant 4.11 5.98 41.33 84.43 11.6 10.97 20.02 2 generation 9.4 12.66 20.02 5.65 28.89 25.11 37.67 2 generation w/ same father’s POB
-
- 5.71 1.53 6.46 6.69 16.74
Incidence of Transfers Rec’d gov’t pension 0.12 0.15 0.12 0.18 0.19 0.16 0.16 Rec’d EI/WC 0.21 0.20 0.15 0.15 0.15 0.15 0.15 Rec’d Govt’ Asst. 0.88 0.69 0.68 0.75 0.69 0.67 0.66 Home Language (%) Official lang. 79.8 99.51 65.99 33.65 97.76 98.16 77.64 Some Official lang. 14.15 0.41 28.43 37.6 2.09 1.67 20.42 No official lang. 6.05 0.08 5.58 28.75 0.15 0.17 1.94
36
Table 3 (Concluded) Natives Immigrants Second Generations
Aboriginals Other
Canadian-born
Age of migration
<= 11
Age of migration
>= 12
Only Father is
immigrant
Only Mother is immigrant
Both parents
immigrants
Mother tongue (%) English Unilingual 65.74 56.49 36.84 24.07 77.16 79.35 54.82 English Bilingual 4.53 6.97 5.87 1.91 11.45 12.62 9.4 French Unilingual 2.35 19.22 1.05 1.33 2.06 1.79 0.56 French Bilingual 5.1 16.65 2.71 1.76 5.47 3.68 2.13 Foreign and English 19.32 0.62 41.04 55.07 3 2 23.57 Foreign and French 1.35 0 0.83 2.84 0.01 0.01 0.17 Foreign and bilingual 0.81 0.05 11.35 6.42 0.85 0.54 9.29 Foreign and no official 0.8 0.01 0.31 6.61 0.01 0.01 0.07 % by cities Toronto 2.28 6.92 33.33 40.35 14.76 14.95 31.65 Montreal 1.28 13.18 10.07 11.54 7.34 5.3 9.91 Vancouver 4.04 3.77 10.91 14.92 8.76 8.91 10.14 Others 92.4 76.13 45.69 33.19 69.15 70.85 48.3 Occupation Management 5.52 7.41 9.18 7.87 8.28 8.23 8.53 Prof. – nature/health 7.01 11.59 10.92 13.01 10.79 11.14 11.14 Prof. – social/business 15.15 14.89 16.67 11.91 17.18 17.46 17.81 Administration 25.74 28.95 31.45 24.1 29.29 28.94 32.43 Sales 4.94 7.62 8.81 6.43 8.42 8.45 9.05 Services 32.49 20.95 16.6 20.54 19.36 19.15 15.73 Production 6.76 6.48 5.01 14.65 4.33 4.47 3.67 Farm/agriculture 2.38 2.11 1.36 1.5 2.35 2.16 1.64 Notes: Individuals aged 16-65 living in a private household. Immigrants refers to people born outside Canada. Second generation immigrants are persons born in Canada with either parent born outside the country. Natives refer to Canadian born individuals with both parents born in Canada. Source: Tabulations by authors from Statistics Canada, 2001 Census
37
Table 4 Labour market outcomes of Canadian men by birthplace and parental birthplace in 2000 Natives Immigrants Second Generations
Aboriginals Other
Canadian-born
Age of migration
<= 11
Age of migration
>= 12
Only Father is
immigrant
Only Mother is immigrant
Both parents
immigrants Labour Force Status (reference week)
Employed 55.94 77.51 76.97 76.07 76.75 78.15 77.94 Unemployed 15.51 6.36 5.38 5.58 5.53 5.39 5.14 Not in LF 28.56 16.12 17.65 18.35 17.71 16.46 16.92 Worked last year (%) 72.9 86.2 84.7 82.5 85.5 86.7 85.9 Mean weeks worked 27.0 37.9 37.4 37.1 37.3 38.2 37.8 % full-time 60.5 74.9 71.3 74.4 70.9 73.1 70.9 Individuals w/ positive earnings
Mean annual earnings 25,351 39,098 43,059 40,211 41,331 42,823 41,490 Mean weekly earnings 676.5 848.5 903.7 868.1 885.9 905.1 872.4 CV of weekly earnings 0.91 0.84 0.86 0.86 0.88 0.87 0.88 Earnings Quartiles Quartile 1 36.69 24.57 24.86 24.02 26.66 25.28 26.32 Quartile 2 27.68 25.35 22.08 26.96 22.25 21.95 22.99 Quartile 3 19.97 25.51 24.66 23.93 23.61 24.54 24.59 Quartile 4 15.66 24.56 28.40 25.09 27.48 28.24 26.1 Adjusted Earnings Distribution*
Quartile 1 31.53 24.57 23.71 29.62 30.06 27.46 25.20 Quartile 2 29.52 25.35 23.28 28.04 23.55 23.00 23.84 Quartile 3 22.23 25.51 24.32 21.30 22.13 23.63 23.92 Quartile 4 16.72 24.56 28.69 21.04 24.26 25.91 27.04 Notes: Individuals aged 16-65 living in a private household. Immigrants refers to people born outside Canada. Second generation immigrants are persons born in Canada with either parent born outside the country. Natives refer to Canadian born individuals with both parents born in Canada. Source: Tabulations by authors from Statistics Canada, 2001 Census
38
Table 5 Labour market outcomes of Canadian women by birthplace and parental birthplace in 2000 Natives Immigrants Second Generations
Aboriginals Other
Canadian-born
Age of migration
<= 11
Age of migration
>= 12
Only Father is
immigrant
Only Mother is immigrant
Both parents
immigrants Labour Force Status (reference week)
Employed 50.27 68.52 70.54 60.05 68.55 69.7 71.8 Unemployed 10.19 4.96 4.85 5.54 4.4 4.59 4.43 Not in LF 39.54 26.51 24.6 34.41 27.04 25.71 23.77 Worked last year (%) 62.5 76.4 78.2 66.9 77.2 78.3 80.3 Mean weeks worked 23.3 32.5 33.3 28.7 32.6 33 34 % full-time 44.1 53.2 54.2 50.9 51.0 52.2 53.6 Individuals w/ positive earnings
Mean annual earnings 18,389 24,819 27,802 25,610 25,741 26,392 27,127 Mean weekly earnings 491.7 576.4 642.5 603.0 600.1 610.6 629.2 CV of weekly earnings 0.99 0.90 0.90 0.93 0.91 0.92 0.90 Earnings Quartiles Quartile 1 32.40 25.62 23.61 21.66 26.24 25.92 24.06 Quartile 2 28.57 25.24 20.67 27.92 22.7 22.19 21.39 Quartile 3 22.14 24.76 25.39 26.25 24.36 24.3 25.49 Quartile 4 16.89 24.39 30.33 24.17 26.71 27.59 29.06 Adjusted Earnings Distribution*
Quartile 1 28.23 25.62 22.78 25.54 28.07 27.27 22.49 Quartile 2 29.42 25.24 22.06 29.43 23.77 23.29 22.75 Quartile 3 24.01 24.76 25.47 23.67 23.49 23.90 25.72 Quartile 4 18.35 24.39 29.68 21.37 24.67 25.55 29.04 Notes: Individuals aged 16-65 living in a private household. Immigrants refers to people born outside Canada. Second generation immigrants are persons born in Canada with either parent born outside the country. Natives refer to Canadian born individuals with both parents born in Canada. Source: Tabulations by authors from Statistics Canada, 2001 Census
39
Table 6 Education and earnings of potential fathers and children by source region
Percent from source region
Years of education
Weekly earnings
relative to native born
Percent with
a university degree
1. Potential fathers in 1980 (sample size = 80,651) North America, Northern and Western Europe 30.9 13.9 1.14 18.2 Caribbean, Central and South America and Oceania 8.6 13.0 0.84 14.0 Southern and Eastern Europe 41.1 8.8 0.90 4.4 Africa 2.9 14.9 1.05 31.7 Asia 16.4 13.6 0.90 32.0 Native born 11.3 $ 1,049 10.8 2. Second generation men 25 to 37 in 2001 (sample size = 45,415) North America, Northern and Western Europe 31.7 14.8 1.14 26.6 Caribbean, Central and South America and Oceania 6.1 14.8 0.86 22.5 Southern and Eastern Europe 49.1 14.8 1.06 25.7 Africa 1.6 16.3 1.06 49.4 Asia 11.5 16.3 1.06 49.0 Native born men 25 to 37 in 2001 14.0 $ 839 18.8
3. Second generation women 25 to 37 in 2001 (sample size = 41,927)
North America, Northern and Western Europe 31.4 15.2 1.15 33.4 Caribbean, Central and South America and Oceania 6.5 15.6 1.04 33.7 Southern and Eastern Europe 48.8 15.4 1.17 34.8 Africa 1.8 16.8 1.26 61.3 Asia 11.5 16.6 1.27 58.4 Native born women 25 to 37 in 2001 14.6 $ 614 25.7 Notes: All results reported for those with positive weekly wages. Panel 1 consists of immigrants who are married to or have a common-law partner that is also an immigrant, and natives where both spouses or common-law partners are third plus generation Canadian-born individuals. Both groups are further restricted to those who had children between ages 5-17 in 1980. Source: Tabulations by authors from Statistics Canada, 2001 Census.
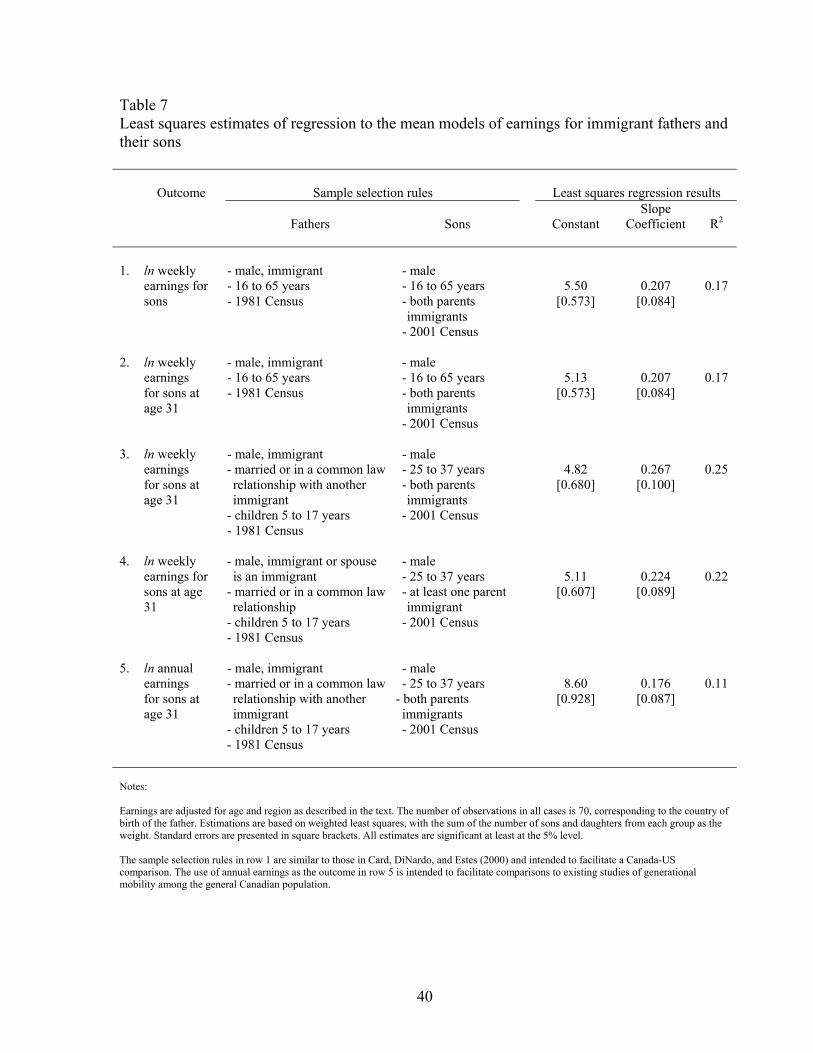
40
Table 7 Least squares estimates of regression to the mean models of earnings for immigrant fathers and their sons Outcome Sample selection rules Least squares regression results
Fathers
Sons
Constant Slope
Coefficient
R2 1. ln weekly
earnings for sons
- male, immigrant - 16 to 65 years - 1981 Census
- male - 16 to 65 years - both parents immigrants
- 2001 Census
5.50
[0.573]
0.207
[0.084]
0.17
2. ln weekly
earnings for sons at age 31
- male, immigrant - 16 to 65 years - 1981 Census
- male - 16 to 65 years - both parents immigrants
- 2001 Census
5.13
[0.573]
0.207
[0.084]
0.17
3. ln weekly
earnings for sons at age 31
- male, immigrant - married or in a common law relationship with another immigrant
- children 5 to 17 years - 1981 Census
- male - 25 to 37 years - both parents immigrants
- 2001 Census
4.82
[0.680]
0.267
[0.100]
0.25
4. ln weekly
earnings for sons at age 31
- male, immigrant or spouse is an immigrant
- married or in a common law relationship
- children 5 to 17 years - 1981 Census
- male - 25 to 37 years - at least one parent immigrant
- 2001 Census
5.11
[0.607]
0.224
[0.089]
0.22
5. ln annual
earnings for sons at age 31
- male, immigrant - married or in a common law relationship with another immigrant
- children 5 to 17 years - 1981 Census
- male - 25 to 37 years
- both parents immigrants - 2001 Census
8.60
[0.928]
0.176
[0.087]
0.11
Notes: Earnings are adjusted for age and region as described in the text. The number of observations in all cases is 70, corresponding to the country of birth of the father. Estimations are based on weighted least squares, with the sum of the number of sons and daughters from each group as the weight. Standard errors are presented in square brackets. All estimates are significant at least at the 5% level. The sample selection rules in row 1 are similar to those in Card, DiNardo, and Estes (2000) and intended to facilitate a Canada-US comparison. The use of annual earnings as the outcome in row 5 is intended to facilitate comparisons to existing studies of generational mobility among the general Canadian population.
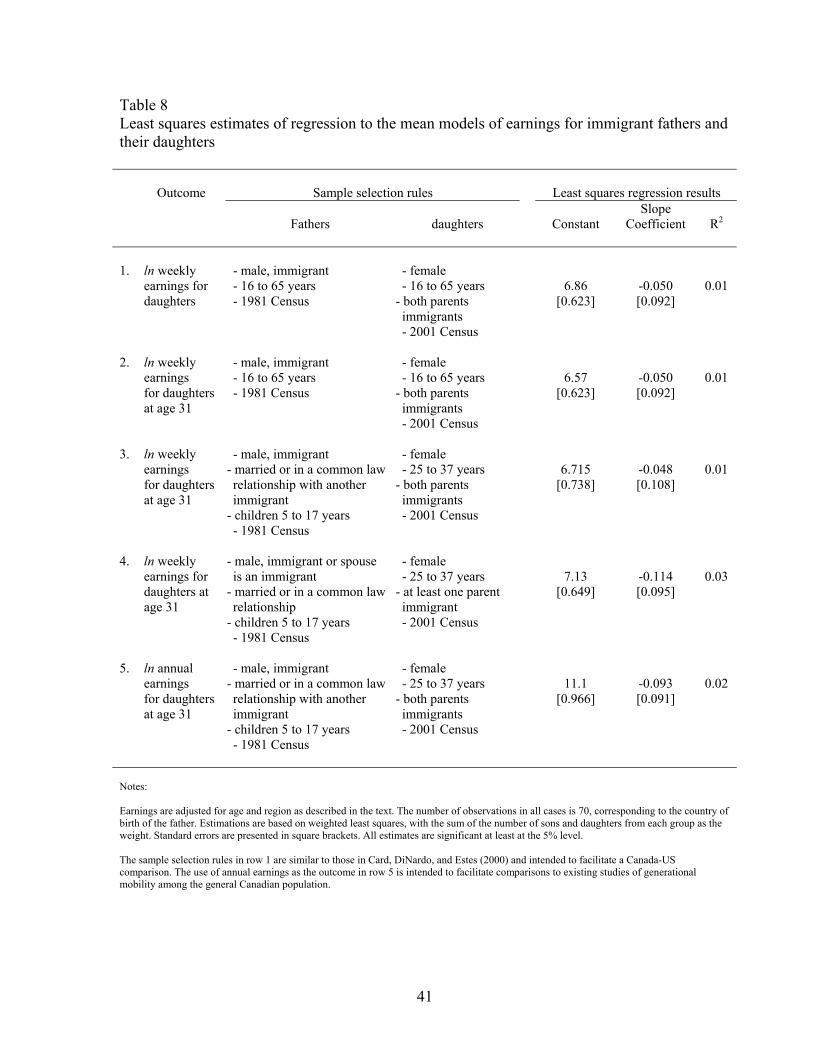
41
Table 8 Least squares estimates of regression to the mean models of earnings for immigrant fathers and their daughters Outcome Sample selection rules Least squares regression results
Fathers
daughters
Constant Slope
Coefficient
R2 1. ln weekly
earnings for daughters
- male, immigrant - 16 to 65 years - 1981 Census
- female - 16 to 65 years
- both parents immigrants - 2001 Census
6.86
[0.623]
-0.050 [0.092]
0.01
2. ln weekly
earnings for daughters at age 31
- male, immigrant - 16 to 65 years - 1981 Census
- female - 16 to 65 years
- both parents immigrants - 2001 Census
6.57
[0.623]
-0.050 [0.092]
0.01
3. ln weekly
earnings for daughters at age 31
- male, immigrant - married or in a common law relationship with another immigrant
- children 5 to 17 years - 1981 Census
- female - 25 to 37 years
- both parents immigrants - 2001 Census
6.715
[0.738]
-0.048 [0.108]
0.01
4. ln weekly
earnings for daughters at age 31
- male, immigrant or spouse is an immigrant
- married or in a common law relationship
- children 5 to 17 years - 1981 Census
- female - 25 to 37 years
- at least one parent immigrant - 2001 Census
7.13
[0.649]
-0.114 [0.095]
0.03
5. ln annual
earnings for daughters at age 31
- male, immigrant - married or in a common law relationship with another immigrant
- children 5 to 17 years - 1981 Census
- female - 25 to 37 years
- both parents immigrants - 2001 Census
11.1
[0.966]
-0.093 [0.091]
0.02
Notes: Earnings are adjusted for age and region as described in the text. The number of observations in all cases is 70, corresponding to the country of birth of the father. Estimations are based on weighted least squares, with the sum of the number of sons and daughters from each group as the weight. Standard errors are presented in square brackets. All estimates are significant at least at the 5% level. The sample selection rules in row 1 are similar to those in Card, DiNardo, and Estes (2000) and intended to facilitate a Canada-US comparison. The use of annual earnings as the outcome in row 5 is intended to facilitate comparisons to existing studies of generational mobility among the general Canadian population.
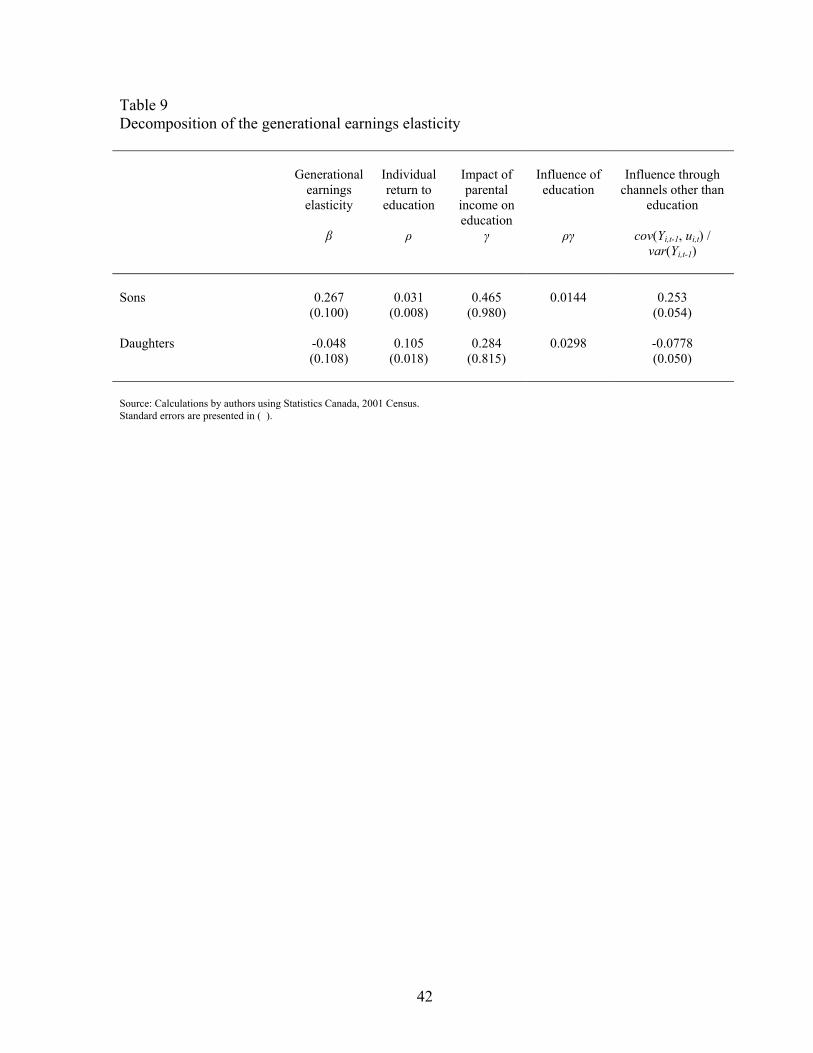
42
Table 9 Decomposition of the generational earnings elasticity Generational
earnings elasticity
Individual return to education
Impact of parental
income on education
Influence of education
Influence through channels other than
education
β ρ γ ργ cov(Yi,t-1, ui,t) / var(Yi,t-1)
Sons 0.267 0.031 0.465 0.0144 0.253 (0.100) (0.008) (0.980) (0.054) Daughters -0.048 0.105 0.284 0.0298 -0.0778 (0.108) (0.018) (0.815) (0.050) Source: Calculations by authors using Statistics Canada, 2001 Census. Standard errors are presented in ( ).
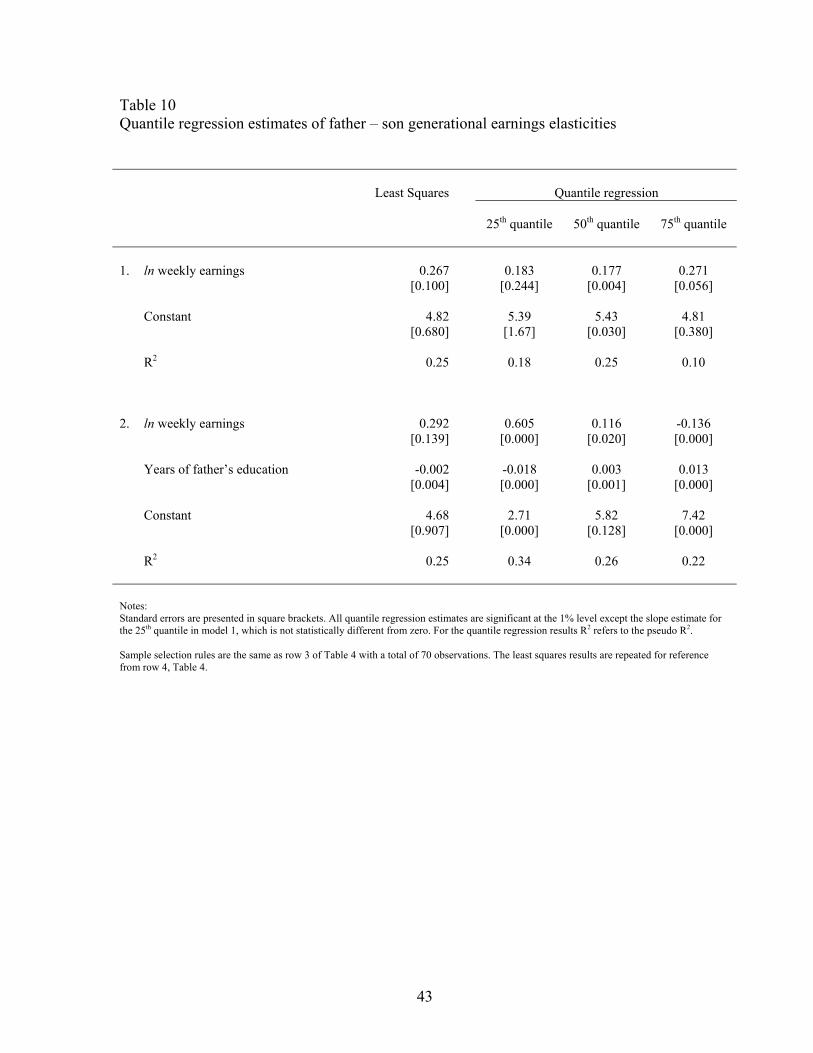
43
Table 10 Quantile regression estimates of father – son generational earnings elasticities Least Squares Quantile regression
25th quantile
50th quantile
75th quantile 1. ln weekly earnings 0.267 0.183 0.177 0.271 [0.100] [0.244] [0.004] [0.056] Constant 4.82 5.39 5.43 4.81 [0.680] [1.67] [0.030] [0.380] R2 0.25 0.18 0.25 0.10 2. ln weekly earnings 0.292 0.605 0.116 -0.136 [0.139] [0.000] [0.020] [0.000] Years of father’s education -0.002 -0.018 0.003 0.013 [0.004] [0.000] [0.001] [0.000] Constant 4.68 2.71 5.82 7.42 [0.907] [0.000] [0.128] [0.000] R2 0.25 0.34 0.26 0.22 Notes: Standard errors are presented in square brackets. All quantile regression estimates are significant at the 1% level except the slope estimate for the 25th quantile in model 1, which is not statistically different from zero. For the quantile regression results R2 refers to the pseudo R2. Sample selection rules are the same as row 3 of Table 4 with a total of 70 observations. The least squares results are repeated for reference from row 4, Table 4.
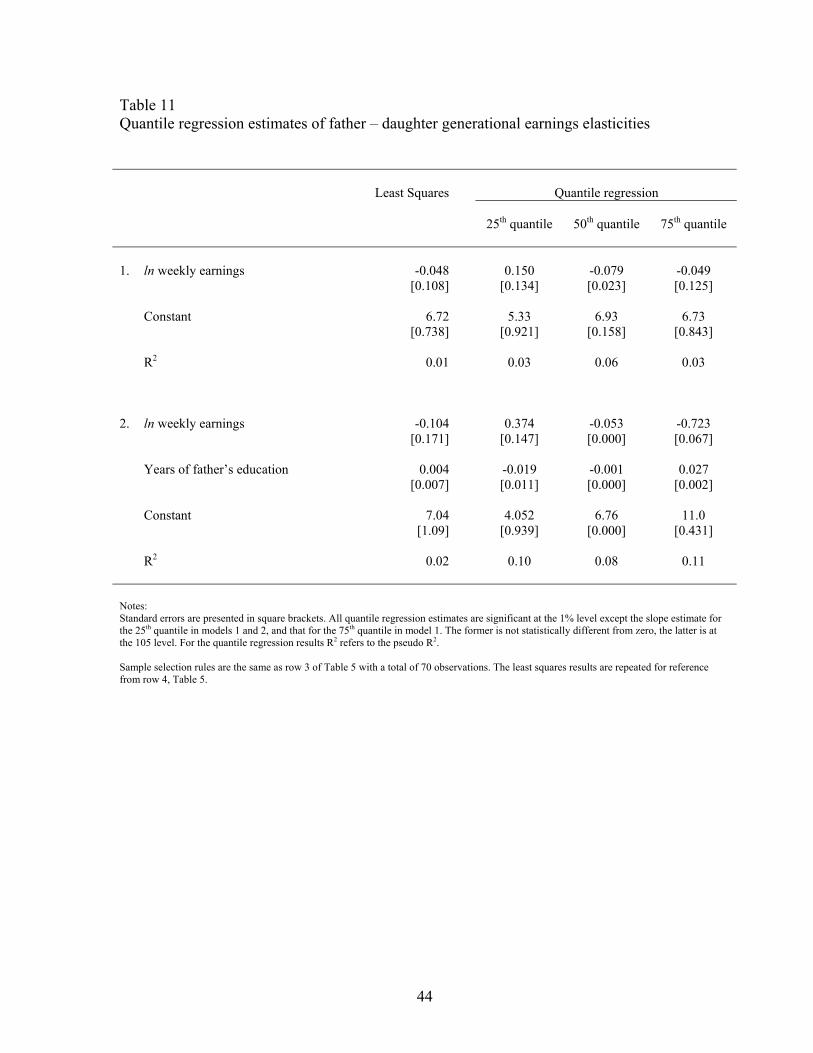
44
Table 11 Quantile regression estimates of father – daughter generational earnings elasticities Least Squares Quantile regression
25th quantile
50th quantile
75th quantile 1. ln weekly earnings -0.048 0.150 -0.079 -0.049 [0.108] [0.134] [0.023] [0.125] Constant 6.72 5.33 6.93 6.73 [0.738] [0.921] [0.158] [0.843] R2 0.01 0.03 0.06 0.03 2. ln weekly earnings -0.104 0.374 -0.053 -0.723 [0.171] [0.147] [0.000] [0.067] Years of father’s education 0.004 -0.019 -0.001 0.027 [0.007] [0.011] [0.000] [0.002] Constant 7.04 4.052 6.76 11.0 [1.09] [0.939] [0.000] [0.431] R2 0.02 0.10 0.08 0.11 Notes: Standard errors are presented in square brackets. All quantile regression estimates are significant at the 1% level except the slope estimate for the 25th quantile in models 1 and 2, and that for the 75th quantile in model 1. The former is not statistically different from zero, the latter is at the 105 level. For the quantile regression results R2 refers to the pseudo R2. Sample selection rules are the same as row 3 of Table 5 with a total of 70 observations. The least squares results are repeated for reference from row 4, Table 5.
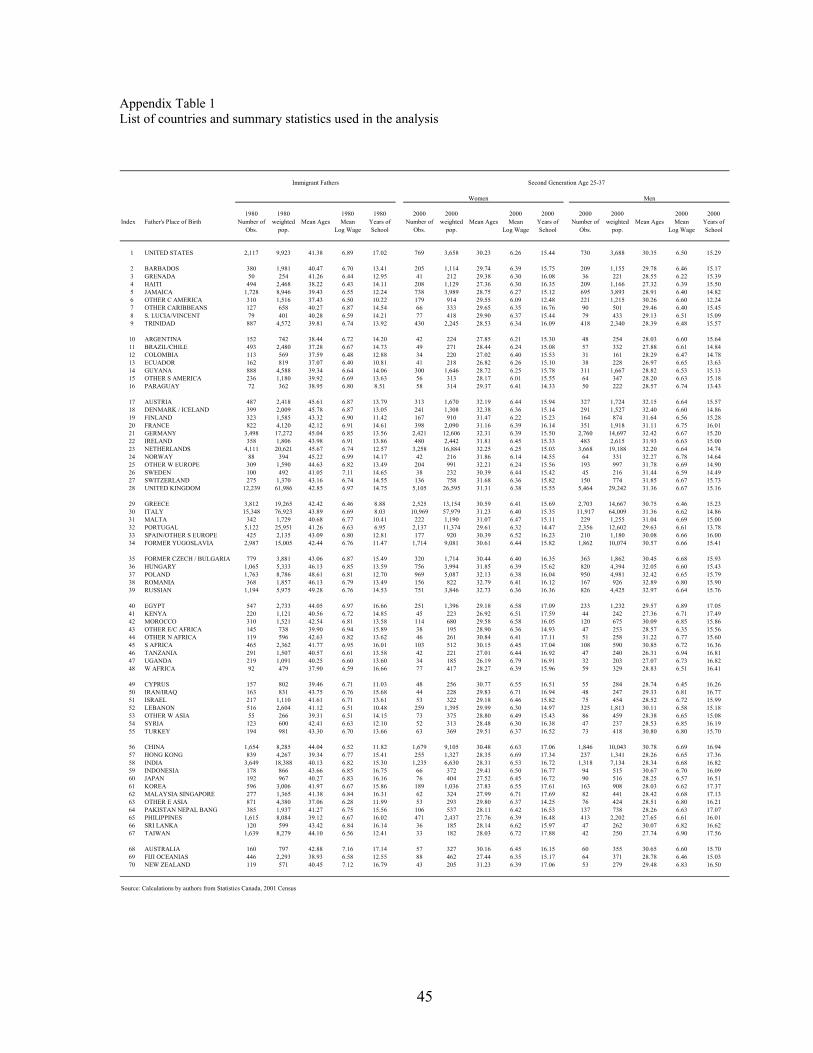
45
Appendix Table 1 List of countries and summary statistics used in the analysis
Women Men
Index Father's Place of Birth1980
Number of Obs.
1980 weighted
pop.Mean Ages
1980 Mean
Log Wage
1980 Years of School
2000 Number of
Obs.
2000 weighted
pop.Mean Ages
2000 Mean
Log Wage
2000 Years of School
2000 Number of
Obs.
2000 weighted
pop.Mean Ages
2000 Mean
Log Wage
2000 Years of School
1 UNITED STATES 2,117 9,923 41.38 6.89 17.02 769 3,658 30.23 6.26 15.44 730 3,688 30.35 6.50 15.29
2 BARBADOS 380 1,981 40.47 6.70 13.41 205 1,114 29.74 6.39 15.75 209 1,155 29.78 6.46 15.173 GRENADA 50 254 41.26 6.44 12.95 41 212 29.38 6.30 16.08 36 221 28.55 6.22 15.394 HAITI 494 2,468 38.22 6.43 14.11 208 1,129 27.36 6.30 16.35 209 1,166 27.32 6.39 15.505 JAMAICA 1,728 8,946 39.43 6.55 12.24 738 3,989 28.75 6.27 15.12 695 3,893 28.91 6.40 14.826 OTHER C AMERICA 310 1,516 37.43 6.50 10.22 179 914 29.55 6.09 12.48 221 1,215 30.26 6.60 12.247 OTHER CARIBBEANS 127 658 40.27 6.87 14.54 66 333 29.65 6.35 16.76 90 501 29.46 6.40 15.458 S. LUCIA/VINCENT 79 401 40.28 6.59 14.21 77 418 29.90 6.37 15.44 79 433 29.13 6.51 15.099 TRINIDAD 887 4,572 39.81 6.74 13.92 430 2,245 28.53 6.34 16.09 418 2,340 28.39 6.48 15.57
10 ARGENTINA 152 742 38.44 6.72 14.20 42 224 27.85 6.21 15.30 48 254 28.03 6.60 15.6411 BRAZIL/CHILE 493 2,480 37.28 6.67 14.73 49 271 28.44 6.24 15.08 57 332 27.88 6.61 14.8412 COLOMBIA 113 569 37.59 6.48 12.88 34 220 27.02 6.40 15.53 31 161 28.29 6.47 14.7813 ECUADOR 162 819 37.07 6.40 10.81 41 218 26.82 6.26 15.10 38 228 26.97 6.65 13.6314 GUYANA 888 4,588 39.34 6.64 14.06 300 1,646 28.72 6.25 15.78 311 1,667 28.82 6.53 15.1315 OTHER S AMERICA 236 1,180 39.92 6.69 13.63 56 313 28.17 6.01 15.55 64 347 28.20 6.63 15.1816 PARAGUAY 72 362 38.95 6.80 8.51 58 314 29.37 6.41 14.33 50 222 28.57 6.74 13.43
17 AUSTRIA 487 2,418 45.61 6.87 13.79 313 1,670 32.19 6.44 15.94 327 1,724 32.15 6.64 15.5718 DENMARK / ICELAND 399 2,009 45.78 6.87 13.05 241 1,308 32.38 6.36 15.14 291 1,527 32.40 6.60 14.8619 FINLAND 323 1,585 43.32 6.90 11.42 167 910 31.47 6.22 15.23 164 874 31.64 6.56 15.2820 FRANCE 822 4,120 42.12 6.91 14.61 398 2,090 31.16 6.39 16.14 351 1,918 31.11 6.75 16.0121 GERMANY 3,498 17,272 45.04 6.85 13.56 2,421 12,606 32.31 6.39 15.50 2,760 14,697 32.42 6.67 15.2022 IRELAND 358 1,806 43.98 6.91 13.86 480 2,442 31.81 6.45 15.33 483 2,615 31.93 6.63 15.0023 NETHERLANDS 4,111 20,621 45.67 6.74 12.57 3,258 16,884 32.25 6.25 15.03 3,668 19,188 32.20 6.64 14.7424 NORWAY 88 394 45.22 6.99 14.17 42 216 31.86 6.14 14.55 64 331 32.27 6.78 14.6425 OTHER W EUROPE 309 1,590 44.63 6.82 13.49 204 991 32.21 6.24 15.56 193 997 31.78 6.69 14.9026 SWEDEN 100 492 41.05 7.11 14.65 38 232 30.39 6.44 15.42 45 216 31.44 6.59 14.4927 SWITZERLAND 275 1,370 43.16 6.74 14.55 136 758 31.68 6.36 15.82 150 774 31.85 6.67 15.7328 UNITED KINGDOM 12,239 61,986 42.85 6.97 14.75 5,105 26,595 31.31 6.38 15.55 5,464 29,242 31.36 6.67 15.16
29 GREECE 3,812 19,265 42.42 6.46 8.88 2,525 13,154 30.59 6.41 15.69 2,703 14,667 30.75 6.46 15.2330 ITALY 15,348 76,923 43.89 6.69 8.03 10,969 57,979 31.23 6.40 15.35 11,917 64,009 31.36 6.62 14.8631 MALTA 342 1,729 40.68 6.77 10.41 222 1,190 31.07 6.47 15.11 229 1,255 31.04 6.69 15.0032 PORTUGAL 5,122 25,951 41.26 6.63 6.95 2,137 11,374 29.61 6.32 14.47 2,356 12,602 29.63 6.61 13.7833 SPAIN/OTHER S EUROPE 425 2,135 43.09 6.80 12.81 177 920 30.39 6.52 16.23 210 1,180 30.08 6.66 16.0034 FORMER YUGOSLAVIA 2,987 15,005 42.44 6.76 11.47 1,714 9,081 30.61 6.44 15.82 1,862 10,074 30.57 6.66 15.41
35 FORMER CZECH / BULGARIA 779 3,881 43.06 6.87 15.49 320 1,714 30.44 6.40 16.35 363 1,862 30.45 6.68 15.9336 HUNGARY 1,065 5,333 46.13 6.85 13.59 756 3,994 31.85 6.39 15.62 820 4,394 32.05 6.60 15.4337 POLAND 1,763 8,786 48.61 6.81 12.70 969 5,087 32.13 6.38 16.04 950 4,981 32.42 6.65 15.7938 ROMANIA 368 1,857 46.13 6.79 13.49 156 822 32.79 6.41 16.12 167 926 32.89 6.80 15.9039 RUSSIAN 1,194 5,975 49.28 6.76 14.53 751 3,846 32.73 6.36 16.36 826 4,425 32.97 6.64 15.76
40 EGYPT 547 2,733 44.05 6.97 16.66 251 1,396 29.18 6.58 17.09 233 1,232 29.57 6.89 17.0541 KENYA 220 1,121 40.56 6.72 14.85 45 223 26.92 6.51 17.59 44 242 27.36 6.71 17.4942 MOROCCO 310 1,521 42.54 6.81 13.58 114 680 29.58 6.58 16.05 120 675 30.09 6.85 15.8643 OTHER E/C AFRICA 145 738 39.90 6.94 15.89 38 195 28.90 6.36 14.93 47 253 28.57 6.35 15.5644 OTHER N AFRICA 119 596 42.63 6.82 13.62 46 261 30.84 6.41 17.11 51 258 31.22 6.77 15.6045 S AFRICA 465 2,362 41.77 6.95 16.01 103 512 30.15 6.45 17.04 108 590 30.85 6.72 16.3646 TANZANIA 291 1,507 40.57 6.61 13.58 42 221 27.01 6.44 16.92 47 240 26.31 6.94 16.8147 UGANDA 219 1,091 40.25 6.60 13.60 34 185 26.19 6.79 16.91 32 203 27.07 6.73 16.8248 W AFRICA 92 479 37.90 6.59 16.66 77 417 28.27 6.39 15.96 59 329 28.83 6.51 16.41
49 CYPRUS 157 802 39.46 6.71 11.03 48 256 30.77 6.55 16.51 55 284 28.74 6.45 16.2650 IRAN/IRAQ 163 831 43.75 6.76 15.68 44 228 29.83 6.71 16.94 48 247 29.33 6.81 16.7751 ISRAEL 217 1,110 41.61 6.71 13.61 53 322 29.18 6.46 15.82 75 454 28.52 6.72 15.9952 LEBANON 516 2,604 41.12 6.51 10.48 259 1,395 29.99 6.30 14.97 325 1,813 30.11 6.58 15.1853 OTHER W ASIA 55 266 39.31 6.51 14.15 73 375 28.80 6.49 15.43 86 459 28.38 6.65 15.0854 SYRIA 123 600 42.41 6.63 12.10 52 313 28.48 6.30 16.38 47 237 28.53 6.85 16.1955 TURKEY 194 981 43.30 6.70 13.66 63 369 29.51 6.37 16.52 73 418 30.80 6.80 15.70
56 CHINA 1,654 8,285 44.04 6.52 11.82 1,679 9,105 30.48 6.63 17.06 1,846 10,043 30.78 6.69 16.9457 HONG KONG 839 4,267 39.34 6.77 15.41 255 1,327 28.35 6.69 17.34 237 1,341 28.26 6.65 17.3658 INDIA 3,649 18,388 40.13 6.82 15.30 1,235 6,630 28.31 6.53 16.72 1,318 7,134 28.34 6.68 16.8259 INDONESIA 178 866 43.66 6.85 16.75 66 372 29.41 6.50 16.77 94 515 30.67 6.70 16.0960 JAPAN 192 967 40.27 6.83 16.16 76 404 27.52 6.45 16.72 90 516 28.25 6.57 16.5161 KOREA 596 3,006 41.97 6.67 15.86 189 1,036 27.83 6.55 17.61 163 908 28.03 6.62 17.3762 MALAYSIA SINGAPORE 277 1,365 41.38 6.84 16.31 62 324 27.99 6.71 17.69 82 441 28.42 6.68 17.1363 OTHER E ASIA 871 4,380 37.06 6.28 11.99 53 293 29.80 6.37 14.25 76 424 28.51 6.80 16.2164 PAKISTAN NEPAL BANG 385 1,937 41.27 6.75 15.56 106 537 28.11 6.42 16.53 137 738 28.26 6.63 17.0765 PHILIPPINES 1,615 8,084 39.12 6.67 16.02 471 2,437 27.76 6.39 16.48 413 2,202 27.65 6.61 16.0166 SRI LANKA 120 599 43.42 6.84 16.14 36 185 28.14 6.62 15.97 47 262 30.07 6.82 16.6267 TAIWAN 1,639 8,279 44.10 6.56 12.41 33 182 28.03 6.72 17.88 42 250 27.74 6.90 17.56
68 AUSTRALIA 160 797 42.88 7.16 17.14 57 327 30.16 6.45 16.15 60 355 30.65 6.60 15.7069 FIJI OCEANIAS 446 2,293 38.93 6.58 12.55 88 462 27.44 6.35 15.17 64 371 28.78 6.46 15.0370 NEW ZEALAND 119 571 40.45 7.12 16.79 43 205 31.23 6.39 17.06 53 279 29.48 6.83 16.50
Source: Calculations by authors from Statistics Canada, 2001 Census
Immigrant Fathers Second Generation Age 25-37
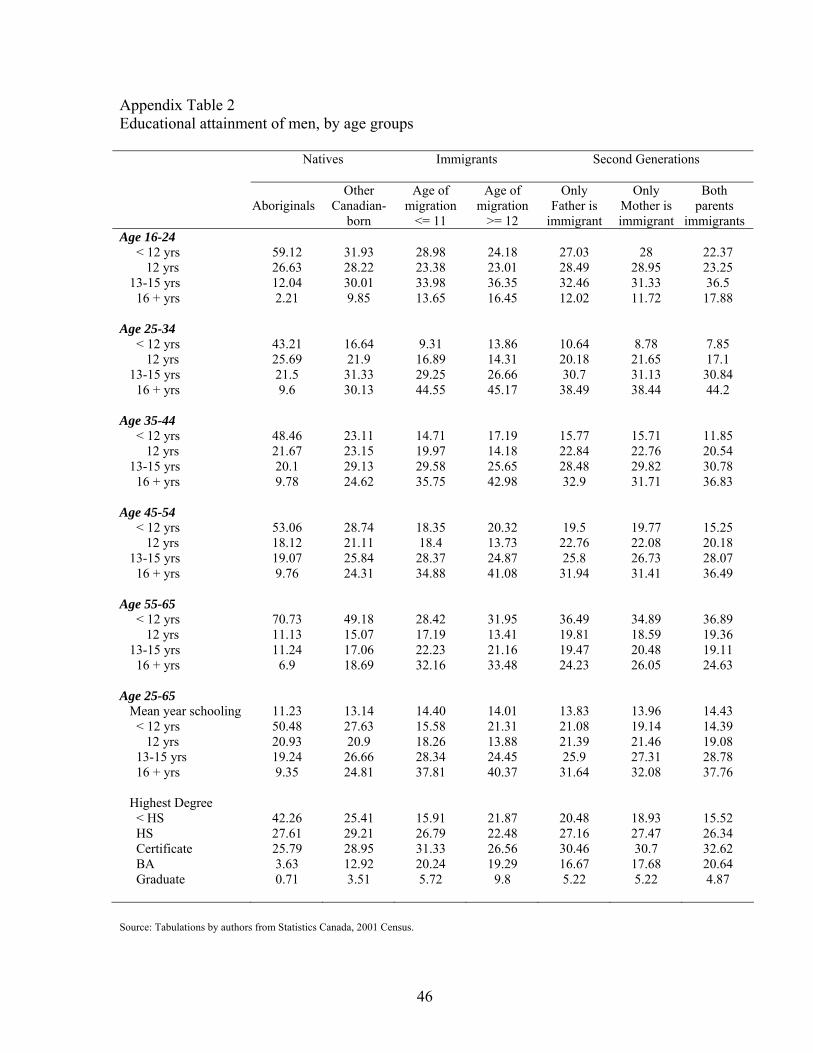
46
Appendix Table 2 Educational attainment of men, by age groups Natives Immigrants Second Generations
Aboriginals Other
Canadian-born
Age of migration
<= 11
Age of migration
>= 12
Only Father is
immigrant
Only Mother is immigrant
Both parents
immigrants Age 16-24 < 12 yrs 59.12 31.93 28.98 24.18 27.03 28 22.37 12 yrs 26.63 28.22 23.38 23.01 28.49 28.95 23.25 13-15 yrs 12.04 30.01 33.98 36.35 32.46 31.33 36.5 16 + yrs 2.21 9.85 13.65 16.45 12.02 11.72 17.88 Age 25-34 < 12 yrs 43.21 16.64 9.31 13.86 10.64 8.78 7.85 12 yrs 25.69 21.9 16.89 14.31 20.18 21.65 17.1 13-15 yrs 21.5 31.33 29.25 26.66 30.7 31.13 30.84 16 + yrs 9.6 30.13 44.55 45.17 38.49 38.44 44.2 Age 35-44 < 12 yrs 48.46 23.11 14.71 17.19 15.77 15.71 11.85 12 yrs 21.67 23.15 19.97 14.18 22.84 22.76 20.54 13-15 yrs 20.1 29.13 29.58 25.65 28.48 29.82 30.78 16 + yrs 9.78 24.62 35.75 42.98 32.9 31.71 36.83 Age 45-54 < 12 yrs 53.06 28.74 18.35 20.32 19.5 19.77 15.25 12 yrs 18.12 21.11 18.4 13.73 22.76 22.08 20.18 13-15 yrs 19.07 25.84 28.37 24.87 25.8 26.73 28.07 16 + yrs 9.76 24.31 34.88 41.08 31.94 31.41 36.49 Age 55-65 < 12 yrs 70.73 49.18 28.42 31.95 36.49 34.89 36.89 12 yrs 11.13 15.07 17.19 13.41 19.81 18.59 19.36 13-15 yrs 11.24 17.06 22.23 21.16 19.47 20.48 19.11 16 + yrs 6.9 18.69 32.16 33.48 24.23 26.05 24.63 Age 25-65 Mean year schooling 11.23 13.14 14.40 14.01 13.83 13.96 14.43 < 12 yrs 50.48 27.63 15.58 21.31 21.08 19.14 14.39 12 yrs 20.93 20.9 18.26 13.88 21.39 21.46 19.08 13-15 yrs 19.24 26.66 28.34 24.45 25.9 27.31 28.78 16 + yrs 9.35 24.81 37.81 40.37 31.64 32.08 37.76 Highest Degree < HS 42.26 25.41 15.91 21.87 20.48 18.93 15.52 HS 27.61 29.21 26.79 22.48 27.16 27.47 26.34 Certificate 25.79 28.95 31.33 26.56 30.46 30.7 32.62 BA 3.63 12.92 20.24 19.29 16.67 17.68 20.64 Graduate 0.71 3.51 5.72 9.8 5.22 5.22 4.87 Source: Tabulations by authors from Statistics Canada, 2001 Census.

47
Appendix Table 3 Educational attainment of women, by age groups Natives Immigrants Second Generations
Aboriginals Other
Canadian-born
Age of migration
<= 11
Age of migration
>= 12
Only Father is
immigrant
Only Mother is immigrant
Both parents
immigrants Age 16-24 < 12 yrs 53.35 25.75 25.79 20.92 23.34 23.68 18.15 12 yrs 26.67 24.65 21.05 22.06 24.29 25.64 19.18 13-15 yrs 16.64 35.06 36.96 37.47 35.79 35.43 39.13 16 + yrs 3.34 14.54 16.2 19.55 16.58 15.25 23.54 Age 25-34 < 12 yrs 36.55 11.82 7.14 14.38 7.31 7.34 4.77 12 yrs 23.44 19.33 14.87 14.82 17.99 17.72 14.03 13-15 yrs 27.27 33.66 30.47 29.71 31.69 31.37 31.13 16 + yrs 12.74 35.18 47.52 41.09 43.01 43.57 50.07 Age 35-44 < 12 yrs 40.16 17.58 12.72 18.24 11.59 11.58 8.27 12 yrs 22.48 26.09 24.09 15.92 25.67 26.1 24.06 13-15 yrs 25.61 32.72 32.01 30.02 32.64 32.79 33.52 16 + yrs 11.75 23.61 31.17 35.82 30.11 29.54 34.15 Age 45-54 < 12 yrs 47.02 26.19 20.23 25.15 17.39 17.93 12.96 12 yrs 19.32 24.87 26.76 16.47 27.84 28.27 25.75 13-15 yrs 21.83 28.47 27.58 28.66 28.86 28.7 30.12 16 + yrs 11.82 20.47 25.43 29.72 25.91 25.09 31.18 Age 55-65 < 12 yrs 69.64 48.4 35.19 39.78 36.87 35.62 36.83 12 yrs 12.12 18.04 23.79 15.84 24.36 24.63 26.12 13-15 yrs 12.59 20.73 22.41 23.86 23.49 22.92 22.31 16 + yrs 5.66 12.83 18.61 20.52 15.27 16.82 14.73 Age 25-65 Mean year schooling 11.66 13.24 14.10 13.19 13.76 13.86 14.47 < 12 yrs 44 23.97 15.6 24.62 18.99 17.42 11.82 12 yrs 20.87 22.78 22.09 15.84 24.1 24.51 20.99 13-15 yrs 23.78 29.68 29.24 28.09 28.96 29.19 30.54 16 + yrs 11.35 23.57 33.07 31.45 27.95 28.89 36.65 Highest Degree < HS 37.57 22.5 15.54 26.02 19.07 17.66 12.68 HS 27.06 29.56 28.85 25.02 27.67 27.76 26.56 Certificate 28.78 31.27 31.15 26.17 32.32 32.68 33.23 BA 5.81 13.95 20.07 17.28 17.14 17.87 23.41 Graduate 0.77 2.71 4.39 5.52 3.81 4.03 4.12 Source: Tabulations by authors from Statistics Canada, 2001 Census.
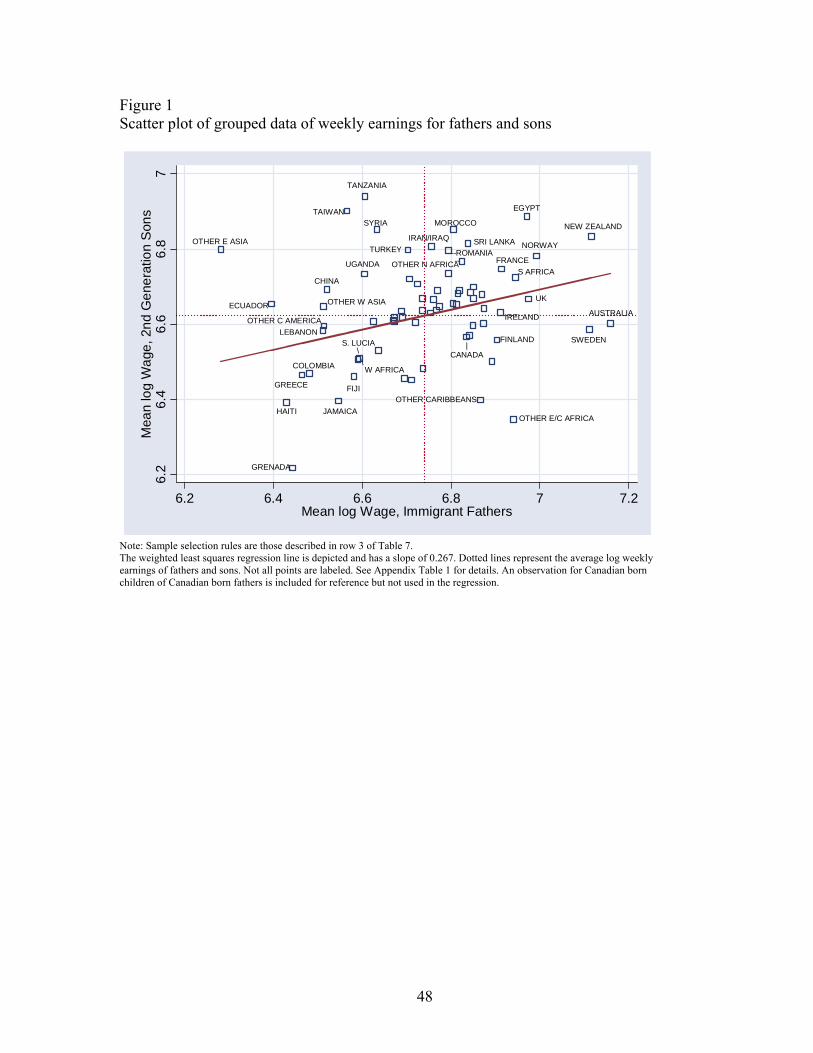
48
Figure 1 Scatter plot of grouped data of weekly earnings for fathers and sons
|CANADA
FRANCE
IRELAND
UK
FINLAND
NORWAY
SWEDEN
OTHER E/C AFRICA
EGYPT
S AFRICA
AUSTRALIA
NEW ZEALAND
OTHER C AMERICA
GRENADA
HAITI JAMAICA
\S. LUCIA
COLOMBIA
ECUADOR
GREECE
\W AFRICA
LEBANON
OTHER W ASIA
CHINA
TAIWAN
OTHER E ASIA
FIJI
--ROMANIA
TANZANIA
UGANDA
MOROCCO
--OTHER N AFRICA
TURKEYIRAN/IRAQ
SYRIA
SRI LANKA
OTHER CARIBBEANS
6.2
6.4
6.6
6.8
7M
ean
log
Wag
e, 2
nd G
ener
atio
n S
ons
6.2 6.4 6.6 6.8 7 7.2Mean log Wage, Immigrant Fathers
Note: Sample selection rules are those described in row 3 of Table 7. The weighted least squares regression line is depicted and has a slope of 0.267. Dotted lines represent the average log weekly earnings of fathers and sons. Not all points are labeled. See Appendix Table 1 for details. An observation for Canadian born children of Canadian born fathers is included for reference but not used in the regression.
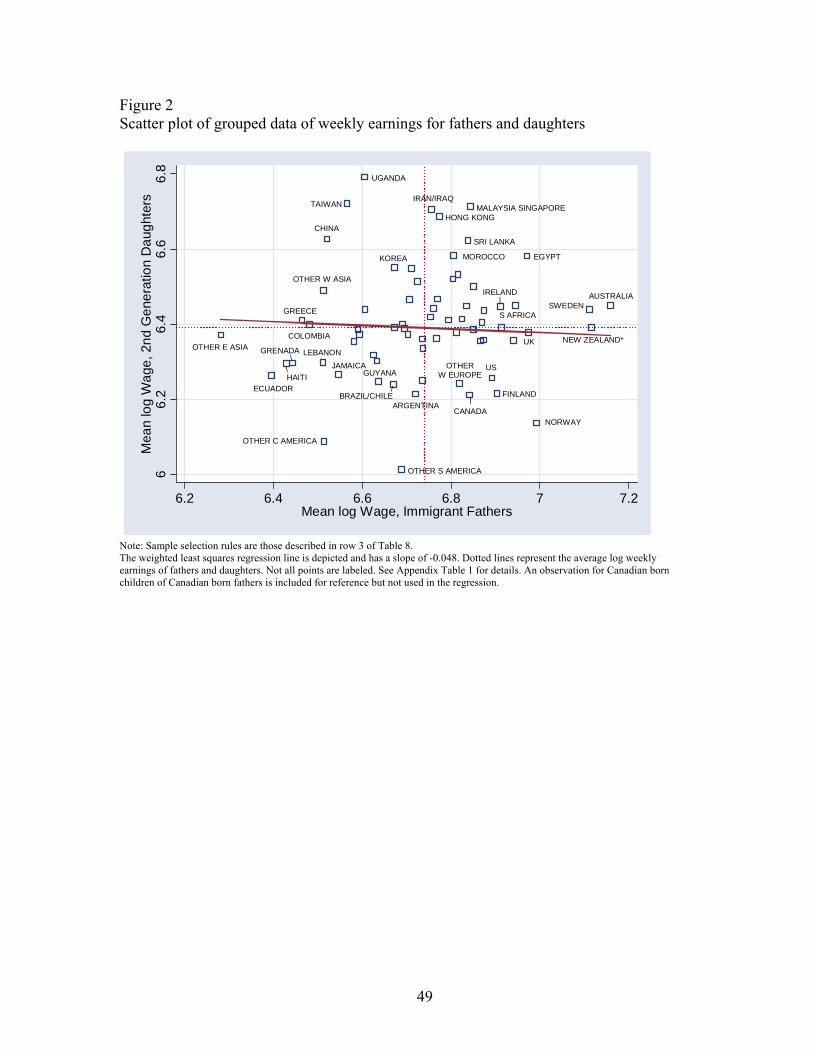
49
Figure 2 Scatter plot of grouped data of weekly earnings for fathers and daughters
|CANADA
UGANDA
EGYPTMOROCCO
IRAN/IRAQ
CHINAHONG KONG
TAIWAN
KOREA
MALAYSIA SINGAPORE
SRI LANKA
OTHER C AMERICA
ARGENTINA
/BRAZIL/CHILE
GUYANA
OTHER S AMERICA
OTHERW EUROPE
FINLAND
NORWAY
US
|IRELAND
UK
SWEDENS AFRICA
AUSTRALIA
NEW ZEALAND*
\GRENADA
\HAITI
JAMAICA
COLOMBIA
ECUADOR
GREECE
LEBANON
OTHER W ASIA
OTHER E ASIA
66.
26.
46.
66.
8M
ean
log
Wag
e, 2
nd G
ener
atio
n D
augh
ters
6.2 6.4 6.6 6.8 7 7.2Mean log Wage, Immigrant Fathers
Note: Sample selection rules are those described in row 3 of Table 8. The weighted least squares regression line is depicted and has a slope of -0.048. Dotted lines represent the average log weekly earnings of fathers and daughters. Not all points are labeled. See Appendix Table 1 for details. An observation for Canadian born children of Canadian born fathers is included for reference but not used in the regression.
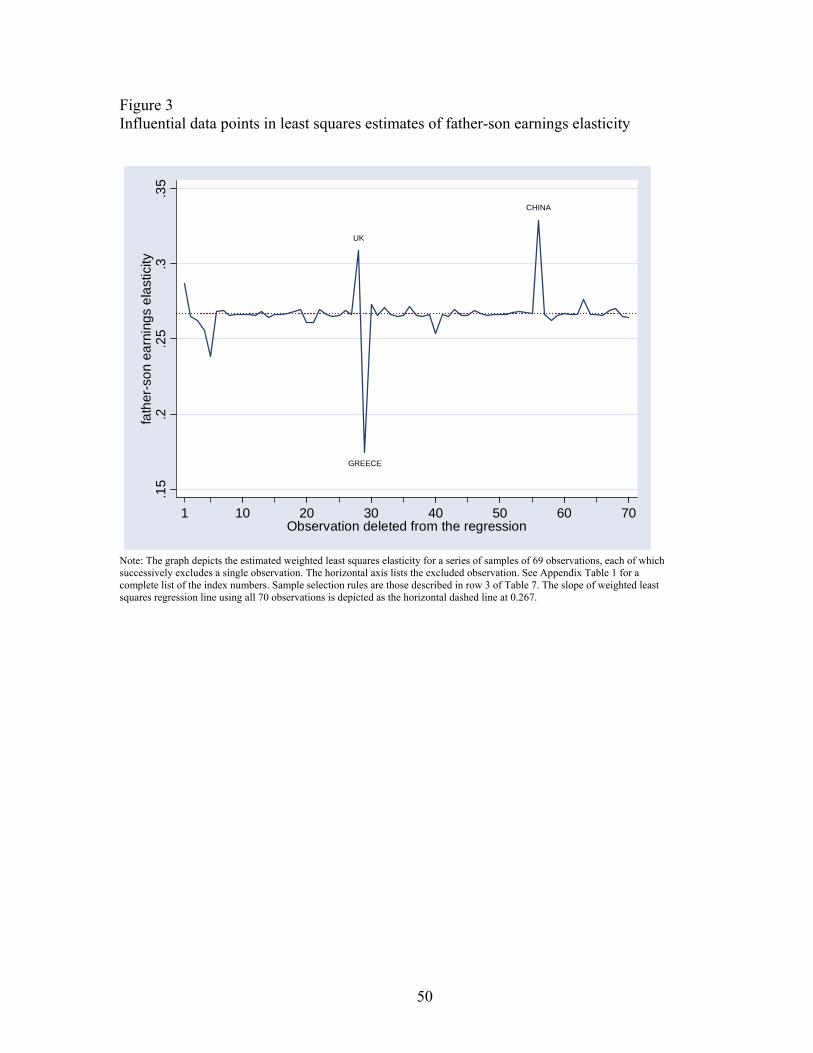
50
Figure 3 Influential data points in least squares estimates of father-son earnings elasticity
UK
GREECE
CHINA
.15
.2.2
5.3
.35
fath
er-s
on e
arni
ngs
elas
ticity
1 10 20 30 40 50 60 70Observation deleted from the regression
Note: The graph depicts the estimated weighted least squares elasticity for a series of samples of 69 observations, each of which successively excludes a single observation. The horizontal axis lists the excluded observation. See Appendix Table 1 for a complete list of the index numbers. Sample selection rules are those described in row 3 of Table 7. The slope of weighted least squares regression line using all 70 observations is depicted as the horizontal dashed line at 0.267.
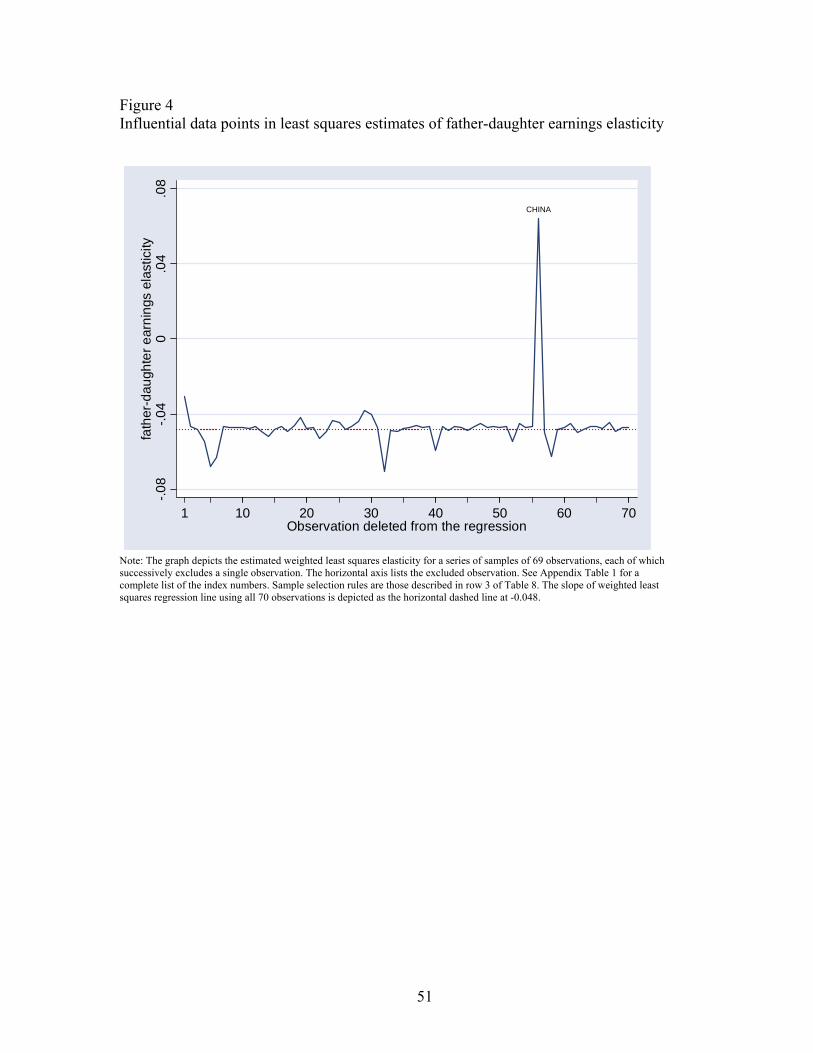
51
Figure 4 Influential data points in least squares estimates of father-daughter earnings elasticity
CHINA
-.08
-.04
0.0
4.0
8fa
ther
-dau
ghte
r ear
ning
s el
astic
ity
1 10 20 30 40 50 60 70Observation deleted from the regression
Note: The graph depicts the estimated weighted least squares elasticity for a series of samples of 69 observations, each of which successively excludes a single observation. The horizontal axis lists the excluded observation. See Appendix Table 1 for a complete list of the index numbers. Sample selection rules are those described in row 3 of Table 8. The slope of weighted least squares regression line using all 70 observations is depicted as the horizontal dashed line at -0.048.