INTERFERENCE EXCITATION MECHANISMS ON CAARC BUILDING...
13
1 BBAA VI International Colloquium on: Bluff Bodies Aerodynamics & Applications Milano, Italy, July, 20-24 2008 INTERFERENCE EXCITATION MECHANISMS ON CAARC BUILDING MODEL K.S. Wong * , K. C. S. Kwok *, † , and P. A. Hitchcock * * CLP Power Wind/Wave Tunnel Facility, The Hong Kong University of Science and Technology, Clear Water Bay, Kowloon, Hong Kong † Department of Civil Engineering, The Hong Kong University of Science and Technology, Clear Water Bay, Kowloon, Hong Kong e-mails: [email protected], [email protected], [email protected] Keywords: Interference effects, Tall buildings, Buffeting factors. Abstract. High frequency base balance tests were conducted to determine the isolated and interfered wind-induced building responses of a rectangular tall building model, with dimen- sions equivalent to the Commonwealth Advisory Aeronautical Research Council (CAARC) standard tall building model, under the influence of a geometrically identical interfering building. The model study was conducted at a length scale of 1:400 in simulated open coun- try terrain and the results were analyzed for a reduced wind velocity of 6. The presence of the interfering building increased significantly the standard deviation displacements and twist angle responses of the principal building. The excitation mechanisms for the rectangular tall buildings were also investigated using the simultaneous pressure measurement technique to explore the characteristics of and correlation between wind forces acting on different parts of the principal building. The gathered pressure data also provided additional information, such as integrated force spectra and the phase angle spectra between the integrated forces acting on different parts of the building models, allowing further insight into the wind- induced force distributions and excitation mechanisms.
-
Upload
nguyenkhanh -
Category
Documents
-
view
218 -
download
0
Transcript of INTERFERENCE EXCITATION MECHANISMS ON CAARC BUILDING...
1
BBAA VI International Colloquium on:
Bluff Bodies Aerodynamics & Applications
Milano, Italy, July, 20-24 2008
INTERFERENCE EXCITATION MECHANISMS ON CAARC
BUILDING MODEL
K.S. Wong∗∗∗∗, K. C. S. Kwok
∗∗∗∗, †, and P. A. Hitchcock
∗∗∗∗
∗CLP Power Wind/Wave Tunnel Facility, The Hong Kong University of Science and Technology,
Clear Water Bay, Kowloon, Hong Kong
† Department of Civil Engineering, The Hong Kong University of Science and Technology, Clear
Water Bay, Kowloon, Hong Kong
e-mails: [email protected], [email protected], [email protected]
Keywords: Interference effects, Tall buildings, Buffeting factors.
Abstract. High frequency base balance tests were conducted to determine the isolated and
interfered wind-induced building responses of a rectangular tall building model, with dimen-
sions equivalent to the Commonwealth Advisory Aeronautical Research Council (CAARC)
standard tall building model, under the influence of a geometrically identical interfering
building. The model study was conducted at a length scale of 1:400 in simulated open coun-
try terrain and the results were analyzed for a reduced wind velocity of 6. The presence of
the interfering building increased significantly the standard deviation displacements and twist
angle responses of the principal building. The excitation mechanisms for the rectangular tall
buildings were also investigated using the simultaneous pressure measurement technique to
explore the characteristics of and correlation between wind forces acting on different parts of
the principal building. The gathered pressure data also provided additional information,
such as integrated force spectra and the phase angle spectra between the integrated forces
acting on different parts of the building models, allowing further insight into the wind-
induced force distributions and excitation mechanisms.

K.S. Wong, K.C.S. Kwok and P.A. Hitchcock
2
1 INTRODUCTION
Wind effects on isolated tall buildings have been investigated in many studies since the
1960s, for example [1-6]. Most of those studies have applied techniques which measure the
overall wind loads acting on a tall building model to explore the wind-induced excitation me-
chanisms, with many of the earlier studies using aeroelastic models and more recently the
high frequency base balance (HFBB) technique [7].
Similar approaches have also been adopted to explore the excitation mechanisms due to in-
terference effects on tall buildings since the 1970s, for example [8-15]. Those studies, and
others, have recognized the significance of interference effects in causing the amplification of
aerodynamic forces acting on, and responses of, tall buildings. However, the measurement
techniques, such as HFBB, adopted in those studies measure the integrated effects of the sur-
rounding flow on a principal building under the influence of an interfering building. While
those techniques are likely to allow the dominant wind-induced effects to be identified, they
may not provide adequate information to fully explore the relevant excitation mechanisms.
This research aims to investigate interference excitation mechanisms by analyzing the
forces acting on particular parts of a rectangular principal building. The HFBB technique was
adopted for a series of wind tunnel tests to investigate and quantify the integrated interference
effects on a principal building. Simultaneous pressure measurement tests were then con-
ducted to gather pressure data to explore the characteristics of, and correlation between, forces
acting on different parts of the affected building.
2 EXPERIMENTAL SETUP
The experiments were conducted in the 3 m × 2 m high-speed test section of the boundary
layer wind tunnel of the CLP Power Wind Wave Tunnel Facility at The Hong Kong Universi-
ty of Science and Technology. A pair of identical rectangular tall building models, with di-
mensions equivalent to the Commonwealth Advisory Aeronautical Research Council
(CAARC) standard tall building model, were modelled at 1:400 scale and used for both prin-
cipal and interfering buildings. The modelled buildings are flat-topped, without parapets, and
the exterior walls are flat and without any geometrical irregularities. The physical dimensions
of the prototype scale buildings, as shown in Fig (1), are b = 45 m, d = 30 m and h = 180 m
and the overall structural density ( sρ ) was taken as 160 kg/m3.
Figure 1: Approaching wind direction with respect to building faces
Only the fundamental modes of vibration in translation and torsion were considered for the
determination of the wind-induced responses. The first two modes of vibration were assumed
to be orthogonal linear translation modes along the principal axes of the building. The third
K.S. Wong, K.C.S. Kwok and P.A. Hitchcock
3
mode of vibration was assumed to be a pure torsion mode with a constant mode shape. Struc-
tural damping was assumed to be 1% of critical damping for all modes of vibration. The nat-
ural frequencies of the fundamental translational modes were taken as 0.2 Hz. The prototype
building was assumed to have a translational-torsional frequency ratio of 1.5, i.e. the torsional
natural frequency was taken as 0.3 Hz.
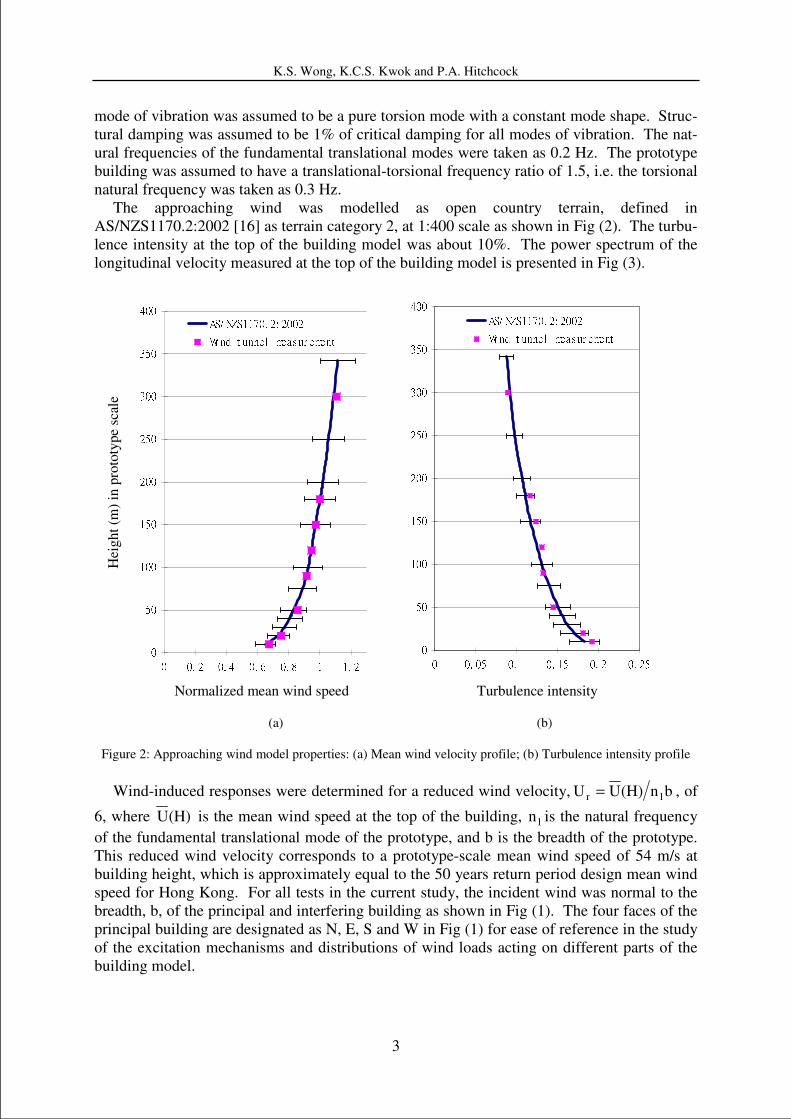
The approaching wind was modelled as open country terrain, defined in
AS/NZS1170.2:2002 [16] as terrain category 2, at 1:400 scale as shown in Fig (2). The turbu-
lence intensity at the top of the building model was about 10%. The power spectrum of the
longitudinal velocity measured at the top of the building model is presented in Fig (3).
050100150200250300350400
0 0. 2 0. 4 0. 6 0. 8 1 1. 2
AS/ NZS1170. 2: 2002Wi nd t unnel measur ement
050100150200250300350400
0 0. 05 0. 1 0. 15 0. 2 0. 25
AS/ NZS1170. 2: 2002Wi nd t unnel meas ur ement
(a) (b)
Figure 2: Approaching wind model properties: (a) Mean wind velocity profile; (b) Turbulence intensity profile
Wind-induced responses were determined for a reduced wind velocity, bn(H)UU 1r = , of
6, where (H)U is the mean wind speed at the top of the building, 1n is the natural frequency
of the fundamental translational mode of the prototype, and b is the breadth of the prototype.
This reduced wind velocity corresponds to a prototype-scale mean wind speed of 54 m/s at
building height, which is approximately equal to the 50 years return period design mean wind
speed for Hong Kong. For all tests in the current study, the incident wind was normal to the
breadth, b, of the principal and interfering building as shown in Fig (1). The four faces of the
principal building are designated as N, E, S and W in Fig (1) for ease of reference in the study
of the excitation mechanisms and distributions of wind loads acting on different parts of the
building model.
Hei
gh
t (m
) in
pro
toty
pe
scal
e
Turbulence intensity Normalized mean wind speed

K.S. Wong, K.C.S. Kwok and P.A. Hitchcock
4
In the HFBB tests, the modal forces were estimated from the overturning moments and tor-
sional moment measured at the base of the principal building model. For this study, the prin-
cipal building model was mounted on a high frequency base balance to measure the horizontal
wind forces acting on the building and the moments about each of the three orthogonal mea-
surement axes of the force balance sensor. The measured moments were then used to predict
the dynamic wind-induced displacement and twist angle responses of the principal building.
Electronic differential pressure transducers were used to measure the surface pressure fluc-
tuations acting on the building model. The transducers were connected to pressure taps via a
three-stage restricted tubing system to provide a flat (±10%) frequency response up to 150 Hz
and a phase lag which was approximately a linear function of frequency. Six layers of pres-
sure taps were installed at heights of 56 mm, 168 mm, 281 mm, 337 mm, 393 mm and 435
mm above the base of the pressure model, comprising nine pressure taps per layer that were
evenly spaced on each building face. As a result, 54 pressure taps were installed on each of
the four faces of the pressure model and a total of 216 pressure taps were installed in the pres-
sure model. The measured fluctuating local pressure time histories were integrated to deter-
mine the aerodynamic modal forces acting on the principal building. The modal force
characteristics were explored by investigating the force spectra and phase spectra of modal
force acting on each individual face.
10-2
10-1
100
101
10-2
10-1
100
Figure 3: Longitudinal turbulence spectrum of the approaching wind
3 EXPERIMENTAL RESULTS AND DISCUSSION
The dynamic wind-induced displacement and twist angle responses of the isolated and inter-
fered principal building were predicted using the high frequency base balance technique. The
positions of the interfering building and the principal building are defined in accordance with
the coordinate system defined in Fig (4), where the geometric centre of the principal building
is located at the origin of the coordinate system (0d, 0b). For the high frequency base balance
tests, the interfering building was placed at different positions upstream and downstream of
the principal building. The interfering building locations closest to the principal building
65
2x
u
x
u
U
nL70.81
U
nL4
+
with scale fullin m200Lx
u =
Measured velocity spectrum at 180m
full scale
2
u
u
σ
(n)nS
hUn

K.S. Wong, K.C.S. Kwok and P.A. Hitchcock
5
were ±1.5d and 1.5b such that the minimum spacing between the interfering and principal
buildings was 0.5d or 0.5b. Inside the region extending from -3d to 3d and 0b to 3b, the loca-
tion of the interfering building was varied in 0.5d or 0.5b increments. Outside of that region,
the location of the interfering building was varied in 1d or 1b increments up to an ordinate
value of 10d upstream of the principal building. Due to the symmetry of the test configura-
tion, it was only necessary to test positive ordinate values.
Figure 4: X-Y coordinate system for locating the interfering building
Buffeting factors, defined by Saunders and Melbourne [9] as the ratio of the interfered
building responses to the building responses for the isolated condition, were used to quantify
the interference effects for the principal building model. Buffeting factors for standard devia-
tion alongwind and crosswind displacement responses and twist angle responses determined
from the high frequency base balance test results were determined for the principal building
for the interfering building locations described above and indicated in Fig (4). The calculated
buffeting factors were then used to generate buffeting factor contours representing equal
magnitudes of standard deviation crosswind displacement response and twist angle response
as presented in Fig (5) and Fig (6) respectively. Additional buffeting factor contours for mean
alongwind and standard deviation alongwind responses for this test configuration were pre-
sented in Wong [17].
The buffeting factor contours indicate that critical interference locations generally occurred
when the interfering building was located diagonally far upstream (9d, 2b), directly upstream
with small building separation (3d, 0b) or diagonally downstream with small building separa-
tion (-2d, 2b). The current study focusses on two directly upstream critical locations, i.e.
when the interfering building was located at (X, Y) = (3d, 0b) and (2d, 0b), corresponding to
the largest magnitudes of standard deviation crosswind displacement response and twist angle
response respectively. Additional detailed pressure tests were undertaken for these two loca-
tions to measure simultaneously the fluctuating pressures acting over the four faces of both
the interfering and principal buildings.

K.S. Wong, K.C.S. Kwok and P.A. Hitchcock
6
0.6
0.80.
8
0.8
0.8
0.8
1
1
11
1
1.2
1.21.2
1.2
1.2
1.2
1.2
1.2
1.4
1.4
1.4
1.4
1.4
1.4
1.4 1.
6
-3d -2d -1d 0d 1d 2d 3d 4d 5d 6d 7d 8d 9d 10d0
1b
2b
3b
Figure 5: Buffeting factor contours at a reduced wind velocity of 6 for standard deviation crosswind response.
0.6
0.6
0.8
0.8
0.8
1
1
11
1
1
1
1.2
1.2
1.2
1.2
1.2
1.4
1.4
1.4
1.4
1.4
1.4
1.6
1.8-3d -2d -1d 0d 1d 2d 3d 4d 5d 6d 7d 8d 9d 10d0
1b
2b
3b
Figure 6: Buffeting factor contours at a reduced wind velocity of 6 for standard deviation twist angle response.
(X, Y) = (9d, 2b), BF = 1.48 (X, Y) = (-2d, 2b), BF = 1.63
(X, Y) = (3d, 0b), BF = 1.42
(X, Y) = (8d, 3b), BF = 1.51 (X, Y) = (-2d, 1b), BF = 1.31
(X, Y) = (2d, 0b), BF = 1.84

K.S. Wong, K.C.S. Kwok and P.A. Hitchcock
7
The detailed pressure measurements were used to calculate spectra of wind forces acting
on each of the building faces and the total modal force acting on the building model. Wong
[17] verified that the pressure tap density was sufficient for measuring the wind-induced loads
on the building model by ensuring consistency between the force spectra obtained by both
high frequency base balance and pressure measurement techniques. Phase angle spectra were
also determined from the pressure measurements to determine the influences of the interfering
building on the correlation between forces acting on each of the faces of the principal building.
When the phase angle between two forces is close to 0, the forces are in-phase and those
forces are effectively combined. When the phase angle between the forces is close to ±π, the
forces are out-of-phase counteracting forces. The phase angle spectra were also a useful tool
to investigate the causes for the different energy distributions between the total force spectra
and the spectra for forces acting on individual faces.
3.1 Standard deviation crosswind displacement responses, (X, Y) = (3d, 0b), BF = 1.42
The normalized total crosswind force, phase angle spectra and individual normalized
crosswind force spectra for Face E and Face W, i.e. the two side faces, of the isolated princip-
al building and with the interfering building located at (X, Y) = (3d, 0b) are presented in Fig
(7). The wind forces acting on Face N and Face S do not contribute to the crosswind force,
hence they are not presented.
10-2
10-1
100
10-4
10-3
10-2
10-1
Total
Reduced Frequency
10-2
10-1
100
-3
-2
-1
0
1
2
3
Phase angle spectrum
Reduced Frequency
Phase a
ngle
(ra
d)
Figure 7: Normalized crosswind force spectra of individual faces and phase angle spectrum for the isolated prin-
cipal building and with an interfering building located at (X, Y) = (3d, 0b)
22
H
Pc
bH]Uρ2
1[
(n)nS
Isolated case
Interfering case
Isolated case
(X, Y) = (3d, 0b), BF = 1.42
U
nb
U
nb
K.S. Wong, K.C.S. Kwok and P.A. Hitchcock
8
10-2
10-1
100
10-4
10-3
10-2
10-1
Face E
Reduced Frequency
10-2
10-1
100
10-4
10-3
10-2
10-1
Face W
Reduced Frequency
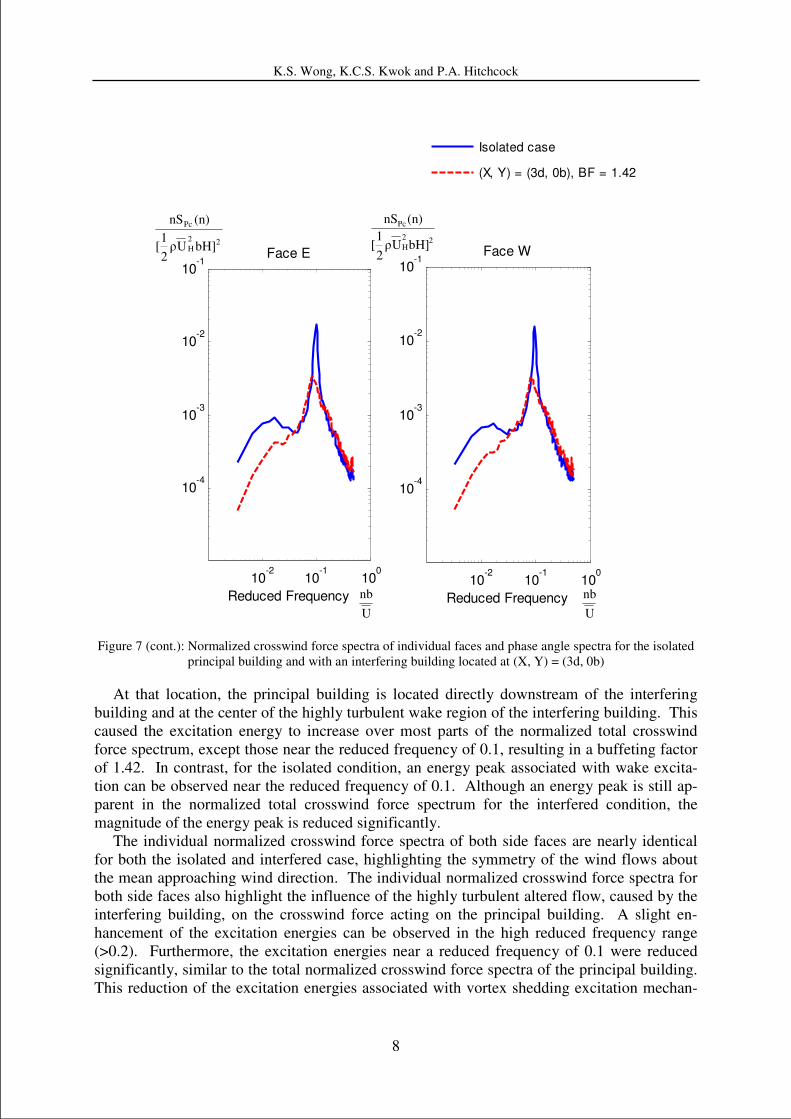
Figure 7 (cont.): Normalized crosswind force spectra of individual faces and phase angle spectra for the isolated
principal building and with an interfering building located at (X, Y) = (3d, 0b)
At that location, the principal building is located directly downstream of the interfering
building and at the center of the highly turbulent wake region of the interfering building. This
caused the excitation energy to increase over most parts of the normalized total crosswind
force spectrum, except those near the reduced frequency of 0.1, resulting in a buffeting factor
of 1.42. In contrast, for the isolated condition, an energy peak associated with wake excita-
tion can be observed near the reduced frequency of 0.1. Although an energy peak is still ap-
parent in the normalized total crosswind force spectrum for the interfered condition, the
magnitude of the energy peak is reduced significantly.
The individual normalized crosswind force spectra of both side faces are nearly identical
for both the isolated and interfered case, highlighting the symmetry of the wind flows about
the mean approaching wind direction. The individual normalized crosswind force spectra for
both side faces also highlight the influence of the highly turbulent altered flow, caused by the
interfering building, on the crosswind force acting on the principal building. A slight en-
hancement of the excitation energies can be observed in the high reduced frequency range
(>0.2). Furthermore, the excitation energies near a reduced frequency of 0.1 were reduced
significantly, similar to the total normalized crosswind force spectra of the principal building.
This reduction of the excitation energies associated with vortex shedding excitation mechan-
22
H
Pc
bH]Uρ2
1[
(n)nS
22
H
Pc
bH]Uρ2
1[
(n)nS
U
nb
U
nb
Isolated case
(X, Y) = (3d, 0b), BF = 1.42

K.S. Wong, K.C.S. Kwok and P.A. Hitchcock
9
ism demonstrates the weakened strength of the vortex formation in the highly turbulent flow.
These observations are consistent with the findings of Melbourne [1], noting the enhancement
of the excitation energies in the high reduced frequency range and the reduction of excitation
energies associated with vortex shedding in the crosswind force spectra of buildings sub-
merged in highly turbulent flow.
At the low reduced frequency range (<0.05), the presence of the interfering building re-
duced the excitation energies of the individual normalized crosswind force spectra for both
side faces, whereas the excitation energies in the corresponding reduced frequency range in
the normalized total crosswind force spectrum were enhanced. The phase angle spectra,
which show the phase angles between the crosswind forces acting on both sides of the prin-
cipal building with respect to the reduced frequency in Fig (7), provides some insight into the
cause of these differences. For the case with the interfering building located at (X, Y) = (3d,
0b), the phase angles of the low reduced frequency components (<0.05) are approximately 0,
indicating that the crosswind forces acting on both sides of the principal building in the cor-
responding frequency range are largely in-phase and well correlated. On the contrary, the low
reduced frequency components (<0.05) for the isolated building case were closer to ±π, indi-
cating that the crosswind forces acting on both sides of the principal building in the corres-
ponding frequency range are largely out-of-phase and counteracting. Consequently, with the
presence of the interfering building, the excitation energies in the low reduced frequency
range of the individual normalized crosswind force spectra for both side faces were reduced.
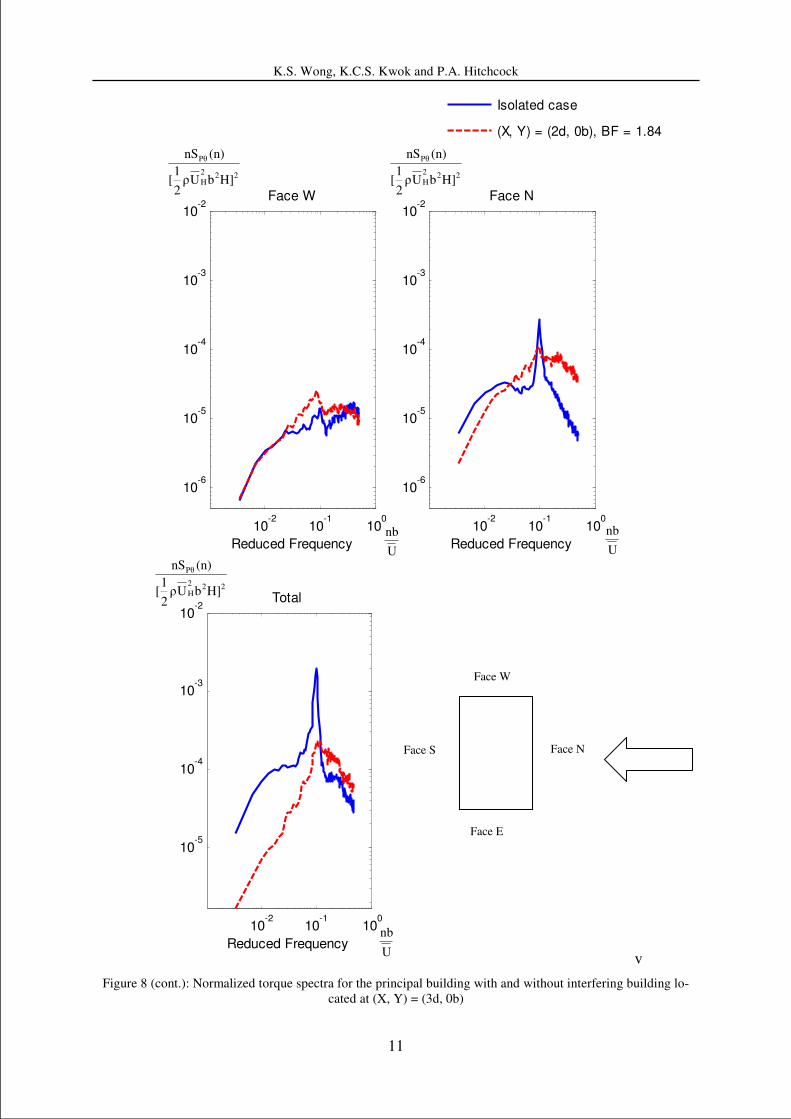
3.2 Standard deviation twist angle responses, (X, Y) = (2d, 0b), BF = 1.84
The presence of an upstream interfering building also significantly affected the standard
deviation twist angle response of the principal building. A critical location for standard devia-
tion twist angle response was identified when the interfering building was located at (X, Y) =
(2d, 0b), for which a buffeting factor of 1.84 was recorded. The normalized total torque spec-
trum and the individual normalized torque spectra acting on each face of the principal build-
ing are presented in Fig. (8).
As shown in the normalized total torque spectrum for the interfered case presented in Fig
(8), the excitation energies at reduced frequencies greater than 0.1 were enhanced significant-
ly, while the excitation energies near a reduced frequency of 0.1 were markedly reduced. Fur-
thermore, excitation energies at reduced frequencies less than 0.1 in the normalized total
torque spectra of the interfered case were reduced significantly, which presents a marked con-
trast with the isolated building configuration.
The normalized torque spectra of each individual face of the principal building presented
in Fig (8) show that the enhancement of excitation energies in the high reduced frequency
range does not occur on all faces. Relative to the isolated condition, the normalized torque
spectra of the individual faces of the principal building showed different characteristics for the
excitation energies in the high reduced frequency range. In particular, significant enhance-
ment of excitation energies in the high reduced frequency range were registered in the norma-
lized torque spectrum of the windward face, Face N. The high reduced frequency range of the
normalized torque spectra for the side faces, Face E and Face W, were relatively unaffected
and the excitation energies in the high reduced frequency range for the leeward Face S were
significantly reduced.

K.S. Wong, K.C.S. Kwok and P.A. Hitchcock
10
The normalized torque spectra for the individual faces of the principal building also high-
light the different characteristics for the excitation energies associated with vortex shedding
(at a reduced frequency of 0.1) and in the low reduced frequency range (<0.05). As shown in
Fig (8), the excitation energies near the reduced frequency of 0.1 of the normalized torque
spectra for Face N and Face S were reduced significantly, while the excitation energies near
the reduced frequency of 0.1 of the normalized torque spectra of Face E and Face W were
slightly increased. Furthermore, excitation energies in the low reduced frequency range were
reduced significantly in the normalized torque spectra of Face N and Face S, whereas the
normalized torque spectra of Face E and Face W in this range were similar to the isolated
building case. These observations highlight the complexity of interference effects on the
principal building.
10-2
10-1
100
10-6
10-5
10-4
10-3
10-2
Face E
Reduced Frequency
10-2
10-1
100
10-6
10-5
10-4
10-3
10-2
Face S
Reduced Frequency
Figure 8: Normalized torque spectra for the isolated principal building and with an interfering building located at
(X, Y) = (3d, 0b)
U
nb
U
nb
222
H
Pθ
H]bUρ2
1[
(n)nS
222
H
Pθ
H]bUρ2
1[
(n)nS
Isolated case
(X, Y) = (2d, 0b), BF = 1.84
K.S. Wong, K.C.S. Kwok and P.A. Hitchcock
11
10-2
10-1
100
10-6
10-5
10-4
10-3
10-2
Face W
Reduced Frequency
10-2
10-1
100
10-6
10-5
10-4
10-3
10-2
Face N
Reduced Frequency
10-2
10-1
100
10-5
10-4
10-3
10-2
Total
Reduced Frequency v
Figure 8 (cont.): Normalized torque spectra for the principal building with and without interfering building lo-
cated at (X, Y) = (3d, 0b)
Face E
Face S Face N
Face W
222
H
Pθ
H]bUρ2
1[
(n)nS
U
nb
222
H
Pθ
H]bUρ2
1[
(n)nS
222
H
Pθ
H]bUρ2
1[
(n)nS
U
nb
U
nb
Isolated case
(X, Y) = (2d, 0b), BF = 1.84
K.S. Wong, K.C.S. Kwok and P.A. Hitchcock
12
4 CONCLUSIONS
Interference effects on a pair of identical rectangular buildings located in open country ter-
rain were assessed quantitatively for a wind reduced velocity of 6 using the high frequency
base balance technique. The results showed that an identical building located directly up-
stream of the principal building created significant interference effects by increasing the stan-
dard deviation displacement and twist angle responses of the downstream principal building.
The standard deviation crosswind displacement and twist angle response of the principal
building for the presented critical building arrangement were increased by about 40% and
80% respectively.
Simultaneous pressure measurements were used to explore the excitation mechanisms due
to interference effects. Force spectra determined for the individual faces of the principal
building demonstrated that the interference effects on different parts of the principal building
model can vary significantly. The data also showed that the correlation between forces acting
on different parts of the principal building can be significantly enhanced by the presence of an
interfering building having similar building dimensions, resulting in larger building responses.
Results of correlation analyses based on the measured pressure data also shed new light on the
interference excitation mechanisms and complement the results obtained from the high fre-
quency base balance tests.
5 ACKNOWLEDGEMENT
This research project is funded by a Research Grants Council of Hong Kong Central Allo-
cation Grant (Project CA04/05.EG01). Thanks also go to the staff of the CLP Power
Wind/Wave Tunnel Facility at HKUST.
REFERENCES
[1] W. H. Melbourne. Cross-wind response of structures to wind action, Proceedings of 4th International Conference on Wind Effects on Buildings and Structures, London, Cambridge University Press, pp. 343-358, Sep, 1976. [2] K.C.S. Kwok. Cross-wind response of tall buildings. Eng. Structures, 4, 256 – 262, 1982 [3] A. Kareem. Acrosswind response of buildings. Journal of Structural Division, ASCE, Vol. 108, No.ST4, 869 – 887, 1982. [4] D.W. Boggs. Validation of the aerodynamic model method. Journal of Wind Engineering and Industrial Aerodynamics, 41 – 44, 1011 – 1022, 1992. [5] J. Kawai. Bending and torsional vibration of tall buildings in strong wind. Journal of Wind Engineering and Industrial Aerodynamics, 50, 281 – 288, 1993. [6] W. J. Zhang, K. C. S. Kwok, Y. L. Xu. Aeroelastic torsional behaviour of tall buildings in wakes. Journal of Wind Engineering and Industrial Aerodynamics, 51, 229 – 248, 1994. [7] T. Tschanz, A.G. Davenport. The base balance technique for the determination of dynam-ic wind loads, Journal of Wind Engineering and Industrial Aerodynamics, 13, 429 – 439, 1982. [8] W. H. Melbourne, D. B. Sharp. Effects of upwind buildings on the response of tall build-ings. Proceedings of the Regional Conference On Tall Buildings, Hong Kong, 174—191. 1976 [9] J. W. Saunders, W. H. Melbourne. Buffeting effects of upstream buildings. Proceedings of the Fifth International Conference On Wind Engineering, Fort Collins, Colorado, Pergamon Press, Oxford, 593—608, 1979 [10] H. P. Ruscheweyh. Dynamic response of high-rise buildings under wind action with in-terference effects from surrounding buildings of similar size. Proceedings of the Fifth Interna-
K.S. Wong, K.C.S. Kwok and P.A. Hitchcock
13
tional Conference On Wind Engineering, Fort Collins, Colorado, Pergamon Press, Oxford, 725—734, 1979 [11] T. A. Reinhold, P. R. Sparks. The influence of an upstream structure on the dynamic re-sponse of a square-section tall building. Proceedings of the Fourth Colloquium on Industrial Aerodynamics, Aachen, Germany, 1980. [12] P. A. Bailey, K. C. S. Kwok, Interference excitation of twin tall buildings, Journal of Wind Engineering and Industrial Aerodynamics, 21, 323 – 338, 1985. [13] J. Blessmann, Buffeting effects on neighbouring tall buildings, Journal of Wind Engi-neering and Industrial Aerodynamics, 105 – 110, 1985. [14] S. Thepmongkorn, G. S. Wood, K. C. S. Kwok, Interference effects on wind-induced coupled motion of a tall building, Journal of Wind Engineering and Industrial Aerodynamics, 90, 1807 – 1815, 2002. [15] U.F. Tang, K.C.S. Kwok. Interference excitation mechanisms on a 3DOF aeroelastic CAARC building model. Journal of Wind Engineering and Industrial Aerodynamics, 92, 1299 – 1314, 2004. [16] Standard Australia/Standards New Zealand. Australia/New Zealand Standard Structural design actions Part 2: Wind actions, AS/NZS 1170.2:2002, 2002. [17] K.S. Wong. Wind-induced interference effects on eccentric tall buildings. MPhil Thesis, Dept. Civil Eng., The Hong Kong University of Science and Technology, 2007