Interfacing with Learning Technologies Shaaron Ainsworth.
52
Interfacing with Learning Technologies Shaaron Ainsworth
-
Upload
erick-shields -
Category
Documents
-
view
213 -
download
0
Transcript of Interfacing with Learning Technologies Shaaron Ainsworth.

Interfacing with Learning Technologies
Shaaron Ainsworth
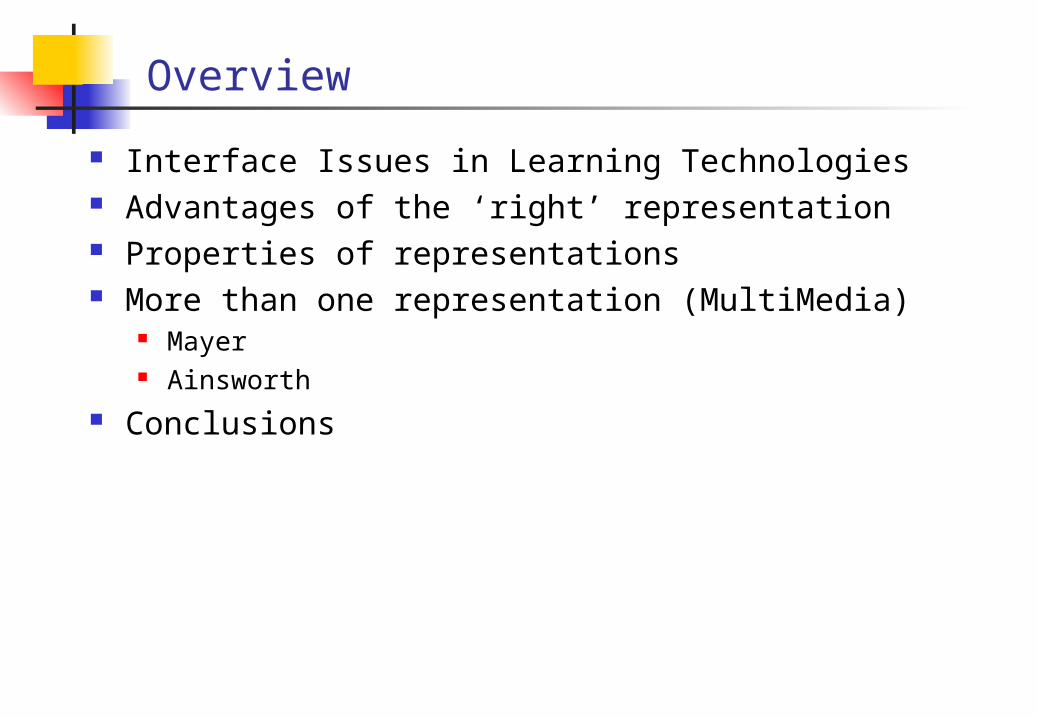
Overview
Interface Issues in Learning Technologies Advantages of the ‘right’ representation Properties of representations More than one representation (MultiMedia)
Mayer Ainsworth
Conclusions
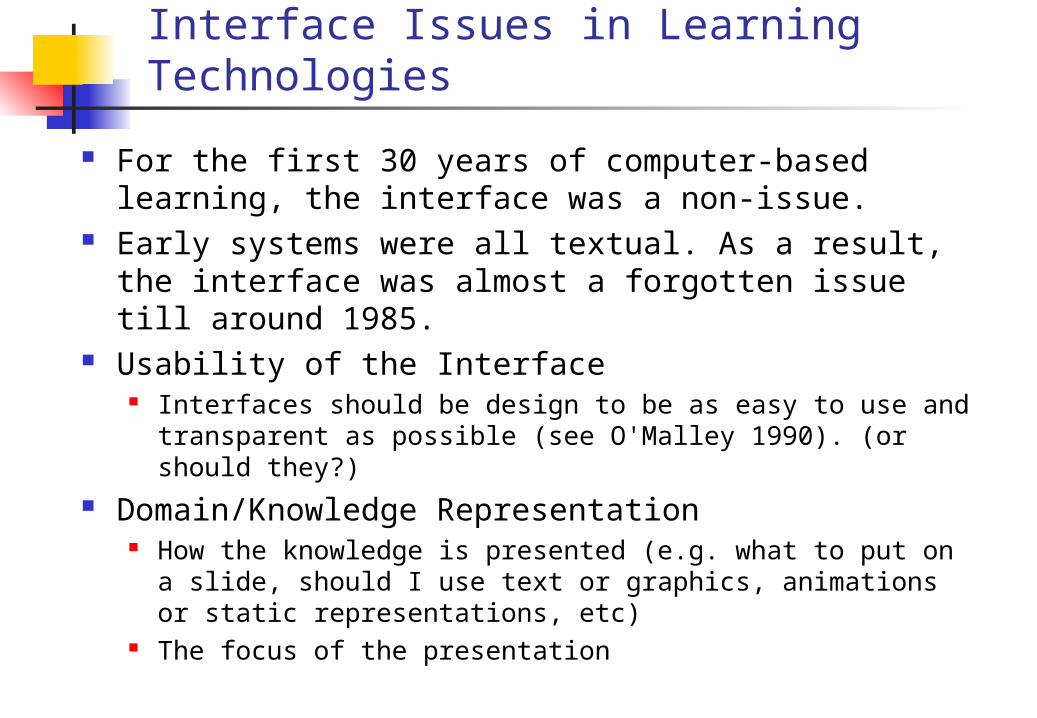
Interface Issues in Learning Technologies
For the first 30 years of computer-based learning, the interface was a non-issue.
Early systems were all textual. As a result, the interface was almost a forgotten issue till around 1985.
Usability of the Interface Interfaces should be design to be as easy to use and
transparent as possible (see O'Malley 1990). (or should they?)
Domain/Knowledge Representation How the knowledge is presented (e.g. what to put on a slide,
should I use text or graphics, animations or static representations, etc)
The focus of the presentation
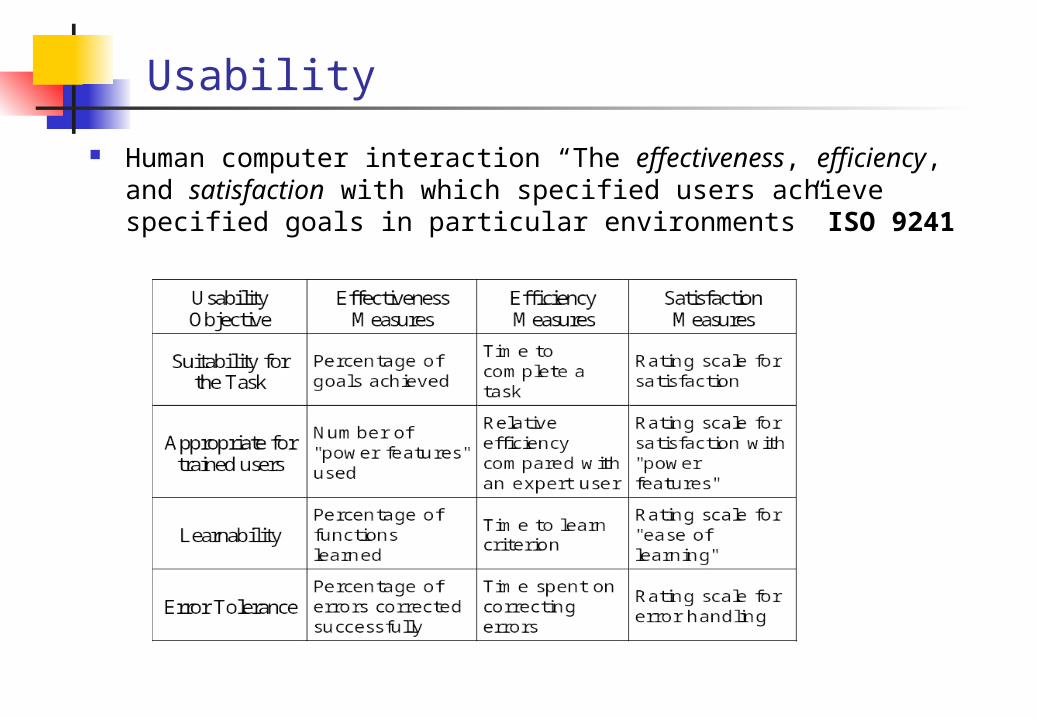
Usability
Human computer interaction “The effectiveness, efficiency, and satisfaction with which specified users achieve specified goals in particular environments” ISO 9241

Consequences of poor usability
If you have the wrong interface, the environment may be sufficiently unusable that learners will find it difficult to use or may not to use the it at all.
Or …..
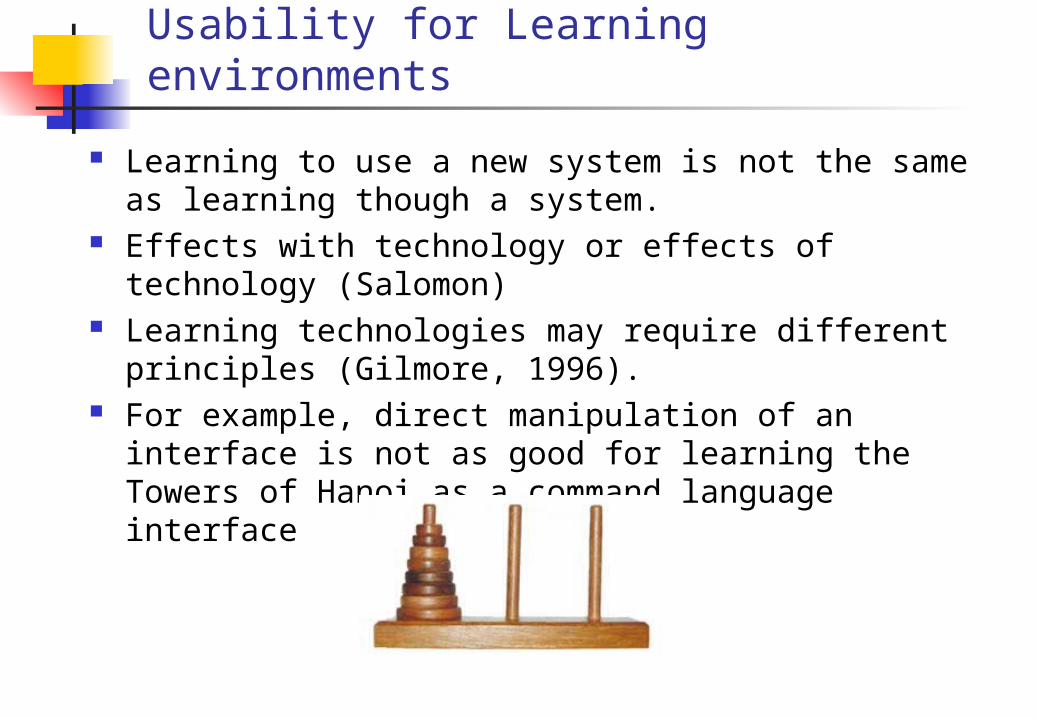
Usability for Learning environments
Learning to use a new system is not the same as learning though a system.
Effects with technology or effects of technology (Salomon)
Learning technologies may require different principles (Gilmore, 1996).
For example, direct manipulation of an interface is not as good for learning the Towers of Hanoi as a command language interface

Overview
Interface Issues in Learning Technologies Advantages of the ‘right’ representation Properties of representations More than one representation (MultiMedia)
Mayer Ainsworth
Conclusions

Domain or Knowledge Representation
What information do you chose to display to learners How do you chose to display it? What interactivity will you support?
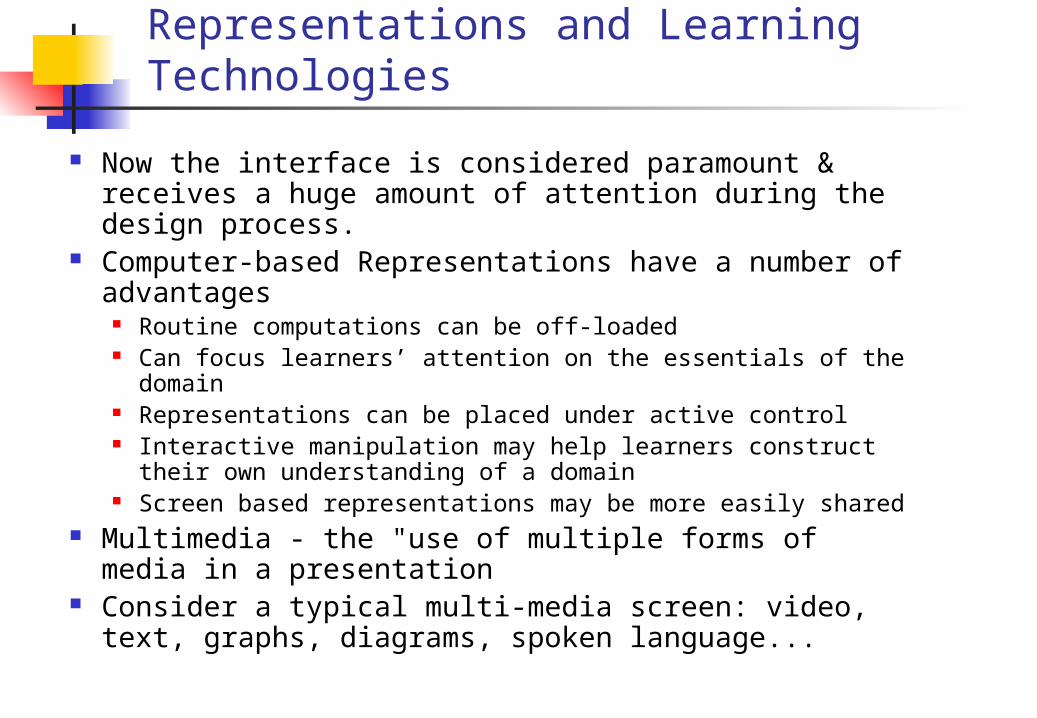
Representations and Learning Technologies
Now the interface is considered paramount & receives a huge amount of attention during the design process.
Computer-based Representations have a number of advantages
Routine computations can be off-loaded Can focus learners’ attention on the essentials of the
domain Representations can be placed under active control Interactive manipulation may help learners construct their
own understanding of a domain Screen based representations may be more easily shared
Multimedia - the "use of multiple forms of media in a presentation
Consider a typical multi-media screen: video, text, graphs, diagrams, spoken language...

A Typical Multi-Media Screen

But is this a good idea?
Multimedia sells…. But is it effective and how should it be designed?
Two approaches Mayer’s Cognitive load theory of multimedia learning Ainsworth’s DeFT framework for learning with multiple ERs

Mayer: Cognitive Theory of Multi-Media Learning
Visual & auditory experiences/information are processed through separate information processing "channels."
Each channel is limited in its ability to process information. Processing is an active cognitive process designed to
construct coherent mental representations
Words
Images
Text-base
Image-base
Verbally-based Model
Visually-based model
SELECT Words
SELECT images
ORGANIZE Words
ORGANIZE Images
INTEGRATE

Typical Empirical Study
Participants for an experiment are recruited in return for credit on psychology courses or are paid a small amount.
What they learn does not relate to their education They may be given a short pen and paper multi-choice pre-test
to check that they have little prior knowledge of the concepts of the domain and then are randomly assigned to two groups.
A short orientation phase is provided to ensure that students know how to use the interface.
They then learn for 30 minutes followed immediately by a pen and paper multi-choice post-test of the domain concepts, which typically will include some harder elements than the pre-test.
They are debriefed, thanked for their participation and told not to sign up for further experiments, as they are not naïve to the material.
The whole experience takes about an hour.

Multimedia
From words and pictures than from words alone. Students who listened to a narration explaining how a bicycle
tire pump works while viewing a corresponding animation gave twice as many useful solutions to transfer questions than did students who listened to the same narration without the animation (Mayer & Anderson, 1991).
Students build two different mental representations --a verbal model and a visual model -- and build connections between them.

Temporal Contiguity
When corresponding words and pictures are presented simultaneously
Mayer, Moreno, Boire & Vagge, (1999) found that presenting simultaneous narration and large chunks of animation was better than sequential presentation
Corresponding words and pictures must be in working memory at the same time in order to facilitate the construction of referential links between them
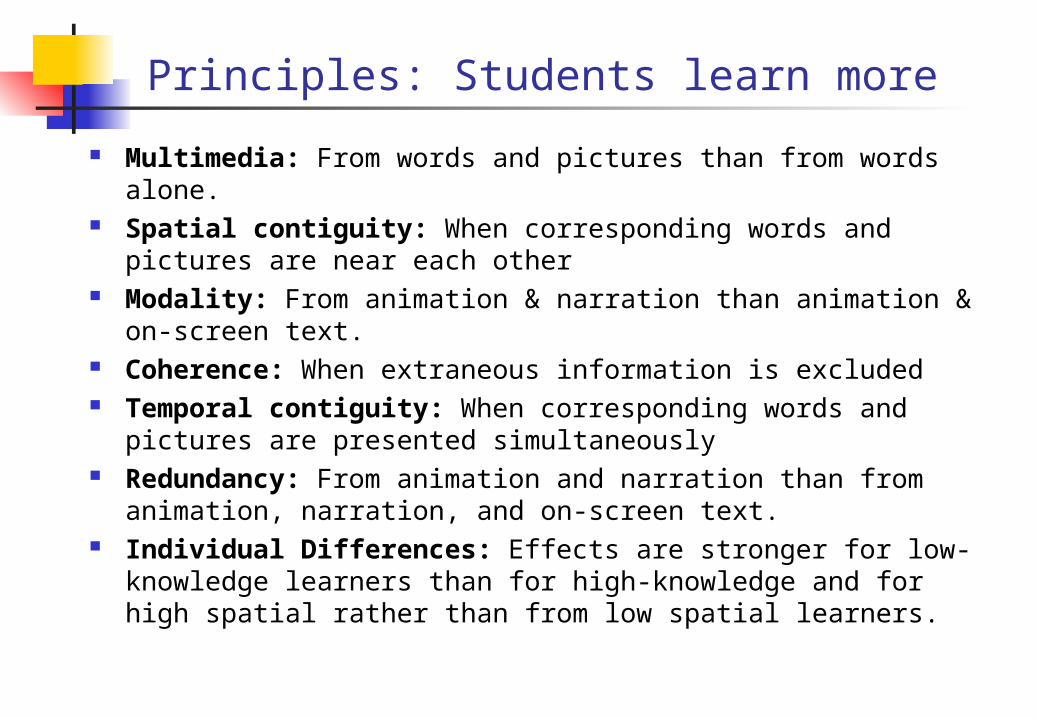
Principles: Students learn more
Multimedia: From words and pictures than from words alone. Spatial contiguity: When corresponding words and pictures
are near each other Modality: From animation & narration than animation & on-
screen text. Coherence: When extraneous information is excluded Temporal contiguity: When corresponding words and
pictures are presented simultaneously Redundancy: From animation and narration than from
animation, narration, and on-screen text. Individual Differences: Effects are stronger for low-
knowledge learners than for high-knowledge and for high spatial rather than from low spatial learners.

Mayer Analysis: Positive
Robust and replicable results confirmed by others Relationship between theory, design and evaluation Statistical rigour and experiments which explore
conditions when multimedia is not effective Explore different forms of learning outcome (e.g.
facts, transferable knowledge) The most popular current theory (see also Cognitive
Load theory)

Mayer Analysis: Minus
Is the theoretical explanation sufficient? Are there other explanations equally consistent with the results?
Is the methodology appropriate? Is the explanation sufficiently complete? Emphasis is
placed on representation form and slightly on learning outcomes and individual factors but
Are a sufficient variety of representations explored? Are a sufficient variety of learning tasks explored?
Are most of the results about a specific form of dynamic representation?
Is it too early for principles?

Overview
Advantages of the ‘right’ representation Properties of representations More than one representation (MultiMedia)
Mayer Ainsworth
Conclusions

An Alternative: DeFT (Ainsworth, in press)
In order to understand learning with multiple representations, we need to explore a wider variety of learning scenarios and provide a deeper account of the processes involved in learning
Three key questions How is the system designed? (Design) What are you using the multiple representations for?
(Functions) What cognitive tasks must learners perform? (Tasks)
Ignores type of learning outcome (for now)
Task
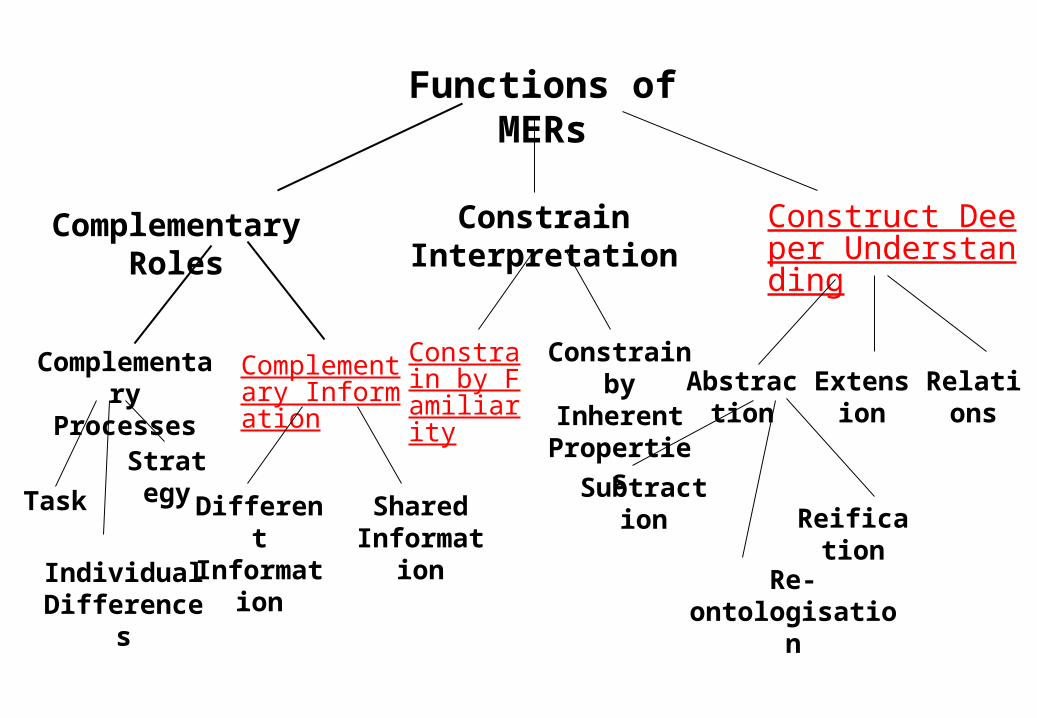
Complementary Roles Constrain Interpretation
Complementary Processes
Different Information
Constrain by Familiarity
Constrain by Inherent
Properties
Strategy
Individual Differences
Functions of MERs
Complementary Information
Shared Information
Construct Deeper Understanding
Abstraction
Re-ontologisation
ReificationSubtraction
Extension Relations

Cognitive Tasks
1. the properties of the representation2. the relation between the representations and the
domain3. how to select appropriate representations4. how to construct or even invent an appropriate
representation5. how to translate between representations

The properties of the representation
Learners must know how a representation encodes and presents information (the ‘format’).
In the case of a graph, the format would be attributes such as lines, labels, and axes.
They must also learn what the ‘operators’ are for a given representation.
For a graph, operators to be learnt include how to find the gradients of lines, maxima and minima, and intercepts.

The relation between the representations and the domain
Interpretation of representations is inherently contextualised
It particularly difficult for learning, as this understanding must be forged upon incomplete domain knowledge.
Learners need to determine which operators to apply to a representation to retrieve the relevant domain information
For example, when attempting to read the velocity of an object from a distance-time graph, children often examine the height of line, rather than its gradient
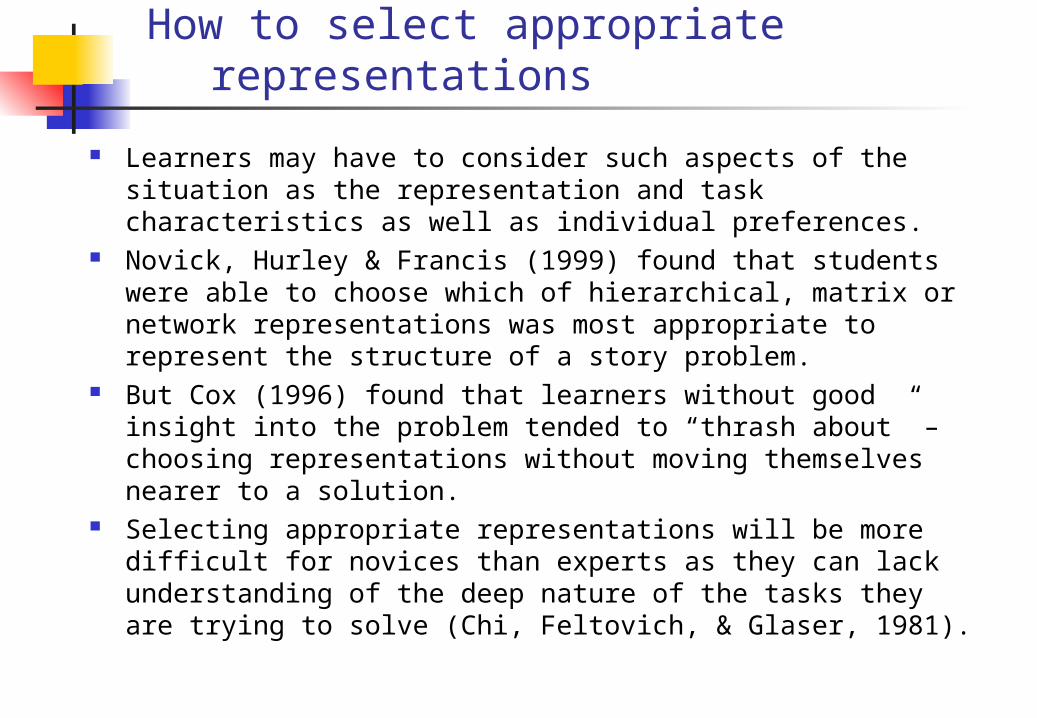
How to select appropriate representations
Learners may have to consider such aspects of the situation as the representation and task characteristics as well as individual preferences.
Novick, Hurley & Francis (1999) found that students were able to choose which of hierarchical, matrix or network representations was most appropriate to represent the structure of a story problem.
But Cox (1996) found that learners without good insight into the problem tended to “thrash about” – choosing representations without moving themselves nearer to a solution.
Selecting appropriate representations will be more difficult for novices than experts as they can lack understanding of the deep nature of the tasks they are trying to solve (Chi, Feltovich, & Glaser, 1981).
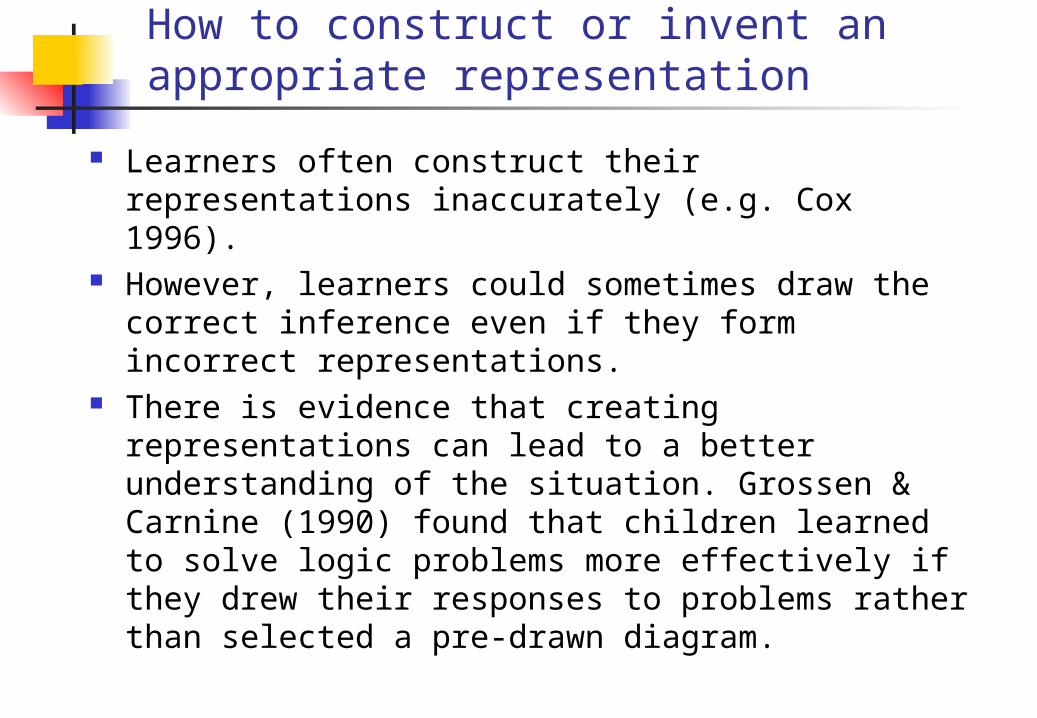
How to construct or invent an appropriate representation
Learners often construct their representations inaccurately (e.g. Cox 1996).
However, learners could sometimes draw the correct inference even if they form incorrect representations.
There is evidence that creating representations can lead to a better understanding of the situation. Grossen & Carnine (1990) found that children learned to solve logic problems more effectively if they drew their responses to problems rather than selected a pre-drawn diagram.
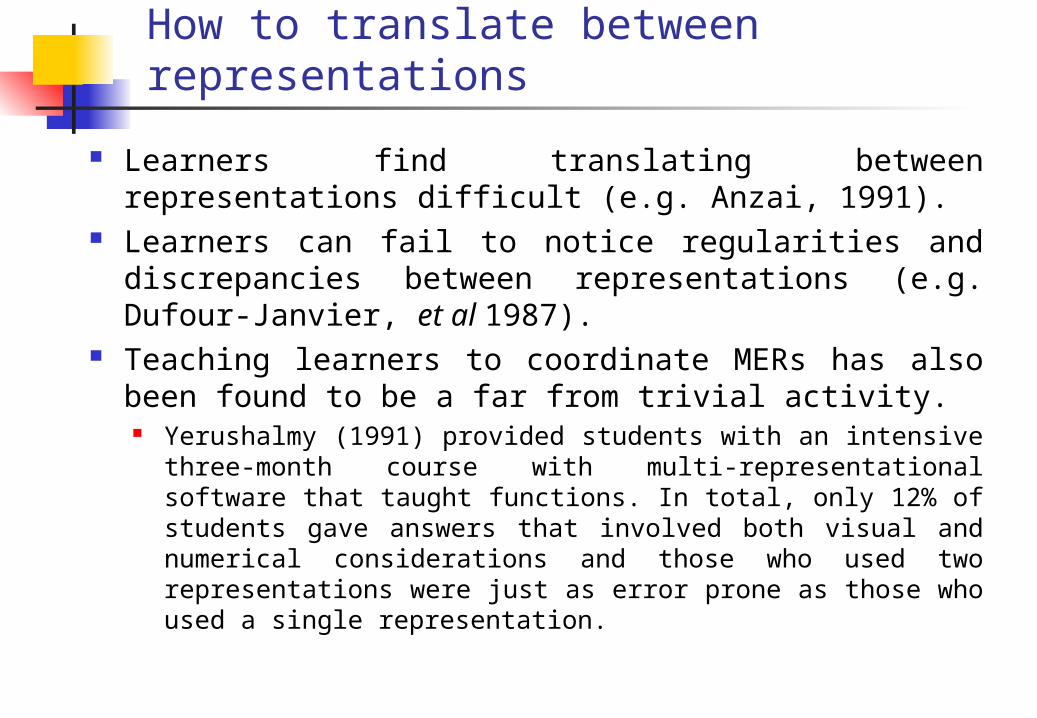
How to translate between representations
Learners find translating between representations difficult (e.g. Anzai, 1991).
Learners can fail to notice regularities and discrepancies between representations (e.g. Dufour-Janvier, et al 1987).
Teaching learners to coordinate MERs has also been found to be a far from trivial activity.
Yerushalmy (1991) provided students with an intensive three-month course with multi-representational software that taught functions. In total, only 12% of students gave answers that involved both visual and numerical considerations and those who used two representations were just as error prone as those who used a single representation.
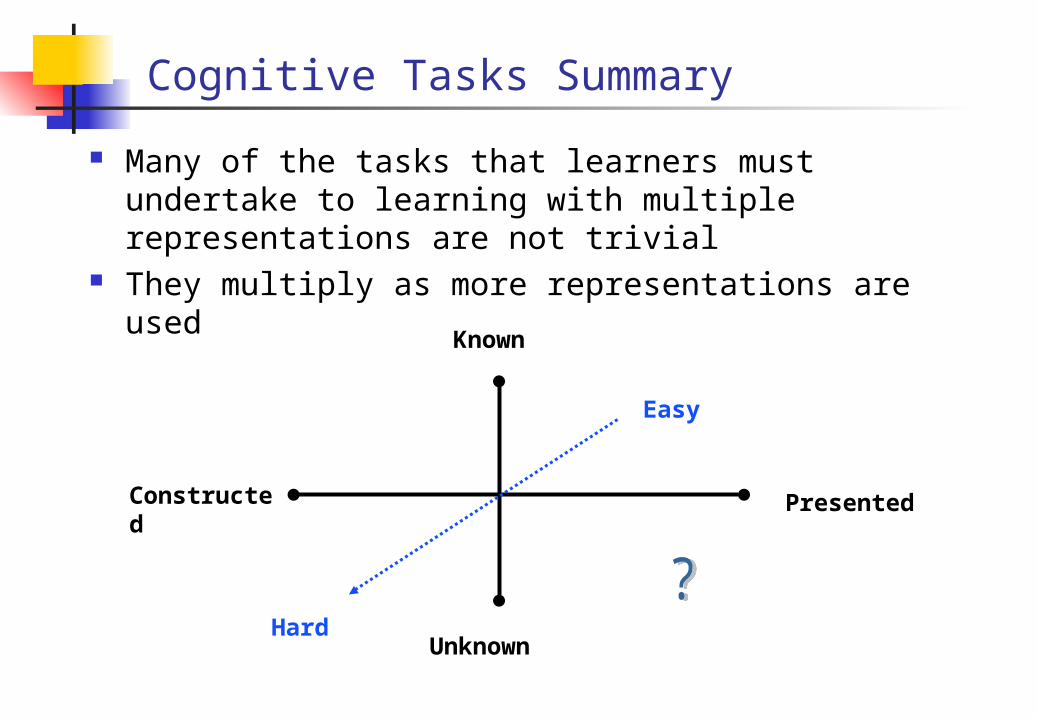
Cognitive Tasks Summary
Many of the tasks that learners must undertake to learning with multiple representations are not trivial
They multiply as more representations are used
Presented
Known
Unknown
Constructed
Hard
Easy
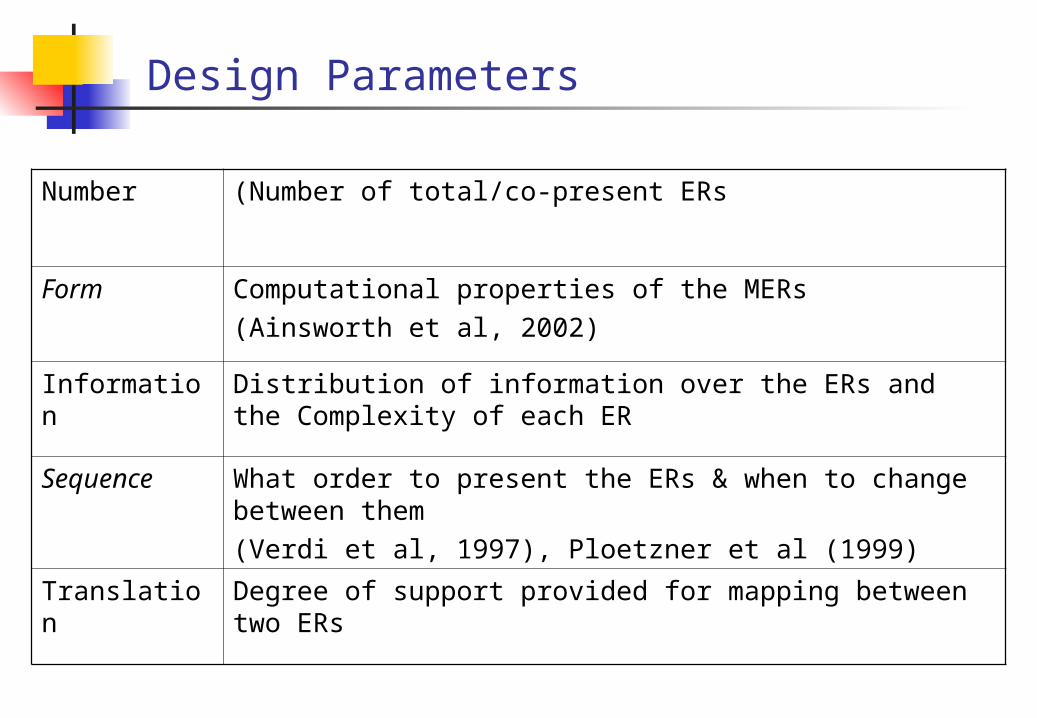
Design Parameters
Number (Number of total/co-present ERs
Form Computational properties of the MERs(Ainsworth et al, 2002)
Information Distribution of information over the ERs and the Complexity of each ER
Sequence What order to present the ERs & when to change between them(Verdi et al, 1997), Ploetzner et al (1999)
Translation Degree of support provided for mapping between two ERs
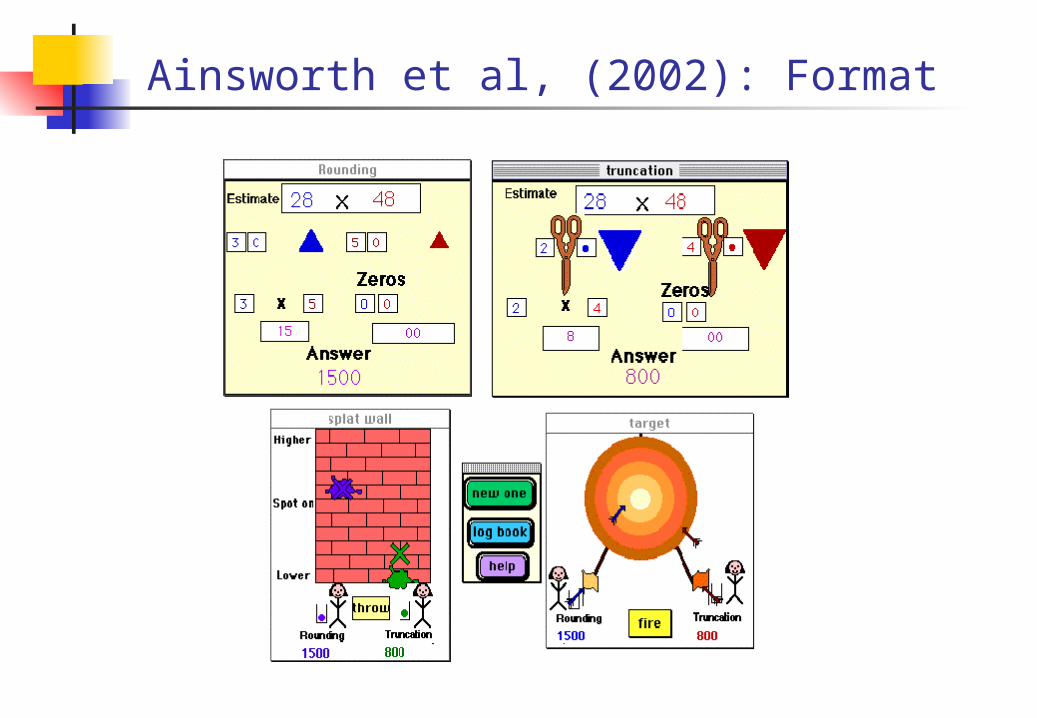
Ainsworth et al, (2002): Format
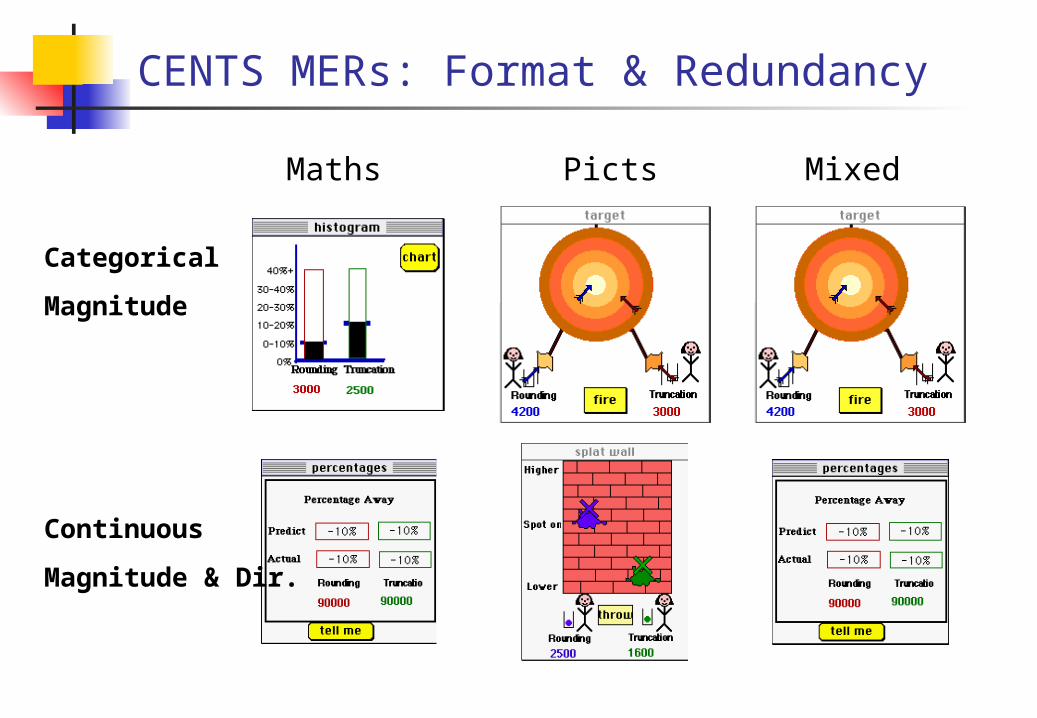
MixedMaths Picts
Categorical
Magnitude
Continuous
Magnitude & Dir.
CENTS MERs: Format & Redundancy
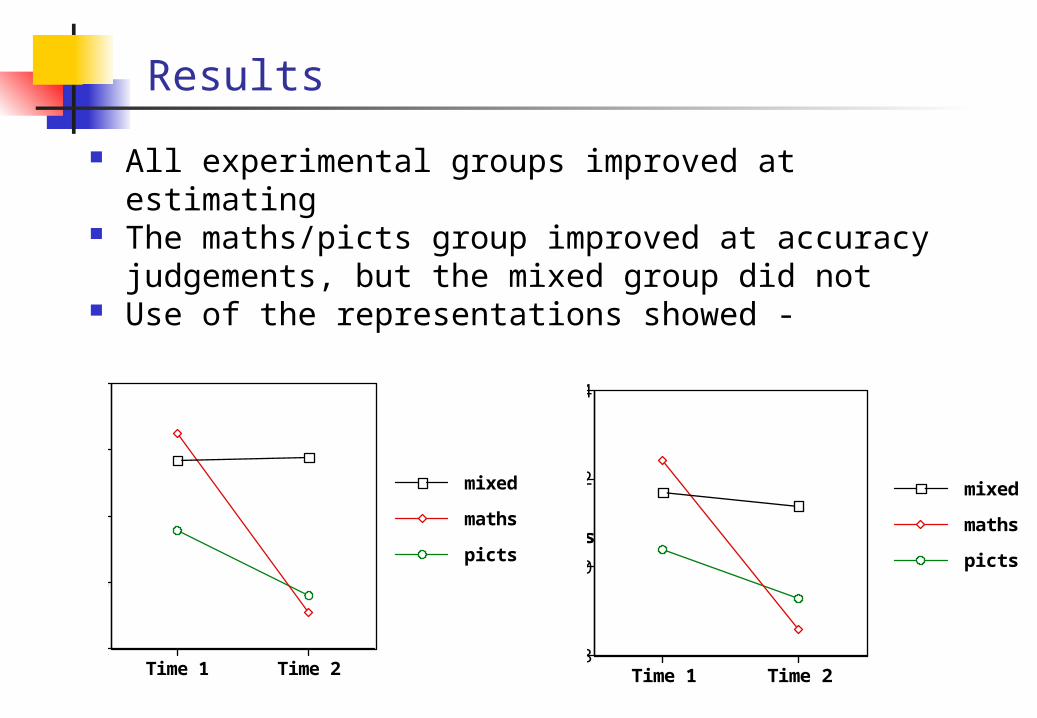
Results
All experimental groups improved at estimating The maths/picts group improved at accuracy
judgements, but the mixed group did not Use of the representations showed -
2.2
2.4
2.6
2.8
3.0
Log of Percentage Deviation
Time 1 Time 2
picts
maths
mixed
0.8
1.0
1.2
1.4
CategoryDifferences
Time 1 Time 2
picts
maths
mixed
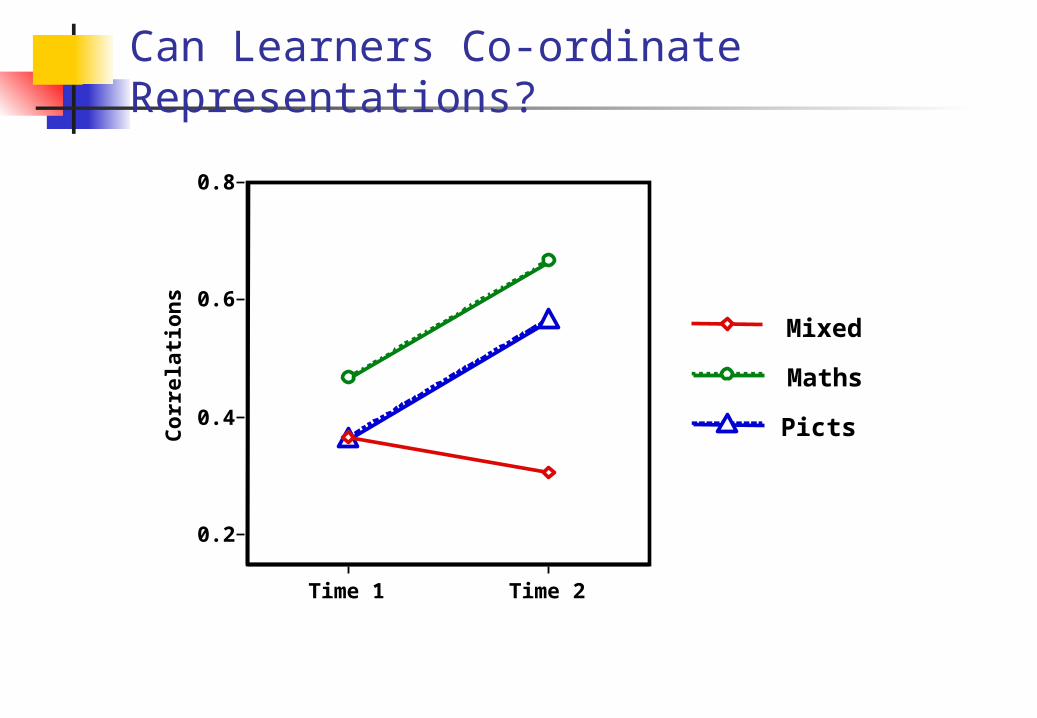
Can Learners Co-ordinate Representations?
0.2
0.4
0.6
0.8C
orr
elat
ion
s
Time 1 Time 2
Picts
Maths
Mixed
DeFT analysis: Positive
In favour Considers a wider range of learning scenarios and takes
more seriously the idea that different pedagogical functions require different multimedia designs
Attempts a deeper analysis of cognitive processes Evaluations in more naturalistic situations Integrates a wider range of research
DeFT analysis: Negative
Says everything is more complicated! Has more questions than answers Still ignores learning outcomes Is less strongly related to a theoretical account of
cognitive structure And like Mayer is not predictive
Conclusions
Representations are crucial for learning. A learning environment must present information in such a way that it encourages learning.
Learning with representations involves at least four factors: Representation, Learner, Task and Outcome.
Multiple representations/multi-media have an important role to play
They may be motivating However, multimedia should be designed carefully to
achieve the benefits without losing out to the costs How do so is still an open question…..

Open Questions?
How important is the interface in educational software? Is it more important to design for usability or learnability? What can the design of new interfaces learn from old
interfaces? And do computers represent anything uniquely different?
Do we know enough to design effective multimedia? Can classical cognitive psychological approaches explain
learning with multimedia or do we need alternative perspectives?
What new interface issues may arise in future? How should we evaluate the contribution that an interface
makes to the success of an item of educational technology?
Reading From Course Text
How People Learn Some relevant discussion in Chapter 3 and Chapter 9
Reading From Original Sources
Ainsworth, S.E. (1999) A Functional Taxonomy of Multiple Representations. Computers and Education
Ainsworth, S. E., Bibby, P., & Wood, D. (2002). Examining the effects of different multiple representational systems in learning primary mathematics. Journal of the Learning Sciences, 11(1), 25-61.
Ainsworth, S. E., & Loizou, A. T. (2003). The effects of self-explaining when learning with text or diagrams. Cognitive Science, 27(4), 669-681.
Ainsworth (in press) DEFT – a framework for learning with multiple representations on my website)
Chi, M. T. H., Bassok, M., Lewis, M. W., Reimann, P., & Glaser, R. (1989). Self-explanations: How students study and use examples in learning to solve problems. Cognitive Science, 5, 145-182.
Gilmore, D. J. (1996). The relevance of HCI guidelines for educational interfaces. Machine-Mediated Learning, 5(2), 119-133
Larkin, J. H., & Simon, H. A. (1987). Why a diagram is (sometimes) worth ten thousand words. Cognitive Science, 11, 65-99.

Reading From Original Sources
Mayer, R. E., & Moreno, R. (2002). Aids to computer-based multimedia learning. Learning and Instruction, 12(1), 107-119.
Najjar, L. (1998). Principles of educational multi-media user interface design. Human Factors, 40(2), 311-323.
O'Malley, C. (1990). Interface issues for guided discovery learning environments. In M. Elsom-Cook (Eds.), Guided Discovery Tutoring: London: Paul Chapman Publishing
Ploetzner, R., Fehse, E., Kneser, C., & Spada, H. (1999). Learning to relate qualitative and quantitative problem representations in a model-based setting for collaborative problem solving. Journal of the Learning Sciences, 8(2), 177-214.
Scaife, M., & Rogers, Y. (1996). External cognition: how do graphical representations work? International Journal of Human-Computer Studies, 45, 185-213.
Seufert, T. (2003). Supporting coherence formation in learning from multiple representations. Learning and Instruction, 13(2), 227-237..
Verdi, M. P., Johnson, J. T., Stock, W. A., Kulhavy, R. W., & Whitman, P. (1997). Organized spatial displays and texts: Effects of presentation order and display type on learning outcomes. Journal of Experimental Education, 65(4), 303-317.
Zhang, J., & Norman, D. A. (1994). Representations in distributed cognitive tasks. Cognitive Science, 18, 87-122.

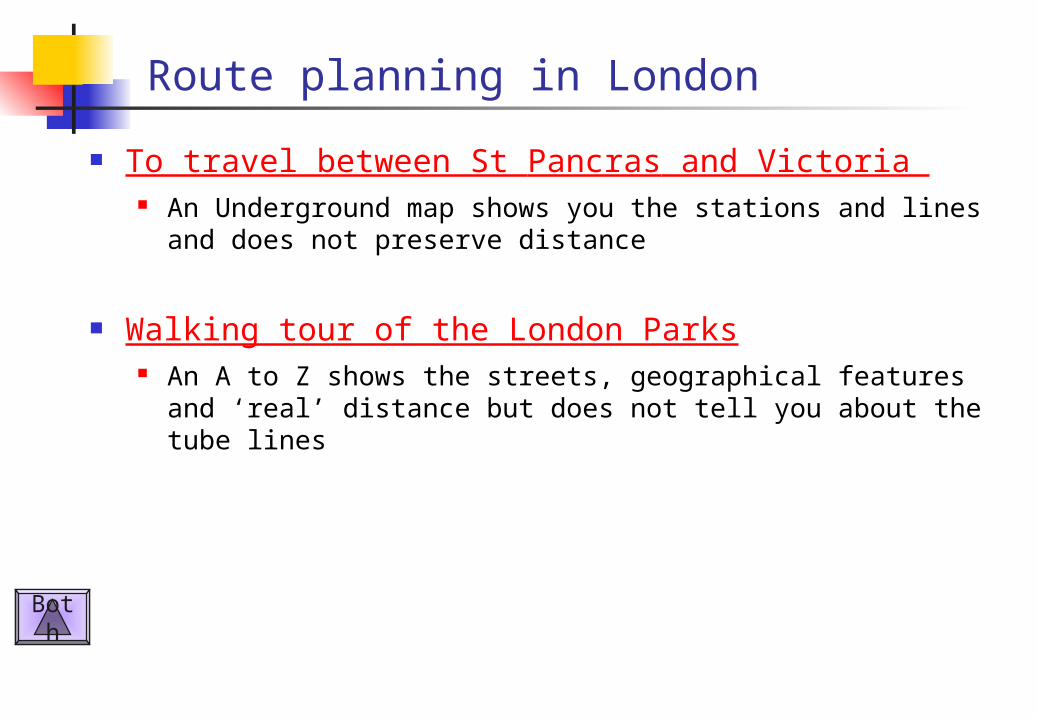
Route planning in London
To travel between St Pancras and Victoria An Underground map shows you the stations and lines and
does not preserve distance
Walking tour of the London Parks An A to Z shows the streets, geographical features and ‘real’
distance but does not tell you about the tube lines
Both
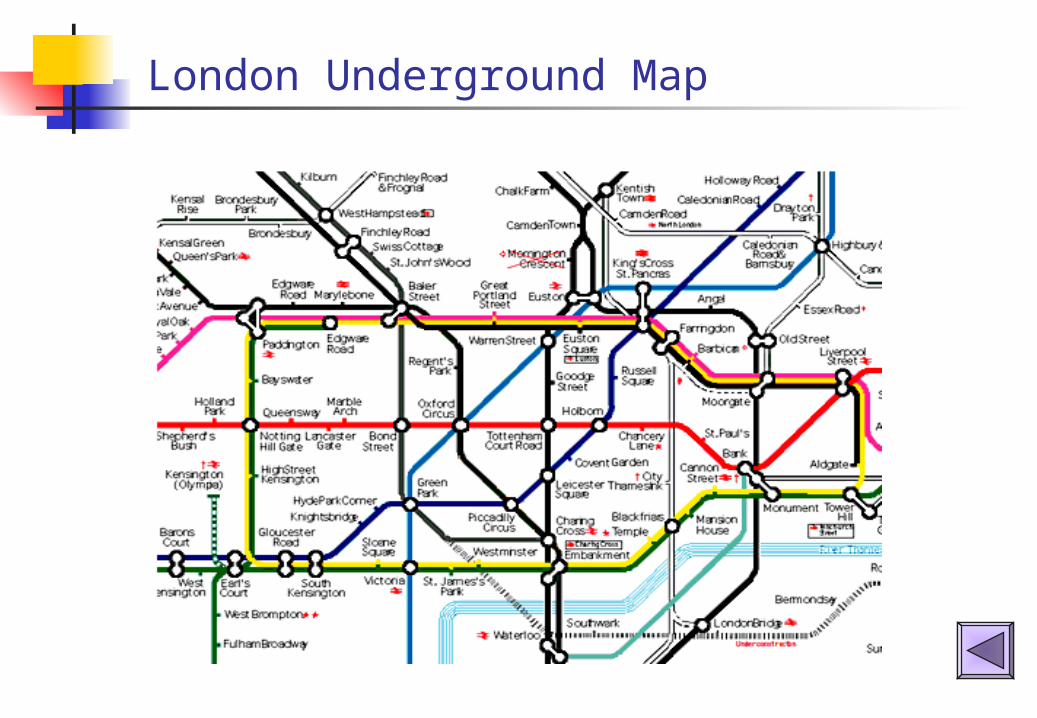
London Underground Map
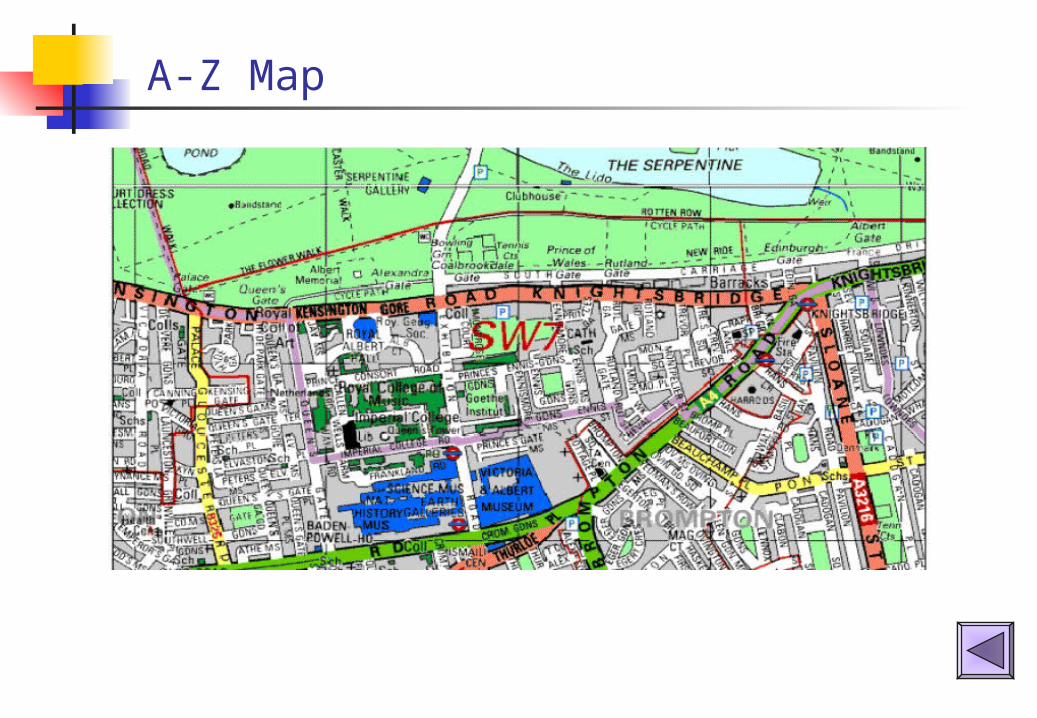
A-Z Map
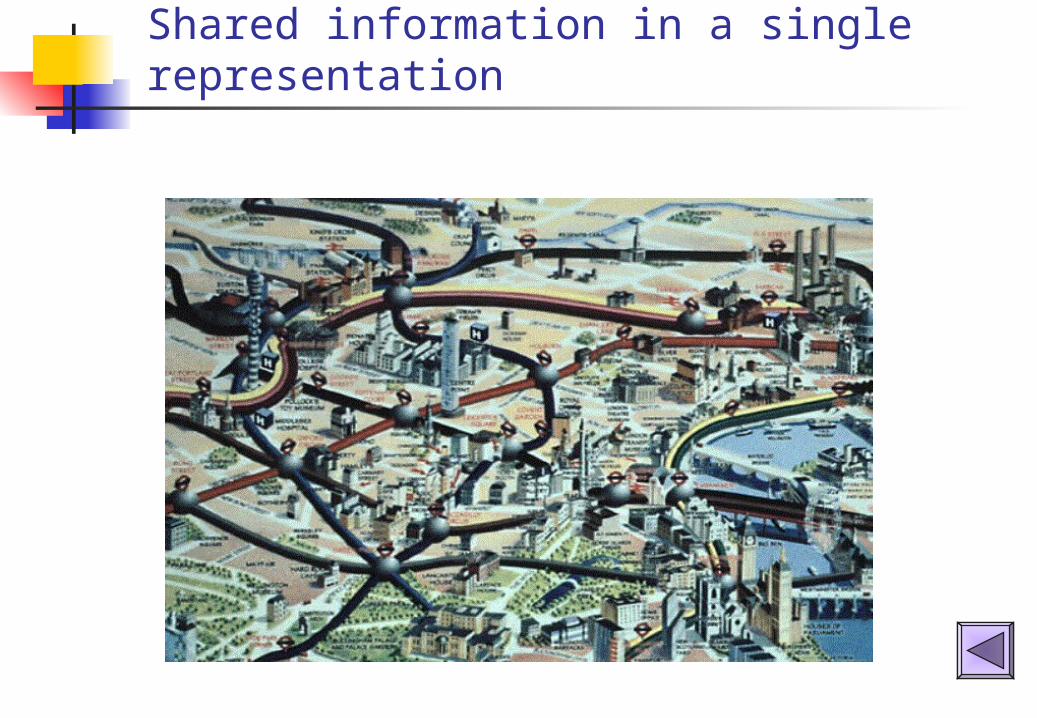
Shared information in a single representation
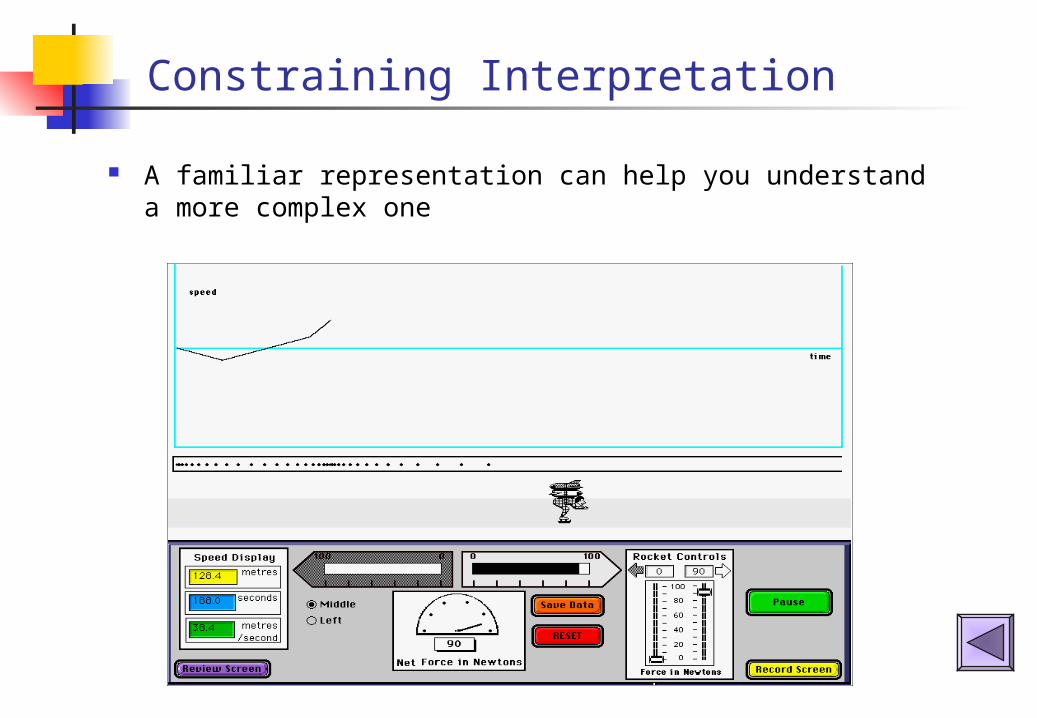
Constraining Interpretation
A familiar representation can help you understand a more complex one
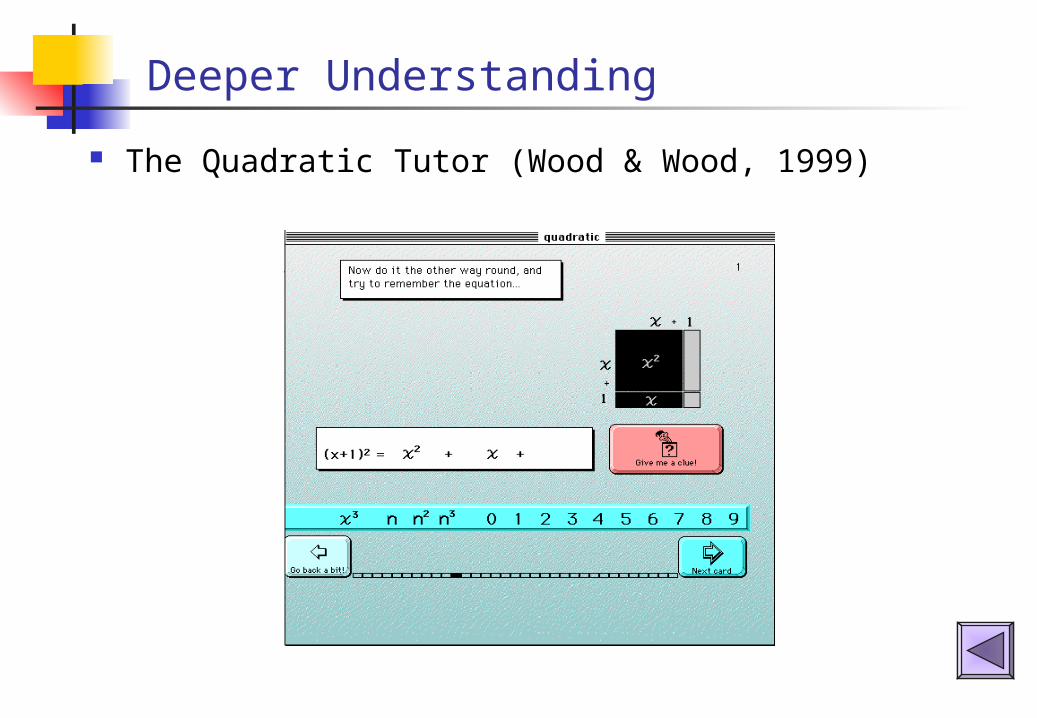
Deeper Understanding
The Quadratic Tutor (Wood & Wood, 1999)
Spatial Contiguity
When corresponding words and pictures are near each other
Students who read a text explaining how tire pumps work with captioned illustrations generated about 75% more useful solutions on transfer questions than did students who read the same text and illustrations presented on separate pages (Mayer, 1989)
Corresponding words and pictures must be in working memory at the same time in order to facilitate the construction of referential links between them.

Modality
From animation & narration than animation & on-screen text.
Students who viewed a lightening animation with a narration generated 50% more useful solutions on a transfer test than the same animation with on-screen text (Mayer & Moreno, 1998).
On-screen text and animation overload the visual system whereas narration is processed in the verbal information processing system and animation is processed in the visual information processing system.

Coherence
When extraneous information is excluded Moreno & Mayer (2000) gave students a lightening animation
with concurrent narration, or extra environmental sounds or with extra music, or all three.
Music tended to hurt students' understanding but environmental sounds did not hurt
Overload was created by adding unnecessary auditory material & so fewer relevant words and sounds entered the cognitive system & fewer cognitive resources was allocated to building connections amongst them.

Redundancy
From animation and narration than from animation, narration, and on-screen text.
Additional text harmed learners performance on transfer problems as this induced a split-attention effect

Individual Differences
Effects are stronger for low-knowledge learners than for high-knowledge and for high spatial rather than from low spatial learners.
Students with high prior knowledge may be able to generate their own mental images while listening to an animation or reading a verbal text so having a contiguous visual presentation is not needed.
Students with high spatial ability are able to hold the visual image in visual working memory and thus are more likely to benefit from contiguous presentation of words and pictures.