Inter-Domain Traffic Estimation for the...
14
Inter-Domain Traffic Estimation for the Outsider Mario A. Sanchez † Fabian E. Bustamante † Balachander Krishnamurthy ‡ Walter Willinger ? Georgios Smaragdakis ◦ Jeffrey Erman ‡ † Northwestern University ‡ AT&T Labs Research ? Niksun, Inc. ◦ MIT / TU Berlin ABSTRACT Characterizing the flow of Internet traffic is important in a wide range of contexts, from network engineering and application design to understanding the network impact of consumer demand and business relationships. Despite the growing interest, the nearly impossible task of col- lecting large-scale, Internet-wide traffic data has severely constrained the focus of traffic-related studies. In this paper, we introduce a novel approach to character- ize inter-domain traffic by reusing large, publicly available traceroute datasets. Our approach builds on a simple insight – the popularity of a route on the Internet can serve as an informative proxy for the volume of traffic it carries. It ap- plies structural analysis to a dual-representation of the AS- level connectivity graph derived from available traceroute datasets. Drawing analogies with city grids and traffic, it adapts data transformations and metrics of route popularity from urban planning to serve as proxies for traffic volume. We call this approach Network Syntax, highlighting the connection to urban planning Space Syntax. We apply Network Syntax in the context of a global ISP and a large Internet eXchange Point and use ground-truth data to demonstrate the strong correlation (r 2 values of up to 0.9) between inter-domain traffic volume and the different proxy metrics. Working with these two network entities, we show the potential of Network Syntax for identifying critical links and inferring missing traffic matrix measurements. Categories and Subject Descriptors C.2.5 [Communication Networks]: Local and Wide- Area Networks—Internet ; C.4 [Performance of Systems]: Measurement techniques. General Terms Measurement, Traffic. Permission to make digital or hard copies of all or part of this work for personal or classroom use is granted without fee provided that copies are not made or distributed for profit or commercial advantage and that copies bear this notice and the full citation on the first page. Copyrights for components of this work owned by others than ACM must be honored. Abstracting with credit is permitted. To copy otherwise, or republish, to post on servers or to redistribute to lists, requires prior specific permission and/or a fee. Request permissions from [email protected]. IMC’14, November 5–7, 2014, Vancouver, BC, Canada. Copyright is held by the owner/author(s). Publication rights licensed to ACM. 978-1- 4503-3213-2/14/11 ...$15.00. http://dx.doi.org/10.1145/2663716.2663740. Keywords Traceroute, Inter-domain traffic, AS-level path. 1. INTRODUCTION Studies on the Internet inter-domain system have focused on network connectivity and dynamics and have ranged from exploring techniques to measure and generate AS-level graphs [10, 17, 48] to examining the properties of topology snapshots [23, 40]. There is, however, a growing consensus on the need to shift focus beyond connectivity towards understanding Internet traffic. Knowledge of inter-domain traffic characteristics is im- portant in a number of different contexts, from capacity planning to anomaly detection, and performance analysis. The major impediment to Internet traffic research has been the scarcity of publicly available traffic data. Researchers have typically had to choose between fine-grained data on a small slice of the network [7,11,14,33], or publicly available, but coarse-grained and sparse datasets [13]. While detailed studies of important network entities such as Internet eXchange Points (IXPs) [7] and Content Providers [6] can improve our understanding of the inter-domain traffic, en- listing the cooperation of Internet Service Providers (ISPs), Content Providers or IXPs requires personal connections and are thus hard to replicate or scale. On the other hand, analysis of individual networks for which traffic data is available, seriously limits researchers to a handful entities. In this paper, we introduce a novel approach to char- acterize inter-domain traffic by reusing the many publicly available traceroute datasets. Our key observation is that the popularity of a route on the Internet can serve as an informative proxy for the volume of traffic it carries. While traceroute measurements allow us to draw the paths taken by packets when traversing the Internet, the routes identified by a large number of traceroutes can be used to infer the popularity of a path. Building on this observation, we introduce a new abstrac- tion of AS-level path and apply structural analysis to a dual- representation of the AS-level connectivity graph, derived from traceroute datasets. Drawing analogies with city grids and traffic, we adapt metrics of route popularity from urban planning to serve as proxies for network traffic. We call this approach Network Syntax, highlighting the connection to Space Syntax [26, 41], an urban-planning graph-based approach to study human and vehicular flows by leveraging the strong correlation between traffic and the morphological property of streets. Network Syntax (as the related Space Syntax) builds on known abstractions and techniques from
Transcript of Inter-Domain Traffic Estimation for the...

Inter-Domain Traffic Estimation for the Outsider
Mario A. Sanchez† Fabian E. Bustamante† Balachander Krishnamurthy‡Walter Willinger? Georgios Smaragdakis◦ Jeffrey Erman‡
†Northwestern University ‡AT&T Labs Research ?Niksun, Inc. ◦MIT / TU Berlin
ABSTRACTCharacterizing the flow of Internet traffic is important ina wide range of contexts, from network engineering andapplication design to understanding the network impactof consumer demand and business relationships. Despitethe growing interest, the nearly impossible task of col-lecting large-scale, Internet-wide traffic data has severelyconstrained the focus of traffic-related studies.
In this paper, we introduce a novel approach to character-ize inter-domain traffic by reusing large, publicly availabletraceroute datasets. Our approach builds on a simple insight– the popularity of a route on the Internet can serve as aninformative proxy for the volume of traffic it carries. It ap-plies structural analysis to a dual-representation of the AS-level connectivity graph derived from available traceroutedatasets. Drawing analogies with city grids and traffic, itadapts data transformations and metrics of route popularityfrom urban planning to serve as proxies for traffic volume.We call this approach Network Syntax, highlighting theconnection to urban planning Space Syntax. We applyNetwork Syntax in the context of a global ISP and alarge Internet eXchange Point and use ground-truth datato demonstrate the strong correlation (r2 values of up to0.9) between inter-domain traffic volume and the differentproxy metrics. Working with these two network entities, weshow the potential of Network Syntax for identifying criticallinks and inferring missing traffic matrix measurements.
Categories and Subject DescriptorsC.2.5 [Communication Networks]: Local and Wide-Area Networks—Internet ; C.4 [Performance of Systems]:Measurement techniques.
General TermsMeasurement, Traffic.
Permission to make digital or hard copies of all or part of this work for personal orclassroom use is granted without fee provided that copies are not made or distributedfor profit or commercial advantage and that copies bear this notice and the full citationon the first page. Copyrights for components of this work owned by others thanACM must be honored. Abstracting with credit is permitted. To copy otherwise, orrepublish, to post on servers or to redistribute to lists, requires prior specific permissionand/or a fee. Request permissions from [email protected]’14, November 5–7, 2014, Vancouver, BC, Canada.Copyright is held by the owner/author(s). Publication rights licensed to ACM. 978-1-4503-3213-2/14/11 ...$15.00.http://dx.doi.org/10.1145/2663716.2663740.
KeywordsTraceroute, Inter-domain traffic, AS-level path.
1. INTRODUCTIONStudies on the Internet inter-domain system have focused
on network connectivity and dynamics and have rangedfrom exploring techniques to measure and generate AS-levelgraphs [10, 17, 48] to examining the properties of topologysnapshots [23, 40]. There is, however, a growing consensuson the need to shift focus beyond connectivity towardsunderstanding Internet traffic.
Knowledge of inter-domain traffic characteristics is im-portant in a number of different contexts, from capacityplanning to anomaly detection, and performance analysis.The major impediment to Internet traffic research has beenthe scarcity of publicly available traffic data. Researchershave typically had to choose between fine-grained data on asmall slice of the network [7,11,14,33], or publicly available,but coarse-grained and sparse datasets [13]. While detailedstudies of important network entities such as InterneteXchange Points (IXPs) [7] and Content Providers [6] canimprove our understanding of the inter-domain traffic, en-listing the cooperation of Internet Service Providers (ISPs),Content Providers or IXPs requires personal connectionsand are thus hard to replicate or scale. On the otherhand, analysis of individual networks for which traffic datais available, seriously limits researchers to a handful entities.
In this paper, we introduce a novel approach to char-acterize inter-domain traffic by reusing the many publiclyavailable traceroute datasets. Our key observation is thatthe popularity of a route on the Internet can serve as aninformative proxy for the volume of traffic it carries. Whiletraceroute measurements allow us to draw the paths takenby packets when traversing the Internet, the routes identifiedby a large number of traceroutes can be used to infer thepopularity of a path.
Building on this observation, we introduce a new abstrac-tion of AS-level path and apply structural analysis to a dual-representation of the AS-level connectivity graph, derivedfrom traceroute datasets. Drawing analogies with city gridsand traffic, we adapt metrics of route popularity from urbanplanning to serve as proxies for network traffic. We callthis approach Network Syntax, highlighting the connectionto Space Syntax [26, 41], an urban-planning graph-basedapproach to study human and vehicular flows by leveragingthe strong correlation between traffic and the morphologicalproperty of streets. Network Syntax (as the related SpaceSyntax) builds on known abstractions and techniques from

graph theory, and adapts them to our problem domain toderive new insights on inter-domain traffic from traceroutedata.
We leverage publicly available traceroute datasets andapply Network Syntax in the context of a global ISP anda large Internet eXchange Point (IXP).1 To the best of ourknowledge, our work is the first to point out and capitalizeon the strong correlation between Internet route popularityand the volume of traffic it carries, showing how thispopularity can be derived from easy-to-perform traceroutecampaigns and available datasets. In this context, wepresent:
• An approach, Network Syntax, that leverages tracer-oute datasets to tackle a problem that can currentlyonly be studied by a few researchers with access toproprietary data.• A demonstration of the strong correlations between
inter-domain traffic volumes and the different NetworkSyntax metrics applied to traceroute-based AS-levelconnectivity graphs (and, in contrast, the weak corre-lations that result from applying them to BGP-derivedconnectivity graphs).• An analysis of the robustness of Network Syntax to
inherent idiosyncrasies of the underlying traceroutedata (e.g., IP alias resolution problem and inabilityto trace through layer 2 clouds) and the particularsof the measurement platform used (e.g., number andnetwork location of the vantage points).• An illustration of the potential of Network Syntax with
two use cases – the prediction of missing traffic linkvolumes in a connectivity graph, and the ranking ofAS-links based on traffic volume.
For validation we rely on traffic ground-truth data from anISP and an IXP; the fact that, as in most Internet studies,we cannot reveal the sources or share this data, furthermotivates our approach.
2. BACKGROUNDThere is a large body of work focused on generating,
modeling and analyzing the inter-domain topology. Theseinclude efforts that examine graph properties of the AStopology as a logical construct [19, 23, 40], techniques tomeasure and infer AS-level connectivity [10, 17, 48], ap-proaches to model and characterize the Internet topol-ogy [40], or concentrate on the IXP substrate and itstopological importance [8, 48]. Other efforts have usedtraceroute measurements to augment intra-domain router-level ISP maps by deriving OSPF link weights that areconsistent with routing [35].
Beyond topology, inter-domain traffic has been an activeresearch topic given its importance in a wide range ofcontexts, from network engineering to application design.However, while some research projects have made selectednetwork traffic traces available to vetted researchers [45],the nearly impossible task of collecting large-scale, Internet-wide traffic data has seriously restricted the focus of traffic-related studies. Previous efforts have thus investigatedtraffic estimation and characterization (e.g., [6,22,38,42,46]),but have to rely on close collaboration with ISPs, content
1We are making our own traceroute dataset and NetworkSyntax scripts publicly available.
providers or IXPs [16, 20–22, 33] to gain access to thenecessary traffic data or be limited by the coarse-grainednature of publicly available datasets [13].
Some related efforts have explored techniques and method-ologies for inferring traffic matrix elements that are eithernot directly measurable [11,24] or missing [38,50–52]. Whatdistinguishes our approach from these methods is theirreliance, in one way or another, on link measurementsobtained from either proprietary data or publicly availabletraffic measurements.2
3. NETWORK SYNTAXIn this section we expand on our descriptions of Network
Syntax, its methodology and metrics. Network Syntaxapplies structural analysis to a dual-representation of theAS-level connectivity graph, derived from publicly availabletraceroute datasets, and uses different metrics to capturethe popularity of a network path as a proxy for the volumeof traffic it carries.
Drawing analogies with city grids and traffic, our approachadapts metrics of route popularity from urban planning’sSpace Syntax [26,41] for the analysis of inter-domain traffic.The following paragraphs presents a short overview of SpaceSyntax. We refer the reader to Hillier et al. [26] for a morein-depth description.
3.1 Space Syntax OverviewSpace Syntax is a configurational analysis methodology
first introduced in 1984 [25] for predicting pedestrian move-ment in urban settings based on an analysis of the urbangrid. The key observation behind Space Syntax is that theconfiguration of space is the driving force behind how citiesoperate. Over the years, this observation has been leveragedto draw correlations between topological accessibility ofspaces and urban features: from pedestrian and vehicularflows to land use, and the geographic distribution of varioustypes of crime [27].
In Space Syntax, cities are represented as “axial maps”and then transformed into graphs. Axial maps of cities areobtained by drawing the smallest number of straight lines(called axial lines) that pass through all open spaces. Thesemaps are then transformed into graphs by representing theaxial lines as nodes and interconnecting the nodes thatintersect in the map. This dual representation of thegraph, where nodes are streets and edges are intersections,focuses on the connectivity of the streets irrespective of theirwidth, length and location, and enables the identification ofconcrete metrics for each street. The centrality of a streetor space in this graph is an indication of its importance inthe city operation. Figure 1 shows an example of such atransformation.
Space Syntax introduces four core syntactic metrics,three of which can be mapped to an equivalent graph-theory metric but described using its own terminology. (1)Connectivity – also known as degree centrality in graphtheory – is the simplest metric for assessing ranking ofnodes within a connectivity graph, it equals the numberof directly linked or neighboring nodes. A closely relatedmetric (2) Control value measures the degree to which spacecontrols access to its immediate neighbors by taking intoaccount the number of alternative connections that each of
2From networks such as Internet2 or GEANT.

Figure 1: A sample urban system (a), its axial map (b) andconnectivity graph (c).
these neighbors has [31]. It is calculated by summing thereciprocals of connectivities between neighbors. This metriccan be linked to clustering coefficient in graph analysis.(3) Global choice – also known as betweenness centralityin graph theory – captures how often each line is usedon topologically shortest paths from all lines to all otherlines in the system. Finally, (4) Integration – a type ofnormalized closeness centrality metric in graph analysis –measures the mean distance between every segment and allother segments in the system [32]. The more integratedsegments are those that are closest on average to all othersegments, while the more segregated segments are thosethat are furthest on average from all other segments. Manyempirical studies have shown that the integration metric isaccurate in determining which segments are favored by theconfiguration [26,32].
3.2 Network SyntaxWe argue that the construction of AS-level connectivity
graphs as carved out by probes of large traceroute campaignscontain valuable information that can be leveraged throughthe use of similar metrics to those of Space Syntax. Carefullyvetted traceroute measurements allow us to derive partialAS-level connectivity graphs that highlight the actual routestraversed by data packets. Given that the popularityof a route on the Internet can serve as an informativeproxy for the volume of traffic it carries, we argue thatby concentrating on all the AS-level paths that traversea specific AS, the application of graph structural metricscan help us identify the popular links connected to thosenetworks.
We would not expect, however, that the direct applicationof these metrics to just any undirected AS-level graph of theInternet (such as one derived from BGP data) would yieldsimilar results. Indeed, as we show in Section 7.1, usinga non-uniform line representation of AS-level connectivityand analyzing it by measures that are essentially topologicalignores too much contextual information to be useful.The mere direct connectivity between two ASes says littleabout the utilization of those links for carrying trafficbetween different parts of the Internet, especially whenmany important deciding factors such as routing policy areignored. After all, as has been pointed out, there are dangersin taking available data at face value while ignoring domain-specific context [47].
3.3 Connectivity Graphs and MetricsAt a high-level, Network Syntax metrics are applied to
connectivity graphs generated for specific ASes by extractingthe set of AS-level paths present in a traceroute dataset thattraverse each individual AS. Each of the different AS-level
Figure 2: Dual representation of a partial AS-levelconnectivity graph. Each AS-link is represented by node,while the intersection between AS-links (the AutonomousSystems they interconnect) are represented as edges.
paths is broken down into pairs of hops which represent alink between those ASes. The connectivity graph is gener-ated by adopting a dual representation where each AS-linkis transformed into a node, while the intersection betweenAS-links (the Autonomous Systems they interconnect) arerepresented as edges. Figure 2 shows a connectivity graphfor a subset of important AS-links.
Metrics. The different metrics take a specific meaningin the context of the dual representation of the AS-levelconnectivity-graph.
Connectivity. In this context, captures the number ofdifferent AS-links that precede or succeed each AS-link inthe graph. A high connectivity indirectly captures thediversity of the different end-to-end AS-level paths thattraverse the link.
Control value of an AS-link is defined as the sum ofthe reciprocal of its neighbors’ connectivity. Similar toconnectivity, it captures the diversity of the AS-level pathsthat traverse the AS-link by considering the different AS-links that precede or follow its directly connected links.
Global choice measures the popularity of a link by lookingat how likely it is to be passed through on all shortest pathsfrom all other AS-links in the network. Important links willlie on a high proportion of paths between other AS-links inthe network.
Integration attempts to capture link popularity by lookingat the average distance from each AS-link to every other AS-link in the connectivity graph. Using this metric, importantlinks are identified as those that are typically “close” (onaverage) to other AS-links in the network.
ALTP-frequency. In our context, the popularity of an AS-link can also be captured by the number of different end-to-end AS-level paths (discovered by the probes of a traceroutecampaign) that traverse the particular link. That is, thefrequency of AS-link Traversing Paths, or ALTP-frequency.This metric is specific to Network Syntax and seems to haveno obvious or commonly known parallel in either graphtheory or Space Syntax. We describe how to computeALTP-frequency in Section 4.3.

Dataset Unique VPs Src ASes Dst ASes Probes
Ono 2011 116,978 2,095 12,010 12.9MOno 2013 51,884 1,351 12,592 13.8M
Table 1: Number of unique vantage points, unique sourceASes and probes for each resulting dataset after applyingthe different heuristics described in Section 4.2.
4. FROM NETWORK SYNTAX TO INTER-DOMAIN TRAFFIC
In this section, we start with a description of our datasets:a collection of traceroutes launched from topologically di-verse vantage points and the traffic datasets we rely on forground truth. We describe then how we leverage the AS-level paths gathered by the probes of traceroute datasets toderive a connectivity graph upon which core Network Syntaxmetrics can be applied.
4.1 DatasetsWe evaluate Network Syntax using a traceroute dataset
and traffic data, our ground-truth, from two large networkentities: a large European IXP and a global ISP.
Traceroutes. Our traceroute datasets consist of datacollected in two difference campaigns by topologically di-verse vantage points. It contains the probes launchedtowards randomly selected IP addresses from the OnoBitTorrent extension [18]. Ono peers perform measurementsto randomly selected destinations from the set of connectionsestablished through BitTorrent. The datasets consist of allthe measurements gathered between two 30-day periods intwo different years – April 1 to 30, 2011 and April 1 to 30,2013. Table 1 shows a summary of both datasets. The firstone consists of ≈12.9 million probes launched by 116,978distinct vantage points located in 2,143 unique ASes. Thesecond dataset includes ≈13.8 million probes launched from51,884 different vantage points located in 1,351 differentnetworks.
Traffic. To validate our approach, we perform our analysisin the context of a large European IXP (IXP ) and aglobal Tier-1 Internet Service Provider (ISP ). Ground-truth traffic data for IXP consists of sFlow [30] records,collected over 1-week periods in April 2011 and April 2013,capturing the traffic exchanged over the public peering fabricof the IXP. Using a random sampling of 1/16K packets, theresulting traffic matrix contains the estimated number ofbytes exchanged between pairs of ASes peering at the IXP.This detailed information allows us to rank the peeringsbased on the volume of (bi-directional) traffic they exchange.
The ground-truth data for ISP consists of the trafficexchanged between the ISP and all its customer ASes.The data contains per-customer link utilization from SNMPrecords for April 2011 and April 2013, and includes the 95thpercentile utilization during the course of the month of thehourly port utilizations. Traffic data is summarized on aper-customer basis using link aggregation across differentphysical interfaces for customers with multiple links.
4.2 MethodologyWe generate the partial connectivity graph for a particular
ASX from the total set of AS-level paths that include ASX,i.e., paths that include AS-level links that connect to ASX.
This traceroute-derived AS-level graph is “partial” in that itdoes not capture the complete connectivity graph. Since anAS-level path is a sequence of AS-level links, we call suchAS-level paths ALTPs, for AS-link Traversing Paths.
The following paragraphs formally define ALTPs anddescribe how they are extracted from traceroute datasetsand how they are used to generate a partial connectivitygraph.
Figure 3: Two instances of AS-link TraversingPath ALTP (5, 6): 〈as1, as2, as3, AS5, AS6, as8〉,〈as4, AS5, AS6, as7〉
AS-link Traversing Paths (ALTPs). Formally, an AS-level path can be defined as a sequence of unique AS-levellinks, each connecting a pair of ASes. We denote an AS-level path as 〈as1, as2, ..., ask〉. We define an ALTP (x, y)as an AS-level path that traverses the AS-link 〈x, y〉, i.e.,〈as1, ..., x, y, ..., ask〉. Note that 〈as1, ..., x, y, ..., ask〉 and〈ask, ..., y, x, ..., as1〉 are considered two different ALTPs.Figure 3 shows an example of such a path. The ALTPabstraction is directly applicable to paths that traverse anIXP whose presence is identified by the prefix assigned bythe responsible Internet Registry. The set of all uniqueALTPs found in a dataset that traverse a specific AS-link iscalled the ALTP-set of that link.
From probes to AS-level paths. We extract AS-levelpaths from different traceroute datasets using public IP-to-AS mapping and correcting for inconsistencies with BGPinformation [17]. For paths that traverse an IXP, wefollow [10] to assign confidence levels to the discovered IXP-peerings.
We first prune our dataset by eliminating loops and cyclesand filtering private and reserved IP ranges and remove theassociated hops if they appear at the ends of the probe. Weconvert IP-level to AS-level paths using the AS mappingderived from publicly available BGP information. From thederived set we then conservatively remove any probes withunknown AS-hops in the path, probes for which the sourceor destination AS cannot be mapped3, and probes for whichthe final AS-level path is too short (probes within the sameAS).
We then apply known heuristics [17] to correct the set ofAS-level paths, but preserving the IP addresses belonging toknown IXP hops. IXP mapping requires a complete list ofprefixes assigned to the different IXPs and the list of theirAS members which we obtain from centralized databaseslike PCH [2], PeeringDb [3] and EuroIX [1], and websitesmaintained by the IXPs themselves. We remove obsolete
3Since the removed links appear only in the discarded paths,they are not popular and their removal has no impact on ourfindings.

records (inactive IXPs) and match IXPs with differentnames that represent the same entity. We assign confidencelevels to the discovered IXP peerings following the approachin [10] labeling as high-confidence those peerings for whichwe have probes traversing the peering in both directionsor those for which the ASes at both sides of the peeringhave been identified as members of the IXP from BGP datacollected at the IXP. For our analysis we consider only thesehigh-confidence peerings.
AS-Link connectivity graphs. To generate the connec-tivity graph for the various Autonomous Systems we extractthe set of ALTPs present in the dataset that traverse linksconnected to each specific AS. As described in Section 3.2,each different ALTP is broken down into pairs of hops whichrepresent a link between those ASes, and a dual-connectivitygraph is generated where each AS-link is transformed into anode, while the intersection between links (the AutonomousSystems they interconnect) are represented as edges.
4.3 Computing ALTP-frequencyHaving introduced partial connectivity graphs and for-
mally defined ALTPs, we can now describe how to computethe Network Syntax ALTP-frequency metric. Using thederived set of AS-level paths, we compute the ALTP-setsfor all the AS-links of interest found in those paths.
The relative cardinality of the ALTP-set of an AS-link, ina set S, is the cardinality of its ALTP-set divided by thesum of the cardinalities of the ALTP-sets of every AS-linkin S. This relative cardinality is what we refer to as ALTP-frequency.
5. EVALUATIONIn this section, we apply the approach outlined in Sec-
tions 3 and 4 to the links of IXP and ISP present in our2011 and 2013 traceroute datasets, we then analyze the rela-tion between the different Network Syntax metrics and thelinks’ traffic volumes. Note that the idea of route popularityapplies equally well to physical and logical AS-links betweenASes. As a result, the Network Syntax approach can beapplied in both our IXP and ISP scenarios for which theavailable measurements provide ground truth about traffictraversing physical and logical AS-links, respectively.
In our analysis, we rely on a number of statistical tech-niques that assume normally distributed variables. However,as we show next, this assumption does not necessarilyhold for all the variables we are interested in. A well-known remedy for failure of normality expected by manyparametric tests [9, 28, 44] is to apply appropriately-chosentransformations. In our analysis, whenever necessary, weuse the most appropriate transformation for the differentvariables.
5.1 Traffic distributionWe first look at the traffic distribution for the subset of
AS-links discovered by the different traceroute campaignsfor both ISP and IXP . We extract from the correspondingtraffic matrix (derived from the ground-truth traffic data)the amount of traffic each link carries, and generate ahistogram of their traffic distribution. Figure 4 shows thishistogram for the links of IXP discovered by the April 2011traceroute campaign. As it is clear from the figure, the links’traffic follows a power-law distribution with several heaviest
0.00 0.01 0.02 0.03 0.04 0.05Normalized Traffic (bytes/max)
0
50
100
150
200
250
300
350
400
450
Cou
nt
Figure 4: Distribution of traffic for all peerings in trafficmatrix for IXP , April 2011.
102 103
Normalized Traffic (base 103)
10−9
10−8
10−7
10−6
10−5
10−4
10−3
10−2
10−1
100
p(X
)
Normalized Trafficexponential fitlog-normal fit
Figure 5: Comparing the goodness of fit of normalizedtraffic (blue line) with log-normal distribution. Dashedgreen line: log-normal fit starting from the optimalxmin=23.41, alpha=2.1. Dashed red line: exponentialfit starting from the same xmin.
0.0 0.2 0.4 0.6 0.8 1.0Fraction of AS-links
0.0
0.2
0.4
0.6
0.8
1.0
Cum
ulat
ive
Frac
tion
ofTr
affic
IXP - Apr2013ISP - Apr2013IXP - Apr2011ISP - Apr2011
Figure 6: Complimentary CDF of the cumulative fractionof traffic for all AS-links of ISP and IXP discovered by ourtraceroute datasets.
links carrying most of the traffic and the majority of thelinks carrying very little traffic.
Figure 5 shows the goodness of fit statistical confirmationthat indeed the distribution of per-peering traffic (showedin blue) follows a log-normal distribution (represented bythe dashed-green line), which is consistent with the pre-viously observed property of intra-domain traffic matrixsnapshots [13,39].
We observe similar distributions in the traffic carriedby the links discovered by our April 2011 and April 2013traceroute datasets for both ISP and IXP . This can be

0 50 100 150 200 250 300 350 400 450(Traffic)1/4
0.000
0.002
0.004
0.006
0.008
0.010C
ount
µ = 99.288, σ = 51.732
(a) Traffic
0.05 0.10 0.15 0.20 0.25 0.30(Connectivity)1/4
0
5
10
15
20
25
30
Cou
nt
µ = 0.124, σ = 0.033
(b) Connectivity
−2.5 −2.0 −1.5 −1.0 −0.5 0.0 0.5 1.0 1.5 2.0log10(ControlValue)
0.0
0.1
0.2
0.3
0.4
0.5
0.6
Cou
nt
µ =−0.778, σ = 0.714
(c) Control Value
0.00 0.05 0.10 0.15 0.20 0.25 0.30 0.35 0.40(Global Choice)1/4
0123456789
Cou
nt
µ = 0.115, σ = 0.051
(d) Global Choice
0 1 2 3 4 5 6 7 8 9Radius 2 Integration
0.00
0.05
0.10
0.15
0.20
0.25
0.30
0.35
0.40
Cou
nt
µ = 3.922, σ = 1.320
(e) Integration
1.0 1.5 2.0 2.5 3.0 3.5 4.0 4.5 5.0(ALTP-frequency)1/4
0.0
0.5
1.0
1.5
2.0
2.5
Cou
nt
µ = 1.352, σ = 0.444
(f) ALTP-frequency
Figure 7: Distribution of the transformed different metrics and traffic volume for all AS-links discovered in the April 2011traceroute datasets for IXP . Similar distributions are observed for the other datasets and the two studied network entities.
seen in Figure 6, the complimentary CDF of the cumulativefraction of traffic for all the discovered AS-links. In allcases, a small fraction of the links carries the majority ofthe traffic. To approximate normality in the cases where thedependent variable denotes traffic volume, we use the fourthroot transformation for its highly skewed distribution (seeFigure 7a).
5.2 Network Syntax analysisWe start by selecting, from our traceroute datasets, the
ALTP-sets for all relevant AS-links that traverse IXP andISP . We generate separate AS-link connectivity graphsfor each dataset and compute the different Network Syntaxmetrics for each link present in the graph. Finally weplot each AS-link against the volume of traffic it carries asindicated by our traffic matrix.
To reduce the potential noise on the correlations intro-duced by particular AS-links (e.g., due to sampling issues),we use the different metrics to order AS-links, breaking tiesbased on connectivity, and cluster them in equal sized groupsof ten links 4. For each group, we compute its value for boththe relative corresponding metric and carried traffic, as theaverage of the individual values of the AS-links within thegroup.
The different Network Syntax metrics present varieddistributions. As shown in Figure 7e, the integrationmetric is already close to normal and is used withouttransformation. Furthermore, while the control metric(Figure 7c) is approximately normalized with the help ofa logarithmic transformation, for the rest of the metrics, weachieve the desired approximate normality using the fourthroot transformation (see Figures 7b, 7d and 7f). Havingtransformed the distributions of the dependent (i.e., trafficvolume) as well as independent variables, we can study
4Different clusters sizes yield similar trends.
the relationships between traffic volume and the differentNetwork Syntax metrics.
Figures 8 to 11 show the correlations between the fiveNetwork Syntax metrics and traffic volume for the links ofISP and IXP found in our traceroute datasets. The figuresare presented side by side to facilitate horizontal and verticalcomparisons between metrics and across datasets.
ALTP-frequency and connectivity have the strongest cor-relation coefficients, with the integration metric having theweakest one of all. The correlation with ALTP-frequencyhas r2 values as high as 0.95 (ISP in April 2013) with thelowest value at 0.71 (for IXP in April 2013). We arguethat this strong correlation comes from the fact that ALTP-frequency more directly captures the popularity of the high-traffic links.
The connectivity metric shows consistently strong correla-tions as well, with r2 values ranging between 0.61 (for IXPApril 2011) to 0.95 (for ISP April 2013). Recall that thismetric captures the degree of each node in the connectivity-graph which correspond to a different AS-link in our dualrepresentation of the AS-level connectivity-graph. As such,a large connectivity value captures the number of differentAS-links that precede or succeeds it on the ALTPs identified.The connectivity metric, then, captures the diversity of theALTPs that traverse through the link; it indirectly capturesthe ALTP-frequency of the link.
The correlation between traffic volume and the controlvalue metric, while still strong, is comparably lower witha minimum r2 value of 0.52 (for IXP April 2013) and amaximum value of 0.76 (for ISP April 2011). Althoughthis metric is based on the connectivity values of a link’sneighbors, it can overestimate the popularity of an AS-link given that the high connectivity of a neighbor can bepartially due to AS-links traversed by paths that never crossthe link in question.
The integration metric highlights the AS-links that havethe shortest average path to every other AS-link in the

0.05 0.10 0.15 0.20 0.25 0.30(Connectivity)1/4
0
50
100
150
200
250
300(T
raffi
c)1/
4r = 0.854, r2 = 0.729
(a) Connectivity
−3 −2 −1 0 1 2log10(ControlValue)
0
50
100
150
200
250
300
(Tra
ffic)
1/4
r = 0.828, r2 = 0.685
(b) Control Value
0.0 0.1 0.2 0.3 0.4(Global Choice)1/4
0
50
100
150
200
250
300
350
(Tra
ffic)
1/4
r = 0.813, r2 = 0.661
(c) Global Choice
−2 0 2 4 6 8 10Radius 2 Integration
0
50
100
150
200
250
300
(Tra
ffic)
1/4
r = 0.758, r2 = 0.575
(d) Integration
0 1 2 3 4 5(ALTP-frequency)1/4
0
50
100
150
200
250
300
(Tra
ffic)
1/4
r = 0.894, r2 = 0.799
(e) ALTP-frequency
Figure 8: Correlation between connectivity, control value, global choice, local integration metric (integration radius 2) andALTP-frequency with traffic volume for IXP for April 2011.
0.05 0.10 0.15 0.20 0.25 0.30(Connectivity)1/4
0
50
100
150
200
250
300
(Tra
ffic)
1/4
r = 0.785, r2 = 0.617
(a) Connectivity
−3 −2 −1 0 1 2log10(ControlValue)
0
50
100
150
200
250
300
(Tra
ffic)
1/4
r = 0.722, r2 = 0.521
(b) Control Value
0.00 0.05 0.10 0.15 0.20 0.25 0.30 0.35(Global Choice)1/4
0
50
100
150
200
250
300
(Tra
ffic)
1/4
r = 0.762, r2 = 0.580
(c) Global Choice
−2 0 2 4 6 8Radius 2 Integration
0
50
100
150
200
250
300
(Tra
ffic)
1/4
r = 0.597, r2 = 0.356
(d) Integration
0.5 1.0 1.5 2.0 2.5 3.0 3.5(ALTP-frequency)1/4
0
50
100
150
200
250
300
(Tra
ffic)
1/4
r = 0.845, r2 = 0.713
(e) ALTP-frequency
Figure 9: Correlation between connectivity, control value, global choice, local integration metric (integration radius 2) andALTP-frequency with traffic volume for IXP for April 2013.
IXP ISPApr 2011 Apr 2013 Apr 2011 Apr 2013
Connectivity 0.729 0.617 0.789 0.954Control Value 0.685 0.521 0.759 0.750Global Choice 0.661 0.580 0.653 0.903Integration 0.575 0.356 0.826 0.629ALTP-freq 0.799 0.713 0.965 0.958
Table 2: r2 values of the different metrics for ISP and IXP .
network. The results for this metric present the largestvariations in terms of correlation for the different datasets,ranging from 0.356 (for IXP April 2013) to 0.826 (for ISP2011).
Finally, recall that global choice takes into account therelations between each node and the whole system. Itindexes how often each line is used on topologically shortestpaths from all lines to all other lines in the system.It thus, finds the AS-links that are necessary conduitsfor information that must traverse disparate parts of thenetwork. The figures show that the correlation of this metricwith traffic volume is also significant, with r2 values between0.58 (for IXP April 2013) and 0.90 (for ISP April 2013).
The values in Table 2 show that, although the differentdatasets vary in their degree of correlation, the regressionlines are more or less coincident. While varying withcontext, a correlation coefficient greater than 0.5 is generallyconsidered strong, and values greater than 0.8 as very strongcorrelation. The table shows the values of the coefficientof determination resulting from our regression analysis –
nearly all (19/20) the r2 values are above 0.5 and the ALTP-frequency values range between 0.7 and 0.96.
While the ALTP-frequency metric outperforms the restof the metrics, there is a strong correlation between thedifferent metrics and traffic. Exploring the relationshipbetween different variables is part of future work.
6. USE CASESIn this section, we illustrate the potential uses of Network
Syntax using two use-cases: (i) predicting missing traffic linkvolumes in a connectivity graph and, (ii) ranking AS-Linksbased on their traffic volume.
6.1 Predicting link trafficWe have shown in Section 5.2 that the fraction of traffic
carried by the AS-links identified in massive traceroutedatasets strongly correlates with the different NetworkSyntax metrics when those links are clustered in smallgroups. We now show that it is possible to leverage thisstrong correlation to estimate the traffic volume of arbitrarylinks, in the absence of ground-truth traffic data as longas we have information about the traffic for a subset ofthe remaining links in the connectivity graph. We do thisusing the April 2013 datasets for ISP ; similar results wereobtained using the remaining datasets.
In this analysis we employ a subset of the clusters of AS-links to compute the correlation and corresponding regres-sion line between traffic volume and the Network Syntaxmetric with the strongest correlation: ALTP-frequency. Wethen use the computed parameters to estimate the trafficvolume of the remaining clusters of links by using theirALTP-frequency as proxy.

0.05 0.10 0.15 0.20 0.25 0.30 0.35(Connectivity)1/4
50
100
150
200
250(T
raffi
c)1/
4r = 0.889, r2 = 0.789
(a) Connectivity
−3 −2 −1 0 1 2log10(ControlValue)
50
100
150
200
250
(Tra
ffic)
1/4
r = 0.871, r2 = 0.759
(b) Control Value
0.00 0.05 0.10 0.15 0.20 0.25 0.30 0.35(Global Choice)1/4
50
100
150
200
250
(Tra
ffic)
1/4
r = 0.808, r2 = 0.653
(c) Global Choice
4 5 6 7 8 9 10Radius 2 Integration
50
100
150
200
250
(Tra
ffic)
1/4
r = 0.909, r2 = 0.826
(d) Integration
0 1 2 3 4 5 6(ALTP-frequency)1/4
50
100
150
200
250
(Tra
ffic)
1/4
r = 0.982, r2 = 0.965
(e) ALTP-frequency
Figure 10: Correlation between connectivity, control value, global choice , local integration metric (integration radius 2) andALTP-frequency with traffic volume for ISP for April 2011.
0.05 0.10 0.15 0.20 0.25 0.30 0.35(Connectivity)1/4
50
100
150
200
250
300
(Tra
ffic)
1/4
r = 0.954, r2 = 0.911
(a) Connectivity
−3 −2 −1 0 1 2log10(ControlValue)
50
100
150
200
250
(Tra
ffic)
1/4
r = 0.866, r2 = 0.750
(b) Control Value
0.05 0.10 0.15 0.20 0.25 0.30 0.35(Global Choice)1/4
100
150
200
250
(Tra
ffic)
1/4
r = 0.950, r2 = 0.903
(c) Global Choice
3 4 5 6 7 8 9 10Radius 2 Integration
50
100
150
200
250
300
(Tra
ffic)
1/4
r = 0.793, r2 = 0.629
(d) Integration
0 1 2 3 4 5 6(ALTP-frequency)1/4
50
100
150
200
250
300
(Tra
ffic)
1/4
r = 0.979, r2 = 0.958
(e) ALTP-frequency
Figure 11: Correlation between connectivity, control value, global choice, local integration metric (integration radius 2) andALTP-frequency with traffic volume for ISP for April 2013.
To reduce the number of links per cluster as much aspossible, we start by generating clusters of size ten asdescribed in Section 5.2. We then remove, from eachindividual cluster, the AS-links that diverge from the mediancluster ALTP-frequency by at least one standard deviation(a total of 25 links out of 147). This allows us to use theremaining links to generate clusters of half their original sizewhile maintaining a similarly strong correlation.5 Figure 12shows this correlation and corresponding regression line forISP for clusters of size five for the remaining 122 links.
We vary the fraction of clusters used to compute theregression line from 65% to 85% of the available clusters(in increments of 5%) and compute the difference, in ordersof magnitude, between the median estimated traffic valuesand the actual traffic values (from the ground-truth) for theremaining clusters.6 If the estimated and real value fallwithin the same order of magnitude (say, between 0 and10MB or between 10 and 100MB), then the difference is zero.A difference between the estimated and real value of 1, onthe other hand, means we may have under/over-estimatedthe traffic volume by one order of magnitude (e.g., declaringit to be in 50MB when it is closer to 5MB).
Figure 13 shows the result of our analysis after repeatingour random selection for each percentage of clusters, 500times. The figure plots the median difference betweenestimated and actual traffic volumes for each of the differentfractions. For the median case, ≈80% of the estimated
5We observed similar results using clusters of size ten,without removing any links from the original sets.6We considered the use of OC-based bucketing for this casestudy, but decided against it as our analysis compares groupsof links rather than individual ones.
values fall within the same order of magnitude as the ground-truth values.
To characterize the size estimation errors for the linkclusters with predicted and real values within the same orderof magnitude, we compute the normalized mean absoluteerror between the median estimated and ground-truth trafficvolumes. Figure 14 plots the mean estimation error forthe different fractions of clusters used to compute theregression line. The figure shows the standard deviationlogically varies depending on the fraction of clusters used.That is, increasing the number of points used to computethe fit decreases the number of clusters left for valueestimation, making estimation errors more noticeable forsmaller clusters. However, although for some clusters oflinks the traffic prediction estimates can be off by a largemargin (e.g., predicting traffic to be 5MB when it wasclose to 1MB yields an error of 500%), the figure showsthat the mean value remains relatively stable around 0.5,indicating that, on average, the median estimated traffic (inmegabytes) differs from the cluster’s real value by ≈50%.While we acknowledge that order of magnitude is a coarseapproximation, we argue this is a valuable first step atinferring traffic volumes that are not directly measurableat scale or without access to a collection of proprietary data(e.g., Arbor Network’s collection of inter-domain traffic datafrom some 110 commercial networks [33]). For instance, theapproximate nature of alternative methods that formulateinter-domain traffic estimation as a matrix completion prob-lem [24] is largely unknown.

0 1 2 3 4 5 6(ALTP-frequency)1/4
50
100
150
200
250
300
350
(Tra
ffic)
1/4
r = 0.909, r2 = 0.827
Figure 12: Correlation between ALTP-frequency and trafficvolume for ISP for April 2013 with clusters of size 5.
0 1 2Order of magnitude difference (actual/predicted)
0
20
40
60
80
100
72.7
27.3
0.0
72.6
27.4
0.0
74.8
25.2
0.0
74.8
25.2
0.0
75.7
24.3
0.0
6570758085
Figure 13: Traffic prediction using ALTP frequency.
60 65 70 75 80 85 90pct clusters to compute fit
0.0
0.2
0.4
0.6
0.8
1.0
mea
nde
viat
ion
from
real
valu
e
Figure 14: Traffic prediction using ALTP frequency.
6.2 Ranking AS-Links based on Traffic Vol-ume
As our second use case, we show that ranking AS-linksbased on different Network Syntax metrics can be used as aproxy for the traffic-volume based ranking of those links.
For this analysis, we start by ranking the AS-links basedon the amount of traffic they carry using our ground-truthtraffic. We then select the subset of links identified on our
traceroute dataset and rank those links a second time, basedon the selected Network Syntax metric. As before, to reducethe potential noise introduced by the ranking of individualAS-links, we cluster them in equal-sized groups (ten in thiscase). For each group, we compute its ranking for both therelative Network Syntax metric and carried traffic, as theaverage of the individual rankings of the AS-links within thegroup. Given the strong correlation between the differentNetwork Syntax metrics and traffic volume, potentially anyof the metrics could be used to rank the links. For thisanalysis we select the two metrics with the highest degree ofcorrelation: connectivity and ALTP-frequency, and comparetheir results.
Figures 15 and 16 show the correlation between traffic-based ranking and connectivity or ALTP-frequency respec-tively, for both IXP and IXP . The figures show strong r2
for all four dataset using both Network Syntax metrics.However ALTP-frequency r2 values are slightly higher thantheir connectivity counterpart, with values as high as 0.95 inthe case of ISP and 0.75 in the case of IXP . Regardless, theresults from this analysis show that using Network Syntaxmetrics to rank AS-links can be effectively used to rank linksbased on the amount of traffic they carry.
7. DISCUSSIONIn this section, we elaborate on three critical issues: (i)
wether the application of Network Syntax analysis to AS-level connectivity graphs derived from BGP data works asintended, (iii) the robustness of the approach to the knownpitfalls of IP-to-AS level mapping for AS topology inferencewhen using traceroute datasets, and (iii) the impact ofdifferent traceroute dataset characteristics on the resultsfrom Network Syntax metrics.
7.1 BGP-derived connectivity-graphsAs we discussed in Section 3.2, Network Syntax can not be
applied to just any AS-level connectivity graph but dependson the information embedded in the graph inferred fromtraceroute datasets. To illustrate this we apply NetworkSyntax to the connectivity graph for ISP derived fromthe subset of AS-level paths contained in the public BGPview [5] for April 2011. Specifically, we extract all theBGP announcements that contain the AS number for ISP ,derive their corresponding AS-level paths, and generate theconnectivity-graph. We then compute the different NetworkSyntax metrics and evaluate our findings in the contextof the ground-truth traffic data for ISP for same timeperiod. As in Section 5, we first rank the links based on thecorresponding metric and create clusters of ten links beforeexamining the correlation.
Figure 17 shows the results of our analysis for the subsetof 2,016 links identified in the dataset for the connectivity,control value, global choice and integration metrics. Sincethis analysis is based on AS-level paths extracted fromBGP announcements, no traceroute probes were availableto compute the ALTP-frequency metric.
The figure shows that, as anticipated, none of the met-rics are strongly correlated with traffic volume. In mostcases, links are clustered together either on the lower leftside of the plot (corresponding to low traffic volume andnearly identical Network Syntax metric) as is the case inFigures 17c, 17b and 17c, or mostly grouped on the rightlower side of the plot (which corresponds to high Network

−1 0 1 2 3 4 5Degree path ranking ×10+3
0
1000
2000
3000
4000
5000
Traf
ficra
nkin
g
r = 0.810, r2 = 0.656
(a) IXP April 2011
−1 0 1 2 3 4Degree path ranking ×10+3
0
1000
2000
3000
4000
Traf
ficra
nkin
g
r = 0.709, r2 = 0.502
(b) IXP April 2013
−0.5 0.0 0.5 1.0 1.5 2.0 2.5 3.0Degree path ranking ×10+2
0
50
100
150
200
250
Traf
ficra
nkin
g
r = 0.964, r2 = 0.930
(c) ISP April 2011
0.0 0.5 1.0 1.5Degree path ranking ×10+2
20
40
60
80
100
120
140
Traf
ficra
nkin
g
r = 0.949, r2 = 0.900
(d) ISP April 2013
Figure 15: Ranking based on connectivity and traffic volume.
−1 0 1 2 3 4 5 6AS-level path ranking ×10+3
0
1000
2000
3000
4000
5000
6000
Traf
ficra
nkin
g
r = 0.866, r2 = 0.750
(a) IXP April 2011
−1 0 1 2 3 4 5AS-level path ranking ×10+3
0
1000
2000
3000
4000
5000
Traf
ficra
nkin
g
r = 0.812, r2 = 0.659
(b) IXP April 2013
0.0 0.5 1.0 1.5 2.0 2.5 3.0AS-level path ranking ×10+2
0
50
100
150
200
250
300
Traf
ficra
nkin
g
r = 0.987, r2 = 0.975
(c) ISP April 2011
0.0 0.5 1.0 1.5AS-level path ranking ×10+2
20
40
60
80
100
120
140
Traf
ficra
nkin
g
r = 0.987, r2 = 0.974
(d) ISP April 2013
Figure 16: Ranking based on ALTP-frequency and traffic volume.
0.05 0.10 0.15 0.20 0.25 0.30(Connectivity)1/4
0
50
100
150
200
250
(Tra
ffic)
1/4
r = 0.632, r2 = 0.399
(a) Connectivity
−4 −2 0 2log10(ControlValue)
0
50
100
150
200
(Tra
ffic)
1/4
r = 0.792, r2 = 0.627
(b) Control Value
−0.1 0.0 0.1 0.2 0.3 0.4(Global Choice)1/4
0
50
100
150
200
250
(Tra
ffic)
1/4
r = 0.681, r2 = 0.464
(c) Global Choice
8 9 10 11 12Radius 2 Integration
0
50
100
150
200
(Tra
ffic)
1/4
r = 0.336, r2 = 0.113
(d) Integration
Figure 17: Correlation between Network Syntax metrics and traffic volume (BGP dataset) for ISP April 2011.
Syntax metric and low traffic volume) in the case of 17d.The seemingly moderately strong r2 values are mostly drivenby a few outliers, but it is apparently clear from the figuresthat the cluster of links are not cleanly distributed aroundthe regression line (in contrast to Figures 10 and 11). Thisanalysis shows that it is the data-plane and not the control-plane perspective that is relevant for Network Syntax.
7.2 Errors in traceroute-to-AS mappingsThe pitfalls of IP-to-AS level mapping for AS topology
inference are well-known. The common approach of usinglongest prefix matching to map the routers’ IP addresses of atraceroute to AS numbers is known to generate potentially
false AS links [49]. Several previous research efforts havestudied these pitfalls [15,17,29,36,37] and identified commoncauses for the mismatch which range from the incomplete-ness of IP-to-AS mappings gathered from publicly availableBGP feeds, to the constraints inherent to the traceroutemeasurement itself (e.g., routers silently dropping probes ornot altering packets’ TTL). We correct our datasets to avoidthese pitfalls, as described in Section 4.2.
In this section we explore the robustness of NetworkSyntax when applied to traceroute datasets with some ofthese well known problems. We do this by computing thedifferent Network Syntax metrics on the un-corrected April
0.1 0.2 0.3 0.4 0.5(Connectivity)1/4
50
100
150
200
250(T
raffi
c)1/
4r = 0.844, r2 = 0.713
(a) Connectivity
−3 −2 −1 0 1 2log10(ControlValue)
40
60
80
100
120
140
160
180
(Tra
ffic)
1/4
r = 0.848, r2 = 0.719
(b) Control Value
0.0 0.1 0.2 0.3 0.4 0.5(Global Choice)1/4
50
100
150
200
(Tra
ffic)
1/4
r = 0.889, r2 = 0.791
(c) Global Choice
4 5 6 7 8 9Radius 2 Integration
40
60
80
100
120
140
160
180
(Tra
ffic)
1/4
r = 0.858, r2 = 0.737
(d) Integration
0 1 2 3 4 5(ALTP-frequency)1/4
0
50
100
150
200
250
(Tra
ffic)
1/4
r = 0.910, r2 = 0.829
(e) ALTP-frequency
Figure 18: Correlation between connectivity, control value, global choice , local integration metric (integration radius 2) andALTP-frequency with traffic volume for ISP for April 2011 using the CAIDA traceroute dataset.
−0.5 0.0 0.5 1.0 1.5 2.0AS-level path ranking ×10+3
0
500
1000
1500
Traf
ficra
nkin
g
r = 0.717, r2 = 0.514
(a) IXP April 2011
−0.5 0.0 0.5 1.0 1.5 2.0AS-level path ranking ×10+3
200
400
600
800
1000
1200
1400
1600
Traf
ficra
nkin
g
r = 0.634, r2 = 0.402
(b) IXP April 2013
−1 0 1 2 3 4 5 6AS-level path ranking ×10+2
0
100
200
300
400
500
600
Traf
ficra
nkin
g
r = 0.819, r2 = 0.671
(c) ISP April 2011
−2 0 2 4 6 8AS-level path ranking ×10+2
0
100
200
300
400
500
600
700
Traf
ficra
nkin
g
r = 0.855, r2 = 0.731
(d) ISP April 2013
Figure 19: Correlation between ALTP-frequency and traffic volume for IXP and ISP using CAIDA datasets.
False AS links problems
Internet eXchange Points (IXPs)Sibling ASes
Unannounced IP addressesUsing outgoing interface IPsPrivate peering interface IPs
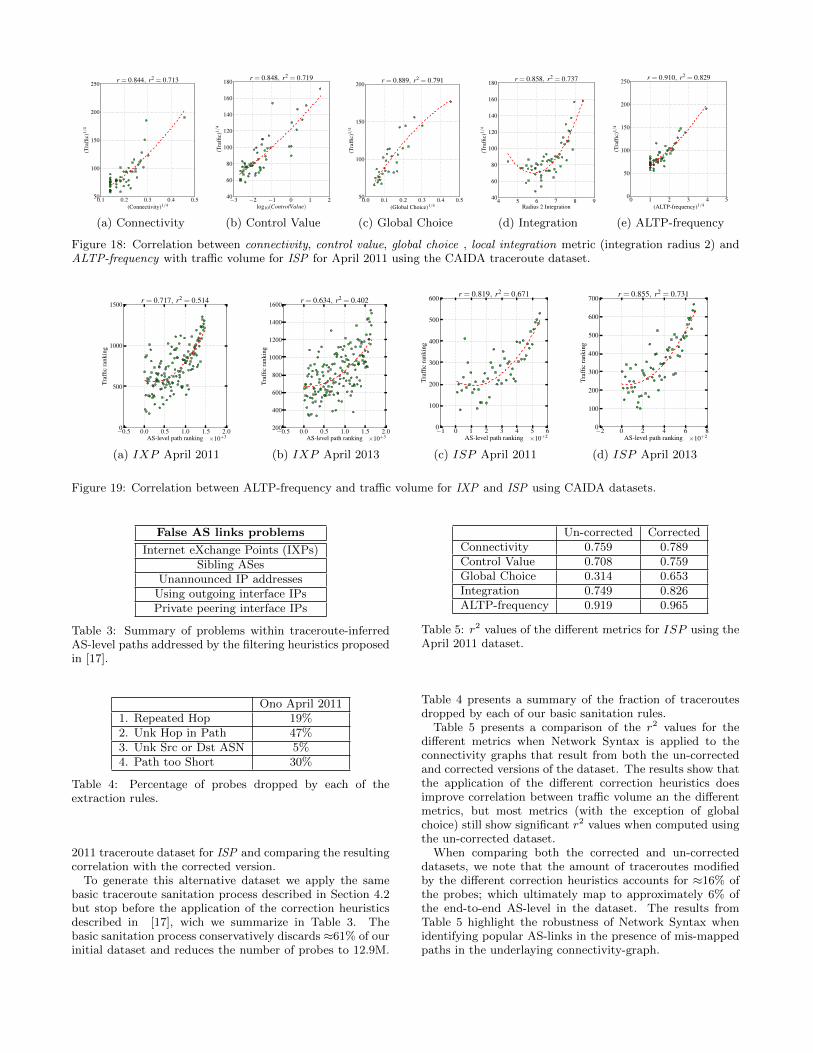
Table 3: Summary of problems within traceroute-inferredAS-level paths addressed by the filtering heuristics proposedin [17].
Ono April 20111. Repeated Hop 19%2. Unk Hop in Path 47%3. Unk Src or Dst ASN 5%4. Path too Short 30%
Table 4: Percentage of probes dropped by each of theextraction rules.
2011 traceroute dataset for ISP and comparing the resultingcorrelation with the corrected version.
To generate this alternative dataset we apply the samebasic traceroute sanitation process described in Section 4.2but stop before the application of the correction heuristicsdescribed in [17], wich we summarize in Table 3. Thebasic sanitation process conservatively discards ≈61% of ourinitial dataset and reduces the number of probes to 12.9M.
Un-corrected CorrectedConnectivity 0.759 0.789Control Value 0.708 0.759Global Choice 0.314 0.653Integration 0.749 0.826ALTP-frequency 0.919 0.965
Table 5: r2 values of the different metrics for ISP using theApril 2011 dataset.
Table 4 presents a summary of the fraction of traceroutesdropped by each of our basic sanitation rules.
Table 5 presents a comparison of the r2 values for thedifferent metrics when Network Syntax is applied to theconnectivity graphs that result from both the un-correctedand corrected versions of the dataset. The results show thatthe application of the different correction heuristics doesimprove correlation between traffic volume an the differentmetrics, but most metrics (with the exception of globalchoice) still show significant r2 values when computed usingthe un-corrected dataset.
When comparing both the corrected and un-correcteddatasets, we note that the amount of traceroutes modifiedby the different correction heuristics accounts for ≈16% ofthe probes; which ultimately map to approximately 6% ofthe end-to-end AS-level in the dataset. The results fromTable 5 highlight the robustness of Network Syntax whenidentifying popular AS-links in the presence of mis-mappedpaths in the underlaying connectivity-graph.

7.3 Other datasetsWe have shown that applying Network Syntax metrics
to AS-level connectivity graphs using paths extracted frommassive traceroute datasets reveals a strong correlationbetween traffic volume and the different metrics. Wenow apply the same technique to a different dataset, onecollected from CAIDA’s Ark monitors for the same timeperiods. This tracerotue dataset consist of probes launchedtowards randomly selected IP addresses from CAIDA’s Arkmonitors [12] which probe IP addresses from every routableIPv4 /24 prefix in cycles of approximately 48 hours. Forthis analysis, we combined data from three different probingcycles completed by different sets of Ark monitors betweenApril 1-7, 2011 and April 1-7, 2013.
Figure 18 shows a comparison of the correlation betweentraffic volume and the different Network Syntax metrics forthe CAIDA 2011 dataset for ISP7. The observed trendsare similar to those seen in Section 5.2, where the amountof traffic carried by the clustered links strongly correlateswith the different Network Syntax metrics. Additionally,Figure 19 shows a comparison of the correlation of AS-linkranking based on traffic volume versus ranking based onALTP-frequency, using the CAIDA dataset for both IXPand ISP . The same trends as those seen in Section 6.2 canbe observed for both network entities, with clusters of linkscarrying larger amounts of traffic corresponding to higherALTP-frequency links.
Even though in both cases the correlations can still beobserved, the r2 values are smaller than their Ono-datasetcounterpart. We argue that this is due to a fundamentaldifference on how the underlaying traceroutes were collected.As Table 6 shows, although the tracerotues of both theOno and CAIDA datasets contain millions of tracerouteslaunched against a large number of different destinationASes; there is a 2-order of magnitude difference in thenumber of source ASes from where the probes were launched.
Even though the correlation is still present, the r2 valuesare smaller than their Ono-dataset counterpart. We arguethat this is due to a fundamental difference on how theunderlaying traceroutes were collected. As Table 6 shows,although the tracerotues of both the Ono and CAIDAdatasets contain millions of traceroutes launched against alarge number of different destination ASes; there is a 2-orderof magnitude difference in the number of source ASes fromwhere the probes were launched.
As discussed in [34], one consequence of taking measure-ments using a small number of sources and relying on an end-to-end strategy, is that edges are selected disproportionately,so bias arises when edges incident to a node in the underlyinggraph are sampled disproportionately. Thus, an edge ismuch more likely to be visible if it is close to the vantagepoint that discovered them. To explore this potential issue,we focus our analysis on the CAIDA 2011 dataset and lookat the discovered AS-links as the intersection of the numberof probes that crossed through them vs the correspondingnumber of ALTPs that contain it. We concentrate on thetop AS-link with the largest number of ALTPs which isseen by almost 10K ALTPs and was discovered by almosthalf a million probes. Closer inspection shows that thelink connects AS195 (San Diego Supercomputer Center) and
7Similar trends were observed for both IXP and ISP usingCAIDA’s 2011 and 2013 datasets.
Dataset Unique VPs Src ASes Dst ASes Probes
CAIDA 2011 53 52 36,034 26.9MCAIDA 2013 65 60 42,440 48.9M
Table 6: Number of unique vantage points, unique sourceASes and probes for each dataset.
AS2152 (the California State University Network) at SD-NAP (an IXP located in San Diego, CA), and that all theprobes responsible for discovering this link correspond to aCAIDA Ark monitor placed in the San Diego SupercomputerCenter. A similar scenario was observed for the othertop three links. This highlights that the location of thevantage points can lead to erroneous inferences about a link’spopularity.
8. CONCLUSIONS AND FUTURE WORKWe advance the state-of-the-art in traffic characterization
by presenting a novel technique to infer traffic volumes fromAS-level routing graphs carved out by massive traceroutecampaigns. Our Network Syntax approach builds on theobservation that the popularity of a route on the Internetcan serve as an informative proxy for the volume of trafficit carries. Drawing analogies with city grids and traffic,Network Syntax applies structural analysis and metrics topredict with high accuracy the inter-domain traffic volumecarried by different links. We demonstrated the effectivenessof our approach using two months of data (collected twoyears apart) from a Tier-1 Internet Service Provider and alarge Internet eXchange Point, by identifying traffic-criticallinks and inferring missing traffic matrix measurements.
We evaluated four different publicly available traceroutedatasets, but selected two for inclusion (due to spaceconstraints) representing different standpoints with respectto type and location of vantage points. Multiple otherdatasets collected over the years could be leveraged byour technique, such as RIPE’s Atlas project [4], or thosecollected from the DIMES project [43].
Going forward, Network Syntax opens a rich researchagenda from specific methodological aspects (e.g., differentmetrics and datasets attributes) to applications of a better-understood flow of Internet traffic. Could we identify high-traffic links in the context of arbitrary AS-links on theInternet, i.e. can we establish the relative importance ofa pair AS-links not tied to a specific network? This couldbe used, for instance, to augment existing AS-topologymaps with the relative importance of links based on trafficcarried. Could Network Syntax, perhaps in combinationwith existing techniques, be used to complete partial-trafficmatrixes? Given our new ability to leverage long-availabletraceroute datasets, what could this approach tell us aboutthe variability and evolution of the Internet over time?
AcknowledgementsWe would like to thank our shepherd, Paul Barford, andthe anonymous reviewers for their valuable feedback andassistance. Georgios Smaragdakis was supported by theEU Marie Curie International Outgoing Fellowship “CDN-H” (PEOPLE-628441). This work was supported in partby the National Science Foundation through Awards CNS

0644062, CNS 0917233 and CNS 0855253 and by a generousGoogle Faculty Research Award.
9. REFERENCES[1] European Internet Exchange Association.
https://www.euro-ix.net/.
[2] Packet Clearing House. https://www.pch.net/.
[3] PeeringDB. https://www.peeringdb.com/.
[4] Ripe. http://www.ripe.net/project/ris.
[5] University of Oregon Route Views Project.http://www.routeviews.org/.
[6] Adhikari, V. K., Jain, S., and Zhang, Z.-L.Youtube traffic dynamics and its interplay with aTier-1 ISP: an ISP perspective. In Proc. of IMC(2010).
[7] Ager, B., Chatzis, N., Feldmann, A., Sarrar, N.,Uhlig, S., and Willinger, W. Anatomy of a largeeuropean IXP. In Proc. of ACM SIGCOMM (2012).
[8] Ahmad, M. Z., and Guha, R. Understanding theimpact of Internet eXchange Points on Internettopology and routing performance. In Proc. of theACM CoNEXT Student Workshop (2010).
[9] Atkinson, A. Plots, transformations, and regression.Oxford science publications. Clarendon Press, Oxford,1985.
[10] Augustin, B., Krishnamurthy, B., andWillinger, W. IXPs: Mapped? In Proc. of IMC(2009).
[11] Bharti, V., Kankar, P., Setia, L., Gursun, G.,Lakhina, A., and Crovella, M. Inferring invisibletraffic. In Proc. of ACM CoNEXT (2010).
[12] CAIDA. The CAIDA UCSD IPv4 Routed /24Topology Dataset - 1-7 April 2011 and 1-7 April 2013.http://www.caida.org/data/active/ipv4_routed_
24_topology_dataset.xml.
[13] Cardona Restrepo, J. C., and Stanojevic, R. AHistory of an Internet eXchange Point. SIGCOMMComput. Commun. Rev. 42, 2 (2012), 58–64.
[14] Chang, H., Jamin, S., Morley, Z., andWillinger, M. W. An empirical approach tomodeling Inter-AS traffic matrices. In Proc. of IMC(2005).
[15] Chang, H., Jamin, S., and Willinger, W. InferringAS-level internet topology from router-level pathtraces. In Proc. of SPIE ITCom (2001).
[16] Chatzis, N., Smaragdakis, G., Boettger, J.,Krenc, T., and Feldmann, A. On the benefits ofusing a large IXP as an Internet vantage point. InProc. of IMC.
[17] Chen, K., Choffnes, D. R., Potharaju, R.,Chen, Y., Bustamante, F. E., Pei, D., and Zhao,Y. Where the sidewalk ends: Extending the InternetAS graph using traceroutes from P2P users. In Proc.of ACM CoNEXT (2009).
[18] Choffnes, D. R., and Bustamante, F. E. Tamingthe torrent: A practical approach to reducingcross-ISP traffic in peer-to-peer systems. In Proc. ofACM SIGCOMM (2008).
[19] Dhamdhere, A., and Dovrolis, C. Ten years in theevolution of the Internet ecosystem. In Proc. of IMC(2008).
[20] Fang, W., and Peterson, L. Inter-AS trafficpatterns and their implications. In GlobalTelecommunications Conference, 1999.GLOBECOM’99 (1999).
[21] Feldmann, A., Greenberg, A., Lund, C.,Reingold, N., Rexford, J., and True, F. Derivingtraffic demands for operational IP networks:Methodology and experience. IEEE/ACMTransactions on Networking (ToN) (2001).
[22] Feldmann, A., Kammenhuber, N., Maennel, O.,Maggs, B., De Prisco, R., and Sundaram, R. Amethodology for estimating interdomain web trafficdemand. In Proc. of IMC (2004).
[23] Gao, L. On inferring autonomous system relationshipsin the internet. IEEE/ACM TON 9, 6 (2001).
[24] Gursun, G., and Crovella, M. On traffic matrixcompletion in the internet. In Proc. of IMC (2012).
[25] Hillier, B., and Hanson, J. The Social Logic ofSpace. Cambridge University Press, 1984.
[26] Hillier, B., Penn, A., Hanson, J., Grajewski, T.,and Xu, J. Natural movement: or, configuration andattraction in urban pedestrian movement Environmentand Planning B: Planning and Design, 1994.
[27] Hillier, B., and Sahbaz, O. High resolutionanalysis of crime patterns in urban street networks: aninitial statistical sketch from an ongoing study of aLondon borough. In Space Syntax Symposium (2005),
p. 451aAS478.
[28] Howell, D. Statistical Methods for Psychology.Thomson Wadsworth, 2007.
[29] Hyun, Y., Broido, A., and claffy, k. OnThird-party Addresses in Traceroute Paths. In Proc.of PAM (2003).
[30] InMon. Inmon sFlow. http://sflow.org.
[31] Jiang, B. A space syntax approach to spatialcognition in urban environments. In Workshop onCognitive Models of Dynamic Phenomena and TheirRepresentations (1998).
[32] Kostakos, V. Space Syntax and Pervasive Systems.Geospatial Analysis and Modeling of Urban Structureand Dynamics (2010), 21–52.
[33] Labovitz, C., lekel Johnson, S., Oberheide, J.,and Jahanian, F. Internet inter-domain traffic. InProc. of ACM SIGCOMM (2010).
[34] Lakhina, A., Byers, J. W., Crovella, M., andXie, P. Sampling biases in IP topology measurements.In Proc. Joint Conference of the IEEE Computer andCommunications Societies (2003).
[35] Mahajan, R., Spring, N., Wetherall, D., andAnderson, T. Inferring link weights using end-to-endmeasurements. In Proc. ACM IMW (2002).
[36] Mao, Z. M., Johnson, D., Rexford, J., Wang, J.,and Katz, R. H. Scalable and accurate identificationof AS-level forwarding paths. In INFOCOM (2004).
[37] Mao, Z. M., Rexford, J., Wang, J., and Katz,R. H. Towards an accurate as-level traceroute tool. InProc. of ACM SIGCOMM (2003).
[38] Medina, A., Taft, N., Salamatian, K.,Bhattacharyya, S., and Diot, C. Traffic matrixestimation: existing techniques and new directions. InProc. of ACM SIGCOMM (2002).

[39] Nucci, A., Sridharan, A., and Taft, N. Theproblem of synthetically generating IP traffic matrices:Initial recommendations.
[40] Oliveira, R., Z. B., and Zhang, L. Observing theevolution of Internet AS topology. In Proc. of ACMSIGCOMM (2007).
[41] Penn, A., Hillier, B., Banister, D., and Xu, J.Configurational modelling of urban movementnetworks. Environment and Planning B 25 (1998).
[42] Peterson, L. Inter-AS traffic patterns and theirimplications. In in Proc. IEEE GLOBECOM (1999).
[43] Shavitt, Y., and Shir, E. DIMES: Let the Internetmeasure itself. ACM SIGCOMM ComputerCommunication Review 35, 5 (October 2005).
[44] Tabachnick, B. G., and Fidell, L. S. UsingMultivariate Statistics (5th Edition). Allyn & Bacon,Inc., Needham Heights, MA, USA, 2006.
[45] The PREDICT Repository. Protected repositoryfor the defense of infrastructure against cyber threats.https://www.predict.org/, Aug 2014.
[46] Uhlig, S., and Bonaventure, O. Implications ofinterdomain traffic characteristics on trafficengineering. European Transactions onTelecommunications (2002).
[47] Willinger, W., Alderson, D., and Doyle, J. C.Mathematics and the Internet: A Source of EnormousConfusion and Great Potential. Notices of the AMS56, 5 (May 2009).
[48] Xu, K., Duan, Z., Zhang, Z.-L., andChandrashekar, J. On properties of InterneteXchange Points and their impact on as topology andrelationship. Networking 3042 (2004).
[49] Zhang, Y., Oliveira, R. V., Zhang, H., andZhang, L. Quantifying the pitfalls of traceroute in asconnectivity inference. In PAM (2010),A. Krishnamurthy and B. Plattner, Eds., vol. 6032,Springer, pp. 91–100.
[50] Zhang, Y., Roughan, M., Duffield, N., andGreenberg, A. Fast accurate computation oflarge-scale ip traffic matrices from link loads. In Proc.of ACM SIGMETRICS (2003).
[51] Zhang, Y., Roughan, M., Lund, C., and Donoho,D. L. Estimating point-to-point andpoint-to-multipoint traffic matrices: Aninformation-theoretic approach. IEEE/ACM Trans.Netw. (2005).
[52] Zhang, Y., Roughan, M., Willinger, W., andQiu, L. Spatio-temporal compressive sensing andinternet traffic matrices. In Proc. of ACM SIGCOMM(2009).