Inter-Building Service and Amenity Areas in Campuses ... Best Practices 3.pdf · – The rentable...
21
Floor Area Measurement Best Practices #3 Inter-Building Service and Amenity Areas in Campuses & Multi-Building Sets Applicable to: BOMA 2010 Office Standard (ANSI/BOMA Z65.1–2010) Draft Issued: 15-Feb-2014 Introduction The Floor Measurement Standards Committee of BOMA International has approved this Best Practice to provide guidance in addition to that included in the BOMA 2010 Office Standard. This Best Practice does not modify the BOMA 2010 Office Standard published as ANSI/BOMA Z65.1-2010 but may be considered for inclusion in future updates of that publication. The provisions in section of the Legal Notice page of ANSI/BOMA Z65.1-2010 are included herein by reference. Purpose To provide a consistent, detailed method of allocating inter-building service and amenity areas among different buildings that they serve in a multi-building set in accordance with general direction included in the BOMA 2010 Office Standard. Discussion: The BOMA Office Standard states that it is a reasonable adaptation to allocate campus amenity areas shared among several buildings (such as a cafeteria or conference room) in the same manner as building amenity area. It also states that it is a reasonable adaptation to allocate campus service areas shared among several buildings (such as a physical plant) in the same manner as building service areas. Detailed direction of a consistent method of accomplishing these allocations is not part of The BOMA 2010 Office Standard but are offered in this Best Practice. In addition, the concept of campus service and amenity areas is modified herein to address allocation of inter-building service and amenity areas among any buildings that are part of a multi-building set as defined herein, not just buildings that are part of a campus as the term is commonly understood and defined in the BOMA 2012 Industrial Standard. Because allocation of inter-building service and amenity area between buildings will effect the alloction of rental revenue and operating expenses among the buildings, BOMA suggests that, if all the buildings in a multi-building set are not under the same ownership, an agreement between the owners of the buildings should document the allocations between the buildings in a multi-building set. Applicability This Best Practice is to be used in conjunction with the BOMA 2010 Office Standard Method A and/or B in order to calculate the rentable areas of two or more new or existing office buildings in a multi-building set that share inter-building service and amenity areas. It is not intended to be applied to an industrial campus because the BOMA Industrial Standard (ANSI/BOMA Z65.2-2012) contains a method for allocating campus common areas to buildings on an industrial campus. It is not intended for application to mixed-use properties because the BOMA 2012 Mixed-Use Standard contains a method for allocating mixed use common areas (MUCA) among buildings on a mixed use campus. It is not intended for use in retail or multi-unit residential properties. Definitions Words that are underlined in this document have the same meaning as those defined in other BOMA measurement standards and the following additional definitions: Copyright 2014 by BOMA International
-
Upload
nguyenphuc -
Category
Documents
-
view
218 -
download
0
Transcript of Inter-Building Service and Amenity Areas in Campuses ... Best Practices 3.pdf · – The rentable...

Floor Area Measurement Best Practices #3 Inter-Building Service and Amenity Areas in Campuses & Multi-Building Sets
Applicable to: BOMA 2010 Office Standard (ANSI/BOMA Z65.1–2010) Draft Issued: 15-Feb-2014
Introduction The Floor Measurement Standards Committee of BOMA International has approved this Best Practice to provide guidance in addition to that included in the BOMA 2010 Office Standard. This Best Practice does not modify the BOMA 2010 Office Standard published as ANSI/BOMA Z65.1-2010 but may be considered for inclusion in future updates of that publication. The provisions in section of the Legal Notice page of ANSI/BOMA Z65.1-2010 are included herein by reference.
Purpose To provide a consistent, detailed method of allocating inter-building service and amenity areas among different buildings that they serve in a multi-building set in accordance with general direction included in the BOMA 2010 Office Standard.
Discussion: The BOMA Office Standard states that it is a reasonable adaptation to allocate campus amenity areas shared among several buildings (such as a cafeteria or conference room) in the same manner as building amenity area. It also states that it is a reasonable adaptation to allocate campus service areas shared among several buildings (such as a physical plant) in the same manner as building service areas. Detailed direction of a consistent method of accomplishing these allocations is not part of The BOMA 2010 Office Standard but are offered in this Best Practice. In addition, the concept of campus service and amenity areas is modified herein to address allocation of inter-building service and amenity areas among any buildings that are part of a multi-building set as defined herein, not just buildings that are part of a campus as the term is commonly understood and defined in the BOMA 2012 Industrial Standard.
Because allocation of inter-building service and amenity area between buildings will effect the alloction of rental revenue and operating expenses among the buildings, BOMA suggests that, if all the buildings in a multi-building set are not under the same ownership, an agreement between the owners of the buildings should document the allocations between the buildings in a multi-building set.
Applicability This Best Practice is to be used in conjunction with the BOMA 2010 Office Standard Method A and/or B in order to calculate the rentable areas of two or more new or existing office buildings in a multi-building set that share inter-building service and amenity areas. It is not intended to be applied to an industrial campus because the BOMA Industrial Standard (ANSI/BOMA Z65.2-2012) contains a method for allocating campus common areas to buildings on an industrial campus. It is not intended for application to mixed-use properties because the BOMA 2012 Mixed-Use Standard contains a method for allocating mixed use common areas (MUCA) among buildings on a mixed use campus. It is not intended for use in retail or multi-unit residential properties.
Definitions Words that are underlined in this document have the same meaning as those defined in other BOMA measurement standards and the following additional definitions:
Copyright 2014 by BOMA International

Floor Area Measurement Best Practices #3 Inter-Building Service and Amenity Areas in Campuses & Multi-Building Sets
Applicable to: BOMA 2010 Office Standard (ANSI/BOMA Z65.1–2010) Draft Issued: 15-Feb-2014
Building Rentable Area – The rentable area of a building excluding inter-building service and amenity areas, calculated using the BOMA 2010 Office Standard, Method A or B.
Effective Load Factor – The product of the load factor of a floor in a building and the Inter-building load factor.
Discussion: This best practice does not provide a method of making the effective load factor identical for all floors of all buildings in a multi-building set (except for appropriate application of a capped load factor). When using Method A of the BOMA 2010 Office Standard, the load factor A of each floor in each building in a multi-building set is calculated uniquely for that floor and is likely to vary among the floors of each building, so the effective load factor is also likely to vary among the floors of buildings in a multi-building set. When using Method B, the load factor B of each building in a multi-building set is calculated uniquely for that building, so the effective load factor is likely to vary between buildings in a multi-building set.
Inter-Building Amenity Area – a portion of a building that adds a convenience for the occupants of more than one building and that is not used exclusively by any one occupant.
Discussion: Examples of inter-building amenity areas include but are not limited to: • site conference and food service facilities • exercise facilities • similar amenity areas that serve or benefit multiple office buildings
The boundaries of inter-building amenity areas are the same as amenity areas on the Wall Priority Diagram (Chart #2) in the BOMA 2010 Office Standard. Inter-building amenity areas are considered to be part of the usable area of a building and their rentable area is used to allocate their area among the buildings that they benefit. Refer also to discussion of inter-building service and amenity areas.
Inter-Building Load Factor – A fraction greater than one, the numerator of which is the sum of the building rentable areas and the inter-building service and amenity areas that are allocated to the building and the denominator of which is the building rentable areas of that building.
Discussion: If all inter-building service and amenity areas are all allocated to all buildings in a multi-building set based only upon the building rentable area of each building, then the inter-building load factor would be the same for all buildings in the multi-building set. However, if some inter-building service and amenities are allocated only to some but not all of the buildings in the multi-building set, or are allocated based upon factors other than building rentable area (such as usage), then the inter-building load factor will different in some or all buildings in the multi-bulding set.
Inter-Building Service Area – a portion of a building that provides services to occupants of more than one building enabling occupants to work.
Copyright 2014 by BOMA International
Floor Area Measurement Best Practices #3 Inter-Building Service and Amenity Areas in Campuses & Multi-Building Sets
Applicable to: BOMA 2010 Office Standard (ANSI/BOMA Z65.1–2010) Draft Issued: 15-Feb-2014
Discussion: Examples of inter-building service areas include but are not limited to: • physical plant (chillers, boilers, etc) • site electrical transformers, emergency generators, etc. • site equipment & materials storage • site property management, engineering, security or parking offices • site staff facilities (restrooms, locker rooms, break room, etc,) • similar service areas that serve or benefit multiple office buildings.
The boundaries of inter-building service areas are the same as building service areas on the Wall Priority Diagram (Chart #2) in the BOMA 2010 Office Standard. Their measured area (without any load factor applied) is used to allocate their area among the buildings that they serve or benefit. Refer also to discussion of inter-building service and amenity areas.
Inter-Building Service and Amenity Areas (IBSA) – The sum of inter-building service areas and inter-building amenity areas.
Discussion: Inter-building service and amenity areas can exist as part of any office building in a multi-building set, or in a separate building in a multi-building set (such as a physical plant or parking structure). If an inter-building service or amenity area is located in a separate building or parking structure, that building shall be measured using the BOMA 2010 Office Standard. There are three specific kinds of areas that shall not be classified or allocated as inter-building service or amenity areas:
• Space classified as occupant area, base building circulation, occupant storage, major vertical penetrations or parking • Any space that is leased, or that occupants or other pay to use, such as a health club whose members pay dues or usage fees • Any space that provides services that are paid for by the building ownership and included in the operating expenses of a
building, such as a plant that is owned or operated by an entity that is a utility provider that sells power, steam, chillled water or the like for which building owners pay based upon usage.
Multi-Building Set – A set of buildings containing all those among which inter-building service areas and/or inter-building amenity areas are allocated.
Discusstion: A multi-building set is different than campus (as defined in the BOMA 2012 Industrial Standard) in that it may contain buildings that are not part of a campus, or may contain fewer than all the buildings on a campus. However, it can mean the same thing as a campus if all the buildings on the campus share inter-building service and amenity areas.
Overview Of Method
Follow these steps to measure and allocate inter-building service and amenity area among office buildings in a multi-building set:
Copyright 2014 by BOMA International

Floor Area Measurement Best Practices #3 Inter-Building Service and Amenity Areas in Campuses & Multi-Building Sets
Applicable to: BOMA 2010 Office Standard (ANSI/BOMA Z65.1–2010) Draft Issued: 15-Feb-2014
1. Determine which buildings are included in the multi-building set. Then measure the interior gross area of each building in the multi-building set, including any parking structures and physical plant buildings, using Chart 1, IGA Boundary Conditions in the BOMA 2010 Office Standard.
2. Within the IGA boundary of each floor of each building in the multi-building set, classify all areas into one of the nine classes of space listed in the BOMA 2010 Office Standard, identifying in addition, all inter-building service areas and inter-building amenity areas in each building in the multi-building set.
3. Determine the boundaries of each class of space using Chart #2 (Wall Priority Diagram) in the BOMA 2010 Office Standard. Inter-building service areas have the same wall priority as building service areas and inter-building amenity areas have the same wall priority as amenity areas.
4. Deduct the measured area of all inter-building service areas from the preliminary floor area of each building in which they are located and deduct the rentable area of all inter-building amenity areas from the rentable area of each the buildings in which they are located, and calculate the building rentable areas of each building (excluding inter-building service and amenity area). Enter the building rentable areas and the inter-building service and amenity areas of all buildings in the multi-building set into the ISBA Allocation Worksheet to compute allocate all inter-building service and amenity areas to all buildings in the multi-building set and uniquely calculate an inter-building load factor for each building. Then apply the inter-building load factor to the building rentable area (excluding inter-building service and amenity areas) of each office building in the multi-building set to compute the rentable area of each occupant, floor and office building in the multi-building set. In order to facilitate this step, modified Global Summary of Areas spreadsheets for both Method A and Method B are included in this Best Practices document, as well as a sample IBSA Allocation Worksheet that will work in Method A, Method B, or a combination of those methods, in the buildings in a multi-building set. Refer to the example below and the illustrations at the end of this document.
5. Within each class of space separately delineate and calculate rentable areas of any spaces that fall into any of the four disclosure categories listed in the BOMA 2010 Office Standard.
Optionally, if the Effective Load Factor is of concern in a building, apply a capped load factor to calculate capped rentable areas on a floor-by-floor basis in each building. The capped load factor is applied separately to each individual building in a multi-building set and may or may not be the same from building to building.
Example The following pages present example Global Summary of Areas spreadsheets for a Multi-Building Set and example IBSA Allocation Worksheets illustrating an example of the required calculations under both Method A and Method B of the BOMA 2010 Office Standard. For a discussion of the spreadsheets themselves and the Excel™ formulas used to implement the calculations please refer to the Illustrations that follow this example.
Copyright 2014 by BOMA International

Floor Area Measurement Best Practices #3 Inter-Building Service and Amenity Areas in Campuses & Multi-Building Sets
Applicable to: BOMA 2010 Office Standard (ANSI/BOMA Z65.1–2010) Draft Issued: 15-Feb-2014
The square footage data for the example buildings is the same under Method A and Method B to illustrate that the inter-building load factor is likely to be different depending upon which Method is chosen. It is also possible that some buildings in a multi-building set are measured using Method A and others using Method B, although this is not illustrated in this Best Practices document.
The four buildings in the multi-building set used for this example are as follows: B1 A 4-story office building with a basement and penthouse that includes limited inter-building service and amenity areas. B2 An 8-story office building with a penthouse that has no inter-building service and amenity areas. B3 An 8-story office building with a penthouse that has significant inter-building service and amenity areas. B3 A 3-story parking garage building that has inter-building service areas on the ground level as well as occupant storage areas on its
upper levels.
The examples include 10 spreadsheets as follows. Because the Multi-Building Global Summary of Areas spreadsheets have a large number of columns, they are best viewed in Adobe Acrobat Reader or printed on tabloid (11” X 17”) or A3 (420mm X 297mm) paper. 1. Building B1 Method A Multi-Building Set Global Summary of Areas 2. Building B2 Method A Multi-Building Set Global Summary of Areas 3. Building B3 Method A Multi-Building Set Global Summary of Areas 4. Building B4 Method A Multi-Building Set Global Summary of Areas) 5. IBSA Allocation Worksheet for Method A 6. Building B1 Method B Multi-Building Set Global Summary of Areas 7. Building B2 Method B Multi-Building Set Global Summary of Areas 8. Building B3 Method B Multi-Building Set Global Summary of Areas 9. Building B4 Method B Multi-Building Set Global Summary of Areas 10. IBSA Allocation Worksheet for Method B
In these examples, the spreadsheets are linked within the Excel™ workbook as follows: • Totals building rentable areas of Multi-Building Set Global Summary of Areas spreadsheet for each building are linked to the IBSA
Allocation Worksheet • Total inter-building service and amenity areas of Multi-Building Set Global Summary of Areas spreadsheet for each building are linked to
the IBSA Allocation Worksheet • The inter-building load factor computed on the IBSA Allocation Worksheet is linked to the Rentable Area column in the Multi-Building
Set Global Summary of Areas spreadsheet for each building.
Copyright 2014 by BOMA International

Floor Area Measurement Best Practices #3 Inter-Building Service and Amenity Areas in Campuses & Multi-Building Sets
Applicable to: BOMA 2010 Office Standard (ANSI/BOMA Z65.1–2010) Draft Issued: 15-Feb-2014
This linking assures that the total of the rentable areas of all the buildings in the multi-building set will be identical the sum of their building rentable areas and their inter-building service and amenity areas, a primary objective of this Best Practice document. However, the spreadsheet do not have to be linked, or even in the same workbook, so long as this primary objective is met.
1
Copyright 2014 by BOMA International

BOMA Multi-Building SetGlobal Summary of Areas
ExampleB1-Method A
Printed: 12/30/2013
GSA-IBSA-131209.xlsx, B1-Method A
A B C D E F G H I J K L M N O P Q R S T U V W XInput Measure Measure Measure Measure Measure =B-C-D-E-F Input Measure Measure Measure = I + J + K Measure = G - L -M =(L+N)/L = (I+K) * O = ΣG/ΣP = O * Q = R * I =R*K+F =S * =U * R 1.2500 = I * W
1.068069823
RentableArea
500.00 - Occupant Storage A - - - - - - - 1.0903 - - - - - 1.0000 - 500.00 - Occupant Storage B - - - - - - - 1.0903 - - - - - 1.0000 -
- - Building Storage - - - - 600.00 - - 1.0903 - - - - - 1.0000 - - 1,000.00 Site Maint. Equip. - - - - - - - 1.0903 - - 1,000.00 - - 1.0000
- - Boiler, Main Electrical
- - - - 1,000.00 - - 1.0903
- - - - - 1.0000 - FloorTotals
20,000.00 400.00 16,000.00 1,000.00 1,000.00 1,600.00 - - - - 1,600.00 - - - 1.0903 - - 1,000.00 - - 1.0000
-
- - Suite 100 10,000.00 - - 10,000.00 - 1.0245 10,245.40 1.0903 1.1171 11,171.04 - 11,931.45 1.1931 1.1931 11,931.45 - - Suite 110 4,000.00 - - 4,000.00 - 1.0245 4,098.16 1.0903 1.1171 4,468.41 - 4,772.58 1.1931 1.1931 4,772.58 - - Suite 115 1,800.00 - - 1,800.00 - 1.0245 1,844.17 1.0903 1.1171 2,010.79 - 2,147.66 1.1931 1.1931 2,147.66 - - Vending area - 500.00 - 500.00 - 1.0245 - 1.0903 1.1171 - - - 1.1931 1.1931 - - - Building lobby - - - - 1,000.00 1.0245 - 1.0903 1.1171 - - - 1.1931 1.1931 - - - Loading dock & trash - - - - 1,500.00 1.0245 - 1.0903 1.1171 - - - 1.1931 1.1931 -
FloorTotals
20,000.00 800.00 - - - 19,200.00 15,800.00 500.00 - 16,300.00 2,500.00 400.00 1.0245 16,187.73 1.0903 1.1171 17,650.24 - 18,851.69 1.1931 1.1931 18,851.69
- - Suite 200 8,000.00 - - 8,000.00 - 1.1029 8,823.53 1.0903 1.2026 9,620.71 - 10,275.59 1.2844 1.2500 10,000.00 - - Suite 250 7,000.00 - - 7,000.00 - 1.1029 7,720.59 1.0903 1.2026 8,418.12 - 8,991.14 1.2844 1.2500 8,750.00 - - Conference Center - - 2,000.00 2,000.00 - 1.1029 2,205.88 1.0903 1.2026 - 2,405.18 - 1.2844 1.2500 -
FloorTotals
19,550.00 800.00 - - - 18,750.00 15,000.00 - 2,000.00 17,000.00 - 1,750.00 1.1029 18,750.00 1.0903 1.2026 18,038.82 2,405.18 19,266.72 1.2844 1.2500 18,750.00
- - Suite 300 18,400.00 - - 18,400.00 - 1.0408 19,150.00 1.0903 1.1348 20,880.14 - 22,301.45 1.2120 1.2120 22,301.45 - - - - - - - 1.0408 - 1.0903 1.1348 - - - 1.2120 1.2120 - - - - - - - - 1.0408 - 1.0903 1.1348 - - - 1.2120 1.2120 -
FloorTotals
20,000.00 850.00 - - - 19,150.00 18,400.00 - - 18,400.00 - 750.00 1.0408 19,150.00 1.0903 1.1348 20,880.14 - 22,301.45 1.2120 1.2120 22,301.45
- - Suite 400 11,000.00 - - 11,000.00 - 1.1009 12,109.51 1.0903 1.2003 13,203.56 - 14,102.33 1.2820 1.2500 13,750.00
- - Suite 400 Restr. Hdrm.
350.00 - - 350.00 - 1.1009 385.30 1.0903
1.2003 420.11 - 448.71 1.2820 1.2500 437.50 - - Suite 450 6,000.00 - - 6,000.00 - 1.1009 6,605.19 1.0903 1.2003 7,201.94 - 7,692.18 1.2820 1.2500 7,500.00
FloorTotals
20,000.00 900.00 - - - 19,100.00 17,350.00 - - 17,350.00 - 1,750.00 1.1009 19,100.00 1.0903 1.2003 20,825.62 - 22,243.22 1.2820 1.2500 21,687.50
100.00 - Occupant Storage PH - - - - - - - 1.0903 - - - - - 1.0000 - - - Mechanical - - - - 2,000.00 - - 1.0903 - - - - - 1.0000 -
FloorTotals
2,500.00 400.00 - 100.00 - 2,000.00 - - - - 2,000.00 - - - 1.0903 - -
- - - 1.0000 -
BuildingTotals
(Σ)102,050.00 4,150.00 16,000.00 1,100.00 1,000.00 79,800.00 66,550.00 500.00 2,000.00 69,050.00 6,100.00 4,650.00 73,187.73 1.0903 77,394.82 3,405.18 82,663.08 81,590.63
To IBSAAllocationWorksheet
With IBSALoad Factor
To IBSAAllocationWorksheet
EffectiveLoad
Factor
Optional AdjustmentFinal Calculations
IBSAAreas
BuildingRentable
Area
Intermediate Allocations (not for leasing)
CappedLoad
Factor
CappedRentable
Area
LoadFactor
A
Values in this table represent (check one) square feet square metersNo modification of shaded cell content is allowed. Preliminary Calculations and IntermediateAllocations are not for leasing. Copyright © 2013 by BOMA International. All rights reserved.
Preliminary Calculations (not for leasing)
OccupantStorage
Occupant +AllocatedArea ( O )
R/ORatio
Inter-BuildingAmenity
Areas
Inter-BuildingServiceAreas
SpaceID
OccupantArea
BuildingAmenity
Areas
UsableArea( U )
BuildingServiceAreas
InteriorGrossArea
MajorVertical
PenetrationsParking
R/URatio
P.H.
FloorService &Amenity
Areas
Bsmt.
1
2
3
FloorLevel
4
PrelimaryFloorArea

BOMA Multi-Building SetGlobal Summary of Areas
ExampleB2-Method A
Printed: 12/30/2013
GSA-IBSA-131209.xlsx, B2-Method A
A B C D E F G H I J K L M N O P Q R S T U V W XInput Measure Measure Measure Measure Measure =B-C-D-E-F Input Measure Measure Measure = I + J + K Measure = G - L -M =(L+N)/L = (I+K) * O = ΣG/ΣP = O * Q = R * I =R*K+F =S * =U * R 1.1900 = I * W
1.08553493
RentableArea
- - Suite 100 10,000.00 - - 10,000.00 - 1.1013 11,012.66 1.0259 1.1297 11,297.47 - 12,263.80 1.2264 1.1900 11,900.00 - - Suite 110 4,000.00 - - 4,000.00 - 1.1013 4,405.06 1.0259 1.1297 4,518.99 - 4,905.52 1.2264 1.1900 4,760.00
- - Suite 150 1,800.00 - - 1,800.00 - 1.1013 1,982.28 1.0259 1.1297 2,033.54 - 2,207.48 1.2264 1.1900 2,142.00 - - Building Lobby - - - - 600.00 1.1013 - 1.0259 1.1297 - - - 1.2264 1.1900 - - Loading dock & trash - - - - 1,200.00 1.1013 - 1.0259 1.1297 - - - 1.2264 1.1900 -
FloorTotals
20,000.00 800.00 - - - 19,200.00 15,800.00 - - 15,800.00 1,800.00 1,600.00 1.1013 17,400.00 1.0259 1.1297 17,850.00 - 19,376.80 1.2264 1.1900 18,802.00
- - Suite 200 8,000.00 - - 8,000.00 - 1.1029 8,823.53 1.0259 1.1315 9,051.72 - 9,825.96 1.2282 1.1900 9,520.00 - - Suite 250 5,000.00 - - 5,000.00 - 1.1029 5,514.71 1.0259 1.1315 5,657.33 - 6,141.23 1.2282 1.1900 5,950.00 - - Suite 280 4,000.00 - - 4,000.00 - 1.1029 4,411.76 1.0259 1.1315 4,525.86 - 4,912.98 1.2282 1.1900 4,760.00
FloorTotals
19,550.00 800.00 - - - 18,750.00 17,000.00 - - 17,000.00 - 1,750.00 1.1029 18,750.00 1.0259 1.1315 19,234.91 - 20,880.17 1.2282 1.1900 20,230.00
- - Suite 300 18,400.00 - - 18,400.00 - 1.0408 19,150.00 1.0259 1.0677 19,645.26 - 21,325.61 1.1590 1.1590 21,325.61 - - - - - - - 1.0408 - 1.0259 1.0677 - - - 1.1590 1.1590 - - - - - - - - 1.0408 - 1.0259 1.0677 - - - 1.1590 1.1590 -
FloorTotals
20,000.00 850.00 - - - 19,150.00 18,400.00 - - 18,400.00 - 750.00 1.0408 19,150.00 1.0259 1.0677 19,645.26 - 21,325.61 1.1590 1.1590 21,325.61
- - Suite 400 11,000.00 - - 11,000.00 - 1.1009 12,109.51 1.0259 1.1293 12,422.69 - 13,485.26 1.2259 1.1900 13,090.00 - - Suite 400 Restr. Hdrm. 350.00 - - 350.00 - 1.1009 385.30 1.0259 1.1293 395.27 - 429.08 1.2259 1.1900 416.50 - - Suite 450 6,000.00 - - 6,000.00 - 1.1009 6,605.19 1.0259 1.1293 6,776.01 - 7,355.60 1.2259 1.1900 7,140.00
FloorTotals
20,000.00 900.00 - - - 19,100.00 17,350.00 - - 17,350.00 - 1,750.00 1.1009 19,100.00 1.0259 1.1293 19,593.97 - 21,269.93 1.2259 1.1900 20,646.50
- - Suite 500 11,350.00 - - 11,350.00 - 1.1009 12,494.81 1.0259 1.1293 12,817.95 - 13,914.34 1.2259 1.1900 13,506.50 - - Suite 550 6,000.00 - - 6,000.00 - 1.1009 6,605.19 1.0259 1.1293 6,776.01 - 7,355.60 1.2259 1.1900 7,140.00 - - - - - - 1.1009 - 1.0259 1.1293 - - - 1.2259 1.1900 -
FloorTotals
20,000.00 900.00 - - - 19,100.00 17,350.00 - - 17,350.00 - 1,750.00 1.1009 19,100.00 1.0259 1.1293 19,593.97 - 21,269.93 1.2259 1.1900 20,646.50
- - Suite 600 8,000.00 - - 8,000.00 - 1.1105 8,883.72 1.0259 1.1392 9,113.47 - 9,892.99 1.2366 1.1900 9,520.00 - - Suite 620 4,000.00 - - 4,000.00 - 1.1105 4,441.86 1.0259 1.1392 4,556.74 - 4,946.50 1.2366 1.1900 4,760.00 - - Suite 680 5,200.00 - - 5,200.00 - 1.1105 5,774.42 1.0259 1.1392 5,923.76 - 6,430.45 1.2366 1.1900 6,188.00
FloorTotals
20,000.00 900.00 - - - 19,100.00 17,200.00 - - 17,200.00 - 1,900.00 1.1105 19,100.00 1.0259 1.1392 19,593.97 - 21,269.93 1.2366 1.1900 20,468.00
- - Suite 700 18,400.00 - - 18,400.00 - 1.0380 19,100.00 1.0259 1.0649 19,593.97 - 21,269.93 1.1560 1.1560 21,269.93 - - - - - - - 1.0380 - 1.0259 1.0649 - - - 1.1560 1.1560 - - - - - - - - 1.0380 - 1.0259 1.0649 - - - 1.1560 1.1560 -
FloorTotals
20,000.00 900.00 - - - 19,100.00 18,400.00 - - 18,400.00 - 700.00 1.0380 19,100.00 1.0259 1.0649 19,593.97 - 21,269.93 1.1560 1.1560 21,269.93
- - Suite 800 18,400.00 - - 18,400.00 - 1.0380 19,100.00 1.0259 1.0649 19,593.97 - 21,269.93 1.1560 1.1560 21,269.93 - - - - - - - 1.0380 - 1.0259 1.0649 - - - 1.1560 1.1560 - - - - - - - - 1.0380 - 1.0259 1.0649 - - - 1.1560 1.1560 -
FloorTotals
20,000.00 900.00 - - - 19,100.00 18,400.00 - - 18,400.00 - 700.00 1.0380 19,100.00 1.0259 1.0649 19,593.97 - 21,269.93 1.1560 1.1560 21,269.93
- - Mechanical - - - - 2,100.00 - - 1.0259 - - - - - 1.0000 - - - - - - - - - - 1.0259 - - - - - 1.0000 -
FloorTotals
2,500.00 400.00 - - - 2,100.00 - - - - 2,100.00 - - - 1.0259 - -
- - - 1.0000 -
BuildingTotals
(Σ)162,050.00 7,350.00 - - - 154,700.00 139,900.00 - - 139,900.00 3,900.00 10,900.00 150,800.00 1.0259 154,700.00 - 167,932.25 164,658.48
With IBSALoad Factor
To IBSAAllocationWorksheet
Optional Adjustment
2
3
8
P.H.
BuildingRentable
Area
IBSAAreas
CappedLoad
Factor
CappedRentable
Area
1
EffectiveLoad
Factor
BuildingServiceAreas
FloorService &Amenity
Areas
6
7
Values in this table represent (check one) square feet square metersNo modification of shaded cell content is allowed. Preliminary Calculations and IntermediateAllocations are not for leasing. Copyright © 2013 by BOMA International. All rights reserved.
To IBSAAllocationWorksheet
R/URatio
Occupant +AllocatedArea ( O )
R/ORatio
5
4
Preliminary Calculations (not for leasing) Intermediate Allocations (not for leasing) Final Calculations
FloorLevel
InteriorGrossArea
MajorVertical
PenetrationsParking
OccupantStorage
Inter-BuildingServiceAreas
LoadFactor
A
PrelimaryFloorArea
SpaceID
OccupantArea
BuildingAmenity
Areas
Inter-BuildingAmenity
Areas
UsableArea( U )

BOMA Multi-Building SetGlobal Summary of Areas
ExampleB3-Method A
Printed: 12/30/2013
GSA-IBSA-131209.xlsx, B3-Method A
A B C D E F G H I J K L M N O P Q R S T U V W XInput Measure Measure Measure Measure Measure =B-C-D-E-F Input Measure Measure Measure = I + J + K Measure = G - L -M =(L+N)/L = (I+K) * O = ΣG/ΣP = O * Q = R * I =R*K+F =S * =U * R 1.1900 = I * W
1.08553493
RentableArea
- - Suite 100 3,000.00 - - 3,000.00 - 1.0440 3,131.87 1.0353 1.0808 3,242.44 - 3,519.78 1.1733 1.1733 3,519.78 - - Suite 120 4,000.00 - - 4,000.00 - 1.0440 4,175.82 1.0353 1.0808 4,323.25 - 4,693.04 1.1733 1.1733 4,693.04 - - Suite 130 6,500.00 - - 6,500.00 - 1.0440 6,785.71 1.0353 1.0808 7,025.28 - 7,626.19 1.1733 1.1733 7,626.19 - - Suite 140 2,300.00 - - 2,300.00 - 1.0440 2,401.10 1.0353 1.0808 2,485.87 - 2,698.50 1.1733 1.1733 2,698.50 - - Building lobby/lounge - - 1,500.00 1,500.00 1,500.00 1.0440 1,565.93 1.0353 1.0808 - 1,621.22 - 1.1733 1.1733 - - - Cafeteria - - 5,000.00 5,000.00 - 1.0440 5,219.78 1.0353 1.0808 - 5,404.06 - 1.1733 1.1733 - - - Health Club - - 5,000.00 5,000.00 - 1.0440 5,219.78 1.0353 1.0808 - 5,404.06 - 1.1733 1.1733 -
- - Fire Command center - - - - 600.00 1.0440 - 1.0353 1.0808 - - - 1.1733 1.1733 - - 1,000.00 Property Mgmt. office - - - - - 1.0440 - 1.0353 1.0808 - 1,000.00 - 1.1733 1.1733 - 1,500.00 Trash & loading dock - - - - 1,500.00 1.0440 - 1.0353 1.0808 - 1,500.00 - 1.1733 1.1733 -
FloorTotals
35,000.00 400.00 - - 2,500.00 32,100.00 15,800.00 - 11,500.00 27,300.00 3,600.00 1,200.00 1.0440 28,500.00 1.0353 1.0808 17,076.84 14,929.35 18,537.51 1.1733 1.1733 18,537.51
- - Suite 200 10,000.00 - - 10,000.00 - 1.1030 11,030.30 1.0353 1.1420 11,419.73 - 12,396.51 1.2397 1.1900 11,900.00 - - Suite 250 4,000.00 - - 4,000.00 - 1.1030 4,412.12 1.0353 1.1420 4,567.89 - 4,958.61 1.2397 1.1900 4,760.00 - - Suite 280 2,500.00 - - 2,500.00 - 1.1030 2,757.58 1.0353 1.1420 2,854.93 - 3,099.13 1.2397 1.1900 2,975.00 - - - - - - - 1.1030 - 1.0353 1.1420 - - - 1.2397 1.1900 - - - - - - - 1.1030 - 1.0353 1.1420 - - - 1.2397 1.1900 - - - - - - - 1.1030 - 1.0353 1.1420 - - - 1.2397 1.1900 -
FloorTotals
19,000.00 800.00 - - - 18,200.00 16,500.00 - - 16,500.00 - 1,700.00 1.1030 18,200.00 1.0353 1.1420 18,842.55 - 20,454.25 1.2397 1.1900 19,635.00
- - Suite 300 8,000.00 - - 8,000.00 - 1.1003 8,802.29 1.0353 1.1391 9,113.06 - 9,892.54 1.2366 1.1900 9,520.00 - - Suite 350 9,450.00 - - 9,450.00 - 1.1003 10,397.71 1.0353 1.1391 10,764.80 - 11,685.57 1.2366 1.1900 11,245.50 - - - - - - - 1.1003 - 1.0353 1.1391 - - - 1.2366 1.1900 -
FloorTotals
20,000.00 800.00 - - - 19,200.00 17,450.00 - - 17,450.00 - 1,750.00 1.1003 19,200.00 1.0353 1.1391 19,877.86 - 21,578.11 1.2366 1.1900 20,765.50
- - Suite 400 18,400.00 - - 18,400.00 - 1.0408 19,150.00 1.0353 1.0775 19,826.09 - 21,521.92 1.1697 1.1697 21,521.92 - - - - - - - 1.0408 - 1.0353 1.0775 - - - 1.1697 1.1697 - - - - - - - - 1.0408 - 1.0353 1.0775 - - - 1.1697 1.1697 -
FloorTotals
20,000.00 850.00 - - - 19,150.00 18,400.00 - - 18,400.00 - 750.00 1.0408 19,150.00 1.0353 1.0775 19,826.09 - 21,521.92 1.1697 1.1697 21,521.92
- - Suite 500 11,000.00 - - 11,000.00 - 1.1009 12,109.51 1.0353 1.1397 12,537.04 - 13,609.39 1.2372 1.1900 13,090.00 - - Suite 530 2,350.00 - - 2,350.00 - 1.1009 2,587.03 1.0353 1.1397 2,678.37 - 2,907.46 1.2372 1.1900 2,796.50 - - Suite 550 4,000.00 - - 4,000.00 - 1.1009 4,403.46 1.0353 1.1397 4,558.92 - 4,948.87 1.2372 1.1900 4,760.00
FloorTotals
20,000.00 900.00 - - - 19,100.00 17,350.00 - - 17,350.00 - 1,750.00 1.1009 19,100.00 1.0353 1.1397 19,774.33 - 21,465.72 1.2372 1.1900 20,646.50
- - Suite 600 18,400.00 - - 18,400.00 - 1.0380 19,100.00 1.0353 1.0747 19,774.33 - 21,465.72 1.1666 1.1666 21,465.72 - - - - - - - 1.0380 - 1.0353 1.0747 - - - 1.1666 1.1666 - - - - - - - - 1.0380 - 1.0353 1.0747 - - - 1.1666 1.1666 -
FloorTotals
20,000.00 900.00 - - - 19,100.00 18,400.00 - - 18,400.00 - 700.00 1.0380 19,100.00 1.0353 1.0747 19,774.33 - 21,465.72 1.1666 1.1666 21,465.72
- - Suite 700 18,400.00 - - 18,400.00 - 1.0380 19,100.00 1.0353 1.0747 19,774.33 - 21,465.72 1.1666 1.1666 21,465.72 - - - - - - - 1.0380 - 1.0353 1.0747 - - - 1.1666 1.1666 - - - - - - - - 1.0380 - 1.0353 1.0747 - - - 1.1666 1.1666 -
FloorTotals
20,000.00 900.00 - - - 19,100.00 18,400.00 - - 18,400.00 - 700.00 1.0380 19,100.00 1.0353 1.0747 19,774.33 - 21,465.72 1.1666 1.1666 21,465.72
- - Suite 800 18,400.00 - - 18,400.00 - 1.0380 19,100.00 1.0353 1.0747 19,774.33 - 21,465.72 1.1666 1.1666 21,465.72 - - - - - - - 1.0380 - 1.0353 1.0747 - - - 1.1666 1.1666 - - - - - - - - 1.0380 - 1.0353 1.0747 - - - 1.1666 1.1666 -
FloorTotals
20,000.00 900.00 - - - 19,100.00 18,400.00 - - 18,400.00 - 700.00 1.0380 19,100.00 1.0353 1.0747 19,774.33 - 21,465.72 1.1666 1.1666 21,465.72
- Mechanical - - - - 2,100.00 - - 1.0353 - - - - - 1.0000 - - - - - - - - - - 1.0353 - - - - - 1.0000 -
FloorTotals
2,500.00 400.00 - - - 2,100.00 - - - - 2,100.00 - - - 1.0353 - -
- - - 1.0000 -
BuildingTotals
(Σ)176,500.00 6,850.00 - - 2,500.00 167,150.00 140,700.00 - 11,500.00 152,200.00 5,700.00 9,250.00 161,450.00 1.0353 154,720.65 14,929.35 167,954.67 165,503.59
3
4
8
P.H.
BuildingRentable
Area
1
2
BuildingServiceAreas
6
5
7
FloorLevel
MajorVertical
PenetrationsParking
OccupantStorage
Inter-BuildingServiceAreas
No modification of shaded cell content is allowed. Preliminary Calculations and IntermediateAllocations are not for leasing. Copyright © 2013 by BOMA International. All rights reserved.
To IBSAAllocationWorksheet
With IBSALoad Factor
To IBSAAllocationWorksheet
Optional Adjustment
IBSAAreas
CappedLoad
Factor
CappedRentable
Area
EffectiveLoadFactor
FloorService &Amenity
Areas
R/URatio
Occupant +AllocatedArea ( O )
UsableArea( U )
Values in this table represent (check one) square feet square meters
Final Calculations
InteriorGrossArea
Preliminary Calculations (not for leasing) Intermediate Allocations (not for leasing)
R/ORatio
LoadFactor
A
PrelimaryFloorArea
SpaceID
OccupantArea
BuildingAmenity
Areas
Inter-BuildingAmenity
Areas

BOMA Multi-Building SetGlobal Summary of Areas
ExampleB4-Method A
Printed: 12/30/2013
GSA-IBSA-131209.xlsx, B4-Method A
A B C D E F G H I J K L M N O P Q R S T U V W XInput Measure Measure Measure Measure Measure =B-C-D-E-F Input Measure Measure Measure = I + J + K Measure = G - L -M =(L+N)/L = (I+K) * O = ΣG/ΣP = O * Q = R * I =R*K+F =S * =U * R 1.1900 = I * W
1
RentableArea
- 500.00 Parking office - - - - - - - - - - 500.00 - - 1.0000 - 800.00 Site security office - - - - - - - - - - 800.00 - - 1.0000 -
- 1,700.00 Maintenance office - - - - - - - - - - 1,700.00 - - 1.0000 - - 9,500.00 HVAC (boiler , chillers…) - - - - - - - - - - 9,500.00 - - 1.0000 - 900.00 Emergency generator - - - - - - - - - - 900.00 - - 1.0000 -
FloorTotals
30,000.00 600.00 16,000.00 - 13,400.00 - - - - - - - - - - - - 13,400.00 - - 1.0000 -
1,200.00 - Occupant Storage - - - - - - - - - - - - - 1.0000 - - - - - - - - - - - - - - - - 1.0000 - - - - - - - - - - - - - - - - 1.0000 -
FloorTotals
30,000.00 600.00 28,200.00 1,200.00 - - - - - - - - - - - - - - - - 1.0000 -
1,200.00 - Occupant Storage - - - - - - - - - - - - - 1.0000 - - - - - - - - - - - - - - - - 1.0000 -
FloorTotals
30,000.00 600.00 28,200.00 1,200.00 - - - - - - - - - - - - -
- - - 1.0000 -
BuildingTotals
(Σ)90,000.00 1,800.00 72,400.00 2,400.00 13,400.00 - - - - - - - - - - 13,400.00 - -
Optional Adjustment
EffectiveLoad
Factor
CappedLoad
Factor
CappedRentable
Area
To IBSAAllocationWorksheet
To IBSAAllocationWorksheet
Values in this table represent (check one) square feet square metersNo modification of shaded cell content is allowed. Preliminary Calculations and IntermediateAllocations are not for leasing. Copyright © 2013 by BOMA International. All rights reserved.
With IBSALoad Factor
3
BuildingRentable
Area
IBSAAreas
1
2
BuildingServiceAreas
FloorService &Amenity
Areas
R/URatio
Occupant +AllocatedArea ( O )
R/ORatio
Preliminary Calculations (not for leasing) Intermediate Allocations (not for leasing) Final Calculations
FloorLevel
InteriorGrossArea
MajorVertical
PenetrationsParking
OccupantStorage
Inter-BuildingServiceAreas
LoadFactor
A
PrelimaryFloorArea
SpaceID
OccupantArea
BuildingAmenity
Areas
Inter-BuildingAmenity
Areas
UsableArea( U )

BOMA Multi-Building SetIBSA Allocation Worksheet
ExampleIBSA Allocations Method A
Printed: 12/30/2013
GSA-IBSA-131209.xlsx, IBSA Allocations Method A
123456789
101112131415161718192021222324
25
26
2728
29
30
31
A B C D E F G H I
B1 B2 B3 B4 Totals77,394.82 154,700.00 154,720.65 - 386,815.47
B1 - Fl. 00 Site Maint. Equip. 1,000.00 Service 200.08 399.93 399.99 - 1,000.00 B1 - Fl. 02 Conference Center 2,405.18 Amenity 481.23 961.91 962.04 - 2,405.18 B1 Subtotal 3,405.18 681.31 1,361.84 1,362.02 - 3,405.18 B3 - Fl. 01 Property Mgmt. office 1,000.00 Service 200.08 399.93 399.99 - 1,000.00 B3 - Fl. 01 Trash & loading dock 1,500.00 Service 300.12 599.90 599.98 - 1,500.00 B3 - Fl. 01 Building lobby/lounge 1,621.22 Amenity 324.38 648.38 648.46 - 1,621.22 B3 - Fl. 01 Cafeteria * 5,404.06 Amenity - 2,701.85 2,702.21 - 5,404.06 B3 - Fl. 01 Health Club 5,404.06 Amenity 1,081.26 2,161.26 2,161.55 - 5,404.06 B3 Subtotal 14,929.35 1,905.84 6,511.32 6,512.19 - 14,929.35 B4 - Fl. 01 Parking office 500.00 Service 100.04 199.97 199.99 - 500.00 B4 - Fl. 01 Site security office 800.00 Service 160.07 319.95 319.99 - 800.00 B4 - Fl. 01 Maintenance office 1,700.00 Service 340.14 679.88 679.98 - 1,700.00 B4 - Fl. 01 HVAC (boiler , chillers…) 9,500.00 Service 1,900.78 3,799.36 3,799.86 - 9,500.00 B4 - Fl. 01 Emergency generator 900.00 Service 180.07 359.94 359.99 - 900.00 B4 Subtotal 13,400.00 2,681.10 5,359.09 5,359.81 - 13,400.00
31,734.53 5,268.25 13,232.25 13,234.02 - 31,734.53 1.06806982 1.08553493 1.08553493 1.00000000
82,663.08 167,932.25 167,954.67 - 418,550.00 82,663.08 167,932.25 167,954.67 - 418,550.00
Building Rentable Areas and IBSA Area AllocationsBuilding& Floor
Inter-Building Service & Amenity (IBSA) Areas
Space IDIBSAArea
IBSAType
Some formulas in this spreadsheet will vary depending on the number of buildings (columns) in the multi-building set, the number of inter-building service and amenity areas (rows) and the method of allocation of each of those IBSA areas among the buildings. However, it is essential that 100% of each IBSA area, no more and no less, is allocated to the buildings in the multi-building set.
For each building in this example,the Inter-Building Load Factor (row 20) is the sum of the Building Rentable Area (Row 3) and the Total IBSA Area (Row 19), divided by the Building Rentable Area (row 3). This value, which will always be equal or greater than one, is transferred to the top of Column T of the Method A Multi-Building Set Global Sumary of Areas Spreadsheet (Column O for Method B).
Total IBSA Areas
For each building in this example, the Rentable Area (row 21) is the product of its Building Rentable Area (Row 3) and its Inter-Building Load Factor (Row 20).
For each building in this example, the Rentable Area Check (row 22) is its Rentable Area from the total of Column U of the Method A Multi-Building Set Global Summary of Areas spreadsheet (Column P for Method B). The vertically adjacent values in Rows 21 & 22 must be the same.
For each building in this example, the Building Rentable Area (row 3) is taken from the total of column S of the Method A Multi-Building Set Global Summary of Area Spreadsheet (Column N for Method B).Each IBSA Area (Column C) in this example is taken from column T of the Method A Multi-Building Set Global Summary of Area spreadsheet (column O for Method B). The subtotals (row 6, 12 & 18 in this example) are only for convenience and are not required.For each building in this example, the Total IBSA Areas (row 19) is the sum of the individual IBSA allocations in the column.
No modification of shaded cell content is allowed. Copyright © 2013 by BOMA International. All rights reserved.
Inter-Building Load Factor: Rentable Area:
Rentable Area Check:Values in this table represent (check one) square feet square meters

BOMA Multi-Building SetGlobal Summary of Areas
ExampleB1-Method B
Printed: 12/30/2013
GSA-IBSA-131209.xlsx, B1-Method B
InformationONLY
A B C D E F G H I J K L M N O P Q R S TInput Measure Measure Measure Measure Measure =B-C-D-E-F Input Measure Measure Measure =G-I-J-K =ΣG / (ΣI+ΣJ) = M * I =M*J+F = N * = P * M 1.2500 = I * R =S/(I+K)
1.0687507
FloorLevel
RentableArea
500.00 - Occupant Storage A - - 1.1813 - - - 1.2626 1.2500 - 500.00 - Occupant Storage B - - 1.1813 - - - 1.2626 1.2500 -
- 1,000.00 Site Maint. Equip. - - 1.1813 - 1,000.00 - 1.2626 1.2500 - - - - - 1.1813 - - - 1.2626 1.2500 -
FloorTotals 20,000.00 400.00 16,000.00 1,000.00 1,000.00 1,600.00 - - - 1,600.00 1.1813 - 1,000.00 - 1.2626 1.2500 - -
- - Suite 100 10,000.00 - 1.1813 11,813.47 - 12,625.66 1.2626 1.2500 12,500.00 - - Suite 110 4,000.00 - 1.1813 4,725.39 - 5,050.26 1.2626 1.2500 5,000.00 - - Suite 150 1,800.00 - 1.1813 2,126.42 - 2,272.62 1.2626 1.2500 2,250.00 - - - - 1.1813 - - - 1.2626 1.2500 - - - - - 1.1813 - - - 1.2626 1.2500 - - - - - 1.1813 - - - 1.2626 1.2500 -
FloorTotals 20,000.00 800.00 - - - 19,200.00 15,800.00 - 500.00 2,900.00 1.1813 18,665.28 - 19,948.54 1.2626 1.2500 19,750.00 1.2117
- - Suite 200 8,000.00 - 1.1813 9,450.78 - 10,100.52 1.2626 1.2500 10,000.00 - - Suite 250 7,000.00 - 1.1813 8,269.43 - 8,837.96 1.2626 1.2500 8,750.00 - - Conference Center - 2,000.00 1.1813 - 2,362.69 - 1.2626 1.2500 -
FloorTotals 19,550.00 800.00 - - - 18,750.00 15,000.00 2,000.00 1,000.00 750.00 1.1813 17,720.21 2,362.69 18,938.48 1.2626 1.2500 18,750.00 1.1719
- - Suite 300 17,400.00 - 1.1813 20,555.44 - 21,968.64 1.2626 1.2500 21,750.00 - - - - 1.1813 - - - 1.2626 1.2500 - - - - - 1.1813 - - - 1.2626 1.2500 -
FloorTotals 20,000.00 850.00 - - - 19,150.00 17,400.00 - 1,000.00 750.00 1.1813 20,555.44 - 21,968.64 1.2626 1.2500 21,750.00 1.1821
- - Suite 400 11,000.00 - 1.1813 12,994.82 - 13,888.22 1.2626 1.2500 13,750.00 - - Suite 400 Restr. Hdrm. 350.00 - 1.1813 413.47 - 441.90 1.2626 1.2500 437.50 - - Suite 450 6,000.00 - 1.1813 7,088.08 - 7,575.39 1.2626 1.2500 7,500.00
FloorTotals 20,000.00 900.00 - - - 19,100.00 17,350.00 - 1,000.00 750.00 1.1813 20,496.37 - 21,905.51 1.2626 1.2500 21,687.50 1.1819
100.00 - Occupant Storage PH - - 1.1813 - - - 1.2626 1.2500 - - - - - 1.1813 - - - 1.2626 1.2500 -
FloorTotals 2,500.00 400.00 - 100.00 - 2,000.00 - - - 2,000.00 1.1813 - - - 1.2626 1.2500 - -
BuildingTotals
(Σ)102,050.00 4,150.00 16,000.00 1,100.00 1,000.00 79,800.00 65,550.00 2,000.00 3,500.00 8,750.00 1.1813 77,437.31 3,362.69 82,761.17 1.2626 1.2500 81,937.50
2
CappedLoad
Factor
CappedRentable
Area
FullFloor
EquivalentFactor
EffectiveLoad
Factor
1
Optional Adjustment
3
Final Calculations
With IBSALoad Factor
BaseBuilding
Circulation
Service &Amenity
Areas
LoadFactor
B
BuildingRentable
Area
Inter-BuildingServiceAreas
PreliminaryFloorArea
SpaceID
OccupantArea
Inter-BuildingAmenity
Areas
4
P.H.
Bsmt.
Values in this table represent (check one) square feet square metersNo modification of shaded cell content is allowed. Preliminary Calculations and IntermediateAllocations are not for leasing. Copyright © 2013 by BOMA International. All rights reserved.
IBSAAreas
Preliminary Calculations (not for leasing) Preliminary Calculations
InteriorGrossArea
MajorVertical
PenetrationsParking
OccupantStorage
To IBSAAllocationWorksheet
To IBSAAllocationWorksheet

BOMA Multi-Building SetGlobal Summary of Areas
ExampleB2-Method B
Printed: 12/30/2013
GSA-IBSA-131209.xlsx, B2-Method B
InformationONLY
A B C D E F G H I J K L M N O P Q R S TInput Measure Measure Measure Measure Measure =B-C-D-E-F Input Measure Measure Measure =G-I-J-K =ΣG / (ΣI+ΣJ) = M * I =M*J+F = N * = P * M 1.2500 = I * R =S/(I+K)
1.086976176
FloorLevel
RentableArea
- - Suite 100 10,000.00 - 1.1300 11,300.22 - 12,283.07 1.2283 1.2283 12,283.07 - - Suite 110 4,000.00 - 1.1300 4,520.09 - 4,913.23 1.2283 1.2283 4,913.23
- - Suite 150 1,800.00 - 1.1300 2,034.04 - 2,210.95 1.2283 1.2283 2,210.95 - - - - 1.1300 - - - 1.2283 1.2283 -
FloorTotals 20,000.00 800.00 - - - 19,200.00 15,800.00 - - 3,400.00 1.1300 17,854.35 - 19,407.25 1.2283 1.2283 19,407.25 1.2283
- - Suite 200 8,000.00 - 1.1300 9,040.18 - 9,826.46 1.2283 1.2283 9,826.46 - - Suite 250 5,000.00 - 1.1300 5,650.11 - 6,141.53 1.2283 1.2283 6,141.53 - - Suite 280 4,000.00 - 1.1300 4,520.09 - 4,913.23 1.2283 1.2283 4,913.23 - - - - 1.1300 - - - 1.2283 1.2283 - - - - - 1.1300 - - - 1.2283 1.2283 - - - - - 1.1300 - - - 1.2283 1.2283 -
FloorTotals 19,550.00 800.00 - - - 18,750.00 17,000.00 - 500.00 1,250.00 1.1300 19,210.37 - 20,881.22 1.2283 1.2283 20,881.22 1.1932
- - Suite 300 17,400.00 - 1.1300 19,662.38 - 21,372.54 1.2283 1.2283 21,372.54 - - - - 1.1300 - - - 1.2283 1.2283 - - - - - 1.1300 - - - 1.2283 1.2283 -
FloorTotals 20,000.00 850.00 - - - 19,150.00 17,400.00 - 1,000.00 750.00 1.1300 19,662.38 - 21,372.54 1.2283 1.2283 21,372.54 1.1616
- - Suite 400 11,000.00 - 1.1300 12,430.24 - 13,511.38 1.2283 1.2283 13,511.38 - - Suite 400 Restr. Hdrm. 350.00 - 1.1300 395.51 - 429.91 1.2283 1.2283 429.91 - - Suite 450 6,000.00 - 1.1300 6,780.13 - 7,369.84 1.2283 1.2283 7,369.84
FloorTotals 20,000.00 900.00 - - - 19,100.00 17,350.00 - 1,000.00 750.00 1.1300 19,605.88 - 21,311.12 1.2283 1.2283 21,311.12 1.1614
- - Suite 500 11,350.00 - 1.1300 12,825.75 - 13,941.28 1.2283 1.2283 13,941.28 - - Suite 550 6,000.00 - 1.1300 6,780.13 - 7,369.84 1.2283 1.2283 7,369.84 - - - - 1.1300 - - - 1.2283 1.2283 -
FloorTotals 20,000.00 900.00 - - - 19,100.00 17,350.00 - 1,000.00 750.00 1.1300 19,605.88 - 21,311.12 1.2283 1.2283 21,311.12 1.1614
- - Suite 600 8,000.00 - 1.1300 9,040.18 - 9,826.46 1.2283 1.2283 9,826.46 - - Suite 620 4,000.00 - 1.1300 4,520.09 - 4,913.23 1.2283 1.2283 4,913.23 - - Suite 680 5,200.00 - 1.1300 5,876.11 - 6,387.20 1.2283 1.2283 6,387.20
FloorTotals 20,000.00 900.00 - - - 19,100.00 17,200.00 - 1,150.00 750.00 1.1300 19,436.38 - 21,126.88 1.2283 1.2283 21,126.88 1.1513
- - Suite 700 17,400.00 - 1.1300 19,662.38 - 21,372.54 1.2283 1.2283 21,372.54 - - - - 1.1300 - - - 1.2283 1.2283 - - - - - 1.1300 - - - 1.2283 1.2283 -
FloorTotals 20,000.00 900.00 - - - 19,100.00 17,400.00 - 1,000.00 700.00 1.1300 19,662.38 - 21,372.54 1.2283 1.2283 21,372.54 1.1616
- - Suite 800 17,400.00 - 1.1300 19,662.38 - 21,372.54 1.2283 1.2283 21,372.54 - - - - 1.1300 - - - 1.2283 1.2283 - - - - - 1.1300 - - - 1.2283 1.2283 -
FloorTotals 20,000.00 900.00 - - - 19,100.00 17,400.00 - 1,000.00 700.00 1.1300 19,662.38 - 21,372.54 1.2283 1.2283 21,372.54 1.1616
- - - 1.1300 - - - 1.2283 1.2283 - - - - - 1.1300 - - - 1.2283 1.2283 -
FloorTotals 2,500.00 400.00 - - - 2,100.00 - - - 2,100.00 1.1300 - - - 1.2283 1.2283 - -
BuildingTotals
(Σ)162,050.00 7,350.00 - - - 154,700.00 136,900.00 - 6,650.00 11,150.00 1.1300 154,700.00 - 168,155.21 1.2283 1.2283 168,155.21
To IBSAAllocationWorksheet
To IBSAAllocationWorksheet
With IBSALoad Factor
Values in this table represent (check one) square feet square metersNo modification of shaded cell content is allowed. Preliminary Calculations and IntermediateAllocations are not for leasing. Copyright © 2013 by BOMA International. All rights reserved.
6
5
4
P.H.
1
2
3
7
8
FullFloor
EquivalentFactor
SpaceID
OccupantArea
Inter-BuildingAmenity
Areas
BaseBuilding
Circulation
Service &Amenity
Areas
LoadFactor
B
BuildingRentable
Area
IBSAAreas
EffectiveLoad
Factor
CappedLoad
Factor
CappedRentable
Area
Preliminary Calculations (not for leasing) Preliminary Calculations Final Calculations Optional Adjustment
InteriorGrossArea
MajorVertical
PenetrationsParking
OccupantStorage
Inter-BuildingServiceAreas
PreliminaryFloorArea

BOMA Multi-Building SetGlobal Summary of Areas
ExampleB3-Method B
Printed: 12/30/2013
GSA-IBSA-131209.xlsx, B3-Method B
InformationONLY
A B C D E F G H I J K L M N O P Q R S TInput Measure Measure Measure Measure Measure =B-C-D-E-F Input Measure Measure Measure =G-I-J-K =ΣG / (ΣI+ΣJ) = M * I =M*J+F = N * = P * M 1.2500 = I * R =S/(I+K)
1.086976176
FloorLevel
RentableArea
- - Suite 100 3,000.00 - 1.1279 3,383.60 - 3,677.90 1.2260 1.2260 3,677.90 - - Suite 120 4,000.00 - 1.1279 4,511.47 - 4,903.86 1.2260 1.2260 4,903.86
- - Suite 130 6,500.00 - 1.1279 7,331.14 - 7,968.77 1.2260 1.2260 7,968.77 - - Suite 140 2,300.00 - 1.1279 2,594.10 - 2,819.72 1.2260 1.2260 2,819.72
- - Building lobby/lounge - 1,500.00 1.1279 - 1,691.80 - 1.2260 1.2260 - - - Cafeteria * - 5,000.00 1.1279 - 5,639.34 - 1.2260 1.2260 - - - Health Club - 5,000.00 1.1279 - 5,639.34 - 1.2260 1.2260 -
- 1,000.00 Property Mgmt. office - - 1.1279 - 1,000.00 - 1.2260 1.2260 - - 1,500.00 Trash & loading dock - - 1.1279 - 1,500.00 - 1.2260 1.2260 -
FloorTotals 35,000.00 400.00 - - 2,500.00 32,100.00 15,800.00 11,500.00 - 4,800.00 1.1279 17,820.31 15,470.48 19,370.25 1.2260 1.2260 19,370.25 1.2260
- - Suite 200 10,000.00 - 1.1279 11,278.68 - 12,259.65 1.2260 1.2260 12,259.65 - - Suite 250 4,000.00 - 1.1279 4,511.47 - 4,903.86 1.2260 1.2260 4,903.86 - - Suite 280 2,500.00 - 1.1279 2,819.67 - 3,064.91 1.2260 1.2260 3,064.91 - - - - 1.1279 - - - 1.2260 1.2260 - - - - - 1.1279 - - - 1.2260 1.2260 - - - - - 1.1279 - - - 1.2260 1.2260 -
FloorTotals 19,000.00 800.00 - - - 18,200.00 16,500.00 - 950.00 750.00 1.1279 18,609.82 - 20,228.43 1.2260 1.2260 20,228.43 1.1592
- - Suite 300 8,000.00 - 1.1279 9,022.94 - 9,807.72 1.2260 1.2260 9,807.72 - - Suite 350 9,450.00 - 1.1279 10,658.35 - 11,585.37 1.2260 1.2260 11,585.37 - - - 1.1279 - - - 1.2260 1.2260 -
FloorTotals 20,000.00 800.00 - - - 19,200.00 17,450.00 - 1,000.00 750.00 1.1279 19,681.29 - 21,393.10 1.2260 1.2260 21,393.10 1.1595
- - Suite 400 17,400.00 1.1279 19,624.90 - 21,331.80 1.2260 1.2260 21,331.80 - - 1.1279 - - - 1.2260 1.2260 - - - - 1.1279 - - - 1.2260 1.2260 -
FloorTotals 20,000.00 850.00 - - - 19,150.00 17,400.00 - 1,000.00 750.00 1.1279 19,624.90 - 21,331.80 1.2260 1.2260 21,331.80 1.1593
- - Suite 500 11,000.00 1.1279 12,406.55 - 13,485.62 1.2260 1.2260 13,485.62 - - Suite 530 2,350.00 1.1279 2,650.49 - 2,881.02 1.2260 1.2260 2,881.02 - - Suite 550 4,000.00 1.1279 4,511.47 - 4,903.86 1.2260 1.2260 4,903.86
FloorTotals 20,000.00 900.00 - - - 19,100.00 17,350.00 - 1,000.00 750.00 1.1279 19,568.51 - 21,270.50 1.2260 1.2260 21,270.50 1.1592
- - Suite 600 17,400.00 1.1279 19,624.90 - 21,331.80 1.2260 1.2260 21,331.80 - - 1.1279 - - - 1.2260 1.2260 - - - - 1.1279 - - - 1.2260 1.2260 -
FloorTotals 20,000.00 900.00 - - - 19,100.00 17,400.00 - 1,000.00 700.00 1.1279 19,624.90 - 21,331.80 1.2260 1.2260 21,331.80 1.1593
- - Suite 700 17,400.00 1.1279 19,624.90 - 21,331.80 1.2260 1.2260 21,331.80 - - 1.1279 - - - 1.2260 1.2260 - - - - 1.1279 - - - 1.2260 1.2260 -
FloorTotals 20,000.00 900.00 - - - 19,100.00 17,400.00 - 1,000.00 700.00 1.1279 19,624.90 - 21,331.80 1.2260 1.2260 21,331.80 1.1593
- - Suite 800 17,400.00 1.1279 19,624.90 - 21,331.80 1.2260 1.2260 21,331.80 - - - 1.1279 - - - 1.2260 1.2260 - - - - 1.1279 - - - 1.2260 1.2260 -
FloorTotals 20,000.00 900.00 - - - 19,100.00 17,400.00 - 1,000.00 700.00 1.1279 19,624.90 - 21,331.80 1.2260 1.2260 21,331.80 1.1593
- - - 1.1279 - - - 1.2260 1.2260 - - - - 1.1279 - - - 1.2260 1.2260 -
FloorTotals 2,500.00 400.00 - - - 2,100.00 - - - 2,100.00 1.1279 - - - 1.2260 1.2260 - -
BuildingTotals
(Σ)176,500.00 6,850.00 - - 2,500.00 167,150.00 136,700.00 11,500.00 6,950.00 12,000.00 1.1279 154,179.52 15,470.48 167,589.47 1.2260 1.2260 167,589.47
To IBSAAllocationWorksheet
To IBSAAllocationWorksheet
With IBSALoad Factor
Values in this table represent (check one) square feet square metersNo modification of shaded cell content is allowed. Preliminary Calculations and IntermediateAllocations are not for leasing. Copyright © 2013 by BOMA International. All rights reserved.
6
5
4
P.H.
1
2
3
7
8
FullFloor
EquivalentFactor
SpaceID
OccupantArea
Inter-BuildingAmenity
Areas
BaseBuilding
Circulation
Service &Amenity
Areas
LoadFactor
B
BuildingRentable
Area
IBSAAreas
EffectiveLoad
Factor
CappedLoad
Factor
CappedRentable
Area
Preliminary Calculations (not for leasing) Preliminary Calculations Final Calculations Optional Adjustment
InteriorGrossArea
MajorVertical
PenetrationsParking
OccupantStorage
Inter-BuildingServiceAreas
PreliminaryFloorArea

BOMA Multi-Building SetGlobal Summary of Areas
ExampleB4-Method B
Printed: 12/30/2013
GSA-IBSA-131209.xlsx, B4-Method B
InformationONLY
A B C D E F G H I J K L M N O P Q R S TInput Measure Measure Measure Measure Measure =B-C-D-E-F Input Measure Measure Measure =G-I-J-K =ΣG / (ΣI+ΣJ) = M * I =M*J+F = N * = P * M 1.2500 = I * R =S/(I+K)
1
FloorLevel
RentableArea
- 500.00 Parking office - - - - 500.00 - - 1.0000 - - 800.00 Site security office - - - - 800.00 - - 1.0000 -
- 1,700.00 Maintenance office - - - - 1,700.00 - - 1.0000 - - 9,500.00 HVAC (boiler , chillers…) - - - - 9,500.00 - - 1.0000 - - 900.00 Emergency generator - - - - 900.00 - - 1.0000 -
FloorTotals 30,000.00 600.00 16,000.00 - 13,400.00 - - - - - - - 13,400.00 - - 1.0000 - -
1,200.00 - Occupant Storage - - - - - 1.0000 - - - - - - - - - 1.0000 - - - - - - - - - 1.0000 - - - - - - - - - 1.0000 - - - - - - - - - 1.0000 - - - - - - - - - 1.0000 -
FloorTotals 30,000.00 600.00 28,200.00 1,200.00 - - - - - - - - - - 1.0000 - -
1,200.00 - Occupant Storage - - - - - - 1.0000 - - - - - - - - - 1.0000 -
FloorTotals 30,000.00 600.00 28,200.00 1,200.00 - - - - - - - - - - - 1.0000 - -
BuildingTotals
(Σ)90,000.00 1,800.00 72,400.00 2,400.00 13,400.00 - - - - - - - 13,400.00 - - 1.0000 -
To IBSAAllocationWorksheet
To IBSAAllocationWorksheet
With IBSALoad Factor
Values in this table represent (check one) square feet square metersNo modification of shaded cell content is allowed. Preliminary Calculations and IntermediateAllocations are not for leasing. Copyright © 2013 by BOMA International. All rights reserved.
1
2
3
FullFloor
EquivalentFactor
SpaceID
OccupantArea
Inter-BuildingAmenity
Areas
BaseBuilding
Circulation
Service &Amenity
Areas
LoadFactor
B
BuildingRentable
Area
IBSAAreas
EffectiveLoad
Factor
CappedLoad
Factor
CappedRentable
Area
Preliminary Calculations (not for leasing) Preliminary Calculations Final Calculations Optional Adjustment
InteriorGrossArea
MajorVertical
PenetrationsParking
OccupantStorage
Inter-BuildingServiceAreas
PreliminaryFloorArea
BOMA Multi-Building SetIBSA Allocation Worksheet
ExampleIBSA Allocations Method B
Printed: 12/30/2013
GSA-IBSA-131209.xlsx, IBSA Allocations Method B
123456789
101112131415161718192021222324
25
26
2728
29
30
31
A B C D E F G H I
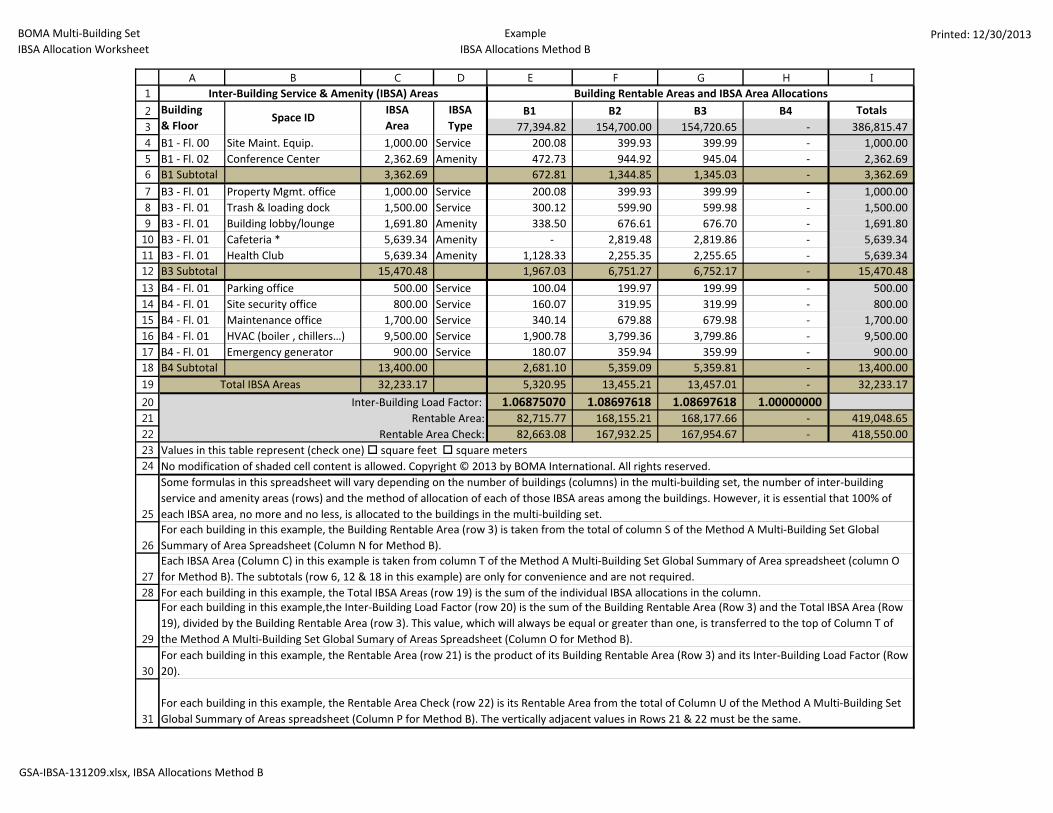
B1 B2 B3 B4 Totals77,394.82 154,700.00 154,720.65 - 386,815.47
B1 - Fl. 00 Site Maint. Equip. 1,000.00 Service 200.08 399.93 399.99 - 1,000.00 B1 - Fl. 02 Conference Center 2,362.69 Amenity 472.73 944.92 945.04 - 2,362.69 B1 Subtotal 3,362.69 672.81 1,344.85 1,345.03 - 3,362.69 B3 - Fl. 01 Property Mgmt. office 1,000.00 Service 200.08 399.93 399.99 - 1,000.00 B3 - Fl. 01 Trash & loading dock 1,500.00 Service 300.12 599.90 599.98 - 1,500.00 B3 - Fl. 01 Building lobby/lounge 1,691.80 Amenity 338.50 676.61 676.70 - 1,691.80 B3 - Fl. 01 Cafeteria * 5,639.34 Amenity - 2,819.48 2,819.86 - 5,639.34 B3 - Fl. 01 Health Club 5,639.34 Amenity 1,128.33 2,255.35 2,255.65 - 5,639.34 B3 Subtotal 15,470.48 1,967.03 6,751.27 6,752.17 - 15,470.48 B4 - Fl. 01 Parking office 500.00 Service 100.04 199.97 199.99 - 500.00 B4 - Fl. 01 Site security office 800.00 Service 160.07 319.95 319.99 - 800.00 B4 - Fl. 01 Maintenance office 1,700.00 Service 340.14 679.88 679.98 - 1,700.00 B4 - Fl. 01 HVAC (boiler , chillers…) 9,500.00 Service 1,900.78 3,799.36 3,799.86 - 9,500.00 B4 - Fl. 01 Emergency generator 900.00 Service 180.07 359.94 359.99 - 900.00 B4 Subtotal 13,400.00 2,681.10 5,359.09 5,359.81 - 13,400.00
32,233.17 5,320.95 13,455.21 13,457.01 - 32,233.17 1.06875070 1.08697618 1.08697618 1.00000000
82,715.77 168,155.21 168,177.66 - 419,048.65 82,663.08 167,932.25 167,954.67 - 418,550.00
No modification of shaded cell content is allowed. Copyright © 2013 by BOMA International. All rights reserved.
Inter-Building Service & Amenity (IBSA) Areas Building Rentable Areas and IBSA Area AllocationsBuilding& Floor
Space IDIBSAArea
IBSAType
Total IBSA AreasInter-Building Load Factor:
Rentable Area:Rentable Area Check:
Values in this table represent (check one) square feet square meters
For each building in this example, the Rentable Area Check (row 22) is its Rentable Area from the total of Column U of the Method A Multi-Building Set Global Summary of Areas spreadsheet (Column P for Method B). The vertically adjacent values in Rows 21 & 22 must be the same.
Some formulas in this spreadsheet will vary depending on the number of buildings (columns) in the multi-building set, the number of inter-building service and amenity areas (rows) and the method of allocation of each of those IBSA areas among the buildings. However, it is essential that 100% of each IBSA area, no more and no less, is allocated to the buildings in the multi-building set.For each building in this example, the Building Rentable Area (row 3) is taken from the total of column S of the Method A Multi-Building Set Global Summary of Area Spreadsheet (Column N for Method B).Each IBSA Area (Column C) in this example is taken from column T of the Method A Multi-Building Set Global Summary of Area spreadsheet (column O for Method B). The subtotals (row 6, 12 & 18 in this example) are only for convenience and are not required.For each building in this example, the Total IBSA Areas (row 19) is the sum of the individual IBSA allocations in the column.For each building in this example,the Inter-Building Load Factor (row 20) is the sum of the Building Rentable Area (Row 3) and the Total IBSA Area (Row 19), divided by the Building Rentable Area (row 3). This value, which will always be equal or greater than one, is transferred to the top of Column T of the Method A Multi-Building Set Global Sumary of Areas Spreadsheet (Column O for Method B).For each building in this example, the Rentable Area (row 21) is the product of its Building Rentable Area (Row 3) and its Inter-Building Load Factor (Row 20).

Floor Area Measurement Best Practices #3 Inter-Building Service and Amenity Areas in Campuses & Multi-Building Sets
Applicable to: BOMA 2010 Office Standard (ANSI/BOMA Z65.1–2010) Draft Issued: 15-Feb-2014
Illustrations There are three spreadsheets illustrated below as follows:
1. Method A Multi-Building Set Global Summary of Areas showing Excel™ formulas in each cell of the worksheet 2. Method B Multi-Building Set Global Summary of Areas showing Excel™ formulas in each cell of the worksheet 3. IBSA Allocation Worksheet showing Excel™ formulas that can be used for either Method A or Method B
The Multi-Building Set Global Summary of Areas spreadsheets are modifications of the Global Summary of Areas spreadsheets included in the BOMA 2010 Office Standard. The specific modifications are:
• A new column F to list inter-building service areas in each building
• A new column K in Method A (column J in Method B), to list inter-building amenity areas in each building
• Re-labeling of column S in Method A (column N in Method B) as building rentable area (excluding inter-building service and amenity area). The total of this column is exported to the IBSA Allocation Worksheet.
• A new column T in Method A (column O in Method B) that includes the measured area of all inter-building service areas in a building and the rentable area of all inter-building amenity areas in the building. For each building in a multi-building set, each IBSA area listed in column T of the Method A spreadsheet (column O in Method B) is exported to column C of the IBSA Allocation Worksheet.
• A new column U in Method A (column P in Method B) entitled Rentable Area. The unshaded cell at the top of this column contains the inter-building load factor that is computed for that building in the IBSA Allocation Worksheet. On each row below, that inter-building load factor is applied to the building rentable area in column S for Method A (column N in Method B) to calculate the rentable area of each occupant area listed in column H. Please note that the total rentable area of a building is NOT the sum of the totals of building rentable area and inter-building service and amenity area.
• A new column V in Method A (column Q in Method B) that calculates the effective load factor on each floor of a building. This value is the one that is capped when the option of applying a capped load factor is elected as directed in the BOMA 2010 Office Standard.
The IBSA Allocation Worksheet may be used with either Method A or Method B, or in multi-building sets that employ a mix of Method A & B in the measurement of the buildings therein. It calculates the inter-building load factor from the building rentable areas and inter-building service and amenity areas of each building in a multi-building set. The inter-building load factor is entered at the top of the rentable area column in the multi-building set global summary of areas spreadsheet for each building in order to calculate the rentable area of each suite and floor in each building.
Copyright 2014 by BOMA International

Floor Area Measurement Best Practices #3 Inter-Building Service and Amenity Areas in Campuses & Multi-Building Sets
Applicable to: BOMA 2010 Office Standard (ANSI/BOMA Z65.1–2010) Draft Issued: 15-Feb-2014
In addition the IBSA Allocation Worksheet performs a check sum of rentable areas of all the buildings in a multi-building set to ensure that their total equals the totals of the building rentable areas and inter-building service and amenity areas. This is a primary requirement for this Best Practice.
Some formulas in this spreadsheet will vary depending on the number of buildings (columns) in the multi-building set, the number of inter-building service and amenity areas (rows) and the method of allocation of each of those IBSA areas among the buildings.
Contributed By:
William Tracy, AIA, MBA / Building Area Measurement LLC
2
Copyright 2014 by BOMA International

BOMA Multi-Building SetGlobal Summary of Areas
ExampleFormulas-Method A
Printed: 12/30/2013
GSA-IBSA-131209.xlsx, Formulas-Method A
1234
5678910
11121314151617
18192021
22232425
26272829
303132
33
3435
36
A B C D E F G H I J K L M N O P Q R S T U V W X
A B C D E F G H I J K L M N O P Q R S T U V W XInput Measure Measure Measure Measure Measure =B-C-D-E-F Input Measure Measure Measure = I + J + K Measure = G - L -M =(L+N)/L = (I+K) * O = ΣG/ΣP = O * Q = R * I =R*K+F =S * =U * R INPUT = I * W
INPUT or LINK
RentableArea
INPUT INPUT INPUT INPUT INPUT INPUT =I6+J6+K6 INPUT =O$11 =(I6+K6)*O6 =$Q$34 =O6*Q6 =R6*I6 =R6*K6+F6 =IF(ISBLANK($U$4),1,(MAX($U$4,1)*S6)) =$V$11 =W$11 =I6*W6INPUT INPUT INPUT INPUT INPUT INPUT =I7+J7+K7 INPUT =O$11 =(I7+K7)*O7 =$Q$34 =O7*Q7 =R7*I7 =R7*K7+F7 =IF(ISBLANK($U$4),1,(MAX($U$4,1)*S7)) =$V$11 =W$11 =I7*W7INPUT INPUT INPUT INPUT INPUT INPUT =I8+J8+K8 INPUT =O$11 =(I8+K8)*O8 =$Q$34 =O8*Q8 =R8*I8 =R8*K8+F8 =IF(ISBLANK($U$4),1,(MAX($U$4,1)*S8)) =$V$11 =W$11 =I8*W8INPUT INPUT INPUT INPUT INPUT INPUT =I9+J9+K9 INPUT =O$11 =(I9+K9)*O9 =$Q$34 =O9*Q9 =R9*I9 =R9*K9+F9 =IF(ISBLANK($U$4),1,(MAX($U$4,1)*S9)) =$V$11 =W$11INPUT INPUT INPUT INPUT INPUT INPUT =I10+J10+K10 INPUT =O$11 =(I10+K10)*O10 =$Q$34 =O10*Q10 =R10*I10 =R10*K10+F10 =IF(ISBLANK($U$4),1,(MAX($U$4,1)*S10)) =$V$11 =W$11 =I10*W10
FloorTotals
INPUT INPUT INPUT=SUBTOTAL(9,E6:E10) =SUBTOTAL(9,F6:F10) =B11-C11-D11-E11-F11 =SUBTOTAL(9,I6:I10) =SUBTOTAL(9,J6:J10) =SUBTOTAL(9,K6:K10) =SUBTOTAL(9,L6:L10) =SUBTOTAL(9,M6:M10) =G11-L11-M11 =IF(L11>0,(L11+N11)/L11,0) =SUBTOTAL(9,P6:P10) =$Q$34 =O11*Q11 =SUBTOTAL(9,S6:S10) =SUBTOTAL(9,T6:T10) =SUBTOTAL(9,U6:U10) =IF(I11>0,U11/I11,0) =IF(ISBLANK(W$3),V11,MAX(MIN(V11,W$3),1)) =SUBTOTAL(9,X6:X10)
INPUT INPUT INPUT INPUT INPUT INPUT =I12+J12+K12 INPUT =O$18 =(I12+K12)*O12 =$Q$34 =O12*Q12 =R12*I12 =R12*K12+F12 =IF(ISBLANK($U$4),1,(MAX($U$4,1)*S12)) =$V$18 =W$18 =I12*W12INPUT INPUT INPUT INPUT INPUT INPUT =I13+J13+K13 INPUT =O$18 =(I13+K13)*O13 =$Q$34 =O13*Q13 =R13*I13 =R13*K13+F13 =IF(ISBLANK($U$4),1,(MAX($U$4,1)*S13)) =$V$18 =W$18 =I13*W13INPUT INPUT INPUT INPUT INPUT INPUT =I14+J14+K14 INPUT =O$18 =(I14+K14)*O14 =$Q$34 =O14*Q14 =R14*I14 =R14*K14+F14 =IF(ISBLANK($U$4),1,(MAX($U$4,1)*S14)) =$V$18 =W$18 =I14*W14INPUT INPUT INPUT INPUT INPUT INPUT =I15+J15+K15 INPUT =O$18 =(I15+K15)*O15 =$Q$34 =O15*Q15 =R15*I15 =R15*K15+F15 =IF(ISBLANK($U$4),1,(MAX($U$4,1)*S15)) =$V$18 =W$18 =I15*W15INPUT INPUT INPUT INPUT INPUT INPUT =I16+J16+K16 INPUT =O$18 =(I16+K16)*O16 =$Q$34 =O16*Q16 =R16*I16 =R16*K16+F16 =IF(ISBLANK($U$4),1,(MAX($U$4,1)*S16)) =$V$18 =W$18 =I16*W16INPUT INPUT INPUT INPUT INPUT INPUT =I17+J17+K17 INPUT =O$18 =(I17+K17)*O17 =$Q$34 =O17*Q17 =R17*I17 =R17*K17+F17 =IF(ISBLANK($U$4),1,(MAX($U$4,1)*S17)) =$V$18 =W$18 =I17*W17
FloorTotals
INPUT INPUT INPUT=SUBTOTAL(9,E12:E17) =SUBTOTAL(9,F12:F17) =B18-C18-D18-E18-F18 =SUBTOTAL(9,I12:I17) =SUBTOTAL(9,J12:J17) =SUBTOTAL(9,K12:K17) =SUBTOTAL(9,L12:L17) =SUBTOTAL(9,M12:M17) =G18-L18-M18 =IF(L18>0,(L18+N18)/L18,0) =SUBTOTAL(9,P12:P17) =$Q$34 =O18*Q18 =SUBTOTAL(9,S12:S17) =SUBTOTAL(9,T12:T17) =SUBTOTAL(9,U12:U17) =IF(I18>0,U18/I18,0) =IF(ISBLANK(W$3),V18,MAX(MIN(V18,W$3),1)) =SUBTOTAL(9,X12:X17)
INPUT INPUT INPUT INPUT INPUT INPUT =I19+J19+K19 INPUT =O$22 =(I19+K19)*O19 =$Q$34 =O19*Q19 =R19*I19 =R19*K19+F19 =IF(ISBLANK($U$4),1,(MAX($U$4,1)*S19)) =$V$22 =W$22 =I19*W19INPUT INPUT INPUT INPUT INPUT INPUT =I20+J20+K20 INPUT =O$22 =(I20+K20)*O20 =$Q$34 =O20*Q20 =R20*I20 =R20*K20+F20 =IF(ISBLANK($U$4),1,(MAX($U$4,1)*S20)) =$V$22 =W$22 =I20*W20INPUT INPUT INPUT INPUT INPUT INPUT =I21+J21+K21 INPUT =O$22 =(I21+K21)*O21 =$Q$34 =O21*Q21 =R21*I21 =R21*K21+F21 =IF(ISBLANK($U$4),1,(MAX($U$4,1)*S21)) =$V$22 =W$22 =I21*W21
FloorTotals
INPUT INPUT INPUT=SUBTOTAL(9,E19:E21) =SUBTOTAL(9,F19:F21) =B22-C22-D22-E22-F22 =SUBTOTAL(9,I19:I21) =SUBTOTAL(9,J19:J21) =SUBTOTAL(9,K19:K21) =SUBTOTAL(9,L19:L21) =SUBTOTAL(9,M19:M21) =G22-L22-M22 =IF(L22>0,(L22+N22)/L22,0) =SUBTOTAL(9,P19:P21) =$Q$34 =O22*Q22 =SUBTOTAL(9,S19:S21) =SUBTOTAL(9,T19:T21) =SUBTOTAL(9,U19:U21) =IF(I22>0,U22/I22,0) =IF(ISBLANK(W$3),V22,MAX(MIN(V22,W$3),1)) =SUBTOTAL(9,X19:X21)
INPUT INPUT INPUT INPUT INPUT INPUT =I23+J23+K23 INPUT =O$26 =(I23+K23)*O23 =$Q$34 =O23*Q23 =R23*I23 =R23*K23+F23 =IF(ISBLANK($U$4),1,(MAX($U$4,1)*S23)) =$V$26 =W$26 =I23*W23INPUT INPUT INPUT INPUT INPUT INPUT =I24+J24+K24 INPUT =O$26 =(I24+K24)*O24 =$Q$34 =O24*Q24 =R24*I24 =R24*K24+F24 =IF(ISBLANK($U$4),1,(MAX($U$4,1)*S24)) =$V$26 =W$26 =I24*W24INPUT INPUT INPUT INPUT INPUT INPUT =I25+J25+K25 INPUT =O$26 =(I25+K25)*O25 =$Q$34 =O25*Q25 =R25*I25 =R25*K25+F25 =IF(ISBLANK($U$4),1,(MAX($U$4,1)*S25)) =$V$26 =W$26 =I25*W25
FloorTotals
INPUT INPUT INPUT=SUBTOTAL(9,E23:E25) =SUBTOTAL(9,F23:F25) =B26-C26-D26-E26-F26 =SUBTOTAL(9,I23:I25) =SUBTOTAL(9,J23:J25) =SUBTOTAL(9,K23:K25) =SUBTOTAL(9,L23:L25) =SUBTOTAL(9,M23:M25) =G26-L26-M26 =IF(L26>0,(L26+N26)/L26,0) =SUBTOTAL(9,P23:P25) =$Q$34 =O26*Q26 =SUBTOTAL(9,S23:S25) =SUBTOTAL(9,T23:T25) =SUBTOTAL(9,U23:U25) =IF(I26>0,U26/I26,0) =IF(ISBLANK(W$3),V26,MAX(MIN(V26,W$3),1)) =SUBTOTAL(9,X23:X25)
INPUT INPUT INPUT INPUT INPUT INPUT =I27+J27+K27 INPUT =O$30 =(I27+K27)*O27 =$Q$34 =O27*Q27 =R27*I27 =R27*K27+F27 =IF(ISBLANK($U$4),1,(MAX($U$4,1)*S27)) =$V$30 =W$30 =I27*W27INPUT INPUT INPUT INPUT INPUT INPUT =I28+J28+K28 INPUT =O$30 =(I28+K28)*O28 =$Q$34 =O28*Q28 =R28*I28 =R28*K28+F28 =IF(ISBLANK($U$4),1,(MAX($U$4,1)*S28)) =$V$30 =W$30 =I28*W28INPUT INPUT INPUT INPUT INPUT INPUT =I29+J29+K29 INPUT =O$30 =(I29+K29)*O29 =$Q$34 =O29*Q29 =R29*I29 =R29*K29+F29 =IF(ISBLANK($U$4),1,(MAX($U$4,1)*S29)) =$V$30 =W$30 =I29*W29
FloorTotals
INPUT INPUT INPUT=SUBTOTAL(9,E27:E29) =SUBTOTAL(9,F27:F29) =B30-C30-D30-E30-F30 =SUBTOTAL(9,I27:I29) =SUBTOTAL(9,J27:J29) =SUBTOTAL(9,K27:K29) =SUBTOTAL(9,L27:L29) =SUBTOTAL(9,M27:M29) =G30-L30-M30 =IF(L30>0,(L30+N30)/L30,0) =SUBTOTAL(9,P27:P29) =$Q$34 =O30*Q30 =SUBTOTAL(9,S27:S29) =SUBTOTAL(9,T27:T29) =SUBTOTAL(9,U27:U29) =IF(I30>0,U30/I30,0) =IF(ISBLANK(W$3),V30,MAX(MIN(V30,W$3),1)) =SUBTOTAL(9,X27:X29)
INPUT INPUT INPUT INPUT INPUT INPUT =I31+J31+K31 INPUT =O$33 =(I31+K31)*O31 =$Q$34 =O31*Q31 =R31*I31 =R31*K31+F31 =IF(ISBLANK($U$4),1,(MAX($U$4,1)*S31)) =$V$33 =W$33 =I31*W31INPUT INPUT INPUT INPUT INPUT INPUT =I32+J32+K32 INPUT =O$33 =(I32+K32)*O32 =$Q$34 =O32*Q32 =R32*I32 =R32*K32+F32 =IF(ISBLANK($U$4),1,(MAX($U$4,1)*S32)) =$V$33 =W$33 =I32*W32
FloorTotals
INPUT INPUT INPUT=SUBTOTAL(9,E31:E32) =SUBTOTAL(9,F31:F32) =B33-C33-D33-E33-F33 =SUBTOTAL(9,I31:I32) =SUBTOTAL(9,J31:J32) =SUBTOTAL(9,K31:K32) =SUBTOTAL(9,L31:L32) =SUBTOTAL(9,M31:M32) =G33-L33-M33 =IF(L33>0,(L33+N33)/L33,0) =SUBTOTAL(9,P31:P32) =$Q$34 =O33*Q33 =SUBTOTAL(9,S31:S32) =SUBTOTAL(9,T31:T32) =SUBTOTAL(9,U31:U32) =IF(I33>0,U33/I33,0) =IF(ISBLANK(W$3),V33,MAX(MIN(V33,W$3),1)) =SUBTOTAL(9,X31:X32)
BuildingTotals(Σ) =SUM(B11:B33) =SUM(C11:C33) =SUM(D11:D33) =SUBTOTAL(9,E6:E33) =SUBTOTAL(9,F6:F33) =SUM(G11:G33) =SUBTOTAL(9,I6:I33) =SUBTOTAL(9,J6:J33) =SUBTOTAL(9,K6:K33) =SUBTOTAL(9,L6:L33) =SUBTOTAL(9,M6:M33) =SUM(N11:N33) =SUBTOTAL(9,P6:P33) =IF($P$34>0,$G$34/$P$34,0) =SUBTOTAL(9,S6:S33) =SUBTOTAL(9,T6:T33) =SUBTOTAL(9,U6:U33) =SUBTOTAL(9,X6:X33)
To IBSAAllocationWorksheet
To IBSAAllocationWorksheet
With IBSALoad FactorNo modification of shaded cell content is allowed. Preliminary Calculations and Intermediate
Allocations are not for leasing. Copyright © 2013 by BOMA International. All rights reserved.
1
2
3
4
P.H.
Values in this table represent (check one) square feet square meters
BuildingRentable
Area
IBSAAreas
EffectiveLoad
Factor
CappedLoad
Factor
CappedRentable
Area
Bsmt.
BuildingServiceAreas
FloorService &Amenity
Areas
R/URatio
Occupant +AllocatedArea ( O )
R/ORatio
LoadFactor
A
PrelimaryFloorArea
SpaceID
OccupantArea
BuildingAmenity
Areas
Inter-BuildingAmenity
Areas
UsableArea( U )
Preliminary Calculations (not for leasing) Intermediate Allocations (not for leasing) Final Calculations Optional Adjustment
FloorLevel
InteriorGrossArea
MajorVertical
PenetrationsParking
OccupantStorage
Inter-BuildingServiceAreas

BOMA Multi-Building SetGlobal Summary of Areas
ExampleFormulas-Method B
Printed: 12/30/2013
GSA-IBSA-131209.xlsx, Formulas-Method B
1234
56789
10111213141516
17181920
21222324
25262728
293031
32
3334
35
A B C D E F G H I J K L M N O P Q R S TInformation
ONLYA B C D E F G H I J K L M N O P Q R S T
Input Measure Measure Measure Measure Measure =B-C-D-E-F Input Measure Measure Measure =G-I-J-K =ΣG / (ΣI+ΣJ) = M * I =M*J+F = N * = P * M INPUT = I * R =S/(I+K)INPUT or LINK
FloorLevel
RentableArea
INPUT INPUT INPUT INPUT INPUT =$M$33 =I6*M6 =M6*J6+F6 =IF(ISBLANK($P$4),1,MAX($P$4,1)*N6) =$Q$33 =$R$33 =R6*I6INPUT INPUT INPUT INPUT INPUT =$M$33 =I7*M7 =M7*J7+F7 =IF(ISBLANK($P$4),1,MAX($P$4,1)*N7) =$Q$33 =$R$33 =R7*I7INPUT INPUT INPUT INPUT INPUT =$M$33 =I8*M8 =M8*J8+F8 =IF(ISBLANK($P$4),1,MAX($P$4,1)*N8) =$Q$33 =$R$33 =R8*I8INPUT INPUT INPUT INPUT INPUT =$M$33 =I9*M9 =M9*J9+F9 =IF(ISBLANK($P$4),1,MAX($P$4,1)*N9) =$Q$33 =$R$33 =R9*I9
FloorTotals INPUT INPUT INPUT
=SUBTOTAL(9,E6:E9) =SUBTOTAL(9,F6:F9) =B10-C10-D10-E10-F10 =SUBTOTAL(9,I6:I9) =SUBTOTAL(9,J6:J9)INPUT
=G10-I10-J10-K10 =$M$33 =SUBTOTAL(9,N6:N9) =SUBTOTAL(9,O6:O9) =SUBTOTAL(9,P6:P9) =$Q$33 =$R$33 =SUBTOTAL(9,S6:S9) =IF((I10+K10)>0,S10/(I10+K10),0)INPUT INPUT INPUT INPUT INPUT =$M$33 =I11*M11 =M11*J11+F11 =IF(ISBLANK($P$4),1,MAX($P$4,1)*N11) =$Q$33 =$R$33 =R11*I11INPUT INPUT INPUT INPUT INPUT =$M$33 =I12*M12 =M12*J12+F12 =IF(ISBLANK($P$4),1,MAX($P$4,1)*N12) =$Q$33 =$R$33 =R12*I12INPUT INPUT INPUT INPUT INPUT =$M$33 =I13*M13 =M13*J13+F13 =IF(ISBLANK($P$4),1,MAX($P$4,1)*N13) =$Q$33 =$R$33 =R13*I13INPUT INPUT INPUT INPUT INPUT =$M$33 =I14*M14 =M14*J14+F14 =IF(ISBLANK($P$4),1,MAX($P$4,1)*N14) =$Q$33 =$R$33 =R14*I14INPUT INPUT INPUT INPUT INPUT =$M$33 =I15*M15 =M15*J15+F15 =IF(ISBLANK($P$4),1,MAX($P$4,1)*N15) =$Q$33 =$R$33 =R15*I15INPUT INPUT INPUT INPUT INPUT =$M$33 =I16*M16 =M16*J16+F16 =IF(ISBLANK($P$4),1,MAX($P$4,1)*N16) =$Q$33 =$R$33 =R16*I16
FloorTotals INPUT INPUT INPUT
=SUBTOTAL(9,E11:E16) =SUBTOTAL(9,F11:F16) =B17-C17-D17-E17-F17 =SUBTOTAL(9,I11:I16) =SUBTOTAL(9,J11:J16)INPUT
=G17-I17-J17-K17 =$M$33 =SUBTOTAL(9,N11:N16) =SUBTOTAL(9,O11:O16) =SUBTOTAL(9,P11:P16) =$Q$33 =$R$33 =SUBTOTAL(9,S11:S16) =IF((I17+K17)>0,S17/(I17+K17),0)INPUT INPUT INPUT INPUT INPUT =$M$33 =I18*M18 =M18*J18+F18 =IF(ISBLANK($P$4),1,MAX($P$4,1)*N18) =$Q$33 =$R$33 =R18*I18INPUT INPUT INPUT INPUT INPUT =$M$33 =I19*M19 =M19*J19+F19 =IF(ISBLANK($P$4),1,MAX($P$4,1)*N19) =$Q$33 =$R$33 =R19*I19INPUT INPUT INPUT INPUT INPUT =$M$33 =I20*M20 =M20*J20+F20 =IF(ISBLANK($P$4),1,MAX($P$4,1)*N20) =$Q$33 =$R$33 =R20*I20
FloorTotals INPUT INPUT INPUT
=SUBTOTAL(9,E18:E20) =SUBTOTAL(9,F18:F20) =B21-C21-D21-E21-F21 =SUBTOTAL(9,I18:I20) =SUBTOTAL(9,J18:J20)INPUT
=G21-I21-J21-K21 =$M$33 =SUBTOTAL(9,N18:N20) =SUBTOTAL(9,O18:O20) =SUBTOTAL(9,P18:P20) =$Q$33 =$R$33 =SUBTOTAL(9,S18:S20) =IF((I21+K21)>0,S21/(I21+K21),0)INPUT INPUT INPUT INPUT INPUT =$M$33 =I22*M22 =M22*J22+F22 =IF(ISBLANK($P$4),1,MAX($P$4,1)*N22) =$Q$33 =$R$33 =R22*I22INPUT INPUT INPUT INPUT INPUT =$M$33 =I23*M23 =M23*J23+F23 =IF(ISBLANK($P$4),1,MAX($P$4,1)*N23) =$Q$33 =$R$33 =R23*I23INPUT INPUT INPUT INPUT INPUT =$M$33 =I24*M24 =M24*J24+F24 =IF(ISBLANK($P$4),1,MAX($P$4,1)*N24) =$Q$33 =$R$33 =R24*I24
FloorTotals INPUT INPUT INPUT
=SUBTOTAL(9,E22:E24) =SUBTOTAL(9,F22:F24) =B25-C25-D25-E25-F25 =SUBTOTAL(9,I22:I24) =SUBTOTAL(9,J22:J24)INPUT
=G25-I25-J25-K25 =$M$33 =SUBTOTAL(9,N22:N24) =SUBTOTAL(9,O22:O24) =SUBTOTAL(9,P22:P24) =$Q$33 =$R$33 =SUBTOTAL(9,S22:S24) =IF((I25+K25)>0,S25/(I25+K25),0)INPUT INPUT INPUT INPUT INPUT =$M$33 =I26*M26 =M26*J26+F26 =IF(ISBLANK($P$4),1,MAX($P$4,1)*N26) =$Q$33 =$R$33 =R26*I26INPUT INPUT INPUT INPUT INPUT =$M$33 =I27*M27 =M27*J27+F27 =IF(ISBLANK($P$4),1,MAX($P$4,1)*N27) =$Q$33 =$R$33 =R27*I27INPUT INPUT INPUT INPUT INPUT =$M$33 =I28*M28 =M28*J28+F28 =IF(ISBLANK($P$4),1,MAX($P$4,1)*N28) =$Q$33 =$R$33 =R28*I28
FloorTotals INPUT INPUT INPUT
=SUBTOTAL(9,E26:E28) =SUBTOTAL(9,F26:F28) =B29-C29-D29-E29-F29 =SUBTOTAL(9,I26:I28) =SUBTOTAL(9,J26:J28)INPUT
=G29-I29-J29-K29 =$M$33 =SUBTOTAL(9,N26:N28) =SUBTOTAL(9,O26:O28) =SUBTOTAL(9,P26:P28) =$Q$33 =$R$33 =SUBTOTAL(9,S26:S28) =IF((I29+K29)>0,S29/(I29+K29),0)INPUT INPUT INPUT INPUT INPUT =$M$33 =I30*M30 =M30*J30+F30 =IF(ISBLANK($P$4),1,MAX($P$4,1)*N30) =$Q$33 =$R$33 =R30*I30INPUT INPUT INPUT INPUT INPUT =$M$33 =I31*M31 =M31*J31+F31 =IF(ISBLANK($P$4),1,MAX($P$4,1)*N31) =$Q$33 =$R$33 =R31*I31
FloorTotals INPUT INPUT INPUT
=SUBTOTAL(9,E30:E31) =SUBTOTAL(9,F30:F31) =B32-C32-D32-E32-F32 =SUBTOTAL(9,I30:I31) =SUBTOTAL(9,J30:J31)INPUT
=G32-I32-J32-K32 =$M$33 =SUBTOTAL(9,N30:N31) =SUBTOTAL(9,O30:O31) =SUBTOTAL(9,P30:P31) =$Q$33 =$R$33 =SUBTOTAL(9,S30:S31) =IF((I32+K32)>0,S32/(I32+K32),0)
BuildingTotals(Σ) =SUM(B10:B32) =SUM(C10:C32) =SUM(D10:D32) =SUBTOTAL(9,E6:E32) =SUBTOTAL(9,F6:F32) =SUM(G10:G32) =SUBTOTAL(9,I6:I32) =SUBTOTAL(9,J6:J32) =SUM(K10:K32) =SUM(L10:L32) =IF((G33+J33)>0,$G$33/($I$33+$J$33),0) =SUBTOTAL(9,N6:N32) =SUBTOTAL(9,O6:O32) =SUBTOTAL(9,P6:P32) =IF(I33>0,P33/I33,0) =IF(ISBLANK(R$3),Q33,MAX(MIN(Q33,R$3),1)) =SUBTOTAL(9,S6:S32)
Values in this table represent (check one) square feet square meters To IBSAAllocationWorksheet
To IBSAAllocationWorksheet
With IBSALoad FactorNo modification of shaded cell content is allowed. Preliminary Calculations and Intermediate
Allocations are not for leasing. Copyright © 2013 by BOMA International. All rights reserved.
Bsmt.
1
2
3
4
P.H.
BuildingRentable
Area
IBSAAreas
EffectiveLoadFactor
CappedLoad
Factor
CappedRentable
Area
FullFloor
EquivalentFactor
SpaceID
OccupantArea
Inter-BuildingAmenity
Areas
BaseBuilding
Circulation
Service &Amenity
Areas
LoadFactor
B
Preliminary Calculations (not for leasing) Preliminary Calculations Final Calculations Optional Adjustment
InteriorGrossArea
MajorVertical
PenetrationsParking
OccupantStorage
Inter-BuildingServiceAreas
PreliminaryFloorArea

BOMA Multi-Building SetIBSA Allocation Worksheet
ExampleFormulas - Allocation Worksheet
Printed: 12/30/2013
GSA-IBSA-131209.xlsx, Formulas - Allocation Worksheet
123456789101112131415161718192021222324
25
26
2728
29
30
31
A B C D E F G H I
INPUT or LINK INPUT or LINK INPUT or LINK INPUT or LINK TotalsINPUT or LINK INPUT or LINK INPUT or LINK INPUT or LINK =SUM(E3:H3)
B1 - Fl. 00 INPUT or LINK INPUT or LINK INPUT or LINK =E$3/$I$3*$C4 =F$3/$I$3*$C4 =G$3/$I$3*$C4 =H$3/$I$3*$C4 =SUM(E4:H4)B1 - Fl. 02 INPUT or LINK INPUT or LINK INPUT or LINK =E$3/$I$3*$C5 =F$3/$I$3*$C5 =G$3/$I$3*$C5 =H$3/$I$3*$C5 =SUM(E5:H5)B1 Subtotal =SUBTOTAL(9,C4:C5) =SUBTOTAL(9,E4:E5) =SUBTOTAL(9,F4:F5) =SUBTOTAL(9,G4:G5) =SUBTOTAL(9,H4:H5) =SUBTOTAL(9,I4:I5)B3 - Fl. 01 INPUT or LINK INPUT or LINK INPUT or LINK =E$3/$I$3*$C7 =F$3/$I$3*$C7 =G$3/$I$3*$C7 =H$3/$I$3*$C7 =SUM(E7:H7)B3 - Fl. 01 INPUT or LINK INPUT or LINK INPUT or LINK =E$3/$I$3*$C8 =F$3/$I$3*$C8 =G$3/$I$3*$C8 =H$3/$I$3*$C8 =SUM(E8:H8)B3 - Fl. 01 INPUT or LINK INPUT or LINK INPUT or LINK =E$3/$I$3*$C9 =F$3/$I$3*$C9 =G$3/$I$3*$C9 =H$3/$I$3*$C9 =SUM(E9:H9)B3 - Fl. 01 INPUT or LINK INPUT or LINK INPUT or LINK 0 =F3/($F3+$G3)*$C10 =C10-F10 =H$3/$I$3*$C10 =SUM(E10:H10)B3 - Fl. 01 INPUT or LINK INPUT or LINK INPUT or LINK =E$3/$I$3*$C11 =F$3/$I$3*$C11 =G$3/$I$3*$C11 =H$3/$I$3*$C11 =SUM(E11:H11)B3 Subtotal =SUBTOTAL(9,C7:C11) =SUBTOTAL(9,E7:E11) =SUBTOTAL(9,F7:F11) =SUBTOTAL(9,G7:G11) =SUBTOTAL(9,H7:H11) =SUBTOTAL(9,I7:I11)B4 - Fl. 01 INPUT or LINK INPUT or LINK INPUT or LINK =E$3/$I$3*$C13 =F$3/$I$3*$C13 =G$3/$I$3*$C13 =H$3/$I$3*$C13 =SUM(E13:H13)B4 - Fl. 01 INPUT or LINK INPUT or LINK INPUT or LINK =E$3/$I$3*$C14 =F$3/$I$3*$C14 =G$3/$I$3*$C14 =H$3/$I$3*$C14 =SUM(E14:H14)B4 - Fl. 01 INPUT or LINK INPUT or LINK INPUT or LINK =E$3/$I$3*$C15 =F$3/$I$3*$C15 =G$3/$I$3*$C15 =H$3/$I$3*$C15 =SUM(E15:H15)B4 - Fl. 01 INPUT or LINK INPUT or LINK INPUT or LINK =E$3/$I$3*$C16 =F$3/$I$3*$C16 =G$3/$I$3*$C16 =H$3/$I$3*$C16 =SUM(E16:H16)B4 - Fl. 01 INPUT or LINK INPUT or LINK INPUT or LINK =E$3/$I$3*$C17 =F$3/$I$3*$C17 =G$3/$I$3*$C17 =H$3/$I$3*$C17 =SUM(E17:H17)B4 Subtotal =SUBTOTAL(9,C13:C17) =SUBTOTAL(9,E13:E17) =SUBTOTAL(9,F13:F17) =SUBTOTAL(9,G13:G17) =SUBTOTAL(9,H13:H17) =SUBTOTAL(9,I13:I17)
=SUBTOTAL(9,C4:C18) =SUBTOTAL(9,E4:E18) =SUBTOTAL(9,F4:F18) =SUBTOTAL(9,G4:G18) =SUBTOTAL(9,H4:H18) =SUBTOTAL(9,I4:I18)=IF(E3>0,(E3+E19)/E3,1) =IF(F3>0,(F3+F19)/F3,1) =IF(G3>0,(G3+G19)/G3,1) =IF(H3>0,(H3+H19)/H3,1)=E20*E3 =F20*F3 =G20*G3 =H20*H3 =SUM(E21:H21)='B1-Method A'!U34 ='B2-Method A'!U43 ='B3-Method A'!U51 ='B4-Method A'!U19 =SUM(E22:H22)
For each building in this example, the Rentable Area Check (row 22) is its Rentable Area from the total of Column U of the Method A Multi-Building Set Global Summary of Areas spreadsheet (Column P for Method B). The vertically adjacent values in Rows 21 & 22 must be the same.
Some formulas in this spreadsheet will vary depending on the number of buildings (columns) in the multi-building set, the number of inter-building service and amenity areas (rows) and the method of allocation of each of those IBSA areas among the buildings. However, it is essential that 100% of each IBSA area, no more and no less, is allocated to the buildings in the multi-building set.
For each building in this example, the Building Rentable Area (row 3) is taken from the total of column S of the Method A Multi-Building Set Global Summary of Area Spreadsheet (Column N for Method B).Each IBSA Area (Column C) in this example is taken from column T of the Method A Multi-Building Set Global Summary of Area spreadsheet (column O for Method B). The subtotals (row 6, 12 & 18 in this example) are only for convenience and are not required.For each building in this example, the Total IBSA Areas (row 19) is the sum of the individual IBSA allocations in the column.
For each building in this example,the Inter-Building Load Factor (row 20) is the sum of the Building Rentable Area (Row 3) and the Total IBSA Area (Row 19), divided by the Building Rentable Area (row 3). This value, which will always be equal or greater than one, is transferred to the top of Column T of the Method A Multi-Building Set Global Sumary of Areas Spreadsheet (Column O for Method B).
For each building in this example, the Rentable Area (row 21) is the product of its Building Rentable Area (Row 3) and its Inter-Building Load Factor (Row 20).
Total IBSA AreasInter-Building Load Factor:
Rentable Area:Rentable Area Check:
Values in this table represent (check one) square feet square metersNo modification of shaded cell content is allowed. Copyright © 2013 by BOMA International. All rights reserved.
Inter-Building Service & Amenity (IBSA) Areas Building Rentable Areas and IBSA Area AllocationsBuilding& Floor
Space IDIBSAArea
IBSAType