
IntelloMobile: A business intelligence solution by ThreadSol Softwares
13
Presents Intelligence at your fingertips Request Access Request Access Generate Report $ Wastage Overview
-
Upload
threadsol -
Category
Technology
-
view
267 -
download
0
Transcript of IntelloMobile: A business intelligence solution by ThreadSol Softwares

Presents
Intelligence at your fingertips
Request Access
Request Access
Generate Report
$
Wastage Overview

&
View Actionable Intelligence on-the-go, from any mobile device, any time, any place
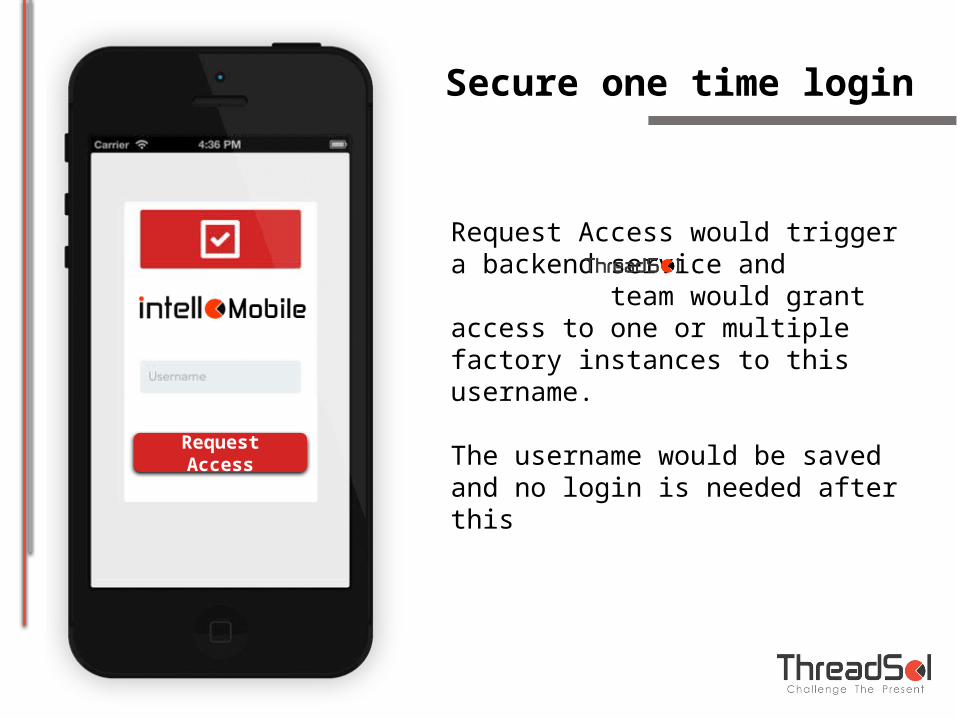
Secure one time login
Request Access would trigger a backend service and team would grant access to one or multiple factory instances to this username.
The username would be saved and no login is needed after this
Request AccessRequest Access
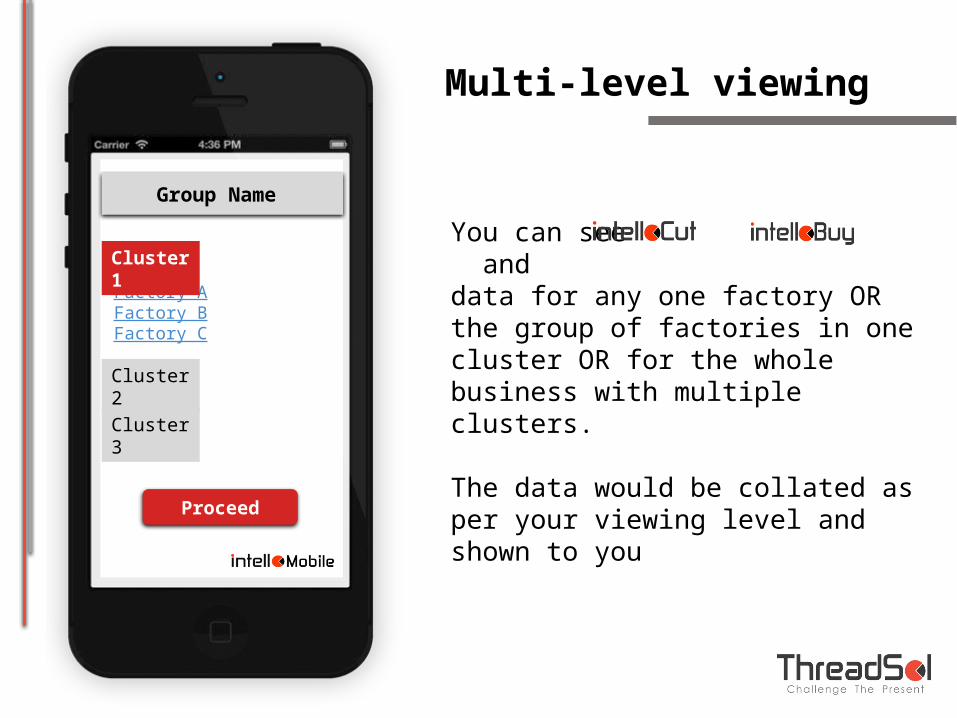
You can see and data for any one factory OR the group of factories in one cluster OR for the whole business with multiple clusters.
The data would be collated as per your viewing level and shown to you
Cluster 2
Cluster 3
Factory AFactory BFactory C
Proceed
Multi-level viewing
Cluster 1
Group Name
Generate Report
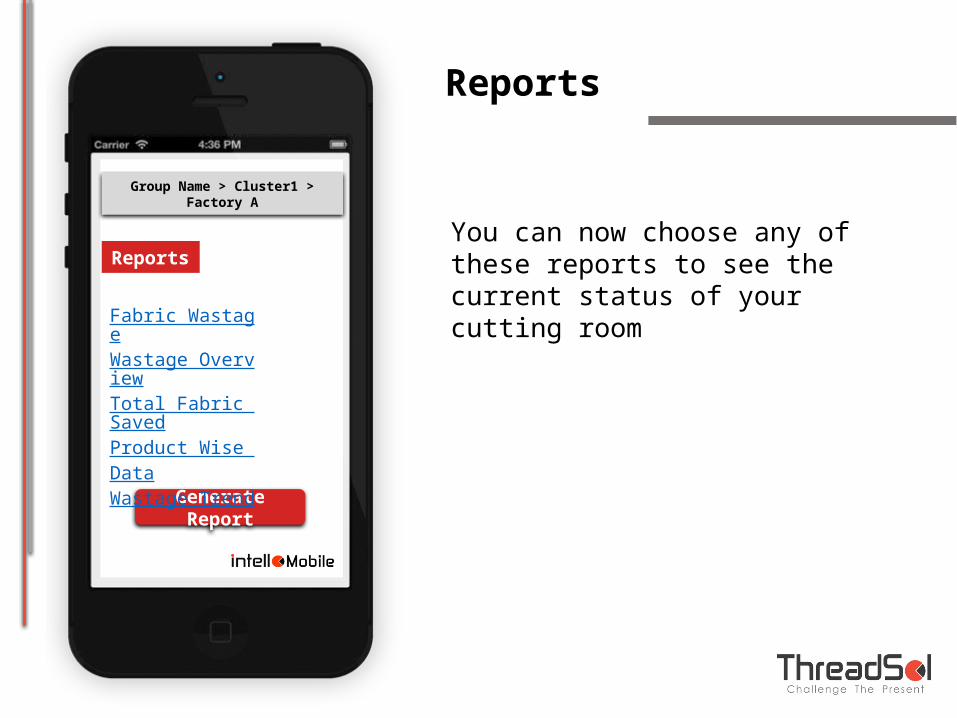
Fabric WastageWastage OverviewTotal Fabric SavedProduct Wise DataWastage Trend
You can now choose any of these reports to see the current status of your cutting room
Reports
Reports
Group Name > Cluster1 > Factory A
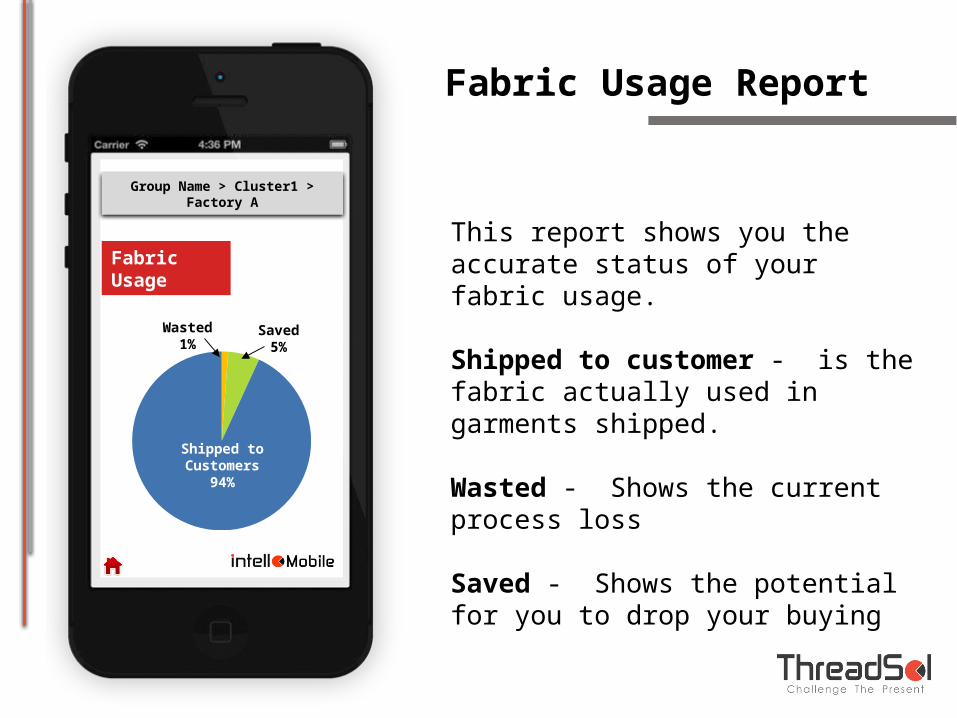
Wasted1%
Saved5%
Shipped to Customers94%
This report shows you the accurate status of your fabric usage.
Shipped to customer - is the fabric actually used in garments shipped.
Wasted - Shows the current process loss
Saved - Shows the potential for you to drop your buying
Fabric Usage Report
Group Name > Cluster1 > Factory A
Fabric Usage
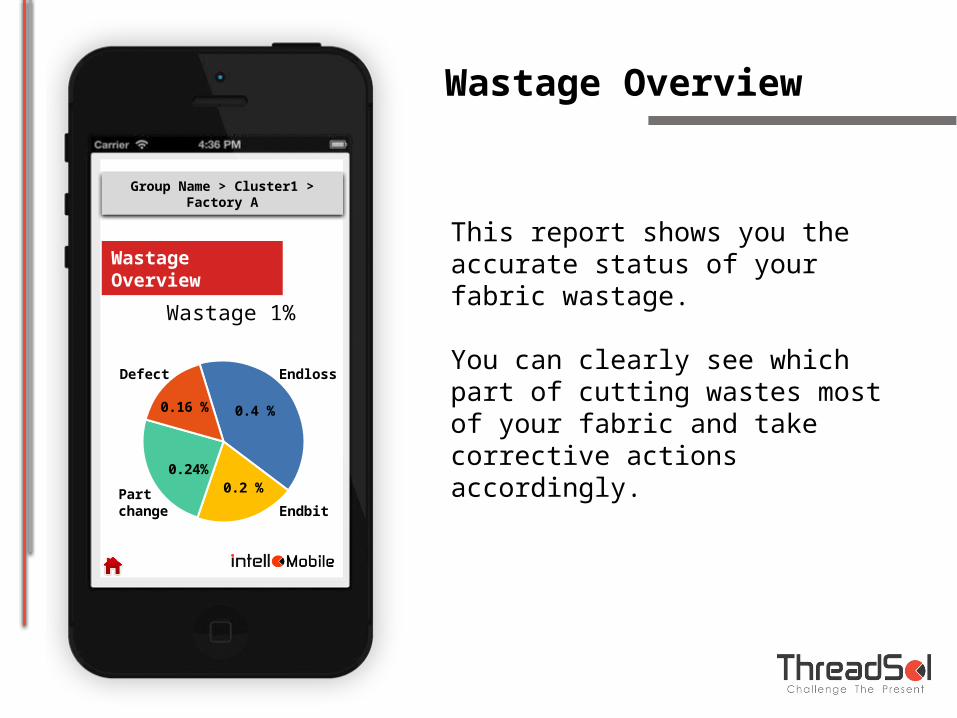
0.4 %
0.2 %0.24%
0.16 %
Wastage 1%
This report shows you the accurate status of your fabric wastage.
You can clearly see which part of cutting wastes most of your fabric and take corrective actions accordingly.
Wastage Overview
EndlossDefect
Part change Endbit
Group Name > Cluster1 > Factory A
Wastage Overview
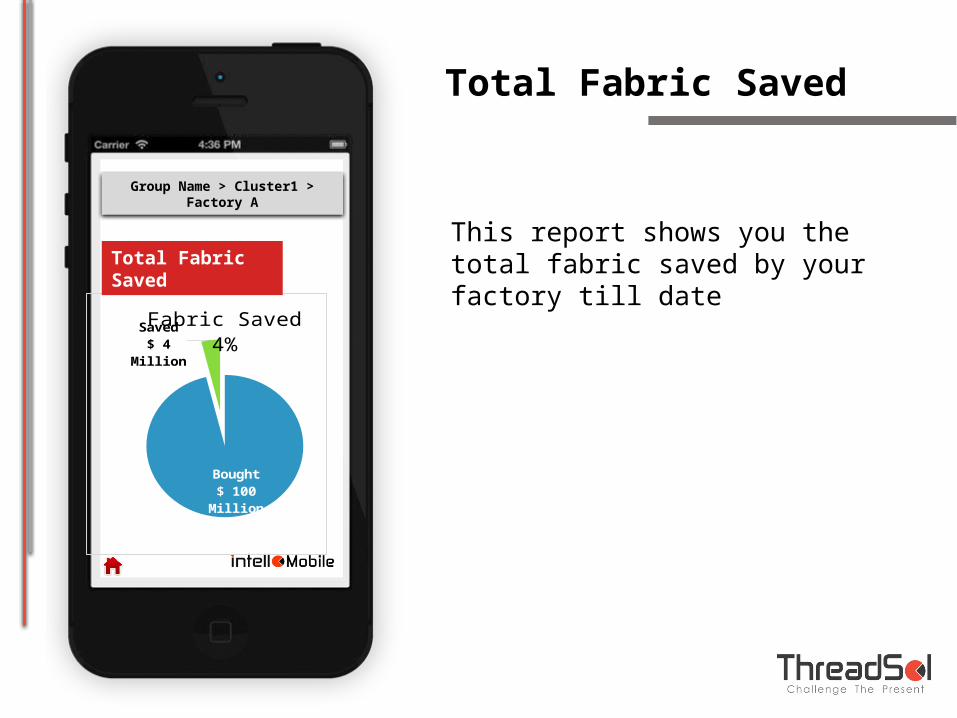
Bought$ 100 Mil-
lion
Saved$ 4 Million
Fabric Saved 4%
This report shows you the total fabric saved by your factory till date
Total Fabric Saved
Group Name > Cluster1 > Factory A
Total Fabric Saved
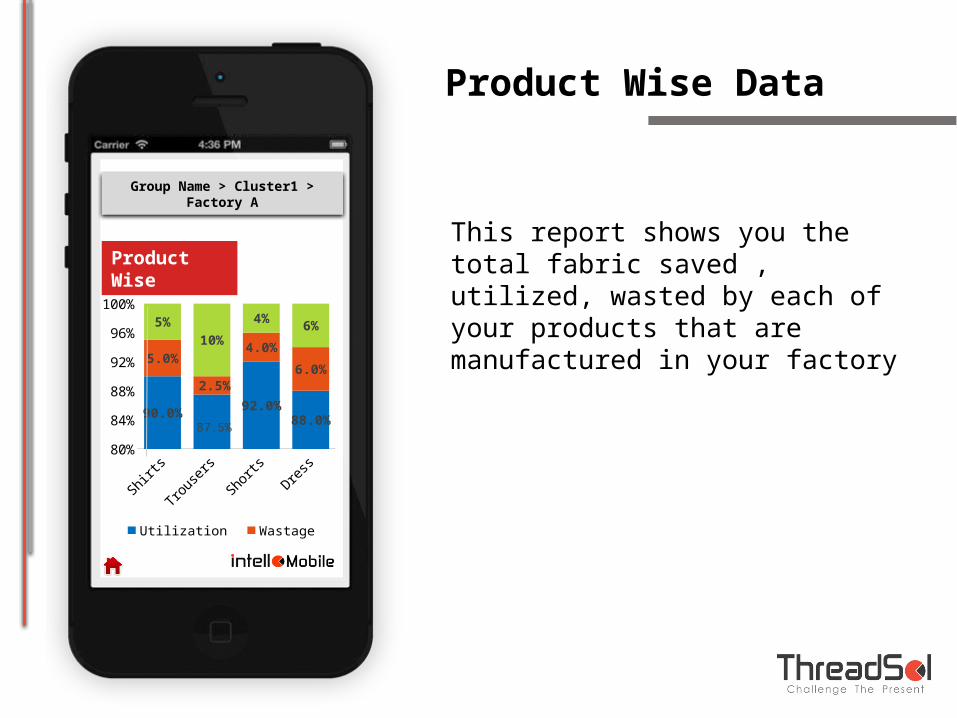
Shirts Trousers Shorts Dress80%82%84%86%88%90%92%94%96%98%
100%
90.0%87.5%
92.0%88.0%
5.0%
2.5%
4.0%
6.0%
5%
10%
4%6%
Utilization Wastage Saving
This report shows you the total fabric saved , utilized, wasted by each of your products that are manufactured in your factory
Group Name > Cluster1 > Factory A
Product Wise
Product Wise Data
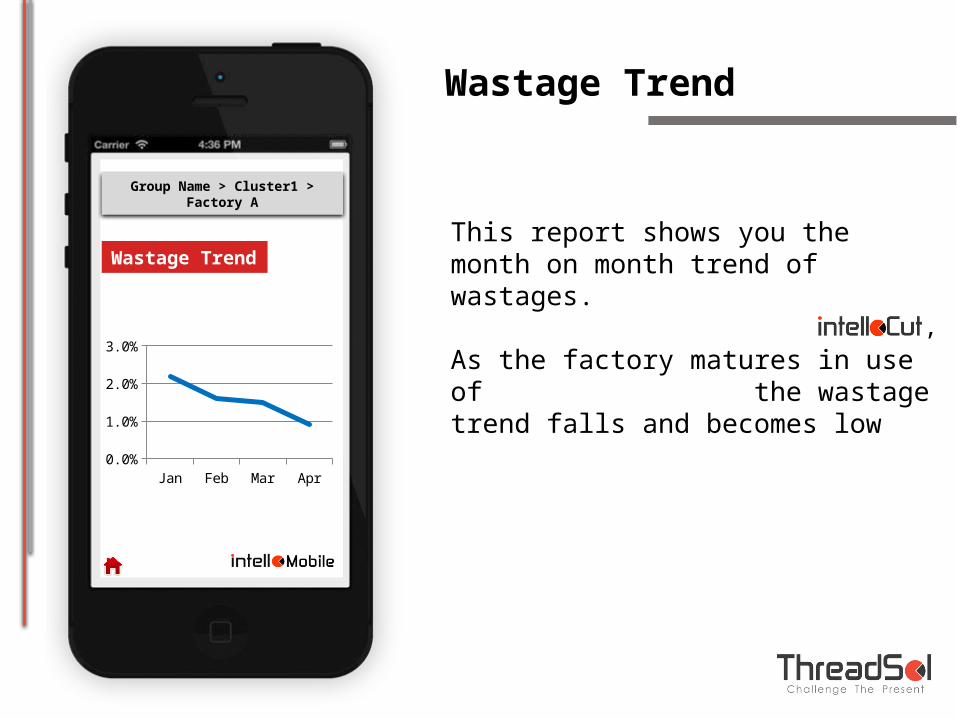
Jan Feb Mar Apr0.0%
1.0%
2.0%
3.0%
This report shows you the month on month trend of wastages.
As the factory matures in use of the wastage trend falls and becomes low
,
Wastage Trend
Wastage Trend
Group Name > Cluster1 > Factory A
Proceed
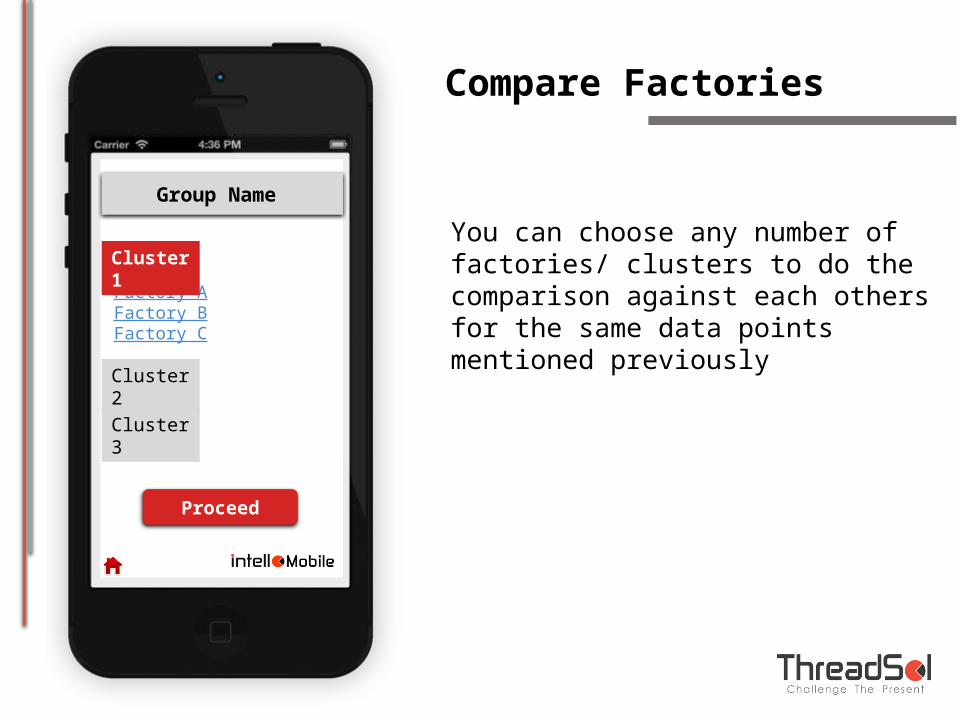
You can choose any number of factories/ clusters to do the comparison against each others for the same data points mentioned previously
Compare Factories
Cluster 2
Cluster 3
Factory AFactory BFactory C
Cluster 1
Group Name
Launching on1st of August 2015
• iOS, • Android, • Windows, • Blackberry • Tab
Works In All Mobile Devices