
Intelligent Belt Conveyor Monitoring and ControlFigure 1.2 Cross section of troughed belt conveyor...
196
Intelligent Belt Conveyor Monitoring and Control Yusong Pang
Transcript of Intelligent Belt Conveyor Monitoring and ControlFigure 1.2 Cross section of troughed belt conveyor...

Intelligent Belt Conveyor Monitoring and Control
Yusong Pang

Cover:
Photo courtesy Conveyor Expert B.V., the Netherlands

Intelligent Belt Conveyor Monitoring and Control
Proefschrift
ter verkrijging van de graad van doctor aan de Technische Universiteit Delft,
op gezag van de Rector Magnificus prof. ir. K.C.A.M. Luyben, voorzitter van het College voor Promoties,
in het openbaar te verdedigen op maandag 6 december 2010 om 10:00 uur
door
Yusong PANG
Master of Science in Electrical Engineering, Taiyuan University of Technology geboren te Changzhi, Shanxi Province, China

Dit proefschrift is goedgekeurd door de promotor: Prof. dr. ir. G. Lodewijks Samenstelling promotiecommissie: Rector Magnificus, voorzitter Prof. dr. ir. G. Lodewijks, Technische Universiteit Delft, promotor Prof. dr. hab. ir. W. Bartelmus, Wrocław Universiteit of Technology, Polen Prof. dr. H. L. M. Bakker, Technische Universiteit Delft Prof. dr. ir. J. Hellendoorn, Technische Universiteit Delft Prof. dr. ir. E. G. M. Holweg, Technische Universiteit Delft Prof. dr. ir. G. Jongbloed, Technische Universiteit Delft This dissertation is the result of research carried out from 2003 to 2007 at Delft University of Technology, Faculty of Mechanical, Maritime and Materials Engineering, Department of Maritime and Transport Technology, Section of Transport Engineering and Logistics. TRAIL Thesis Series no. T2010/12, the Netherlands TRAIL Research School TRAIL Research School P.O. Box 5017 2600 GA Delft The Netherlands Phone: +31 (0)15 2786046 Fax: +31 (0) 15 2784333 Email: [email protected] ISBN: 978-90-5584-134-9 Keywords: belt conveyors, intelligent monitoring, automated maintenance, decision-making Copyright © 2010 by Yusong Pang All rights reserved. No part of the material protected by this copyright may be reproduced or utilized in any form or by any means, electronic or mechanical, including photocopying, recording or by any information storage and retrieval system, without written permission from the author. Printed in the Netherlands

v
Preface
Life is not something one can reason, no matter how much knowledge one could possess and how intelligent one is.
My pursuance of a PhD degree was marched 10 years ago when I arrived in the Netherlands. The prehistory of this thesis dates back to the spring of 2003 when I was lucky enough to meet professor Gabriël Lodewijks, who introduced me into the world of belt conveyors. Differing from the common PhD’s emphasis on the trust, the support, the encouragement, the enthusiasm and the patience of a supervisor throughout a PhD research, first and foremost, I would like to express my full gratitude to Gabriël Lodewijks for his help and consideration during my hardest periods of both my PhD years and my life. What I have learned from him is beyond what this thesis covers.
Heartfelt thanks to all my (ex)colleagues from the section of Transport Engineering and Logistics for sharing ideas and stories in a pleasant and friendly working atmosphere. Special thanks go to Jaap Ottjes. Seven years ago, when I showed diffident during my PhD application interview because I did not have a mechanical background, his two words of “me neither!” encouraged me so far to dedicate into the field of belt conveyors.
I would like to thank all my friends from our small Chinese community, inside and outside the university, for their help and care in helping me settling my life in the remote country and clearing away my longing for home.
I am deeply in debt to all the members of my family of three generations, for their constant support and patience in the past years. Last but not least, my deepest gratitude goes to my wife, Hongyan, for her love, for her fortitude, for all that she has given me, including our sunny son.

vi Intelligent Belt Conveyor Monitoring and Control

vii
Contents
Preface v
1 Introduction 1
1.1 Aim and scope of the study ...................................................................................... 4 1.2 Method of this research ............................................................................................ 5 1.3 Thesis outline ........................................................................................................... 6
2 Monitoring of Belt Conveyor Systems 7
2.1 Objects of Belt Conveyor Monitoring...................................................................... 9 2.2 Technologies of monitoring belt conveyors........................................................... 10
2.2.1 Belt condition monitoring ........................................................................ 10 2.2.2 Speed monitoring ..................................................................................... 13 2.2.3 Force, tension and torque monitoring....................................................... 15 2.2.4 Vibration monitoring................................................................................ 18 2.2.5 Power monitoring ..................................................................................... 19 2.2.6 Misalignment monitoring ......................................................................... 19 2.2.7 Temperature monitoring........................................................................... 20
2.3 A novel Embedded Conductive Detection System ................................................ 20 2.3.1 An embedded conductive detection system ............................................. 21 2.3.2 Primary principles .................................................................................... 21 2.3.3 Objectives of acquiring data..................................................................... 23 2.3.4 The magnet matrix.................................................................................... 27
2.4 Challenges of Automated Belt Conveyor Monitoring ........................................... 29
3 Artificial Intelligence 31
3.1 Assessment of application scope............................................................................ 32 3.1.1 Necessity and feasibility study of AI application..................................... 32 3.1.2 Assessment of IBCMC application .......................................................... 34

viii Intelligent Belt Conveyor Monitoring and Control
3.2 Knowledge-based expert system............................................................................ 36 3.2.1 Expert system and knowledge-base systems............................................ 37 3.2.2 Architecture .............................................................................................. 37 3.2.3 Knowledge representation........................................................................ 38
3.3 Reasoning with uncertainty.................................................................................... 38 3.3.1 Dealing with uncertainty in IBCMC ........................................................ 39 3.3.2 Bayesian method ...................................................................................... 40 3.3.3 Fuzzy logic ............................................................................................... 41
3.4 Case-based reasoning ............................................................................................. 42 3.4.1 Case representation................................................................................... 44 3.4.2 Case base organization ............................................................................. 44 3.4.3 Case retrieval............................................................................................ 45 3.4.4 Case adaptation......................................................................................... 46 3.4.5 Vantages of CBR in IBCMC.................................................................... 46
4 The Knowledge Acquisition Process 49
4.1 The hierarchy of data, information and knowledge ............................................... 50 4.2 Sources of knowledge ............................................................................................ 51 4.3 Data analysis .......................................................................................................... 53
4.3.1 Analyzing data by using fuzzy logic ........................................................ 54 4.3.2 Analyzing data by Bayesian inference ..................................................... 58
4.4 Knowledge representation...................................................................................... 63 4.4.1 Knowledge representation stages ............................................................. 63 4.4.2 Capture of knowledge from static information ........................................ 65 4.4.3 Capture of knowledge from dynamic information ................................... 65 4.4.4 Fuzzy knowledge representation algorithm ............................................. 66
5 The Decision-making Process 69
5.1 Procedures of decision-making .............................................................................. 70 5.2 Case retrieval.......................................................................................................... 71
5.2.1 Similarity measure.................................................................................... 72 5.2.2 Bayesian evaluation.................................................................................. 74 5.2.3 Experience scoring evaluation.................................................................. 76
5.3 Case completion ..................................................................................................... 77 5.4 Case adaptation ...................................................................................................... 78
6 Agent-based Architecture 81
6.1 Agent-based architecture for distributed intelligence ............................................ 82 6.1.1 Meeting the needs of IBCMC .................................................................. 82 6.1.2 Multi-agent structure ................................................................................ 83
6.2 Knowledge organization ........................................................................................ 84

Contents ix
6.2.1 Internal knowledge and external knowledge............................................ 85 6.2.2 Knowledge of domain specialist .............................................................. 85
6.3 Agent communication ............................................................................................ 86 6.3.1 Communication for agent cooperation ..................................................... 86 6.3.2 Communication for agent coordination.................................................... 87
7 System Implementation and Evaluation 89
7.1 Implementation of data acquisition ........................................................................ 90 7.2 Implementation of knowledge acquisition and decision-making........................... 95
7.2.1 Test facility and process values................................................................ 96 7.2.2 Mathematical software model .................................................................. 99 7.2.3 Verification of software model............................................................... 100 7.2.4 Matching of software model................................................................... 103 7.2.5 Knowledge representation and decision-making ................................... 105
7.3 Implementation of agent-based system................................................................ 107 7.4 Evaluation of the intelligent monitoring and control system ............................... 109
8 Conclusions and Recommendations 115
8.1 Conclusions .......................................................................................................... 115 8.2 Recommendations ................................................................................................ 118
Appendix A: Properties of Magnets and Sensor in ECD System 119
Appendix B: Working Principle of Hydraulic Brake System 125
Appendix C: Software Model and Implementation 131
Appendix D: CD-ROM content 155
Nomenclature 157
Bibliography 163
Summary 173
Samenvatting 177
Biography 181
Trail Thesis Series 183

x Intelligent Belt Conveyor Monitoring and Control

1
1 Introduction
Belt Conveyor Systems, in this thesis referred to as BCS, have been used worldwide for conveying passengers, general cargo and bulk cargo for about 250 years (Hetzel and Albright, 1941). BCS play an important role in continuous bulk material transport in the mining industry, on bulk terminals, in cement plants, power plants, chemical production, and so on. Compared to other transportation modes often used for the transportation of bulk solid materials, such as trains or trucks, BCS are the most encouraged means to transport large volumes rapidly and efficiently through production processes in areas where roads and railway infrastructures do not exist or are under-developed. Over the past decades the development of BCS design technologies has enabled the realization of longer, faster and more efficient BCS with higher capacity and less environmental impact (Lodewijks, 2001). The application of BCS has become widespread not only for in-plant but also for overland transportation.
Figure 1.1 Conventional troughed belt conveyor
One typical layout of BCS is the conventional troughed belt conveyor (Figure 1.1 and Figure 1.2). The length of a belt in such a system may vary from 10 m to 20,000 m. The velocity can
2 Intelligent Belt Conveyor Monitoring and Control
reach up to 9 m/s and the width can vary from about 0.3 m to 3.2 m. Today’s the highest capable belt conveyors carry up to 40,000 tons/hour of lignite at the RWE lignite mines in Germany (Küsel, 2004).
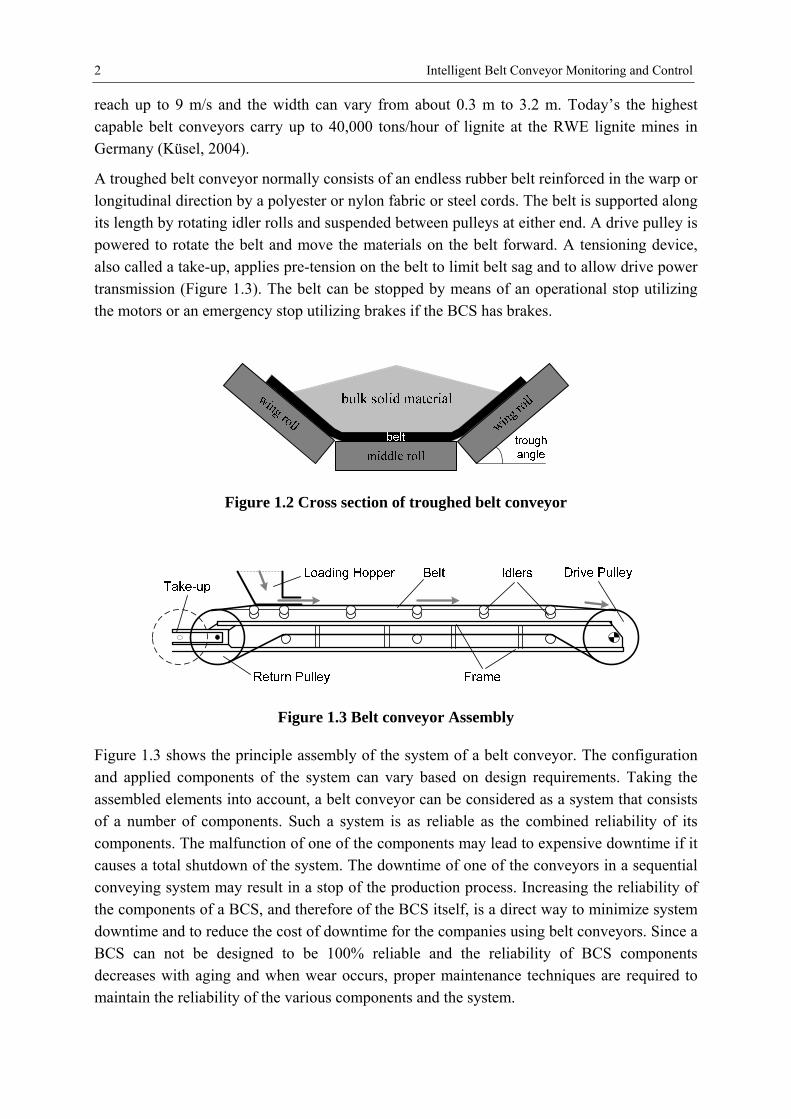
A troughed belt conveyor normally consists of an endless rubber belt reinforced in the warp or longitudinal direction by a polyester or nylon fabric or steel cords. The belt is supported along its length by rotating idler rolls and suspended between pulleys at either end. A drive pulley is powered to rotate the belt and move the materials on the belt forward. A tensioning device, also called a take-up, applies pre-tension on the belt to limit belt sag and to allow drive power transmission (Figure 1.3). The belt can be stopped by means of an operational stop utilizing the motors or an emergency stop utilizing brakes if the BCS has brakes.
Figure 1.2 Cross section of troughed belt conveyor
Figure 1.3 Belt conveyor Assembly
Figure 1.3 shows the principle assembly of the system of a belt conveyor. The configuration and applied components of the system can vary based on design requirements. Taking the assembled elements into account, a belt conveyor can be considered as a system that consists of a number of components. Such a system is as reliable as the combined reliability of its components. The malfunction of one of the components may lead to expensive downtime if it causes a total shutdown of the system. The downtime of one of the conveyors in a sequential conveying system may result in a stop of the production process. Increasing the reliability of the components of a BCS, and therefore of the BCS itself, is a direct way to minimize system downtime and to reduce the cost of downtime for the companies using belt conveyors. Since a BCS can not be designed to be 100% reliable and the reliability of BCS components decreases with aging and when wear occurs, proper maintenance techniques are required to maintain the reliability of the various components and the system.

Introduction 3
Traditionally, companies using belt conveyors carry out BCS inspections, which are followed by necessary maintenance activities such as replacement or reparation of components. This is done to ensure that the reliability of their system is maintained. Today, however, satisfactory decisions for operational and maintenance activities are based on inspection results and can only properly be made if the personnel carrying out the inspection and maintenance activities are well-trained and have stayed on the specific area of BCS for a considerable time. Moreover, today’s BCS inspection only focuses on the technical condition or the health of special BCS component(s) such as the drives and transfer stations. The overall status of BCS can not be assessed if there is no integrated information derived from the inspection of different BCS components. Since the 1970’s, condition monitoring has been employed in BCS operational control to help the inspection personnel to gather desired information and to understand the performance of BCS. Condition Monitoring, which is referred to as CM, is the continuous or periodic measurement and interpretation of data to indicate the condition of an item to determine the need for maintenance (Leaney and Sharpe, 1999). CM in the area of BCS deals with the acquisition of data from human inspectors and sensors and with taking corrective actions on BCS components that are to fail. However, CM still relies on considerable human effort and domain knowledge because CM does not have “the capacity to profit from experience to go beyond (Zimbardo 1992)” and does not have “the ability to gain and apply knowledge and skills (Soanes et al., 2001)”. To overcome operational problems caused by the lack of knowledge and experience of maintenance personnel, the industry using belt conveyors requires advanced intelligent monitoring and operational control systems to simultaneously monitor as many BCS components as possible in order to represent the entire BCS technical and operational status. Intelligence here can be defined as the ability to integrate and interpret the information gathered through sensors in BCS and further to make maintenance and operational decisions based on the overall status of BCS.
Figure 1.4 Highly distributed conveyor idler rolls (DemcoTECH)

4 Intelligent Belt Conveyor Monitoring and Control
However, the ever-growing size of BCS and the fact that BCS components are highly distributed in a large-scale system lead to difficulties and complexities when developing an intelligent monitoring and operational control systems. Firstly, to collect information from the highly distributed BCS components, and therefore from highly distributed information sources, can be difficult and complex. For example, when estimating the residual lifetime of idler rolls for the purpose of making decisions on the replacement of rolls, the simultaneous monitoring of all individual rolls is unrealistic due to the vast number and the distribution scale of the rolls (Figure 1.4). Secondly, to assess the change of the overall BCS status, many parameters of different BCS components need to be monitored at the same time so that the amount of gathered data can be a huge. The analysis and interpretation of the collected data can also be difficult and complex.
To overcome these difficulties and complexities, an important trend that will affect the future of the industry using belt conveyors is the automation of the processes of monitoring BCS conditions, understanding BCS status, optimizing BCS maintenance strategies and improving BCS performance.
1.1 Aim and scope of the study
Since the early 1980’s, Conveyor Belt Monitoring (CBM) technologies based on Non-Destructive Testing (NDT) have been applied in Australia to evaluate the condition of steel cord cables for the maintenance programming of conveyor belts (Harrison, 1979). One typical example of the functionality of such a CBM system is that the steel cords are magnetized and that the magnetic field generated by the induced cords is measured in order to detect deviations from the normal field. Deviations could point at steel cord faults like broken wires, bird caging, cable corrosion, etc. The results of the detection are translated to human interpretable information by means of curves or images. Further the information is analyzed by human experts to determine whether or not maintenance is required on the inspected belt. This CBM technology initially focused on steel cord belts due to the wide application of steel cord belts in Australia and the applicability of magnetic sensors for steel cables detection. Afterwards, other technologies, which have been widely used in other industry areas, were introduced to monitor BCS components, such as transponder and X-ray technologies for belt condition monitoring, magnetic flux and eddy-current technologies for scanning the belt, infrared technology for measuring the temperature of rotating components, strain gauge technology for monitoring force and torque, acoustic signal analysis for vibration monitoring, etc. (Pang, 2006d). Nevertheless, traditional inspection and monitoring applications only separately focus on the condition of certain BCS components without analyzing the interrelationships among BCS components. In order to integrate individual monitoring systems to enable the representation of the condition of an entire BCS, the application of Belt Conveyor Monitoring (BCM) extends the application field of CBM as a modern monitoring concept which aims at the entire system instead of any individual BCS component (Pang and Lodewijks, 2006a). In a BCM system the interrelationship among monitored components can

Introduction 5
be discovered so that maintenance and operational strategies that take the overall BCS into consideration can be developed.
Today, the analyses of BCM results and maintenance decision-making considerably rely on human experience and interpretation, which can be unreliable, inconsistent, expensive and not very accurate. To lessen human involvement in BCM and to prevent possible problems due to the lack of experience of the maintenance personnel, the monitoring and operational control of BCS can be automated (Lodewijks, 2004). This research aims to develop an Intelligent Belt Conveyor Monitoring and Control (IBCMC) system which is able to automatically:
acquire data from BCS components;
interpret the monitored situation and identify abnormalities from the normal situation;
discover the causes of the faults of BCS components and the failures of BCS;
store the experience and knowledge for improving BCS performance;
retrieve stored experience and knowledge and apply reasoning to them;
assess the health condition and operational status of BCS;
provide optimal maintenance and operational control strategies.
Since sound operational decision-making relies on the accuracy of gathered information and the experience and knowledge of the domain specialists, the IBCMC system has to work under the premise of acquirable information from BCS and reusable knowledge stored in the intelligent system. The application of IBCMC enables the conversion process from data to information and to knowledge. This research project is concerned with the areas of data acquisition (DAC), data analysis (DAN) and decision-making. Nowadays, the advances in sensor techniques, DAC and Artificial Intelligence open up the possibilities of automatic measurement, automatic analysis, automatic reasoning and automatic decision-making. In IBCMC the knowledge derived from past experience, laboratory experiments, computer simulation, domain specialists and real-time monitoring can be retrieved and combined to generate integrated knowledge. The integration of partial knowledge enables the intelligent system to understand the overall BCS condition accurately, completely and consistently.
1.2 Method of this research
The methodology employed in this research is “Artificial Intelligence (AI)”. AI has been developed for tens of years and is widely used in many areas but rarely in the field of belt conveyors. Besides relatively few AI applications, such as the applications of fuzzy logic in BCM (Jurdziak, 2000; Lodewijks and Ottjes, 2005), Neural Networks for belt splice identification (Alport et al., 2001) and knowledge-based BCS equipment selection (Fonseca et al., 2004), there was no real successful application of AI in the field of belt conveyors. This research project aims at building a monitoring and operational control system by means of introducing diverse AI technologies to the field of belt conveyors. The focus of this research project is on the assessment of the feasibility and applicability of employing AI technologies

6 Intelligent Belt Conveyor Monitoring and Control
in this specific area so that the results and advantages of applying AI can be shown. AI technologies used within this research project included fuzzy logic, reasoning under uncertainties, knowledge-based systems and agent technologies.
1.3 Thesis outline
This study involves two research fields of BCM and AI. Therefore, the thesis begins with two introductory chapters. The other chapters explain the actual design and implementation of this research project and present the key challenges and opportunities when building an IBCMC system. The structure of this thesis is as follows:
Chapter 2 provides an overview of the technologies that have been traditionally and commonly applied in BCM. After introducing a novel embedded conductive detection system that has been developed in this research project, the challenges of developing an IBCMC system are discussed.
Chapter 3 gives an introduction to the field of AI. It starts with a discussion of the necessity and feasibility of applying AI to the field of BCM and then presents an overview of the AI technologies that can be deployed in the IBCMC system.
Chapter 4 introduces the process of knowledge acquisition. After summarizing the sources of knowledge, this chapter presents the methodologies of (i) data acquisition, (ii) data analysis, (iii) knowledge representation, and (iv) knowledge organization.
Chapter 5 introduces the processes of knowledge-based learning and reasoning. It presents the principles of knowledge retrieval, case-based reasoning and decision-making.
Chapter 6 presents an agent-based architecture designed for integrating individual monitoring system. This chapter includes topics of agent communication, agent coordination and knowledge organization in an agent-based environment.
Chapter 7 shows the results of implementing the IBCMC system. This chapter presents the implementations of data acquisition, knowledge derivation, decision-making and the agent-based system. This chapter provides the evaluation of the IBCMC system.
Chapter 8 concludes the work on automating BCM process and points out the directions for future research. Special attentions are paid to an overall BCM system and the reduction of system complexity by means of integrating individual monitoring systems and the partial knowledge derived from BCM applications.

7
2 Monitoring of Belt Conveyor Systems
Belt conveyors often used in industry include conventional troughed belt conveyors, pipe conveyors, pouch conveyors, sandwich conveyors, cable belt conveyors and air supported belt conveyors. Of all types of belt conveyors, the conventional troughed belt conveyor is the most widely used and well-known. This type of belt conveyor has proven to be a reliable material conveying system which can be used in a wide variety of industry fields. Therefore, conventional troughed belt conveyors were selected as the major object for the IBCMC research project. As a system continuously transports goods or material over a certain distance, the components of a BCS will degrade during operation due to normal wear and tear. The degradation of components reduces the reliability of the overall system. Therefore, a BCS needs to be maintained over time. The maintenance of belt conveyors is as important as the maintenance of any other mechanical systems to maintain or increase system reliability and to reduce the cost of system downtime. In general, BCS maintenance can be divided into the inspection and monitoring of the total system and its specific components and the replacement and/or reparation of components (Lodewijks, 2003).
Today, for most BCS, the critical components like the drives and the bearings of major pulleys can be monitored in real time. Once abnormalities are observed from the monitored components, information or failure alarms can be provided to human operators. Sensors, which are widely available and have been used in other industrial monitoring fields, can be applied for measuring the key parameters of BCS such as speed, torque, tension, power, etc. These sensors are traditionally used for individual monitoring systems, which focus on specific BCS components. The analyses of the information from various sensors are done separately. A system which combines the outputs of these sensors to evaluate the technical health of an entire BCS does not exist yet.
When the operational status of a BCS changes in time and the result of a change in operational condition can be detected, the question arises whether the change is normal. For instance, a change of loading/unloading the belt may be a normal operational condition but a change caused by operational problems such as wear and tear of BCS components may lead to system downtime. Presently, the answer to the question and the decision for maintenance and

8 Intelligent Belt Conveyor Monitoring and Control
operational activity come from human specialists. This can be time consuming and labour intensive and the results can be inconsistent because different specialists may differently interpret the information representing BCS conditions. In addition, maintenance decision-making can only focus on specific components because the information is collected from individual monitoring systems. To entirely understand the operational status of a BCS, automated and intelligent monitoring is required, combined with automated maintenance programming.
Four BCS maintenance strategies can be identified (Lodewijks, 2004): random maintenance, corrective maintenance, preventive maintenance and predictive maintenance. In the concept of predictive maintenance, BCS components are monitored and their degradation is predicted. Maintenance can be carried out when an opportunity arises if the imminent failures are predicted. It is clear that only this concept satisfies the requirements of intelligent monitoring and automated maintenance because predictive maintenance is the only condition-based strategy. Five main steps towards automated maintenance are as follows:
Step 1. Visual observation and inspection of critical BCS components followed by human decision-making and manual maintenance and control activities;
Step 2. Automated monitoring (sensors) of critical BCS components followed by human decision-making and manual maintenance and control activities;
Step 3. Automated monitoring (sensors) of most BCS components followed by human decision-making and manual maintenance and control activities;
Step 4. Automated monitoring (sensors) of most BCS components followed by automated decision-making (computer) and manual maintenance and control activities (the aim of this research project);
Step 5. Automated monitoring (sensors) of most BCS components followed by automated decision-making (computer) and automated maintenance and control activities (robots) (Lodewijks, 2004).
The IBCMC research project aims at the achievement of automated monitoring and automated decision-making in step 4. Automated monitoring concerns the use of sensors and the application of diverse monitoring technologies, which can be successfully employed to automatically provide accurate data for the intelligent system. Automated decision-making relies on technologies for achieving intelligent abilities in BCM, which will be discussed in the next chapter. In this chapter, Section 2.1 discusses the objects of BCM and lists the main aspects and parameters that need to be monitored in order to represent the overall status of a BCS. Section 2.2 reviews the sensors and monitoring technologies that traditionally applied in BCM. A novel embedded conductive detection system, which was developed within this research project, is presented in Section 2.3. Section 2.4 discusses the challenges of automated BCS monitoring towards automated maintenance decision-making.

Monitoring of Belt Conveyor Systems 9
2.1 Objects of Belt Conveyor Monitoring
Since the early days, BCS components were inspected by human inspectors. This however, has its limits. Firstly, the inspection results could be inaccurate or inconsistent due to the lack of the skill or experience of human inspectors. Secondly, human inspection is labour intensive. Especially when a large-scale BCS has to be inspected, an inspector has to walk the full length of the conveyor to inspect its components. Thirdly, the inspection results could be inconsistent due to the fact that not all inspections are carried out by the same inspector.
Table 2.1 Parameters, aspects and technologies for determining BCS status
Parameter/aspect Component Sensor/technology
Surface Visual detection Belt condition
Steel cables Conductive detection
Belt
Brake disk Speed
Motor
Optical/magnetic encoder Magnetic RPM pickup sensor
Motor shaft
Brake shaft Torque
Pulley shaft
Torquemeter
Take-up
Belt Force & Tension
Frame
Strain gauge
Pulley
Idler roll Vibration
Rotating drive/brake system components
Acoustic vibration sensor Accelerometer
Power Motor Watt meter Torque sensor
Belt misalignment Alignment switch Position
Take-up displacement Optical encoder
Ambient
Material
Belt cover
Brake disk
Pulley shaft
Temperature
Motor
Thermocouple Infrared temperature sensor
Nowadays, these limits can be overcome by means of various sensors and computer technologies, which enable BCS monitoring to be automated.

10 Intelligent Belt Conveyor Monitoring and Control
Automated monitoring of belt conveyors in the early stage focused on critical components in response to potential catastrophic failures. For instance, most attention has been given to the monitoring of the conveyor belt because the belt is the most important and expensive component that may represent up to two third of the total investment of a horizontal BCS. Since the mid-1980’s, when the application of steel cord belts became wide spread, NDT technologies have been applied for monitoring belt conditions (e.g. steel cord damage). Nowadays, almost all BCS components can be monitored in real time. Sensors and monitoring technologies, which are applied in other industrial fields, have been introduced to monitor various BCS components. Computer advances allow signal processing techniques to be used to enhance the quality of the information obtained over traditional methods (Polak and Pande, 1999). Monitored data can be analyzed by computers to understand the changes in the system over time. Further, besides the monitoring of individual components, the overall status of a BCS can be assessed with respect to system reliability. The term of BCM implies a modern monitoring system that considers a belt conveyor as an entire system instead of only the belt or an individual component.
Hence, a BCM system should be able to integrate the information derived from individual monitoring systems to present an overview of the operational status of a belt conveyor. Table 2.1 shows the main parameters and aspects that should be taken into account in a BCM system. Sensors and monitoring technologies, which have been commonly and successfully used to monitor these parameters and aspects, are listed. These technologies are described further in this chapter.
2.2 Technologies of monitoring belt conveyors
The monitoring of BCS is highly distributed. To monitor the belt, sensors can be installed at fixed positions since the belt continuously moves through the conveyor. To monitor other components, sensors can be distributed to the positions of monitored components. Most BCS components rotate or move during operation so that their conditions can only be assessed when they are operating. Therefore, non-contact monitoring technologies play the main role.
2.2.1 Belt condition monitoring
The condition of a conveyor belt is a combination of the conditions of (1) belt surface that includes top and bottom covers, (2) the belt’s interior that includes belt carcass rubber and steel cables or fabric layers, and (3) conveyor belt splices.
2.2.1.1 Belt interior monitoring
Conductive monitoring is the most popular technology employed to monitor belt interior or carcass condition in case of steel cord belts. In principle, a conductive monitoring system contains one or more conductors which generate or reflect signals to one or more detectors. The detector receives and transfers the signals to a DAC device.
Conductors can be embedded into the belt carcass to form an embedded conductive monitoring system. In this type of applications, conductors can be circuit coils, conductor

Monitoring of Belt Conveyor Systems 11
loops, transponder chips or magnets. Detectors can be inductive or conductive couplings, magnetic sensors or powered transmitter/receivers. These detectors are contactless to the belt and located on the travelling path of conductors (Figure 2.1). Detectors receive the signals such as electrical pulses or induced electromotive force signals from conductors when the conductors pass through the electrical or magnetic fields generated by the detectors.
Figure 2.1 Principle of embedded conductive monitoring
One typical application of embedded conductive technologies is to monitor the condition of belt splices (Alles and Wach, 2000). The belt splices are monitored with the aid of two transponders chips which are located in front of and after the splice region (Figure 2.2). Both transponder chips transmit respective signals to an external transmitter/receiver unit, wherein a conclusion is drawn as to the spacing of the two transponder chips on the basis of the time
dependent spacing of the two signals. If the spacing S of the transponder chips exceeds a
predetermined amount refS , then the external transmitter/receiver unit draws a conclusion as
to a critical change in length of the splice and corresponding measures are initiated.
Figure 2.2 Belt splice conductive monitoring
Embedded conductive technologies have also been applied for monitoring belt tears (Lowe and Enabnit, 1973; Gartland 2002), belt tension (Alles, 2001), belt speed (Alles, 1997), belt carcass (Strader, 1986) and belt surface (Alles, 2002).
In some cases, a conductive monitoring system has only detector(s) which receive the signals transmitted from the monitored items themselves. For instance, an early application of conductive belt monitoring was to use transducers to generate a magnetic field that charges the steel cables in the belt. The electrical field transmitted by the cables can be measured and

12 Intelligent Belt Conveyor Monitoring and Control
the distortion of the magnetic field can be detected to indicate steel cord condition (Figure 2.3). This type of applications magnetizes the steel cords and measures the induced electromotive force that is generated by the magnetic field at cord ends, breaks or damaged areas. Any imperfections or changes in the steel cords will cause changes to the magnetic field. These disturbances of the magnetic field, when measured and recorded, can be used to indicate the presence of cord breaks, cord damage or corrosion and splice rip or just the presence of a splice.
Figure 2.3 Steel cords monitoring (Harrison, 1985)
Figure 2.4 Report of belt splice monitoring (Conveyor Experts B.V., 2004)
Traditionally the induced electromotive force signal is converted to an image or a series of lines on a length of chart paper, which must be calibrated and interpreted by well-trained technicians. For instance, Figure 2.4 shows one part of a NDT report for belt splice monitoring, which was carried out by the company Conveyor Experts B.V., the Netherlands.

Monitoring of Belt Conveyor Systems 13
The left chart contains a typical signature for a splice reflection caught by the sensor as the splice passes, which indicates a healthy condition of the monitored splice. In the right chart, deviations from the signature on the trace represent some sorts of splice damages.
2.2.1.2 Belt surface monitoring
Figure 2.5 Belt surface monitoring and output (Conveyor Experts B.V., 2004)
Cameras are typically used for photographing monitored objects. The image data can be analyzed automatically or by a specialist. To automate belt surface monitoring, high speed cameras can be used for tele-monitoring and pattern recognition with computer systems (Figure 2.5). One of the most important points about surface vision monitoring is the development of an image processor which enables automatic analysis of images (Alport et al., 2001). The basic features of the image processor include recognition algorithms, the capability of taking partial pictures to save the memory of the processor, and processing arithmetic that facilitates high calculation rates. However, currently the analyses of belt images are mostly done by inspection specialists because:
to develop an image processor is time consuming;
the algorithms of image recognition can be developed for specific conveyor belts but hardly be generic due to the diversity of various BCS;
inaccurate analysis results can be incurred by poor image quality due to the harsh environment in belt conveyor fields.
Simple cameras can be used to scan imprint on belts for collecting belt manufacturing information.
2.2.2 Speed monitoring
One of the most fundamental aspects of BCM is to measure the belt speed. Not only is this monitoring necessary to confirm that the conveyor is indeed operating at its design speed, but more importantly to verify the starting and stopping dynamics of the overall conveyor system (Lodewijks, 1998). Rotational speed is another key aspect when monitoring the operational condition of rotary BCS components such as the motor, the pulleys and the brake disc.

14 Intelligent Belt Conveyor Monitoring and Control
Both belt speed and rotational speed in BCM can be measured by angular encoders. Based on the measuring principles (Norton, 1989), velocity in BCM applications can be measured by optical angular encoders (Figure 2.6) or magnetic angular encoders (Figure 2.7). In an optical encoder, a transparent disk is provided with a pattern of opaque segments on one of its surface. These segments interrupt a light beam and prevent it from illuminating a light sensor (or reflect a light beam to illuminate a light sensor sided with the light source). Therefore, binary outputs of “0” and “1” are produced when opaque segments pass through the light sensor. In a magnetic encoder, a nonmagnetic disk is provided with a pattern consisting of magnetized segments on one of its surfaces. A ferromagnetic core, provided with an input winding and an output winding, is placed above these segments. When the magnetic segments pass through the core, binary outputs of “0” and “1” are produced.
Disk
Segments
Output
Axis Light
Figure 2.6 Principle of optical encoder
Disk
SegmentsCore
Input Output
Flux
Axis
Figure 2.7 Principle of magnetic encoder
The counting of the binary outputs can be translated to a speed in rotation ( rn ) of the encoder
disk. Further, the speed ( v ) of the belt or a rotary component can be derived from the linear
relationship of 2 rv rn , based on a known radius (r) of the rotating sensing device of the
encoder.
In angular encoder applications, the speed of a BCS component can be easily measured by contacting method by an encoder device mechanically linked or attached to the monitored object. One typical application is to let the rotating sensing device, which is a wheel, of an angular encoder run against the belt and to count the rotations of the wheel over time (Figure 2.8). When applying two angular encoders this way, one against the running side of the belt (the side supported by idler rolls) and another against the drive pulley, belt slippage can be indicated by any difference between the measured belt speed and the translated linear speed of pulley rotation.

Monitoring of Belt Conveyor Systems 15
Figure 2.8 Belt speed monitoring by tachometer
2.2.3 Force, tension and torque monitoring
Strain gauges are the most commonly used devices for strain measurement, which have been in use for many years as the fundamental sensing element for measuring force, tension and
torque. Strain ( ) is the deformation of a mechanical part due to an applied force (F) which
results in a stress ( ). Strain can be defined as the linear fractional change in the length of the
mechanical part (Figure 2.9), as shown by (2.1).
L
L (2.1)
LL
FF
Figure 2.9 Elongation of a mechanical part
The applied stress, which can be used to calculate the force, tension or torque acting on the mechanical part, has the relationship with strain as
G (2.2)
where G is the Young’s Modulus of the material of the mechanical part.
A strain gauge consists essentially of a conductor or semiconductor of small cross section. The majority of strain gauges are low-cost metal-foil gauges, available in a wide choice of shapes and sizes to suit a variety of applications. The metallic foil is supported on the insulting flexible backing of strain gauge (Figure 2.10), which can be mounted to surfaces. A strain gauges operates on the principle that the electrical resistance of the foil changes in a

16 Intelligent Belt Conveyor Monitoring and Control
defined way as the foil is subjected to stress caused by the longitudinal or angular deformation of a monitored object (Turner and Hill, 1999).
Figure 2.10 Metal-foil strain gauge
Figure 2.11 Four active gauges Wheatstone bridge
To measure strain by means of strain gauges, it requires accurate measurement of very small changes in the resistance of the metallic foils. Therefore, stain gauges are almost always used
in a Wheatstone bridge configuration with a voltage excitation source ( ExV ) and a
measurement output voltage ( outV ) (Figure 2.11). Strain gauges can be connected into a
Wheatstone bridge circuit with the configurations of single active gauge (quarter bridge), two active gauges (half bridge) and four active gauges (full bridge). For these three types of configurations, respectively, the output voltage of the bridge has the relationships with the measured strain as:
1
4 12
gout Ex
g
GFV V
GF
(2.3)

Monitoring of Belt Conveyor Systems 17
2
gout Ex
GFV V
(2.4)
out Ex gV V GF (2.5)
where gF is the gauge factor of strain gauges.
The configurations above can suit respectively to measure axial strain, bending strain and torsional strain. In most cases, the configuration of full bridge, which is connected by four gauges with equal resistance, is used to obtain maximum sensitivity and temperature compensation.
In force measurement, strain gauge force sensors are the most commonly used type of force transducer, to the extent that, the term “load cell” usually implies this type of sensors. The measurement range of a load cell may extend from kilograms to hundreds tons. Load cells are applied in BCM for example to monitor the belt tension (Figure 2.12). A load cell installed in the cable arrangement of the take-up system can be used to monitor the take-up tension. A load cell installed in the belt supporting idler can be used to monitor the belt load.
Figure 2.12 Universal load cell
In torque measurement, the motor shaft or the pulley shaft has four strain gauges bonded to them (Figure 2.13) to form a full Wheatstone bridge circuit. When the shaft deforms due to a change in braking or driving torque, the electrical resistances of the metallic foils change as well. This unbalances the Wheatstone bridge, which results in an out-of-balance output. Such an output relates to the stress acting on the shaft and can be converted to a torque value.
In BCM applications, the strain gauges can not be directly connected to DAC devices by wires due to the rotation of the shaft. Therefore, wireless signal transmission is required. To do so, a transmitter is mounted on the rotating shaft and wired to strain gauges. The transmitter excites strain gauges, amplifies, converts and transmits the outputs of strain

18 Intelligent Belt Conveyor Monitoring and Control
gauges to an outside receiving antenna. The receiving antenna transfers the measured torque data to DAC devices.
Figure 2.13 Strain gauge amounted on shaft
2.2.4 Vibration monitoring
Vibration occurs when a BCS component oscillates about its equilibrium points, such as the rotation of a pulley, the bearings of idler rolls and drive system gearbox, or the fluctuation of the belt surface. The condition or the operational status of such BCS components can be monitored by detecting the vibrations.
Vibration can create sound and the generated acoustic waves travelling through air can be detected by acoustic sensors. In practice, the measured vibration signals are complex waveforms that need to be identified and examined by sound or vibration analyses. To do so, the signals can be converted to the frequency domain mathematically by using Fourier transform or Laplace transform. Fourier transform is the most common method to gain the magnitude in decibels (dB) and the associated radian of the frequency components in signals. A frequency component is a wave with certain patterns persisted in the whole measurement. In CM, the normal vibration magnitudes of a BCS component can be recorded when the component runs in the early stage of its life. Such records provide a normal frequency/amplitude data so-called signature (Noltingk, 1985). Then the BCS component is monitored at periodic intervals during its life. When the measured vibration magnitudes are different from the signature, the variations may indicate the changes in component condition.
In recent years, mathematical modeling and computer simulation have been applied to the condition monitoring of gearboxes used in the driving systems of belt conveyors (Bartelmus, 2001) (Bartelmus and Zimroz, 2009). Besides the focus on condition based maintenance for belt conveyor driving systems (Bartelmus and Zimroz, 2008), one typical application of this approach was the diagnosis of one-tooth failure of gearings (Bartelmus and Zimroz, 2001). Failures caused by the fracture of a tooth, the chipping of a tooth tip and the complete or partial breakage of a tooth may also occur. Such one-tooth failure is difficult to detect by analyzing the vibration signals. It is possible to identify the symptoms of a one-tooth failure by examine signals obtained by computer simulation. Figure 2.14 shows the diagnosis of the occurrence of this fault.

Monitoring of Belt Conveyor Systems 19
Figure 2.14 Vibration time-frequency spectrogram (Bartelmus and Zimroz, 2001)
Figure 2.14 (a) shows the spectrogram of the periodic increase in signal intensity with the period of signal amplitude for the case of bad gear condition due to tooth fault. A visual inspection of the gearbox is hard to reveal the fault of the gearing. In this situation, computer simulation is able to find possible regular occurrence of signal intensity changes and to confirm the occurrence of the fault. In Figure 2.14 (b), the results from computer simulation are given in a time-frequency spectrogram. The horizontal lines in the spectrogram represent the tooth mesh frequency components for gearing without fault. For the signals with the fault, in the spectrogram the vertical lines with a time period equivalent to the period of gear fault repetition are visible. Based on the simulation results, the instantaneous changes on gearbox can be indicated.
2.2.5 Power monitoring
The direct means of monitoring power is to use watt transducers. Electrical power can be simply derived from the product of voltage, current and the power factor. The multiplication can be performed by electronic circuitry that is usually digital and that can be incorporated in a watt transducer. It is often done by the computer for DAC that allows voltage and current as well the computer-derived power to be displayed.
Another method of monitoring conveyor power is by measuring the strain in the drive pulley shaft which is caused by the applied torque. Then the power can be derived by the product of torque and conveyor speed, divided by the radius of pulley. In this way, the monitoring of conveyor power goes to the monitoring of the torque of motor shaft.
2.2.6 Misalignment monitoring
Belt misalignment and take-up displacement are two important aspects to monitor a belt conveyor. The belt can run into the structure due to belt misalignment. It will result in damage to the belt and rollers and the spillage of the conveyed material. Belt alignment switches are traditionally applied to monitor the transverse position of the belt (Figure 2.15). Generally, an alignment unit is used in a pair of on/off switches, one on each side of the belt to be protected

20 Intelligent Belt Conveyor Monitoring and Control
at points where belt misalignment is likely to occur. The unit is activated when misalignment of the belt exceeds a certain extent and thus the conveyor can be stopped before the belt or the associated rollers are damaged.
Take-up displacement can be measured with the speed encoders used for speed monitoring, which can be mounted on a take up sheave (Lodewijks, 1998). The linear take-up motion can be measured optically using pulse counting methods to provide the displacement instead of speed.
Figure 2.15 Belt alignment switch (4B Braime Elevator Components Ltd)
2.2.7 Temperature monitoring
Infrared optical measurement is one non-contact method of temperature monitoring in BCM applications. An infrared sensor measures infrared radiation from objects in its field of view, when infrared radiation enters through the front of the sensor, known as the sensor face. This method is effective for measuring the temperature on moving component surface (e.g. pulley shaft), high temperature (e.g. brake disc) and where a contact method would contaminate the devices (e.g. motor or brake). However, infrared optical method is not very handy for monitoring the temperature of idler rolls due to the large number and distribution of rolls.
Thermal temperature sensors can be applied for monitoring the temperature of ambience and transported material.
2.3 A novel Embedded Conductive Detection System
Various sensors can be applied to collect data from BCS components. Traditional BCM schemes monitor only one or few aspects of a BCS and act upon them individually. However, the conditions of monitored BCS aspects usually depend on each other. For instance, if the tension of a belt is measured and it is found to be too high, then this can be caused by a number of factors including the drive force, the load on the belt and the take-up force. To ensure a BCS functioning properly, an IBCMC system tends to simultaneously acquire as much data and information from BCS components so that the interdependency among monitored aspects can be discovered. This can be achieved by either integrating individual

Monitoring of Belt Conveyor Systems 21
monitoring systems into an overall BCM system that focuses on the entire BCS, or by developing novel monitoring systems that are able to acquire data and information from as many as parameters simultaneously. The technologies of system integration are introduced in Chapter 6. A novel Embedded Conductive Detection (ECD) system has been designed and implemented in this research project. This ECD system is able to detect and monitor most of aspects and parameters relevant to the conveyor belt. This section presents the design principles of the ECD system. The implementation of this system is shown in Chapter 7.
2.3.1 An embedded conductive detection system
An ECD system has been designed to simultaneously acquire data and information from quite a few monitored BCS parameters and aspects (Pang and Lodewijks, 2006d). In view of integrating data and information in BCM, the designed ECD system is original in the sense that the designed system tends to overcome some limitations of traditional BCM technologies, with its characteristics of passive measurement, minimum maintenance, low cost, long life time, non-contact monitoring, fitness in harsh industrial environment, and the simplicity of manufacture. The results of laboratory experiments, which are presented in Section 7.1, proved that the data and information collected by the ECD system can be easily represented and comprehended by common computer systems and can be used for intelligent monitoring applications.
2.3.2 Primary principles
The primary principle of the ECD system is to embed magnets in the carcass of the conveyor belt to generate magnetic data that exposes the information of belt conveyor situations when magnets pass through outside sensors (Figure 2.16). The magnetic field sensors measure magnetic fields and/or magnetic flux by evaluating a potential, current or resistance change caused by the changes in magnetic field strength and direction.
MagnetsBelt
Magnetic Sensor
Measurements of magnetic Sensor
Figure 2.16 Primary principle of ECD system
The output of magnetic field sensors can be an analogue current, voltage or frequency, or a digital, parallel or serial computer signal, which matches the requirements of industrial measurement standards. Figure 2.16 shows the analogue voltage measurements of a magnetic sensor when magnets passing through. In this research project, Hall effect magnetic sensors

22 Intelligent Belt Conveyor Monitoring and Control
were selected in designing the ECD system since they are contactless, small in size, robust, reliable, not sensitive to harsh and polluted condition, and low cost (Racz, 2001).
Figure 2.17 Principle of two-axis Hall sensor (Schott et al., 2002)
Figure 2.18 Output signal X- and Y- Axis
The application of the Hall effect sensors are based on the patent application of Schott (Schott et al., 2002) (Figure 2.17). The magnetic sensor is a combination of a CMOS Hall circuit and a thin ferromagnetic disk. The CMOS circuit contains two pairs of Hall-elements for each of the two axial directions parallel with the sensor chip surface X and Y. The Hall sensor is positioned in the vicinity underneath a small permanent magnet with round shape. The magnetization axis of the magnet is perpendicular to the sensor plane. When the magnet

Monitoring of Belt Conveyor Systems 23
moves parallel to the plane, the magnetic field at the sensor rotates. The output signal xV
behaviours like 2/X B d and the output signal yV like 2/Y B d , with X and Y being the
coordinates of the magnet with respect to the sensor, B being the field strength at the sensor and d being the distance between magnet and sensor. When the magnet moves parallel to the
x-axis, the coordinate Y is constant and the ratio / /x yV V X constant is a very linear
measure of the position of the magnet (Figure 2.18). Using the two-axis Hall sensor, the principle can be extended to linear two-dimensional position sensing.
Table 2.2 Parameters and aspects measured by ECD system
Parameters Aspects
Belt splice
Head and tail of belt splice
Belt longitudinal position (relates to belt velocity and acceleration) Identity
Belt rolls
Belt Speed
Pulley
Belt cover Wear
Belt edges
Belt tension during diverse system states (relates to belt overload protection)
Tension Belt tension at specific position (relates to the tension of special belt splice)
Transverse position
Belt position (relates to BCS structure, side guide rolls, idler rolls and pulleys, belt run off, misalignment, and danger of belt hitting the structure.)
Vibration Belt (belt horizontal position relates to detect belt lift off)
This section presents the principles of detecting various BCS aspects and shows the design and configuration of an ECD system in general, based on a primary ECD system that has been developed and tested in laboratory environment. The properties of the used magnets and magnetic sensor in the primary ECD system are given in Appendix A. The application of the tested ECD system, including system composition and implementation, is given in Section 7.1. Practically, such ECD systems can be formed by selecting various configurations, magnets and magnetic sensors.
2.3.3 Objectives of acquiring data
The ECD system mainly detects and measures the following BCS parameters: identity, speed, wear, tension and position (see Table 2.2).

24 Intelligent Belt Conveyor Monitoring and Control
2.3.3.1 Identity and position
When a conveyor belt is being monitored, the acquired data and information need to be combined with the information about the position where an abnormality happens. Then the location of maintenance activities can be identified. The ECD system identifies two main items: the exact longitudinal positions of the belt during the detection and the identities of splices that distinguish different splices of the belt.
Principally, in the ECD system, a line of magnets is designed to provide binary information for position and identity. Such a line composed of magnets groups is named as identity line in the ECD system. Figure 2.19 shows three magnets groups in one identity line where each group is composed of 4 magnets. When a group of magnets passes through the magnetic sensor, each magnet provides a magnetic signal of either 0 or 1. The combination of four signals of a magnets group is a series of binary codes that indicates a position of the belt or an
identity of a splice. In total this magnets group identifies 1624 positions. In general, the
numbers of identity lines, the magnets groups in one line and the magnets in one group can be determined based on the length of the BCS, the number of belt sections and/or the number of
belt splices. If one has the design of nL identity lines with nM magnets in each group, the
total positions can be identified are nn ML 2 .
Figure 2.19 Identity and position detection
Following sections show that an identity line is used not only to define positions of the belt itself but also can be used to measure speed, tension, position and wear on belt edges.
2.3.3.2 Vibration
Changes of the distance between magnets and a sensor cause the changes in strength of the magnetic field that indicate the vibration or the vertical displacement of the belt. Figure 2.20 shows the principle the belt vertical displacement is measured, where dot lines indicate the belt vertical displacement from its original position and the deviation of the voltage outputs of the magnetic sensor caused by belt vibration.

Monitoring of Belt Conveyor Systems 25
Figure 2.20 Vibration detection
2.3.3.3 Abrasion
Wear detection includes two aspects: the wear of belt covers and the wear of belt sides. Figure 2.21 shows the principle of cover wear detection. Magnets are embedded, at the same depth, in the belt carcass. The sensor is tightly pressed against the belt surface by a spring so that the distance between sensor and belt surface is kept constant. When wear occurs, the belt cover thickness decreases and the distance between the sensor and the magnets reduces. Then the output voltage signals of the sensor will become stronger (the dot lined signal) compared to the original signals (the solid lined signal), as shown in Figure 2.21. The location of the belt abrasion can be identified by using the information from the identity line of the ECD system.
Figure 2.21 Wear detection
For belt edge wear detection, the magnets placed in the identity line are used. Without influencing the functions of the identity line, the magnets of the identity line are embedded as close as possible to the cord in the vertical direction and as close as possible to the belt edge in the transverse direction. When the belt edge is worn to a certain extent, the magnet will be lost and its magnetic signal disappears.
2.3.3.4 Tension and speed
In the ECD system, the principle of measuring belt tension is shown in Figure 2.22. Three magnets, a, b and c, are placed on a line. Magnets b and c are located at the tail and the head of one splice, respectively. Magnet a is located outside the splice area.

26 Intelligent Belt Conveyor Monitoring and Control
Figure 2.22 Tension detection
The time stamps of each magnet passing through a sensor can be measured. In a situation of
an unloaded and healthy belt, time stamps of each magnet are defined as 0at , 0bt and 0ct which
denote the times of three magnets passing through the sensor. Then the period between
magnets b and a pass the sensor ( 0bat ) and the period between magnets c and b pass the
sensor ( 0cbt ) can be expressed as
0 0 0 0 0 0cb b c ba a bt t t and t t t (2.6)
respectively. In a situation of a loaded and healthy belt, time stamps of each magnet are
referred to as alt , blt and clt . Similarly the following relationship can be obtained.
cbl bl cl bal al blt t t and t t t (2.7)
where balt and cblt are the period between two neighbour magnets pass through the sensor
in loaded situation. With a time criterion 0t , the belt tension situation is evaluated as
follows
0 0 :bal bat t unloaded state
00 :bal bat t t loaded state (2.8)
0 :bal bat t t overloaded state
A potential rip of splice can be defined with a time criterion 0t when the relationship
0 0cb bat t t or
cbl balt t t (2.9)
is found.
As discussed above, the distance between magnet a and magnet b is know as 0bal in the
unloaded and healthy situation and known as ball in the loaded and healthy situation.
When the belt is in a steady running state, the following relationship holds
0 0/ /ba ba bal balv l t or v l t (2.10)
where v is belt speed.

Monitoring of Belt Conveyor Systems 27
2.3.3.5 Misalignment
A line of magnets embedded in the belt, for instance the identity line, can be used to detect the transverse misalignment of the belt. Due to the fact that a belt might misalign too much and the magnet line deviates from the measurement range of a sensor, a sensor ruler can be designed to detect belt misalignment amplitude continuously.
Figure 2.23 Belt misalignment detection
Figure 2.23 shows a sensor ruler which is composed of a series of magnetic sensors to provide several signal channels. When magnets pass through the ruler, the sensor which the magnets pass through its measuring range will be triggered. The belt misalignment is then detected by firstly checking the triggered channels. The exact belt transverse position can be measured by evaluating the strength of the magnetic signals of triggered sensors. In Figure 2.23, the outputs of triggered sensors for detecting two transversal belt positions are shown. In the detection of belt position I, only sensor 0 and sensor 1 are triggered therefore the outputs of channel 2 and channel 3 are zero. The outputs of channel 0 and channel 1 indicate that the magnet line is within the measuring ranges of triggered sensors and closer to sensor 1. By knowing the exact measurement ranges and outputs of sensors, the position of the magnet line can be determined.
2.3.4 The magnet matrix
In this research project, the ECD is one of the most original parts of developing an IBCMC system. Based on the detection principles described above, a novel ECD system was designed. In this system, the belt is equipped with a magnet matrix. The matrix is composed of several magnet lines. Each line is composed of series of magnets groups. Each group contains of 1 to 4 magnets. Figure 2.24 and Figure 2.25 show the design of a five-lines magnet matrix including two identity lines (i-lines) and three general lines (g-lines). The design principles of the i-lines and g-lines are described below.

28 Intelligent Belt Conveyor Monitoring and Control
i-lines are composed of series of magnets groups. Each magnets group includes 0 to 4
magnets to basically provide binary code for the longitudinal position. A totally of 6428
longitudinal positions are identified by two i-lines (Figure 2.24). i-lines are used to detect the longitudinal position, belt edge vibration, tension and potential rip, belt speed and belt misalignment.
Figure 2.24 Top view of the magnet matrix
Figure 2.25 Longitudinal section view of magnet matrix
Figure 2.24 shows that i-lines are placed at each side of the belt and as far as possible from g-lines to avoid magnetic interference with the closest g-line when detecting transverse belt positions. Figure 2.25 shows that i-lines are placed in the middle of the belt in the vertical direction to avoid losing magnets caused by belt cover wear.
g-lines are composed of a series of single magnets. They provide information on belt surface vibration and especially the belt cover wear situation.
The density of the magnet matrix is determined by the longitudinal distance between two magnets within one magnets group, the longitudinal distance between two magnets groups, and the distance between two magnet lines. First of all, each magnetic signal should be immune from signals of other magnets. Depending on the total length of the conveyor belt and the distribution of belt splices, the distance between magnets or magnets groups could be meters in longitudinal direction.
The longitudinal distance between two magnets groups and the distance between two magnet lines are determined by the pre-designed requirement of monitoring systems. The distance

Monitoring of Belt Conveyor Systems 29
between the i-line and the g-line should be large enough to avoid magnetic disturbances caused by magnets in the g-line when a sensor ruler is used.
2.4 Challenges of Automated Belt Conveyor Monitoring
Traditional BCM and maintenance works tend to be carried out in response to the abnormality and failure of individual components so that the outputs like failure alarms are very straightforward and there was little or no predictive maintenance performed. An automated monitoring system should be able to identify subtle changes in operation that may indicate a mechanical or electrical problem is starting to develop. When abnormalities are discovered, the monitoring system should help predict serial system failures. It requires the system monitoring and diagnosis to be extended to a system level so that maintenance decisions can be made at a system level as well. Therefore, separate monitoring systems of BCS components need to be integrated into one system. However, the integration of individual monitoring systems and various monitoring technologies brings challenges in automated monitoring and maintenance programming.
Firstly, some of the traditional monitoring systems present the monitored data in a manner of a series lines on a length of chart paper or in a visual graphic format. These are typically in the case of conductive monitoring and camera scanning. The data from these systems must be calibrated and interpreted by human specialists. The monitoring results are not in the suitable format that allows monitoring systems to be built in an automated way.
Secondly, the combination of individual monitoring systems requires the integration of a huge amount data. Data mining and DAN can be difficult. As well the integration of different systems encounters system complexity due to the complex relationships among monitored aspects.
Thirdly, the monitored data and corresponding knowledge for deciding what maintenance activities should be carried out are mostly not stored so that they are not reusable. Although this knowledge or data can be built up into a database system, the huge amount of information may result in information overflow and the retrieval of desired information and knowledge from the database can be a complex process.
In this research project, automated BCM and automated maintenance decision-making concern the selection and the development of suitable sensor systems for automated DAC, algorithms for automated interpretation of monitored data, methodologies for indicating the relationships of monitored aspects, approaches for integrating individual systems and technologies for knowledge retrieval and reuse.

30 Intelligent Belt Conveyor Monitoring and Control

31
3 Artificial Intelligence
The development of an IBCMC system includes the integration of individual monitoring systems of BCS components so that maintenance and operational decisions can be made and improved on a system level. Due to the existing difficulties and complexities of traditional BCM and BCS maintenance programming, the IBCMC system was developed to overcome the inability of human being to automatically acquire and interpret data and information from BCS, store and reuse past experience and knowledge, assess overall BCS condition and improve maintenance decision-making strategies. To achieve these functions in an intelligent ways with less or without human efforts, various AI technologies, which have been widely and successfully used in other industrial areas, can be employed.
The field of modern AI was initiated by John McCarthy at the conference at Dartmouth College in the summer of 1956 (Jones, 2008). There is no exact and strict definition of AI. Since the 1970’s, some definitions of AI have referred to non-algorithmic reasoning and symbolic knowledge representation (Feigenbaum, 1977), the automation of human thinking, decision-making and problem solving (Bellman, 1978), the performance of intelligent functions (Kurzweill, 1990) and the techniques to handle knowledge for new not explicitly programmed results (Boullart, 1992). These definitions showed that mostly AI is concerned with thinking process and reasoning, which match the intelligent behaviours, in another word the intelligence, of the IBCMC system:
Intelligence is the calculative and deductive abilities, which are based on acquired data and information;
Intelligence is the probabilistic abilities to reason with uncertainty and fuzzy logic, which are considerably contained in acquired information;
Intelligence is the inference architecture of the human brain, which can be represented as neural network or belief network for reasoning in complexity;
Intelligence is the intuition of human beings in making decisions based on stored and reusable knowledge and experience;

32 Intelligent Belt Conveyor Monitoring and Control
Intelligence is the structure of human relationships, which is organized both locally and globally to form the integration of individual communities.
The above the considerations of intelligence present the desired functions of an IBCMC system and encourage the research of IBCMC in making use of AI technologies. In this research project, the IBCMC system was designed and developed as a knowledge-based expert system, which employs diverse AI technologies. This chapter firstly assesses the necessity and feasibility of introducing AI to IBCMC (Section 3.1). The fundamental of knowledge-based expert systems is presented in Section 3.2. Section 3.3 introduces the principles of fuzzy logic and Bayesian method, which are employed to achieve the calculative abilities, probabilistic abilities and inferable abilities of intelligence in IBCMC. Case-based reasoning (CBR), as an application of knowledge-based decision-making, is explained in Section 3.4. The last intelligent behaviours considered above, the integration of individual communities in IBCMC, will be discussed in Chapter 6.
3.1 Assessment of application scope
The first step of developing AI applications is the feasibility study of applying AI to a problem domain (Boullart, 1992; Saborido, 1992). In the development of a monitoring and control system in the field of belt conveyors, this step is to determine whether AI technologies are suitable for achieving intelligent abilities in BCM. An AI application can only be successful when there are real requirements for applying and when the application of AI technologies is the only possible solution or at least one more efficient solution for the problem domain. Therefore, an assessment of the potential of a successful AI system needs to be done in order to show whether AI is necessary and feasible to the industry using belt conveyors.
3.1.1 Necessity and feasibility study of AI application
A number of issues should be considered when determining whether the application of AI will be a proper and successful solution to the problem domain of IBCMC.
There should be at least one need for an AI application. For instance, the analysis of huge amount data from BCS is beyond the ability of the human brain so in that respect AI technologies are desired.;
The problem domain should contain problems that are hard to be effectively solved by means of conventional programming. AI applications may suit for the decision making behaviours of BCS domain specialists and operators without algorithmic solutions.
Problem-solving knowledge should be available. Various knowledge sources are available in the application fields of belt conveyors.
The expectations of AI applications should be limited because AI applications are based on specific knowledge in certain problem domains. In this research, the IBCMC system is not expected to fully replace human efforts in BCS operational control.

Artificial Intelligence 33
There should be at least one domain specialist who would like to cooperate in developing AI applications. Not all but still a lot of BCS domain specialists are willing to share their knowledge during the development of the IBCMC system.
To assess the necessity of employing AI technologies and to estimate the potential success of AI applications in IBCMC, a checklist can be applied (Beckman, 1991). In last decades, Beckman’s checklist has been commonly used to assess AI applications. This checklist categorizes the aspects and factors of an AI application. Each category contains several criteria. Each criterion is a question that can be answered as yes or no. Criteria are weighted by system designers and/or domain specialists to reflect the relative importance of each criterion in the AI application. The weights of all the yes answers of each category are summed to represent the score of the category. A future AI application can be considered as having a fair success potential if the maximal achieved score for each category exceeds 50% of the maximum possible score (Beckman, 1991). The higher the total score achieved, the higher the future success potential of the AI application will be.
Based on Beckman’s checklist, the aspects and factors of the IBCMC application can be categorized into six categories:
1. The category of desirable tasks concerns the complexity of the task, the existence of algorithmic solutions, the limitation of knowledge domain, etc. (25 points)
2. The category of potential payoff concerns the benefit/cost ratio. (20 points)
3. The category of domain specialists concerns the cooperation, communication and availability of domain specialists. Besides developing the AI application, AI designers need to stimulate domain specialists to be involved effectively into the project. (15 points)
4. The category of system designer concerns the knowledge, skill, expertise and experience of AI engineer(s). (15 points)
5. The category of customer and management concerns project management and the interest of customer. (15 points)
6. The category of users concerns the attitude of users. If the users do not need it, or the interface of AI application is not friendly, or they feel threatened by the future AI application, the users will not use it and the project will fail. (10 points)
According to Beckman (1991), category 1 and 2 are the foundation of a necessary and successful AI application so that each of them should score at least 50% to ensure the future success. In the development of the IBCMC system, sufficient support of domain specialist is always required from DAC to the final understanding of BCS performance. Therefore, category 3 should score higher than 50% to ensure successful IBCMC application. The other three categories have less importance. An achieved score lower than 50% for any of them implies potential difficulties in the future but the AI application can still be continued. In this case, the estimation of the AI application at least needs to achieve an overall score of 50% to

34 Intelligent Belt Conveyor Monitoring and Control
ensure higher success potential. These criteria were applied for assessing the IBCMC application.
3.1.2 Assessment of IBCMC application
To assess the potential success and benefits of an IBCMC application, the characteristics of Beckman’s checklist have been checked and evaluated by the developers of the intelligent system and BCS domain specialists. Following results are obtained:
1. Desirable task: 23 points achieved (Table 3.1);
2. Potential payoff: at least 15 points achieved (Table 3.2). Currently the users of belt conveyors have shown high interests in intelligent monitoring in order to increase their benefits. When implementing an IBCMC system, it is important to determine the appropriate level of system complexity with respect to the potential payoff of the system. Sampath (Sampath et al., 2002) discussed the relation between the return on investment and the complexity of an intelligent gas turbine engine monitoring system. Compared to Sampath’s system, the system complexity of traditional BCM concerns:
the amount of monitored aspects and parameters;
the number of sensors;
the accuracy of monitorring instruments;
the reliability of monitoring instruments;
the life time of monitoring instruments.
When IBCMC is implemented, the development of diagnostic techniques and the usability of the intelligent system should also be taken into account to assess system complexity. Figure 3.1 qualitatively shows the investment costs (dotted line) of an intelligent BCM system and the cost saving (solid line) gained by applying the system to increase the reliability of a BCS. The initial investment cost of the monitoring system, associated with a minimum number of signal processing units, interfaces and sensors, exceeds the cost saving because the minimally configured monitoring system impacts BCS operation only slightly. When increasing the complexity of the monitoring system, for instance when adding sensors or applying more accurate monitoring instruments, the cost savings exceeds the investment costs so that a significant net saving can be gained in BCS operation. However, cost savings are limited by the capability of the monitoring system and the operating condition of BCS. Excessively increasing system complexity will result in a loss rather than a gain on the net savings in BCS operation. One of the goals of this research project is to maximize the net saving by means of system integration with the minimum number of employed sensors. The results of such an achievement are presented by evaluating the implementation of the IBCMC system (see Section 7.4).

Artificial Intelligence 35
Table 3.1 Properties of the IBCMC: desirable tasks
Criterion Answer Score
task is primary cognitive, requiring analysis, synthesis or decision-making
yes 2
task involves symbolic knowledge and reasoning yes 2
task is complex and involves many parameters yes 2
task involves chains of reasoning on multiple levels of knowledge yes 1
task uses heuristics and requires judgment about subjective factors yes 1
task cannot be solved using conventional computing methods yes 1
task involves incomplete or inaccurate data yes 2
task requires explanation, justification of results, or reasoning yes 2
task requires classification rather than search and algorithms yes 1
task knowledge is confined to a narrow domain yes 1
task knowledge is stable yes 1
task can be subdivided; incremental progress is possible yes 1
task does not require reasoning about time and space yes 1
task is not natural-language intensive yes 1
task requires little or no common sense or general-world knowledge yes 1
task requires the system to learn from experience yes 1
the intended AI system is similar to an existing AI system yes/no 1
data and case studies are available yes 1
system performance can be accurately and easily measured no 0
23
Table 3.2 Properties of the IBCM: potential payoff
Criterion Answer Score
System would significantly increase revenues yes 2
System would reduce cost yes/no 1
System would improve quality yes 2
System would capture undocumented expertise yes 2
System would distribute accessible expertise to novice users yes 1
System would require no or minimal more data entry than current systems
no 0
System would be developed using commercially available tools yes 2
System maintenance will be low yes/no 1
System would be executable on an affordable computer system yes 2
Partial completion of the system would still be useful yes 2
System would result in benefit/cost ratio of at least 10:1 no 0
15

36 Intelligent Belt Conveyor Monitoring and Control
Figure 3.1 Return on investment of BCM system
3. Domain specialists: 15 points. IBCMC is nowadays highly desired by the users of belt conveyors. Therefore, the supports from domain specialists are always available;
4. System designer: 15 points scored from a maximum of 15 points;
5. Customer and management: The IBCMC research project was founded by both Delft University of Technology in the Netherlands and companies using belt conveyors. The development of the IBCMC system relied on the support from these companies and the cooperation between the university and companies. Based on the experience gained during the development of the IBCMC system, companies were willing to support this project by supplying expertise, serving at test sites, preparing test cases and providing data needed for system testing. At least 10 points can be scored in this category.
6. Users: 8 points. The primary goal of IBCMC is to monitor BCS and suggest maintenance and operational control decisions with less human efforts but not the replacement of human operations. Therefore the future users of an IBCMC system will be BCS operators and maintenance personnel and sometimes domain specialists. Since there are strong needs for automated BCM, it is likely that future user will be willing to use the system.
In total, a summation of the points scored in the six categories above gives the assessment in an estimate of 86% for a high success potential of AI application for IBCMC. The next step of developing the IBCMC system is to select proper AI technologies according to the requirements the system will satisfy and the tasks the system will carry out.
3.2 Knowledge-based expert system
The maintenance and operational decision-making for improving BCS performance relies on accurately gathered information and the experience and knowledge of domain specialists. In IBCMC, knowledge is widely derived from various sources besides human experts. As a system that has the intelligent capabilities of human beings, such as the capacities of analysis, diagnosis, learning and reasoning, the IBCMC system needs to be performed on the base of

Artificial Intelligence 37
acquirable data from BCS field and the reusable knowledge that is stored in the intelligent system. Over the last decades, computers have been used to enhance human ability in memory and calculations. In addition, AI technologies have been developed to emulate human’s intelligence. Knowledge-based systems (KBS), synonymously called expert systems (ES) or knowledge-based expert systems (KBES), form a subfield of AI that investigates the knowledge models and reasoning techniques for assisting human decision makers. These technologies enable the intelligent capacities of the IBCMC system to be achieved.
3.2.1 Expert system and knowledge-base systems
ES have considerably grown and become popular since their commercial introduction in the early 1980s (Liebowitz, 1998). Today, ES are used in business, science, engineering, manufacturing, and many other fields. ES have been defined in various ways but in general it can be said that ES are an artificial means to emulate the decision-making ability of a human expert. One of earlier ES pioneers, Professor Edward Feigenbaum (Feigenbaum, 1982), has defined an ES as an intelligent computer program that uses knowledge and inference procedures to give advices or solve problems that are difficult enough to require significant human expertise for their solutions. Based on this definition and the expected intelligent capacities of the IBCMC system, five characteristics of an ES can be distinguished:
Emulation: an ES is able to emulate the processes of human reasoning and problem-solving;
Learning: an ES is able to learn from past experience when the same problem has happened before;
Reasoning: an ES is able to fulfil reasoning based on heuristics knowledge and approximation;
Clarification: an ES is able to clarify its reasoning process, to justify its inference results and to explain obtained solutions and advices;
Correctness: an ES is able to present correct solutions within a reasonable time.
To achieve these abilities, the IBCMC system was designed to be an artificial expert to reason about the knowledge that is specifically focused on its problem domains. When the knowledge originates from sources other than human experts, the more general term KBS is used instead of the term ES. Due to the diversity of knowledge sources, which will be discussed in Section 4.2, the IBCMC system in this thesis is preferred to be termed as a KBES.
3.2.2 Architecture
A KBES mainly contains two parts, a knowledge base and an inference engine (Giarratano, 1998) (Figure 3.2). The knowledge base contains knowledge about the problem domain, commonly in the form of heuristic rules for instance “if…then” rules. The inference engine uses the rules to infer appropriate conclusions based on relevant portions of the knowledge

38 Intelligent Belt Conveyor Monitoring and Control
base and a set of facts that form the current input to the system. A KBES also needs to contain other components as a learning facility, explanation facility and uncertainty management program if the system is to exhibit the abilities to learn, explain and reason in uncertain environment. As well a KBES requires user-friendly interface since the users are not necessary familiar with the inner operations of the system.
Figure 3.2 Basic concept of KBES function
3.2.3 Knowledge representation
In the IBCMC system, the accumulated and analyzed data and information are considered as knowledge. The conversion process from data and information to knowledge is discussed in Section 4.1. In a KBES, a knowledge base is a file that contains knowledge and facts about its problem domain. The first step in development of a knowledge base is knowledge acquisition. This is the process of acquiring knowledge from knowledge sources. Next, the acquired knowledge is represented in the knowledge base in a format that the knowledge can be efficiently retrieved and used by the KBES. According to Schneider (Schneider et al., 1996), knowledge can be represented in three categories of trees, matrices and relational lists. The tree representation of a knowledge base is not suitable for reasoning multiple conclusions because the entire tree needs to be searched based on a directed tree graph. The matrix representation of a knowledge base requires large memory space for storing knowledge so that the knowledge search speed is slow (Xu et al., 2005). Therefore, the IBCMC system adopts the relational list knowledge representation, which is a simple data structure that enables easy modification, fast search and quick reasoning process to generate multiple conclusions. In the relational list representation, knowledge contains three elements. The first element represents the attributes of monitored BCS events. The second element represents the monitored situation. The third indicates a conclusion clause as the decision-making results. Detailed knowledge representation in the IBCMC system is introduced in Section 4.4.4.
3.3 Reasoning with uncertainty
As a knowledge-based problem solving systems, different sources of uncertainties exist in IBCMC applications. Most of these uncertainty sources can be attributed to either defective acquired data or defective domain knowledge. In the first situation, data collected from the field of belt conveyor may be imprecise, missing, in conflict, distorted or unreliable. In the second situation, the theoretical basis of representing domain knowledge may be vague or

Artificial Intelligence 39
incomplete because there are no precise concepts can be used to define and deal with BCS phenomena. For instance, a belt tension is not always constant during BCS operations due to the variation of the throughput of BCS, the effect of ambient temperature, etc. Therefore, the belt tension is hard to be represented under one criterion. As well, the uncertainties of the cause-effect relationships among monitored aspects are difficult to be discovered because the information of reflecting such relationships is not directly acquirable. As a result of defective knowledge, the reasoning mechanism of the IBCMC system might provide unambiguous descriptions of monitored BCS events and operational situations.
3.3.1 Dealing with uncertainty in IBCMC
Due to the variety of uncertainties, a single formalism for handling uncertainty is not sufficient for estimating the certainty of data and information that might be generated within the process of BCM. To diagnose BCS performance and to discover the potential causes of any system abnormalities, methodologies of causal modeling provide intuitive and mathematical tools to represent the complex relations between uncertain variables and failure causes. In past decades, various causal modeling theories were widely applied in handling uncertainties, such as Bayesian Belief Network (BBN) (Pearl, 1988), Artificial Neural Network (ANN) (Hecht-Nielsen, 1990), influence diagrams (Howard and Matheson, 1984), fault and event tree analysis (Khodabandehloo, 1996), failure mode and effect analysis (Wirth et al., 1996), temporal reasoning (e.g. situation calculus and event calculus (McCarthy and Hayes, 1969), features and fluents framework(Sandewall, 1994)), etc. However, not all methodologies can fully match the requirements of practical BCS operational decision-making. For instance, ANN provides only single direction inference from causes to effects and the network has to be re-trained once the environment changes; temporal model ontology is hard to represent partially ordered events in continuous changes; other time-developing diagrams and analyses use limit knowledge presentation as predicative information that is not suitable for overall BCM.
Compared with other methodologies, Bayesian method has the advantages of handling both certain and ambiguous information and knowledge, representing both discrete and continuous events, and reasoning with partial or limited information. Like the Bayesian method, Dempster-Shafer theory can also be applied in reasoning uncertainties. This theory is based on two ideas: to obtain the degree of belief for one evidence from subjective probability for related evidence and to combine the degrees of belief when evidences are independent. This theory more suits to uncertainty reasoning when the information probabilities of some evidences can not be described. However, because the degrees of belief are determined subjectively, they may yield contradict reasoning results. As well, this theory may lead to counterintuitive results in reasoning tasks such as representing incomplete knowledge and belief update. Bayesian method, by using fuzzy value evidence instead of either the subjective determination of belief degrees for evidence or the complex and time-consuming estimation process for gaining the prior and conditional knowledge for inference, was extensively

40 Intelligent Belt Conveyor Monitoring and Control
applied in the IBCMC application in system diagnostic and causal discovery (Section 4.3), knowledge retrieval (Section 5.1) and knowledge-based reasoning (Section 5.2).
Fuzzy logic and fuzzy decision analysis are employed in the IBCMC for dealing with approximated data and redundant data with combining probabilistic theories. The application of fuzzy logic in this research covers the approximation of monitored data, probabilistic memberships of monitored parameters, the quantification of gathered information and fuzzified knowledge representation.
3.3.2 Bayesian method
Based on the Encyclopaedia Britannica (1989), Thomas Bayes (ad. 1702 – 1761) was a mathematician who was the first to used probability inductively to establish a mathematical basis for probabilistic inference. His inference method is a means of calculating, from the frequency with which an event has occurred in prior trails, the probability that it will occur in future trails. Bayes’ contributions are immortalized by naming a foundational proposition in probability, called Bayes Rule (Leonard and Hsu, 1999). The Bayes rule is expressed as
( | ) ( )
( | )( )
P B A P AP A B
P B (3.1)
The inference based on Bayes rule relates the conditional probabilities and marginal
probabilities of two events A and B. In (3.1), ( )P A is the prior probability or the marginal
probability of event A. Prior means that event A is considered as independent and the
probability does not take into account any information about other events. ( )P B is the prior
probability or the marginal probability of event B. ( | )P B A is the conditional probability of B,
given A. This probability is the likelihood probability that shows how likely B will occur
when A occurs. ( | )P A B is the conditional probability of A, given B. It is the posterior
probability of event A, which is derived from or depends on the specified value of event B.
Bayes rule shows the relation between two conditional probabilities of ( | )P A B and ( | )P B A
that are the reverse of each other.
Bayes rule enables the utilization of the prior knowledge of an event to calculate the probability of other event(s) to gain the posterior knowledge. Therefore, Bayesian inference has been widely applied to discover the cause-effect relationship between evidences and hypothesis, or in other words, to discover the occurrence of one event when other events occur. In causal modeling and cause-effect inference, the Bayes rule can be used to derive the posterior probability of an event or an evidence (E) with observed hypothesis (H),
the ( | )P E H , to identify the cause of the hypothesis. Reversely, Bayesian inference can also
focus on deriving the probability of the hypothesis when an event occurs, the ( | )P H E , to
discovery the effect of the event.
Bayes rule is used to confirm the belief that the hypothesis is closer to the truth by means of the events that have been observed. Considering multiple events, the Bayes rule can be expressed in an inference theorem as

Artificial Intelligence 41
i ii
iii ePeHP
ePeHPHeP
)()|(
)()|()|( (3.2)
This formula uses the prior knowledge P(ei) of a set of events ei (i = 1, 2, …, n) to discover the posterior knowledge P(ei|H) of the set of events with given hypothesis H. The probability of hypothesis occurs, the P(H), is called the marginal probability which is expressed as
i ii ePeHP )()|( . ( | )iP H e is the likelihood probability in Bayesian inference.
Bayesian method provides inferences in two directions – forward Bayesian inference and backward Bayesian inference. Forward inference is the inference from causes to effects, which gives the prediction of the occurrence of event(s). In forward inference, Bayesian method discovers the probability of a hypothesis with known information of observed events. For instance, the probability of a poor stop operation of BCS with the indication of longer braking time can be derived from known information of worn brake pads and degraded braking hydraulic system. Backward inference is the inference from effects to causes, which provides diagnosis or explanation of the occurrence of event(s). In backward inference, Bayesian method concludes the conditional probability of observed events with occurred hypothesis. For instance, the main cause(s) can be identified to come from observed brake pads and braking hydraulic system, when a longer braking time is being known. Detailed application of Bayesian inference in IBCMC is given in Section 4.3.2.
3.3.3 Fuzzy logic
In BCM, monitored data or signals are the manifestation of a certain state or particular changes of BCS performance. Practically, the knowledge that a domain specialist uses to interpret BCS conditions is based on the classification of data, rather than on individual data. For instance, instead of interpreting single data of sensor signals, the inspection observation and the changes in BCS performance are likely to be seen as the instances of general classes, such as good, normal, healthy, or otherwise. However, the classification is hard to be accurately defined. In 1965, fuzzy sets were introduced by Zadeh (1965) as a methodology of representing and manipulating data that is not precise, but rather fuzzy. Fuzzy set theory is the formalism for reasoning about the phenomena forming the basis of fuzzy logic (Zadeh 1975), which provides the interpretation of objectified information in general classes. There are five main reasons to use fuzzy sets as a tool in BCM (Lodewijks and Ottjes, 2005):
Objectification of inspection results. This means that the results of an inspection performed by a human inspector in terms of linguistic expression can be translated in a number;
Increasing the consistency of inspection results performed by different human inspectors;
It allows fuzzy interpretation of observations;
It allows combination of inspection results with information from other sources;

42 Intelligent Belt Conveyor Monitoring and Control
The approach using fuzzy sets gives a straight forward advice.
The basics of fuzzy logic can be described by the membership function
: [0,1]A X (3.3)
which characterizes the fuzzy set A in a non-empty set X . ( )A x is introduced as the degree
of the membership of element x in fuzzy set A for each x X . The value zero is used to
represent complete non-membership. The value one is used to represent complete membership. Values in between are used to represent intermediate degrees of membership. A mapping of the fuzzy set is also called the membership function of a fuzzy set. Assume someone inspects the cracks on the surface of a conveyor belt. Decisions of maintaining or replacing a belt section can be made based on the inspected condition of cracks. The conditions can be represented as a fuzzy set on a universe of crack sizes and a “crack on belt surface” can be roughly interpreted such like shown in Figure 3.3.
Represented by this membership function, the condition of the belt surface can be evaluated by pre-set maintenance criteria based on the size of cracks. In Figure 3.3, cracks below 10mm can be considered as small which sizes might make almost no real difference to inspector’s eyes; cracks between 10mm and 15mm would have a variation in the size induces a weak preference to evaluate the crack as big; cracks between 15mm and 20mm could have a variation in the size induces a clear preference to evaluate the crack as big; cracks beyond 20mm can be always considered as big and maintenance or replacement of the belt section may have to be required.
Figure 3.3 Fuzzy set for belt crack classification
Membership functions can have different shapes, which enable various events to be represented by fuzzy logic. In BCM applications, the shapes of the membership functions depend on the parameter under consideration (Lodewijks and Ottjes, 2005). The applications of fuzzy logic in IBCMC are given in Section 4.3.
3.4 Case-based reasoning
Heuristic rules are commonly used by the inference engine of a KBES. To create heuristic rules for intelligent reasoning, causal models and explicit knowledge are required. Causal model reveals the cause-effect relationship in reasoning. Explicit knowledge is the knowledge

Artificial Intelligence 43
that can not be directly and clearly explained by individuals so that algorithmic or statistical methods might be required. Such models and knowledge are hard to be gained in industrial areas because:
The construction of intended rule base is time-consuming and complex;
Explicit knowledge is required to build the rule base;
The rule base requires human intervention if no learning facility built into the system.
To overcome the difficulties of the reasoning based on heuristic rules, CBR, as an AI technology, can be applied. CBR solves new problems by adapting previous experience and solutions to newly coming similar problem. CBR does not require explicit domain model and the knowledge derivation can be considered as a task of gathering case histories. The implementation of reasoning is reduced to identify significant features of cases, which is an easier task than creating explicit models. The learning facility of CBR is based on acquiring new knowledge as cases so that the maintenance of the knowledge base becomes easier (Watson and Marir, 1994).
A CBR system reasons by remembering previously solved problems (cases) to find solutions for currently encountered similar problems. In IBCMC, CBR can be considered as an instance-based learning method that shortens the period of acquiring knowledge from BCS fields and optimizes the usage of knowledge. In the problem-solving process in CBR, once the newly coming problem is described in terms of previously solved problems, the most similar solved problem can be found. The solution to this problem might be directly applicable to the current problem. But usually some adaptation is required which will be based on the differences between the current problem and the problem that served to retrieve the solution. Once the solution to the new problem is verified as correct by domain knowledge, a link between it and the description of the problem can be created and this additional problem solution case can be used to solve new problems. The domain knowledge can be either of domain specialists or the adaptation knowledge stored in the knowledge base.
Base on the four steps, as a mnemonic “the four REs”, summarized by Aamodt (Aamodt and Plaza, 1994), the problem solving process of CBR in the IBCMC system can be extended to five REs:
REpresent the current problem;
REtrieve the most similar previously solved problem;
REuse the retrieved previous solution to attempt to solve the current problem;
REvise the retrieved solution, as needed, to attempt to solve the current problem;
REtain the revised solution, as successful, to the knowledge base.

44 Intelligent Belt Conveyor Monitoring and Control
3.4.1 Case representation
A case is a contextualized piece of knowledge representing an experience. It contains the past lesson that is the content of the case and the context in which the lesson can be used (Watson and Marir, 1994). In general a case comprises tow part. The first part is the problem description that describes the state of the world when the case occurred. The second is the problem solution that states the derived solution to the occurrence of the problem. In the IBCMC system the problem description is a combination of the attributes distinguished from observed BCS events. The solution part indicates discovered maintenance and operational control strategies and decisions to improve BCS performance. In addition, a case in IBCMC contains a third part that describes the state of the world after the case occurred, which discovers potential consequence of the problem occurrence (Section 4.4). The problem description of a case essentially contains as much data about the problem as necessary for an efficient and accurate case retrieval. Retrieval statistics such as the number of the times the case was retrieved and the average match value are useful to be stored as part of problem description. Cases that contain problems and their solutions can be used to derive solutions to new problems. The more information stored in a case, the more useful the case can be.
3.4.2 Case base organization
In a CBR system, cases are stored in a knowledge base, namely the case base. A case base should be organized into a manageable structure that supports efficient and accurate search and retrieval methods. Accurate retrieval guarantees that the best matching case will be retrieved. Efficient retrieval guarantees that cases will be retrieved fast enough for acceptable system response time. The accuracy and the efficiency of case retrieval depend on the organization of a case base and case retrieval algorithms.
In general, three case base organizations can be distinguished (Perner, 2002): flat organization, clustered organization and hierarchical organization. In the IBCMC, the case base is organized in a flat format. In this organization format, the case information is presented as a list of item description. A flat memory model can be represented very easily in a relational database by allowing any field of the case table to contain one piece of data about the case (Ross et al., 2002). In this organization, case retrieval is based on case by case search of the whole case base.
Compared with the other two types of case organization, the clustered format requires more complex algorithms for case addition and deletion than a flat organization. The hierarchical organization has a higher complexity and implies that more complex algorithms are needed to add and delete cases. As well, the reorganization and maintenance of the case bases are more difficult due to the complexity of hierarchical organization. Therefore, although flat organization might lead to time consuming retrieval for large case bases, the case retrieval based on a flat case organization matches the case completion mechanism of the case-based decision-making process of the IBCMC system, which will be introduced in Chapter 5.

Artificial Intelligence 45
3.4.3 Case retrieval
Given the problem description part of a case, a retrieval algorithm retrieves cases that are most similar to the problem or situation currently presented. This is case matching that determines the degree of similarity between cases. A few case retrieval algorithms have been proposed in literature:
Induction search (Quinlan, 1993) focuses on the problem of producing or inducing general hypotheses from specific cases to be retrieved. It generalizes the observed cases by identifying features that empirically distinguish cases to be positively retrieved from negative retrievals of cases. This search algorithm relies on cases that are sufficiently many and rich in content, which is a key practical limit on case retrieval.
Nearest neighbour search (Owens, 1993) performs similarity matching on all the cases in the case base and returns only one best match. This method requires long searching procedure and retrieval time, especially when the size of case bases is large.
Serial search (Navinchandra, 1991) is to find potentially matching cases from a case base that is organized sequentially in a serial list. After searching, all cases in the list are judged and a number of potential cases can be retrieved.
Hierarchical search (Maher and Zhang, 1993) can be performed when cases that share the same features are grouped together in a hierarchical structure. In this situation, the case base is a network structure where each case is associated with a category containing its features and intermediate states. Case features are assigned different importance in describing the membership of a case to a category. Hierarchical search provides fast and accurate case retrieval. However, once the category and the importance of case features are changed, the hierarchy of the case base has to be redefined. The complexity of hierarchical structure involves expensive case base reorganization and maintenance.
Parallel search (Andersen et al., 1994) is based on a parallel case base architecture that organizes cases in parallel categories containing different case features or different orders of problem descriptions. The search and retrieve of cases can be achieved effectively and efficiently by parallel processing machines. However, expensive hardware is required by this method and it is difficult to implement complex matching functions.
In order to avoid the complexity of case searching and case retrieval, algorithms of similarity measure, Bayesian evaluation and experience score evaluation, have been developed in the IBCMC research project for an accurate and efficient case retrieval process (Section 5.1). The application of these algorithms can be considered as the combination the serial search and the nearest neighbour search for case retrieval.

46 Intelligent Belt Conveyor Monitoring and Control
3.4.4 Case adaptation
Generally, a retrieved case will not exactly correspond to the problem currently encountered so that the retrieved case solution may not be optimal for the new case. In this situation the solution should be adapted. There are two main ways to adapt and reuse past cases (Aamodt and Plaza, 1994).
Transformational adaptation applies transformational operators to transform the old solution into a solution for the new case. The transformational operators can be in the form of adaptation rules to collect independent values and the components of solutions, to modify certain parameters in the appropriate direction and to interpolate among several cases. If the components of solutions are interdependent, the adaptation approach requires strong domain-dependent model of the problem domain.
Derivational adaptation looks how the problem was solved in the retrieved case. It holds the information, algorithms, methods, or rules that were generated by the old solution to produce a new solution to the new problem. This adaptation can only be used when the problem domain is well understood.
An effective and efficient CBR system may need both adaptation ways above. However, both ways involve complex adaptation procedures that make a CBR system more complex and more difficult to be build and maintained. Therefore, in many CBR systems, especially when the outcomes of the CBR after case adaptation still deviate too much from what expected, case adaptation is done by the users or domain specialists rather than by the system. It is also the situation of the CBR process adopted by the IBCMC system.
3.4.5 Vantages of CBR in IBCMC
CBR is an instance-based learning method. It has the option of selecting different hypotheses or using local approximation to the target function for each presented query instance. This enables a CBR to employ fuzzy logic and probabilistic method (e.g. Bayesian method) in the reasoning process for IBCMC application. Consequently, the computation during the training of inference might be reduced. This consequence can be seen in following chapters when fuzzy logic and Bayesian inference are integrated into the reasoning process of the IBCMC system. As an instance-based learning method, the benefits of CBR brought to IBCMC are:
CBR utilizes easily available cases or problem instance. Classical knowledge derivation is replaced by case acquisition and structuring. The difficulty of knowledge elicitation for rule-based reasoning is avoided.
CBR is able to operate with a minimal set of cases in the knowledge base. The problem solving ability of the reasoning system may increase with filling new cases as the system is in use.
CBR can reason with identified relevant case features or a partial case base. It is suitable for partial problem domains or incomplete models.

Artificial Intelligence 47
The results of a CBR system can be easily explained based on the knowledge derived from past cases, can be justified based on the similarity of the retrieved cases to the currently presented problem and can be traced from past cases to current cases to analyse potential failures of a system.
The limitations of applying CBR in IBCMC include:
Large storage requirement and time-consuming case retrieval accompany a CBR system that uses large case bases. The performance of an intelligent monitoring system can be reduced when instant system responses are required for real-time monitoring
A CBR system may have difficulties to handle dynamic problem domain. Due to the different configurations and operational requirements of different belt conveyors, a CBR system may be unable to follow a shift from one BCS to another.
The problem domain of monitoring BCS is not able to be fully covered by a CBR system. Some problem situations can occur for which the CBR system does not have solutions. In this situation, the CBR system can not achieve fully automatic operation and it expects expertise from BCS domain specialists.
The significant development of computer hardware and the improvement algorithms have enabled wide AI applications in the academic areas as well as in the commercial domains. The success of applying AI in IBCMC can be foreseen. During the development of the IBCMC system, a case representation algorithm based on fuzzy logic has been developed for handling the data from knowledge sources (Section 4.4); an case completion algorithm for the reasoning process of IBCMC has been developed with the aims of handling large case bases and speeding-up case retrieval (Section 5.3); and a simulation-based knowledge acquisition method has been developed and experimented for the automated decision-making process of IBCMC (Section 7.2).

48 Intelligent Belt Conveyor Monitoring and Control

49
4 The Knowledge Acquisition Process
Knowledge acquisition has been commonly considered as a major bottleneck in the development of KBES (Wu et al., 2003). Knowledge is not always available in industrial monitoring and diagnostic systems. The data and information collected from monitoring systems needs to be converted into knowledge that can be interpreted and used by intelligent systems. The output of diagnostic systems can only be considered as posterior knowledge of the intelligent systems because diagnosis methods assume firstly the existences of particular knowledge. For instance, the existence of a numerical database corresponding to the various operating modes of an industrial process; or the existence of experts who are able to verbalize their experience of a given process (Toscano and Lyonnet, 2002). To develop an IBCMC system, knowledge sources should be firstly considered to ensure the availability of knowledge.
The process of knowledge acquisition converts data and information into properly represented knowledge. The representation of knowledge means that knowledge should be in a proper format represented by algorithms so that the knowledge can be interpreted and used by the diagnosis and reasoning processes of the IBCMC system. Therefore, a knowledge acquisition process functionally consists of DAC, DAN and knowledge representation.
This chapter presents the knowledge acquisition process. Section 4.1 discusses the relationship between data, information and knowledge in the IBCMC system. Section 4.2 summarizes available knowledge sources in the field of belt conveyors and especially describes the principle of simulation-based knowledge acquisition approach. After the IBCMC system receives data and information, Section 4.3 presents the DAN algorithms that are required to provide diagnostic knowledge with respect to the situations of BCS and its components. Section 4.4 gives the algorithms of knowledge representation for received data and information and relative diagnostic outputs. In the IBCMC system, knowledge is represented as cases that are used by the CBR process for maintenance and operational decision-making.

50 Intelligent Belt Conveyor Monitoring and Control
4.1 The hierarchy of data, information and knowledge
In KBES applications, the definitions of data, information and knowledge are sometimes mixed and overlapped. However, clear definitions are necessary to properly describe the process of knowledge acquisition and the structure of the IBCMC system. Before defining these three items, understanding the following BCS situations will be a help to distinguish data, information and knowledge that are available in BCM:
I see that there is a crack on the belt.
I know that there is a big crack on the belt.
I understand why there is a big crack on the belt.
Data is unprocessed information that can be captured, measured, manipulated, rearranged, retrieved and sent. Similar as the crack on the belt which one sees, data
is recorded, discrete, classified and stored things, events, activities and transactions;
does not have any specific meaning;
is in the format of numeric, alphanumeric, figures, sounds, images, etc.
Information is processed data that can be accessed, generated, created, transmitted, stored, sent, distributed, produced, searched and duplicated. Information can be either qualitative or quantitative. As one knows the big crack on the belt, information
is data that has a meaning for the recipient’s intended actions or decisions;
confirms something the recipient knows;
reveals surprising things the recipient had not known before.
Knowledge is processed, organized and structured data and/or information, which is formed inside the recipient by the recipient’s experience and understanding. What enables one to understand the big crack on the belt is the kind of knowledge that
conveys understanding, experience, accumulated learning and expertise;
is the application of data and information in making a decision.
Significantly, knowledge is a quite different entity to either data or information because knowledge is created by the accumulation and the analysis of data and information (Nonaka and Takeuchi, 1995). The relationship among data, information and knowledge in IBCMC can be expressed by a hierarchical structure known as a knowledge pyramid (Figure 4.1).
Over the last years, significant efforts have been made to monitor BCS online and rearrange unorganized data into database for the purpose of representing and diagnosing BCS situations. However, even in an organized form, traditional BCM systems are still dealing with data and information but less with knowledge. The central goal of knowledge acquisition in IBCMC is to develop methods to extract and to form useful knowledge from BCM data and information. Therefore the knowledge acquisition process is composed of acquiring data from the field

The Knowledge Acquisition Process 51
BCS, processing and analyzing data to provide information, and representing the data and information as knowledge.
Figure 4.1 The knowledge pyramid
4.2 Sources of knowledge
In most AI applications, four knowledge sources are often adopted for knowledge acquisition in KBES, which include human expertise, field measurements, laboratory experiments, and enterprise information systems (Tao et al., 2004) such as enterprise resource planning and manufacturing execution systems. These knowledge sources are applicable to BCM applications. During the development of the IBCMC system, inquiries and interviews were carried out to gain the knowledge of abnormality identification, criteria settings, operational scenarios, maintenance requirements, etc.; the knowledge of understanding operational statues and BCS events occurrences were derived from field measurements; Laboratory experiments provided knowledge that is not able to be gained in belt conveyor fields and helped the interpretation and approval of gained knowledge; enterprise information systems are not widely applied in the industry using belt conveyors in current stage, but the knowledge of maintenance programming can be obtained if such systems exist. However, in the field of belt conveyors, knowledge acquisition from these sources had some obstacles that hindered the application of IBCMC:
The inquiry of expertise involves only limited knowledge in the domain that the specialist is familiar with. Even the best domain specialist does not have the complete experience of all various BCS operational situations;
Knowledge acquisition from BCS field measurements requires considerable data processing tasks and the development of advanced data mining algorithms. Although it may take several years before sufficient knowledge is collected, some operational conditions are never allowed to be actually occur in BCS fields.
Laboratory experiments can only cover circumscribed operational situations due to the limitation of laboratory settings;
Nowadays, enterprise information systems mainly focus on production planning or process operations, which are not suitable to be an efficient source of knowledge acquisition due to the insufficiency of desired data and information.

52 Intelligent Belt Conveyor Monitoring and Control
To compensate the shortages of knowledge acquisition from these knowledge sources, a simulation-based knowledge acquisition approach was developed in this research project, which is based on the software models of BCS. The application of model-based diagnostics and control in industry is well-known (Korbicz et al., 2004). Nowadays, many complex industrial installations are controlled in the open loop by human operators who apply their own knowledge acquired during long-term activities (Moczulski and Szulim, 2004). Classic fault detection methods based on modelling techniques provide the possibility of detecting developing faults at an early stage (Angeli and Chatzinikolaou, 2001). Some researches have been done on fault detection by comparing the monitoring results to a software model that simulates system activities (Jeinsch et al., 2002).
Figure 4.2 Software model based knowledge acquisition
In the simulation-based knowledge acquisition approach developed in this research, diagnostic knowledge and the expected values that represent the behaviour of real BCS can be generated by the simulation using software models. When simulation generated output matches the system occurrence, the software model is considered as a precise representative of the real system (Figure 4.2) so that desired knowledge can be derived from the results of simulation.
Figure 4.3 Verification, matching and validation of software model
To generate knowledge for IBCMC, the software model needs to simulate the real system accurately enough in both healthy operational conditions and failure modes. To compare important parametric values from simulation to the corresponding measured values from BCS

The Knowledge Acquisition Process 53
performance, there are some requirements for the structure and functional design of the model. Firstly the model should be based on process physics and contain sufficient adjustable parameters to enable matching measured and simulated results. Secondly the model should be dynamic since most system activities are under continuously changing operating conditions. Thirdly the model should have standardized input and output and should supply measurable parameters for the input and output. Fourthly the model should be modular for replacing and adding components.
Before the knowledge gathered from simulation can be used as one source of knowledge, the model has to be verified, matched and validated. According to Grimmelius (Grimmelius, 2005), the process of model verification, matching and validation is shown in Figure 4.3.
Verification initially evaluates the model and shows the ability of the model in representing the physical system. Verification contains three steps. The first step defines the initial simulation situations that result in a converging set of equations for the model. The second step enables the model numerically to run stable enough the largest time constant to make an evaluation of the results possible. The third step assesses the results following expected trends and ranges. Matching is the adjustment of parameters in the model, such that the simulated outputs approximate measurable data as accurately as possible over the entire operational range. Validation compares measured data with simulated data and calculates the error by taking for example the quadrate of the difference for each set of measured and simulated values.
The main advantage of the simulation-based knowledge source over the others is that the development time of a KBES is significantly shortened. This approach is independent from specific operational occurrences on the real system. The operational situations can be set in a model and then be simulated. In addition, some operational situations, for instance the rupture of a belt section, are not allowed to be preformed in real BCS, but relative knowledge can be generated by simulation and to be used to predict catastrophic system downtime.
The development of BCS software model and the application of simulation-based knowledge acquisition are given in Section 7.2.
4.3 Data analysis
DAC is the foundation of achieving IBCMC. Data acquired from the field of belt conveyors, as any industrial raw data, is hard to be interpreted and sometime misleads the process of DAN because of noises, missing values and the large amount. Therefore, DAN starts from the pre-parse of acquired data. The pre-parse of raw data includes rearranging data, reconciling data inconsistence, reducing data volume and increasing data stability. Afterwards, pre-parsed data is used to primarily evaluate monitored BCS situation based on the pre-set criteria of each parameter. If the evaluation shows a healthy BCS situation, the situation and relative data will be either represented as knowledge and stored in the IBCMC system or be discarded without further consideration if the same knowledge already exists. Otherwise, the situation

54 Intelligent Belt Conveyor Monitoring and Control
needs to be further analyzed. Once an unhealthy situation is identified, the data will be treated and analyzed with the goals of:
assessing reliability of BCS and components;
evaluating degradation of BCS and components;
describing abnormalities;
diagnosing faults;
predicting failures;
discovering underlying causes of faults and potential failures.
To reach the above goals AI technologies and algorithms are required. The application of fuzzy logic in fuzzy decision analysis and Bayesian inference were employed in IBCMC.
4.3.1 Analyzing data by using fuzzy logic
The feasibility and necessity of applying fuzzy logic for IBCMC was discussed Section 3.3.3. As an approach of achieving fuzzy decision analysis, fuzzy logic has been applied for belt conveyor inspection tools to define conveyor belt wear index and belt conveyor inspection frequency index (Lodewijks and Ottjes, 2005). The main purpose of a belt wear index and inspection frequency index is to make decisions to whether or not certain belt damage need to be repaired or the section of the belt need to be replaced, and whether or not the current inspection intervals are appropriate. Four fuzzy sets were defined to determine the belt wear index and belt conveyor inspection frequency index (Lodewijks, 2005a):
Location factor (LF) is the concentration factor that evaluates the location of damage on the belt. For instance, a damage on the edge of the belt has higher risk than the same damage locates in the centre of the belt;
Intensity factor (IF) assesses a belt situation based on the type of the damage. Probably more attentions should be paid to a transversal rip on the belt compared to a longitudinal one;
Extension factor (EF) is defined to suggest maintenance activity based on the size of damage;
Accumulation factor (AF) shows the growth of damage that provides the information to adjust current interval of belt inspections.
The membership functions of the factor LF, IF and EF are given in Figure 4.4, Figure 4.5 and Figure 4.6. These membership functions express the degrees of contribution or membership to the chance that maintenance activity needs to be done.
Figure 4.4 shows that the LF is 1 at the edges of the belt and minimal in the belt’s centre. The reason for the symmetry membership function is that it is more likely for edge damage to lead to transverse belt rupture than for damage in the centre of the belt. The factor of the location

The Knowledge Acquisition Process 55
in the centre of the belt is determined by domain specialist. In practice, a minimal LF of 0.2 has been selected by Lodewijks (Lodewijks, 2005a). Figure 4.5 shows the variation in membership of the IF. In essence the more irregular the damage is found, the higher the degree of the membership is. Figure 4.6 shows the membership function of the EF for a steel cord belt, assuming that the EF is 1 and damage should be repaired or a piece of belting should be replaced when more than 10% of the cables are broken.
10.25 0.5 0.750
0.25
0.5
0.75
1
0
x (% of belt width)
Figure 4.4 Membership function of the location factor
Figure 4.5 Membership function of the intensity factor
10.25 0.5 0.750
0.25
0.5
0.75
1
0
EF
x (% of cables in belt)
Figure 4.6 Membership functions of the extension factor

56 Intelligent Belt Conveyor Monitoring and Control
If LF, IF and EF indicate belt damage then the belt wear index can be defined as follows:
i iir
ii
WT DFI
WT
(4.1)
where iDF is the ith damage factor and iWT is the weight of iDF . To determine the weights
of the DFs, Saaty’s priority theory (Saaty, 1994) can be used. The priority theory of Saaty provides a scaling technique to assign weights or priorities to a multiple of factors in a consistent way. It has been developed to weight the significance factors in decision problems via pair-wise comparison. For instance, if factor A is considered as more important than factor B, then the significance factor is assigned as a ratio of k which signifies k times more. The ratio that expresses the relative significance of a pair of factors is displayed in a matrix. The weights, the so-called priorities, of the factors are obtained by eigenvalue analysis, based on the sum of the ratio of each factor. Figure 4.7 shows the assignment of the suitable significance factor matrix to belt damage factors based on expertise. The weights of the damage factors can be determined by either adding the significance ratio or the normalized eigenvalue of per damage factor.
Figure 4.7 Determine the weight of the damage factors
Figure 4.8 Membership function of the maintenance index
After deriving the belt wear index, the fuzzy index value needs to be defuzzified to determine weather or not belt maintenance activities are required. The defuzzification can be done by evaluating the belt wear index by means of defining the membership function of maintenance index and with a maintenance threshold value (Figure 4.8). A belt wear index value that

The Knowledge Acquisition Process 57
excesses the maintenance threshold value, which implies the change of maintenance index from 0 to 1, indicates that relative maintenance activity is required. The threshold value can be determined by identifying the operational status and the most important damage cases of the belt, where on beforehand it was known that maintenance would be required. A threshold value of 0.7 has been determined by Lodewijks (Lodewijks and Ottjes, 2005) in belt inspection practices.
The belt wear index of adjacent inspections can also be used to determine whether or not the current inspection intervals are appropriate. For that purpose AF can be used:
t t tDF
DF DFAF
t
(4.2)
where t indicates current inspection interval an DFAF is the accumulation factor of DF, one
of the damage factors of LF, EF or IF. With these accumulation factors a belt inspection
frequency index fI can be defined:
'
'
i iif
ii
WT AFI
WT
(4.3)
where 'iWT is the weight factor for damage accumulation and iAF is the accumulation factor
of the ith DF.
10
0.25
0.5
0.75
1
0Insp
ecti
on F
requ
ency
Ind
ex
Reduction of Inspection Interval (%)
0.25 0.5 0.75
Figure 4.9 Membership function of the inspection frequency index
To determine whether or not the inspection interval needs to be adjusted, defuzzification of the inspection frequency index is required. Based on the membership function of the inspection frequency index as shown in Figure 4.9, the decisions of changing the inspection frequency interval can be made as the following:
fI = 0: no change required
fI= 0.25: reduce the inspection interval by 12.5%

58 Intelligent Belt Conveyor Monitoring and Control
fI= 0.5: reduce the inspection interval by 25%
fI= 0.75: reduce the inspection interval by 37.5%
fI= 1: reduce the inspection interval by 50%.
4.3.2 Analyzing data by Bayesian inference
In Section 3.3.2 the feasibility of Bayesian method in reasoning with uncertainty and modelling causal relationship was discussed. Bayesian inference is the process of using probabilities to predict the likelihood of certain events occurring in the future. One difficulty in Bayesian inference application is the determination of the likelihood probabilities. In most Bayesian applications the likelihood probabilities or the likelihood density functions are approximated as a particular distribution and estimated by laboratory testing or statistics. The gain of accurate approximation and estimation of the density function is complicated due to the mining of large amount data and extremely time consuming (O’Connor, 1991). To analyze the historical data collected from BCS, the prior probabilities for Bayesian inference can be derived. However, the likelihood probabilities are hard to be obtained due to the insufficiency of data to reveal the relationships between the occurrence of monitored events and the consequences.
In this research, fuzzy logic was applied to determine and update the likelihood probabilities for Bayesian inference. A fuzzy Bayesian inference method has been developed to provide the information of evaluating BCS situation and to denote the most possible failure causes in IBCMC. This approach was presented by an application that discovers failure causes and suggests maintenance activities for a belt conveyor emergency brake system (Pang and Lodewijks, 2005a). In this application, a Bayesian inference model was intuitively built. The model reasons when events happen as the results of other events. Regarding to the operation of the emergency brake, the Bayesian model reasons the probabilities of a longer braking time with known information of abrasion of brake pads and degradation of braking hydraulic pressure unit. This is the forward Bayesian inference. When a longer braking time is being known, the backward Bayesian inference discovers the main cause of this unwanted situation with its posterior knowledge. This section firstly presents the theories of fuzzy Bayesian modeling, which include the fuzzy membership function for gaining prior knowledge and for updating likelihood probabilities. Then the fuzzification in likelihood estimation and the determination of posterior probabilities of Bayesian inference are described. Further, the practical application of fuzzy Bayesian causal modeling and inference is given.
4.3.2.1 Fuzzy membership function for likelihood density update
Monitored BCS parameters can be considered as either continuous or discrete. When a parameter is considered as continuous to be applied in Bayesian inference, the probabilistic distribution or density function need to be determined. However, the determination is hardly to be achieved due to the lack of data in the field of BCM. Based on the knowledge of domain

The Knowledge Acquisition Process 59
specialists and the behaviour of practical operational decision-making, an event in BCM can be represented by a fuzzy membership function that consists of a number of fuzzified ranges. Each fuzzy range is defined by two levels of parameter value. Each level corresponds to an evidence of the monitored event. In general, the fuzzy membership function is expressed as:
Level 1r 2r 3r …
nr
Evidence 1e 2e 3e …
ne
For each fuzzy range between two levels, if the value of the parameter x [ri, ri+1)
( )...,,3,2,1 ni ) is concerned with its two evidences of ie and 1ie , the fuzzy membership
function is constructed as
1
1
1
1)(
ii
i
iie rr
rx
rrxg
i
(4.4)
11
1)(
1
ii
i
iie rr
rx
rrxg
i
(4.5)
where we have
1)()(1
xgxgii ee
(4.6)
Although the continuous values of a monitored parameter are fuzzified in order to simplify
the determination of probabilistic distributions, the functions of ( )g x treat the monitored
parameter as continuous variable so that all possible values of the parameter can be taken into
account to avoid any information loss. The value of ( )g x shows the strength of the likelihood
that the monitored event trends more to one of its relative evidences. If an event more likely trends to a certain evidence, then the evidence more likely brings its consequence.
In case there is no sufficient knowledge to define the fuzzy ranges based on the analysis of historical data collected from BCS, expertise can be adopted. The size of a fuzzy range is defined as
0,1 nneiie rrsrrsni
(4.7)
4.3.2.2 Likelihood update
Based on the fuzzy membership function, the likelihood probabilities for Bayesian inference can be determined by either historical data or expertise. However, the likelihood probabilities
( | )iP H e concern only with the evidences relates to pre-set fuzzy ranges. These probabilities
treat all value in a fuzzy range as the same. In order to distinguish the likelihood for different values within a fuzzy range, the likelihood probabilities can be updated based on the value in the fuzzy range and the size of the fuzzy range.

60 Intelligent Belt Conveyor Monitoring and Control
The fuzzy membership function converts the value of an evidence within the range from 0 to
1. Given the value ( )ieg x of evidence ie , the likelihood probabilities can be updated as
' ( | ) ( ) ( | )ii e iP H e g x P H e (4.8)
In BCM practices, fuzzy ranges can be set in unequal sizes. Considering the proportion between two neighbour fuzzy ranges, an observed event is more likely to be considered as the evidence with a larger range. Therefore, fuzzy values in different range sizes are needed to be considered to gain reasonable proportion weight (Yang, 1997). Regarding to the fuzzy membership function above, the weight can be defined as
1
( ) i
i
i i
ee
e e
sWT x
s s
(4.9)
Further, the likelihood probabilities can be updated as weighted likelihood as
* '( | ) ( ) ( | )ii e iP H e WT x P H e (4.10)
4.3.2.3 Posterior probability determination
After determining and updating the likelihood probabilities for given fuzzy valued evidences, the posterior probability can be derived from Bayesian inference. In the updated Bayesiasn calculation, both continuous and discrete variables can be converted to fuzzy evidences based on assigned fuzzy ranges. The posterior probability is calculated as
*
*
( | ) ( )( | )
( | ) ( )i i
ii ii
P H e P eP e H
P H e P e
(4.11)
The posterior knowledge derived from Bayesian inference is based on the prior knowledge obtained from either expertise or the analysis of historical datasets sampled from BCM. Prior knowledge is the probability of the occurrence of an event that may incur system faults or failures. The posterior probability indicates the main cause(s) of the fault or potential failure in BCS operation.
The developed fuzzy Bayesian inference method provides several advantages for the causal analysis in BCM. Firstly, the use of fuzzy logic converts continuous monitored variables to discrete so that the determination of likelihood probabilities is simplified by means of discrete evidences. Secondly, decision-making in domains with reasoning uncertainty using Bayesian inference often involve very high dimensional probability tables. Hence, for many practical problems including the data analysis for BCM events, exact computations are prohibitive (Kjærulff, 1994). The fuzzy Bayesian method defines limited evidences based on fuzzy ranges so that the computational complexity of Bayesian inference is reduced. Thirdly, the pre-determined likelihood probabilities are updated and weighted based on the values in fuzzy ranges and the size of fuzzy ranges so that no information is neglected although continuous monitored variables are fuzzified.

The Knowledge Acquisition Process 61
4.3.2.4 Causal modeling by using fuzzy Bayesian inference
The fuzzy Bayesian inference described above has been applied in IBCMC for causal modeling to discover the cause and effect relationship when faults or abnormalities happen in BCS. This approach can be illustrated by the application on a BCS emergency brake system. The results of Bayesian inference, which are given below, show that the fuzzy Bayesian inference is able to provide the diagnoses of monitored BCS situation and to make maintenance decisions to improve BCS performance.
Two hypotheses of belt conveyor braking operation can be made: a short braking time St is
the desired operation of belt emergency stop, and a long braking time Lt denotes insufficient
emergency braking operation and is not accepted in BCS performance. Brake pads abrasion
( w ) or insufficient pressure (u ) in the brake hydraulic unit, either one of them or both, can be
the causes of Lt . In order to simplify the illustration of the fuzzy Bayesian method, only these
two causes of are discussed and only two fuzzy ranges are defined for both parameters: pad
abrasion can be slight ( sw ) or considerable ( cw ) and hydraulic unit pressure can be high ( hu )
or low ( lu ).
St
Lt
sw sw cw cw
hu hulu lu
95.0
05.0
01.0
99.0
4.0
8.06.0
2.0
lu hucwsw
w
u
Figure 4.10 A simple Bayesian model
Based on historical data of braking operations, the prior probabilities can be determined as
( ) 0.85 ( ) 0.15
( ) 0.64 ( ) 0.36s c
h l
P w P w
P u P u
(4.12)
In case historical data is insufficient to derive the prior knowledge, expertise can be adopted. To ensure the brake system working well, brake pads should be readjusted or replaced regularly once a brake pad is worn to a certain level and the controller of the hydraulic unit or the controlled valve should be instantly maintained if the hydraulic pressure is considered as low. In case both parameters exhibit undesired conditions, the main cause of the system

62 Intelligent Belt Conveyor Monitoring and Control
malfunction should be discovered to avoid misconducts of system maintenance and operation. The fuzzy Bayesian inference model provides possibilities to reason this kind of complex relationship with high accuracy and reliability.
Graphically the Bayesian model of this application, the pre-determined likelihood distribution
and the fuzzy range settings for events w and u are shown in Figure 4.10.
If for instance that the values of w and u in one inspection are 1.05 mm and 4.0 bar,
respectively, based on the membership function given by (4.4) and (4.5), the fuzzy values of two observed events in their fuzzy ranges can be calculated as
(1.05) 0.3, (1.05) 0.7
(4) 0.333, (4) 0.667s c
h l
w w
u u
g g
g g
(4.13)
In fact, the inspected value of brake pad abrasion is between the determination values of
evidences sw and cw . It means that a 1.05 mm abrasion can be considered as either sw or cw .
The calculations of ( )g x above show that the inspected brake pad condition is more likely to
be considered as considerable abrasion and less to slight abrasion. Because only two levels of
the fuzzy range of w and u are defined, the weight coefficients ( )wWT x and ( )uWT x both
equal to 1 based on (4.7) and (4.9). The pre-determined likelihood probabilities can be updated as
*( | , ) (1.05) (4) ( | , ) 0.005c lS c l w u S c lP t w u g g P t w u (4.14)
*( | , ) (1.05) (4) ( | , ) 0.462c lL c l w u L c lP t w u g g P t w u (4.15)
Similarly we have
*
*
*
( | , ) 0.187
( | , ) 0.120
( | , ) 0.005
L c h
L s l
L s h
P t w u
P t w u
P t w u
(4.16)
and so on. Using the updated likelihood probabilities and the prior knowledge of events w
and u the posterior probabilities can be calculated as
*
*
( | , ) ( ) ( )( , | ) 0.30
( )L c l c l
c l LL
P t w u P w P uP w u t
P t
(4.17)
*
*
( | , ) ( ) ( )( , | ) 0.45
( )L s l s l
s l LL
P t w u P w P uP w u t
P t
(4.18)
*
*
( | , ) ( ) ( )( , | ) 0.22
( )L c h c h
c h LL
P t w u P w P uP w u t
P t
(4.19)
*
*
( | , ) ( ) ( )( , | ) 0.03
( )L s h s h
s h LL
P t w u P w P uP w u t
P t
(4.20)
*( )LP t is the updated marginal probability of long braking time which is calculated as

The Knowledge Acquisition Process 63
* *
,( ) ( | , ) ( ) ( ) 0.0823L L i j i ji j
P t P t w u P w P u (4.21)
where i and j indicate the evidences of event w and u , respectively.
The outcome of (4.15) matches our intuition, which “guesses” that the braking time should be expected long because the brake pad is considerably worn and the pressure of the braking hydraulic unit is low. However, the pads abrasion is not the present main cause of long
braking time. This can be discovered by (4.18) that the posterior probability of ( , | )s l LP w u t is
the highest compared to others. This posterior probability means that the main cause of the
insufficient braking operation with the symptom of Lt is the low pressure in braking hydraulic
unit. Thus the inference results require operators to maintain the hydraulic unit but not the brake pads yet. In addition, (4.17) indicates that brake pads has been worn out to a certain
level because the value of the posterior probability ( , | )c l LP w u t is also high. Even though
abrasion is not the main cause of a long braking time, more attention should be paid to the pad abrasion during the next inspections.
4.4 Knowledge representation
The purpose of knowledge representation is to represent gathered data and information to a format of knowledge that can be interpreted and used by the reasoning process of the IBCMC system. A case is the entity of represented knowledge. It integrates information and knowledge basically includes the description and classification of events occurs in BCS operations. When a case is combined with monitored BCS situation and available operational strategies, it can be stored in the IBCMC system for maintenance and operational decision-making.
Due to the complexity and uncertainty of the data and information in the field of belt conveyors, the knowledge sources to achieve KBES for IBCMC contain fuzzy or ambiguous information. For many knowledge-intensive applications, it is important to develop an environment that permits flexible modeling and fuzzy querying of complex data and knowledge including uncertainty (Koyuncu and Yazici, 2005). Therefore, the theory of fuzzy logic was applied in the knowledge representation in the IBCMC system to express the vagueness and imprecision of BCS events.
4.4.1 Knowledge representation stages
Knowledge representation in IBCMC is to identify operational situations from gathered data and information to describe the events occurring during BCS operations. The knowledge representation process consists of three stages.
The data handling stage: Data is the origin of knowledge. In BCM applications, data can be either acquired from BCS field or historically stored in a database. The date covers representative periods of BCS operations. The data collected from each time period is considered as a particular data set. Such a data set is usually unorganized and often contains abnormal values, missing values or strange values. These are the vagueness and imprecision

64 Intelligent Belt Conveyor Monitoring and Control
of BCS data. In the first stage of knowledge representation, statistical analyses, such as regression analysis, moving average and correlation, are carried out to filter the unusual data and to remove the redundancy of the database. The final database is structured in the format of containing time period in rows and monitored parameters in columns.
Figure 4.11 BCS events classification
The classification stage: Once the database is structured, it is fed to a clustering tool in order to conduct the classification stage towards distinguishing various BCS events. In a certain time period, each cluster represents a group of BCS events that are characterized by a particular situation of the events. Figure 4.11 shows the clustering defined in the IBCMC system that is able to represent most of possible variance patterns of BCS events. In reality, the change of a parameter can be represented by either one of these distinguishable variance patterns or the combination of a few of these patterns. For instance, in a belt conveyor start state, the variance of the power consumption of a drive motor can match the patterns shown as Cluster 2; the variance of the torque of the drive motor can be represented by the combination of the patterns of Cluster 4 followed by the reverse patterns of Cluster 3. Simply the pattern recognition can be carried out by data analyses based on the mean value, sloop and standard deviation of the datasets in a time period. The similar principle of such an event classification method and relative pattern distinguishing algorithm have also been discussed on case-based control of dynamic industrial process with the use of fuzzy representation in detail (Moczulski and Szulim, 2004).
The case representation stage: A case, which represents past occurrence of BCS events and has been stored in the IBCMC system, is considered as old case and named as completed case. The content of a complete case is made up of the description of BCS operational situation, known operational discoveries and relevant solutions. In contrast, a newly monitored operational situation is represented as a new case and referred to as an incomplete case which contains only the description of the monitored situation.

The Knowledge Acquisition Process 65
Knowledge representation is the process from data and information to knowledge. In IBCMC application, two types of data and information are defined. Past data and information, which have been gathered from diverse knowledge sources and stored in a specific database, is defined as static information. The data and information that currently arrive to the BCM system in the format of dynamic data flow are defined as dynamic information. Static information and dynamic information can both be represented as part of cases but different approaches are required to capture data and information towards representing to knowledge.
4.4.2 Capture of knowledge from static information
Static information contains unorganised data and BCS events, system situations, operational decisions and strategies for BCS maintenance. Events may be either normal or abnormal, system situation may be either healthy or unhealthy, and decisions and strategies may be either successful or unsuccessful.
... ...
Lw
Sample i
Sample i+1
Sample i+n
t i { variable list }
t i+1 { variable list }
... ...
t i+n { variable list }
... ...
Figure 4.12 Short interval observation window
Once the database which containing historical BCM data is structured by data handling and processing, periodic static information can be captured for further knowledge representation. To do so, the IBCMC system creates an observation window within a certain time period,
namely the window length ( wL ), to capture data and information (Figure 4.12). Each batch of
data captured by the observation window is represented to a case combining relative monitoring discoveries and solutions and stored into case base as complete case.
The sample interval ( 1 nini tt ) is adjustable to gain sufficient information based on
monitored parameters and monitored BCS components. Slowly varying parameters, such as corrosion and ambient temperature, require longer sample interval.
4.4.3 Capture of knowledge from dynamic information
Dynamic information arrives at the IBCMC system as a continuously changed data flow from BCS field. The knowledge represented by dynamic information can be either discarded or

66 Intelligent Belt Conveyor Monitoring and Control
kept by the IBCMC system depending on whether or not the new situation had been encountered by the IBCMC system. To capture dynamic information within a certain time period, a data flow tunnel is created. The data tunnel samples data passing through the tunnel
with defined tunnel length ( TL ) (Figure 4.13) and represents the currently monitored situation
as incomplete cases.
Figure 4.13 Short interval data tunnel
The sample frequency is also adjustable depending upon the properties of monitored parameters and monitored BCS components. High sample frequency is suitable to fast variant events such as the parameters of an emergency braking system.
4.4.4 Fuzzy knowledge representation algorithm
The start point of representing an operational situation is that any possible BCS events can be clustered. For instance, in Figure 4.11, events, such like the variances of ambient temperature, the vibration of a failed idler and the operation of a switch of power supply, can be represented by patterns of cluster 1, cluster 3 and cluster 6, respectively. Then any events during a certain time period can be decomposed as several individual patterns. The more the categories defined, the more the events can be distinguished. Sufficient clustered patterns are able to represent all BCS events. When all BCS events can be classified, relative operational situations can be represented based on three fuzzy concepts: attribute, event and situation.
Attributes represent how a monitored parameter varies. Attributes of variance quantity (qA ),
variance pattern (pA ) and variance response level ( rA ) are three fuzzified attributes to describe
any variance of BCS events. For any monitored parameter, qA is the quantitative
representation of the variance which could be high, middle or low; pA is the qualitative
representation that represents the pattern of the trend of the variance which could be smooth
increase (cluster 1), vibrated increase (cluster 2), or jump up (cluster 6). rA is the intensive
representation of the variance which could be acute or dull, fast, slow or medium, and so on.
Event, that differs from the events occur in BCS operations but is defined for describing cases in knowledge representation, is the integration of the variance of a monitored parameter. An

The Knowledge Acquisition Process 67
event is defined as the sequential combination of three attributes that belong to the event,
which denotes the details of the variance of the event. An event nE can be represented as
),,( rnpnqnn AAAE (4.22)
When sufficient enough event variance patterns can be distinguished, any BCS event can be represented by its attributes (Figure 4.14). For instance, attributes of two events
.:
;:
;:
:1
mediumA
increasevibratingA
middleA
Event
r
p
q
.:
;:
;:
:2
slowA
increasevibratingA
lowA
Event
r
p
q
conclude that variances of these two events match patterns of cluster 3 in Figure 4.11.
Situation is a description of a specific BCS operational situation by combining its relative events:
),...,,( 21 mnmmm EEES (4.23)
Situation description provides the information of how current situation related parameters vary. Situation is the description part of case representation.
Figure 4.14 BCS event representation
Cases, as the goal of knowledge representation in the IBCMC system, can be built once situations are represented. Combining situation representation with known relative maintenance and control decisions, monitoring discoveries and operational solutions based on static information, a complete case is represented as:
),,,,...,,(: 21 SolutionoveryDiscDecisionEEESCase mnmmmm (4.24)
When a case is derived and represented from dynamic information, the case may only contain the representation of current newly monitored situation to form an incomplete case. If the

68 Intelligent Belt Conveyor Monitoring and Control
monitored situation is diagnosed as unhealthy, there is no relevant decision, or solution known by the IBCMC system to improve current BCS situation and performance. In this situation, the decision-making process of the IBCMC system employs CBR process to retrieve the missing part of the incomplete case from complete cases stored in case base.

69
5 The Decision-making Process
In the IBCMC system, data and information acquired from diverse sources are represented in the knowledge format of cases. Based on the definition of (4.23), the mth complete case Casem the case base, which is represented by static information, can be described as
1 1 1 1
2 2 2 2
:
[ ( , , ),
( , , ),
......
( , , ),
,
,
, ]
m
m m q m p m r
m m q m p m r
mn mnq mnp mnr
m
m
m
Case
Event attribute attribute attribute
Event attribute attribute attribute
Event attribute attribute attribute
Decisions
Discoveries
Solutions
(5.1)
This complete case contains a situation part includes n events and a decision part includes relative decisions, discoveries and/or solutions. Each event is composed of three attributes of
qA , pA and rA . An incomplete case, which represents from dynamic information, contains only
its situation part.
If a proper description of the experience of past BCS operations and a current BCS situation are both available to be represented as the knowledge that the IBCMC system requires, decision-making for a newly monitored situation becomes possible. The decision-making process of the IBCMC system is based on CBR. In the IBCMC application, past experience is stored in knowledge bases and processed to solve new problems in the same way a human expert would. The knowledge base is encoded and formulated in such a way that the system can readily explain why it arrives at its answers. In CBR, complete cases and incomplete cases are employed as the inputs of the reasoning process (Figure 5.1).

70 Intelligent Belt Conveyor Monitoring and Control
CBR DecisionsDynamic
Information
StaticInformation
Incomplete Case(Querying)
Complete Case(Answering)
Figure 5.1 Principle of CBR process in IBCMC
To achieve decision-making, the CBR process implements three fundamental functions: case retrieval, case completion and case adaptation. This chapter presents the decision-making process for IBCMC. Section 5.1 introduces the procedures of intelligent reasoning applied in the IBCMC system. Section 5.2 presents similarity measure for case retrieval and the methods to evaluate the certainty and confidence level of retrieved cases. Section 5.3 describes the case completion procedure, which completes the absent information and knowledge for incomplete cases based on past cases stored in the IBCMC system. In case that successful decision-making can not be achieved due to the lack of retrievable cases for a newly monitored situation, case adaptation is required by CBR. The aspects of case adaptation in IBCMC are discussed in Section 5.4.
5.1 Procedures of decision-making
The main task of CBR in IBCMC is to retrieve the information and knowledge from complete cases that is missing in incomplete cases. Retrieved knowledge is used to understand the current situation and to draw decisions for the problems associated with current monitored BCS situation.
New Situation
Case representation
Select relevantcase base
Case retrieval
Modification of past experience
Y
N
Apply past experienceto the new situation
Domainknowledge
…CB1 CB2
Any fault?Is retrieved
case suitable tonew situation?
Y
N
Goodsituation
Figure 5.2 Procedure of decision-making process
Figure 5.2 shows the overall procedure of decision-making in the IBCMC system (Lodewijks and Pang, 2004a). A newly monitored situation has a set of events that indicate the real condition of BCS performance. A situation with a fault is represented as a new incomplete case which serves as the querying input of case completion to retrieve past experience. In case of any difficulties of retrieving suitable past cases for the new one, case adaptation based on domain knowledge is invoked to complement the knowledge for the decision-making process.

The Decision-making Process 71
The CBR decision-making process starts with the function of observation and ends at the function of remember/forget.
The function of observation is the proprietary function of the IBCMC system for learning. It represents the manner in which information is processed and written to the knowledge base. The reasoning process of IBCMC starts to learn from the attributes of events in a monitored situation by observing the data records and information, which occur within the specific situation in BCS performance. In order for the IBCMC system to learn and reason, observed attributes must be added to the representation of an event and then the event must be observed as well. For example, similar to what an operator does, the system needs to observe data about the particular component that the system is focusing on, or the performance behaviors of the component. There are two types of observation in the IBCMC system: the observation of past situations and the observation of newly coming situations. These two types of observation result in complete knowledge and incomplete knowledge of IBCMC, respectively.
Remember/forget are two functions modifying the case base of the IBCMC system by either incrementing or decrementing cases. The function of remembering enables the IBCMC system to learn from attributes and events in a given BCS situation by observing the information that occurs in a specific environment. Once an observed situation is proved as novel to the existing case base, it will be represented and remembered in the case base and will involve into future case retrieval. Remembering represents the behaviour in which knowledge is processed and written to the knowledge base. There are two types of forgetting functions. The first type is a mechanism that allows the IBCMC system to “un-learn” information if the observation shows healthy performance or if the observation has been observed and remembered. The second type is a mechanism that allows the IBCMC system to discard existing knowledge if the system or the user of the system decides that the knowledge is erroneous or not relevant to the system at hand. There is no partial remembering and forgetting. All parts of a case are present for an action of remembering or forgetting to occur.
Between the implementation of observation and remember/forget, other three fundamental functions of case retrieval, case completion and case adaption are implemented by the CBR process to fulfil the decision-making in IBCMC.
5.2 Case retrieval
The goal of case retrieval is, given the description of a currently situation, to retrieve the most similar situation or matched knowledge from the existing case base. The simplest form of case retrieval is the first nearest-neighbor algorithm (Wang, 2007), which involves matching all situations in the case base and returning only one best match. Yet, this method is usually slow, especially in the case of large size knowledge base. In the IBCMC system, the knowledge based used to store cases is composed of a few case bases. Knowledge is categorized into different case bases based on pre-defined cluster properties of cases. For instance, the monitored BCS situations with long braking time are categorized into one case

72 Intelligent Belt Conveyor Monitoring and Control
base. Therefore, knowledge pre-selection based on case categorization constitute faster and more efficient knowledge retrieval.
Knowledge base
Relevant Clusters
Evaluated knowledge
Best match
Decisions
Figure 5.3 Knowledge retrieval process
As illustrated in Figure 5.3, knowledge retrieval is based on clustered knowledge organization, according to the typicality of BCM events. The knowledge search within a case base is based on hierarchical indexing, which will be discussed later in this section. Three retrieval evaluation mechanisms, which include similarity measure, statistic evaluation and experience scoring, are invoked to retrieve the best matched knowledge. Similarity measure guides the search in case bases. As a CBR process, the knowledge retrieval for decision-making is principally similarity-based to measure the similarities between a new case and past cases and further to retrieve the most similar past one. Bayesian method, as a statistic evaluation method, and experiences scoring are used to assess the certainty and confidential level of retrieved knowledge. Especially when several equally plausible cases apply to a given situation, these two mechanisms resolve conflicts to select the best case.
5.2.1 Similarity measure
Case retrieval starts with identifying events that fit a newly arrived monitored BCS situation through the case indexing mechanism of case bases. Within case retrieval, past cases are selected from case bases and compared to the new situation event by event. The final selection of an applicable past case is based on the similarity measured between past and new cases.
Full loaded belt
Belt SpeedIncrease
Case base (i+1)
Empty belt ...Half loaded belt
Belt SpeedConstant
Belt SpeedDecrease
Brake Torque High
Brake Torque Low
Brake Time Short
Brake Time Long
...
Case base (i)
...
...
...
......
Figure 5.4 Hierarchical knowledge organization

The Decision-making Process 73
In Section 3.4, it was discussed that cases of the IBCMC system are organized under flat case organization configuration. The applied case search method is the combination of the nearest neighbour search and serial search. Considering the fact that the IBCMC system integrates individual monitoring systems for various BCS components with many case clusters and monitored variables, the case retrieval is guided by a hierarchical case indexing method. Such a case indexing enables the serial search of cases in clustered flat case organizations. Figure 5.4 gives an example of hierarchical indexing for fast and effective knowledge search for a BCM situation of braking on a fully loaded conveyor belt.
The knowledge search based on hierarchical indexing is a process to compare BCS events through the index to retrieve the most relative knowledge. In CBR, to measure the similarity between a past case and a new case is to measure the matchability of the events of cases.
Therefore, only events possess the same or similar attributes of pA and rA are comparable
and matchable. To measure the matchability, match factor between new and past events
( npMF ) can be defined to quantitatively evaluate the closeness between two events:
qp
qpqn
np A
AAMF
1 (5.2)
where npMF is the match factor between a new event and a past event. qnA and qpA are the
quantity attributes ( qA ) of the new event and the past event, respectively. Consequently the
similarity factor CS between the past case Cp and the new case Cn is defined as:
( )
( , )( )i ii
C p nii
P E MFS C C
P E
(5.3)
Cp Cp Cp
P: P(belt speed =ok) = 0.880 P(brake torque = ok) = 0.923 P(brake time = ok) = 0.865
……
Events: belt speed (4m/s, slowly decrease) Brake torque (12000Nm, constant) Brake time (35s)
……..
Discovery (1): too long braking timeDiscovery (2): grease on braking diskDecision: clean disk
Cpi: full loaded belt conveyor Belt Category: Steel Cord Time: hh:mm:ss, dd-mm-yy
Belt Length: XX m Belt Width: YY m
Figure 5.5 Example of case representation

74 Intelligent Belt Conveyor Monitoring and Control
Cn: full loaded belt conveyor Belt Category: Steel Cord …… Time: 03:05:07 01-02-03Events: Belt speed (3.8m/s) Brake torque (10450Nm) Brake time (35s) ......
Cp: full loaded belt conveyor Belt Category: Steel Cord …… Time: hh:mm:ss, dd-mm-yyEvents: Belt speed (4m/s) Brake torque (12000Nm) Brake time (35s) ......
Discovery (1)Discovery (2)Decision
MF: 0.950
MF: 0.871MF: 1.000
Figure 5.6 Example of similarity measure
In (5.3), iMF is the match factor of the ith pair of compared events. )( iEP is the probability of
the ith compared event of pC to be a fault, regarding to normal BCS performance. )( iEP can
be determined by domain expertise or derived from mining past monitoring data. This probability is considered as the weight of the compared events representing the relative importance of knowledge retrieval. The more frequently an event appears abnormal in past BCS performance, the higher strength this event possesses in influencing the similarity measure. An example of similarity measure is illustratively given in Figure 5.5 and Figure 5.6. Each past case is represented and stored in the case base with its situation part, decision part, and the probabilities that the events appear abnormal. In the case shown in Figure 5.5, based on the monitored events in the situation part, a braking time longer than expected has been discovered from past experience, which was probably caused by dirty brake disk. Such a discovery and relative maintenance decisions can be retrieved from the past case and applied to a newly monitored situation if both cases are highly matched based on similarity measure. Figure 5.6 gives the principle of similarity measure based on shown match factors between the relevant events of old and new cases. (5.4) is an example calculation of the similarity of two cases.
0.950 0.880 0.871 0.923 1.000 0.865( , ) 0.9672
0.880 0.923 0.865C p nS C C
(5.4)
Criteria are required to assess whether the similarity between two cases are high enough for confident decision-making. The criteria can be gained either from expertise or by analyzing historical performance accuracy of the decision-making process.
5.2.2 Bayesian evaluation
Besides the application in DAN, Bayesian method is also employed in the IBCMC system to evaluate the certainty of the resulting conclusions derived from the retrieved cases. Especially when more than one case are retrieved for a newly monitored situation with the same similarity measure, the posterior probability derived from Bayesian inference indicates the most likely matched case in a statistical way.

The Decision-making Process 75
Table 5.1 Illustration of Bayesian evaluation for case retrieval
Steps Example
1. To represent the newly monitored situation as
a case nC with an event set nkE (k = 1, 2, …, j) nC contains 1nE (belt speed) and
2nE (belt tension)
2. To select one past case pC from case base
with its event set pkE (k = 1, 2, …, j)
pC contains 1pE (belt speed) and
2pE (belt tension)
3. To retrieve from past monitoring the
probability )( pCP of the occurrence of pC pC occurred 10 times during 100
times monitoring. 1.0)( pCP
4. To retrieve from past monitoring the
probability )( nkpk EEP of the occurrence that
event pkE is same as the newly monitored event
nkE with observed occurrence of pC .
7.0)|( 11 pnp CEEP denotes 70%
monitoring presented the situation
that 1pE same as 1nE , when pC
occurs. 8.0)|( 22 pnp CEEP
5. To retrieve from past monitoring the probability of the co-occurrence of the j events
of pC same as the j events of nC . 2.0),
,,( 2211
njpj
npnp
EE
EEEEP
indicates 20% chances the events of
pC and nC are same
6. To calculate the probability )( np CCP
which indicates the satisfaction of pC retrieved
for nC , when the co-occurrence of j events of
both cases is respectively observed.
75.0),
,,|( 2211
njpj
npnpnp
EE
EEEECCP
is the posterior probability that
evaluates the retrieval of pC for nC .
Bayesian evaluation provides firstly the likelihood strength of the events in given situations and secondly the co-occurrence strength of cases. The likelihood strength evaluates the most likely answer for the given situation. The co-occurrence strength presents the results of the most likely recommendations in the case base for the new case. The principle of the Bayesian evaluation in case retrieval is
)...,,,(
))()|((),...,,|(
21
121
j
j
kiik
ji EEEP
CPCEPEEECP
(5.5)
where jE is the jth event of case iC . Considering a case iC contains j events, )|( ik CEP is
the probability of the occurrence of the kth event when iC has been observed.
)...,,,( 21 jEEEP is the joint probability of the co-occurrence of the j events. The posterior
probability ),...,,|( 21 ji EEECP , as the output we expect from the Bayesian inference, shows

76 Intelligent Belt Conveyor Monitoring and Control
the probability that iC is the best retrieved case, under the observation of the co-occurrence of
these j events.
This Bayesian evaluation algorithm can be illustrated by the process of statistically assessing
the retrieval of a past case pC in the case base for a new case nC . Practically, two cases may
contain different number of events and sometimes one event can be found in one case but not in another. These are the incomplete knowledge situations in case retrieval. The solution of handling the missing knowledge will be discussed in case completion (Section 5.3). To simplify the illustration of Bayesian evaluation in this section, we assume both past and new
cases contain j events expressed as PkE (k = 1, 2, …, j) for pC and nkE (k = 1, 2, …, j) for nC ,
respectively. The execution of Bayesian evaluation can be illustrated in Table 5.1.
The higher the posterior probability is, the higher certainty and confidence there are that the decision part of the past case can be applied for the new situation.
5.2.3 Experience scoring evaluation
It is possible that similarity measure or Bayesian evaluation returns a perfect answer for knowledge retrieval but experience cautions that the answer has only been seen very few times. It is also possible that both similarity measure and likelihood evaluation return more results for knowledge retrieval but the system has to choose one. The evaluation based on experience scoring provides absolute strength for case retrieval with given BCM situations. In this evaluation, the experience of cases is used to generate the understanding as to how often an input situation and an output recommendation have been seen together. The more often a case has been experienced during BCM, the more confident it will be to use this case to solve new problems.
In case retrieval and decision-making of IBCMC, the mechanism of experience score generates one value that reflects the frequency of which a case has been selected as the output of the decision-making process such as recommendation or prediction, given events and situations. Once a case has been retrieved and applied to confirm that it is able to provide a successful solution to a newly monitored situation, the experience score of this case will be counted incrementally. Simply, the experience score of a case in case base is a positive integer number starts from one. A value of one means that a case has been used one time to solve a problem the IBCMC system encountered and the solution was successful. The higher the experience score of a case is the higher confidence level the case shows in future case retrieval.
Experience scoring measures the degree of the familiarity of a case in the IBCMC system. Experience scores help the system to further determine what to do about a monitored situation. If the confidence level of case retrieval is really clear with a high experience score, a solution or a discovery may be chosen to be more aggressive with its interactions with a user. The higher the experience score is, the lower the risk of an incorrect recommended

The Decision-making Process 77
action could be. When more than one case is retrieved at the same time, the case with the highest experience score will be adopted to the new case.
5.3 Case completion
A case completion algorithm has been developed to complete the absent information and knowledge for new cases based on the past cases stored in knowledge bases (Pang and Lodewijks, 2006b). Once a new case arrives in the case completion process, its events are compared respectively to the events of past cases on the basis of events attributes. Similarity measures extract the most similar past case to match the new case in the purpose of providing solutions (the goal of CBR) to the problems of new case (Figure 5.7). Further, the statistical evaluation (Bayesian evaluation) and the confidence assessment (experience score) explain the reason of retrieving a past case when necessary.
qA pArA qA pA
rA qA pArAqA pA
rA
Figure 5.7 Case completion algorithm
In the CBR process, the case completion algorithm is not only applied for retrieving the decision part of past cases but can also be used to complete missing values during CBM processes. Sometimes, some events or attributes could not be monitored or the relative data might be missing. For instance, event E3 in Figure 5.7 is monitored in current situation and represented in the new case. But the data or knowledge of E3 is not available in the retrieved past case. Under this missing value situation, Bayesian evaluation is still able to provide its posterior knowledge for knowledge retrieval with keeping the prior knowledge of the missed information of the new case by ignoring matching the missed event.
)...,,,,(
))()|((),,...,,|(
421
1421
j
j
kiik
ji EEEEP
CPCEPEEEECP
(5.6)
In addition, Bayesian inference is able to induce the likelihood probability of the missed event of a new case that tends to the likely behaviour of the relevant event in retrieved case. With respect to retrieve the events co-occurrence probability from past monitoring for a new case, as described as step 5 in Table 5-1, the likelihood probability based on the situation shown in Figure 5.7 can be derived as
),,,,|( 44221133 pjnjpnpnpnpn EEEEEEEEEEP (5.7)

78 Intelligent Belt Conveyor Monitoring and Control
which shows whether the missed event 3E of the old case probably has high likelihood with
the matchable event of the new case, when other events of two cases are highly similar. In
case the answer is yes, 3E can be adapted to complete the past case. The capability of
handling missing values shows another sound reason to employ Bayesian method in the IBCMC application.
If the case base of the IBCMC system does not contain a similar enough past case to match current situation, or if two or more cases are retrieved for an identical case with exactly the same similarity measures, experience scores and likelihood to the new case, the process of case completion goes to case adaptation.
5.4 Case adaptation
In the CBR process, the problems defined from past occurrences do not always match the new problems. During case retrieval, when all retrievals have low similarity measures, it means that there is a significant gap between the new case and cases stored in the IBCMC system so that there is no one past case available to solve the problems of the new situation. Sometimes, more than one case could be retrieved at the same time. It indicates the lack of applied knowledge to clearly distinguish the retrieved knowledge and experience to a new situation. In these situations, case adaptation is required.
Time
Value
0
A
B
Figure 5.8 Situation of statistical heuristics
The situation of unavailable matched cases requires additional cases to complement the applied case base. The situation of more retrieved cases requires extra knowledge to complement the knowledge contained in retrieved cases. Solutions of both situations constitute the knowledge complement for the knowledge that is stored and used by the IBCMC system. Although there are many general methods in AI fields for case adaptation, solutions in the field of belt conveyors are highly domain knowledge dependent. The applied case base in IBCMC can be either adapted automatically by the CBR process itself or manually by the users. Automatic adaption makes the CBR system more complex and may reduce system reliability when expensive mistakes are made by the system. Therefore in

The Decision-making Process 79
many instances there are no attempts to make automatic case adaption but users who carry out this task based on domain-specific knowledge (Mark et al., 1996).
Although automatic case adaptation is not recommended, there are always situations that the newly monitored situation is so similar to the retrieved case that the IBCMC system can automatically use the past cases and modify them to reconcile the discrepancies between cases. The IBCMC system carries out two adaptation methods based on domain knowledge: the statistical heuristics and rule-based reasoning.
When the event identification in case completion is not able to deal with the (dis)similarity between two cases, statistical heuristics are applied to reduce or eliminate the deviation. Statistical heuristics that are available for this purpose include trending analysis, correlation analysis, cluster analysis, regression model, and causal modeling. Figure 5.8 shows a situation of applying statistical heuristics. Any events having similar behavior as line A can be clustered in one group. If a specific situation (line B) arrives and the event identification procedure cannot match it to the group that includes line A, then statistical heuristics will be applied to adapt this specific situation. For instance, statistical analyses will show that line A and line B are from the same cluster and they have very high correlation, the same trend and very similar regression pattern. In this case, line B can be identified as a potential member of the group of line A.
When a very special BCM situation arrives and there is no knowledge available for the reconcilement for case retrieval, case adaptation is implemented through rule-based reasoning. In IBCMC application, rules are collected from domain specialists by means of interviews or inquiries and stored in domain knowledge base. Rules consist of key properties to limit the application domain of the rules. These key properties include for example specific belt categories, particular mechanical properties, special operational strategies, etc. When the situation or events in the if part of a rule are matched, then the solutions and decisions in the then part of the rule can be provided for case adaptation. An explicit example is in a situation that the then part can be directly applied to a newly monitored situation when the if part, an extreme high belt tension, is observed, although the situation described in the if part had never been experienced in BCS performance.
When the adaptation for a new situation is completed, the adapted case will be stored with all information of the new situation in the case base where the most similar case was retrieved. If a new rule is adopted during case adaptation for a specific situation, it may need to be verified by means of actual performance, laboratory experiment or simulation. When the rule is proved to be effective by a domain specialist, it will be stored in the case base that fits the situation. Otherwise, the rule will be discarded and a new rule will be inquired for until the problem with the same monitored situation can be solved. If there is any conflict between the newly adapted and existing rules, the judgment of domain specialists will be required.

80 Intelligent Belt Conveyor Monitoring and Control

81
6 Agent-based Architecture
To decide and improve maintenance and operational control activities at a system level, the individual monitoring systems for BCS components need to be integrated. The interaction between these monitoring systems makes the application of IBCMC both spatially distributed (e.g. the IBCMC system integrates and interprets the data acquired from spatially distributed sensors) and functionally distributed (e.g. a group of monitoring systems with different specializations collaborate to solve complex problems in IBCMC). Distributed AI, which is a sub-field of AI, concerns where several systems interact to solve problems or make decisions in collaborative way (Gasser, 1991). In industrial applications, one approach used to reduce the complexity of distributed system is to adopt component-based architecture (Balakrishnan et al., 1999). Recent trends showed that this approach has been extended to agent-based architecture to establish the links between industrial control architectures, software technologies, diagnosis and decision-making (Srbljinovic and Skunca, 2003).
Research of distributed AI can be categorized into two main areas of distributed problem solving and multi-agent system (MAS) (Moulin and Chaib-Draa, 1996). The area of distributed problem solving considers how the tasks of solving a particular problem can be divided into a number of modules. These modules can be considered as problem solving agents that have the abilities to share the knowledge related to the problem domain to generate solutions. The later area concerns how a loosely-coupled network of problem solving agents work together to solve problems that are beyond the capacities of individual agents. Since the combination of individual BCM system can be considered as a loosely-couple network, the IBCMC system can be built as a MAS to integrate independent monitoring systems. This chapter presents the architecture of the MAS designed for IBCMC. A community of knowledge-based agents is assigned to monitor BCS, to assess the conditions of individual BCS components as well as the entire BCS, and to make motivated maintenance and operational decisions to the appropriate recipients. In Section 6.1, after discussing the feasibilities of applying agent-based technology to IBCMC, the architecture and agent interactive behaviours of the MAS are presented. As local intelligence, each agent possesses knowledge that can be invoked and shared. Section 6.2 shows the knowledge organization in the MAS that regulates knowledge utilization of agents. Section 6.3 describes agent

82 Intelligent Belt Conveyor Monitoring and Control
communication for the exchange of information for agent cooperation and agent coordination in the MAS.
6.1 Agent-based architecture for distributed intelligence
In literature, there is still no universally accepted definition for an agent or a MAS. Some researchers defined agents in very precise terms of mental states such as beliefs, capabilities, choices and commitments, while other definitions are quite general when describing the functionalities of agents (Wooldridge, 2002). Although people do not agree on the trivial terminological details of agents, they commonly agree that an agent is a software program with the purpose of offering assistance to its user. Most researchers, who have made their own definitions of intelligent agents, have ascribed different characteristics to agent (Wooldridge and Jennings, 1995). Three characteristics that can be primarily considered in IBCMC applications are
Autonomy: agents operate without direct intervention of humans or other agents and have some kind of control over their own actions and internal states;
Social ability: agents interact with other agents and possibly with humans via agent communication to fulfil system functions cooperatively;
Intelligence: agents perform intelligent behaviour facilitated by embodied techniques such as machine learning, probabilistic reasoning and automated decision-making.
Based on these characteristics, an agent in IBCMC is a system of local intelligence, which is capable of executing tasks, to communicate, and to make decisions on its own based upon observations, own knowledge and cognitive competencies. As well, an agent is a system that has the capability to utilise, to learn and to extend knowledge to adapt to changes in the environment of the system.
6.1.1 Meeting the needs of IBCMC
A general overview has been given by Parunak (1998) that describes the industrial requirements of distributed AI for giving special attentions to system control. The performance of BCS and the application of BCM have some characteristics similar to what appear in typical distributed AI applications, where agent-based technologies have been proved successful:
System information and knowledge are spatially distributed in different sources;
Decision-making and solutions about system diagnoses involve in the coordination of different individuals with different functions;
Solving problems that are too large for a centralized system;
Standard hardware and software engineering solutions are difficult and complex due to the integration of individual systems;
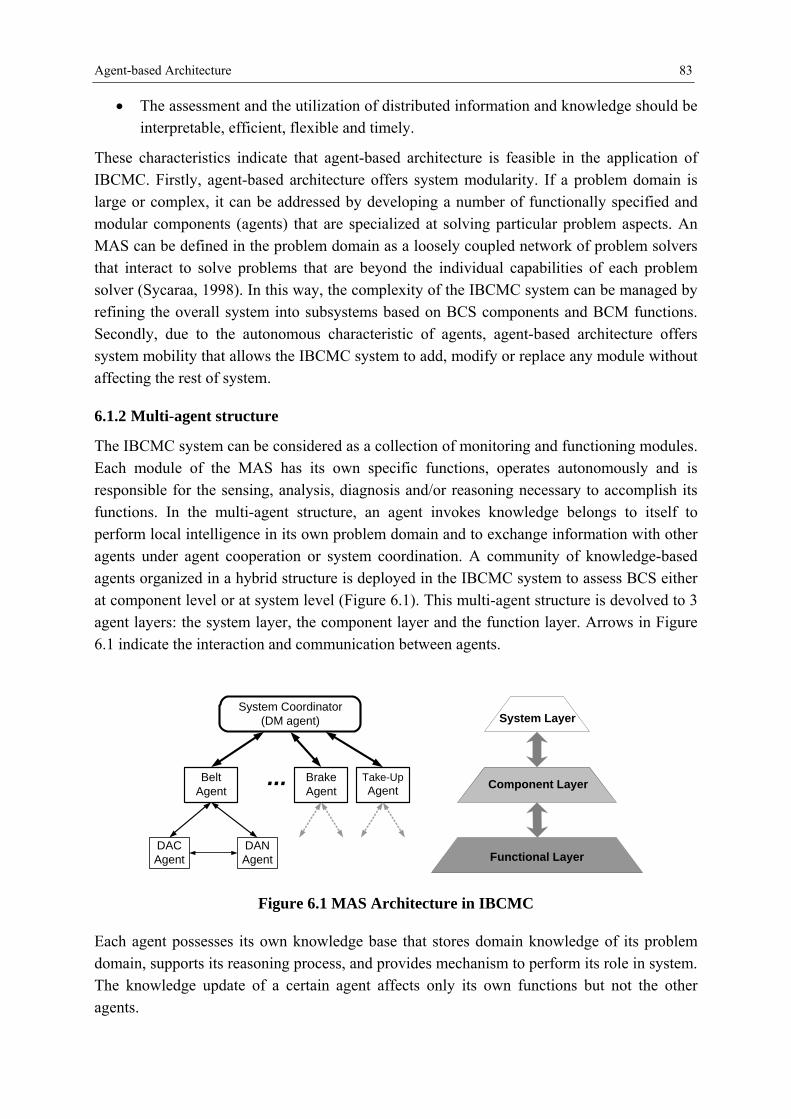
Agent-based Architecture 83
The assessment and the utilization of distributed information and knowledge should be interpretable, efficient, flexible and timely.
These characteristics indicate that agent-based architecture is feasible in the application of IBCMC. Firstly, agent-based architecture offers system modularity. If a problem domain is large or complex, it can be addressed by developing a number of functionally specified and modular components (agents) that are specialized at solving particular problem aspects. An MAS can be defined in the problem domain as a loosely coupled network of problem solvers that interact to solve problems that are beyond the individual capabilities of each problem solver (Sycaraa, 1998). In this way, the complexity of the IBCMC system can be managed by refining the overall system into subsystems based on BCS components and BCM functions. Secondly, due to the autonomous characteristic of agents, agent-based architecture offers system mobility that allows the IBCMC system to add, modify or replace any module without affecting the rest of system.
6.1.2 Multi-agent structure
The IBCMC system can be considered as a collection of monitoring and functioning modules. Each module of the MAS has its own specific functions, operates autonomously and is responsible for the sensing, analysis, diagnosis and/or reasoning necessary to accomplish its functions. In the multi-agent structure, an agent invokes knowledge belongs to itself to perform local intelligence in its own problem domain and to exchange information with other agents under agent cooperation or system coordination. A community of knowledge-based agents organized in a hybrid structure is deployed in the IBCMC system to assess BCS either at component level or at system level (Figure 6.1). This multi-agent structure is devolved to 3 agent layers: the system layer, the component layer and the function layer. Arrows in Figure 6.1 indicate the interaction and communication between agents.
System Coordinator(DM agent)
Take-UpAgent
BrakeAgent
BeltAgent
DACAgent
Component Layer
Functional Layer
System Layer
...
DANAgent
Figure 6.1 MAS Architecture in IBCMC
Each agent possesses its own knowledge base that stores domain knowledge of its problem domain, supports its reasoning process, and provides mechanism to perform its role in system. The knowledge update of a certain agent affects only its own functions but not the other agents.

84 Intelligent Belt Conveyor Monitoring and Control
System layer is the highest coordinative layer of the MAS. A system coordinator is the agent in system level that coordinates the agents of component layer and performs functions of CBR for decision-making with a view of entire BCS situation. The system agent integrates the monitored situation from BCS components as incomplete cases for decision-making process. It manages knowledge in the system level that contains case bases and particular domain knowledge. The knowledge in system level can be shared by agents in lower level.
Component layer consists of agents that monitor individual BCS components such as belt, brake, pulley, take up, drives, etc. Component agents are in charge of knowledge representation when any abnormality is monitored from BCS components. A component agent can be added, removed or updated without affecting other agents in the same layer, but it might influence the conclusion drawn from the decision-making process in system layer. Therefore, agents in this layer can be considered as independent from each other. Knowledge of component agents can not be exchanged within the component layer through the coordination of system coordinator. Component agents invoke knowledge at system level, manage the knowledge in their own problem domains, report local monitoring situation to system coordinator, and coordinate agents in lower level to fulfill the functions of DAC and DAN.
Function layer contains agents that collaborate with component agents in a higher level. Each component agent has a DAC agent and a DAN agent. The DAC agent collects raw data from desired parameter of the monitored component. The DAN agent analyses and diagnoses the monitored situation of the components. Once an abnormality is discovered by the DAN agent, the component agent acquires and represents the data and information monitored by its DAC agent. Under one component agent, the function agents act dependently and affect each other. The data acquired by the DAC agent is analysed by the DAN agent and invoked by the component agent. The DAC agent is evoked by the DAN agent or the component agent to discard the monitored data or store it to database based on the monitored situation. Function agents possess their own knowledge and utilize the knowledge of the component agent.
6.2 Knowledge organization
As a KBES built in a distributed structure, the knowledge in the IBCMC system should be managed in an efficient way for the utilization and share among system modules. It should be organized in an effective way to reduce the complexity of knowledge retrieval. Based on literature, the knowledge in a MAS can be categorized in terms of local knowledge and global knowledge (Bertola and Teixeira, 2003; van Elst, 2004). However, such categorization is always ambiguous and overlapping. For example, the term local knowledge might be defined as either “domain knowledge only used by the agent itself” or “the knowledge responses to one problem area can both be used by the agent itself and invoked by other agents” (Lorentzen, 2006). In addition, the term of global knowledge might imply that the knowledge which can be shared by any agent in the agent network (Koch et al., 2004). In order to clearly describe the knowledge organized in the MAS of IBCMC, the terms internal knowledge and external knowledge are used in this research.

Agent-based Architecture 85
6.2.1 Internal knowledge and external knowledge
Internal knowledge is the knowledge of an agent with respect to its specific function area and problem domain. It is limited to the agent itself and used to fulfill its functions so that it is not shared by other agents. Internal knowledge is managed by the agent itself and supervised by the agent in a higher layer. For instance, DAC agents use arbitrary knowledge such as a pre-defined sample frequency and the number of monitoring parameters; DAN agents requires special diagnostic and analytic knowledge; component agents possess knowledge for knowledge representation; and the system coordinator has domain knowledge for case adaptation. The management of internal knowledge includes functions of add, delete, update, etc. Any change of the internal knowledge of an agent does not influence the function and knowledge of other agents.
External knowledge of an agent can be retrieved and shared by other agents. The setting of external knowledge enables MAS to complement knowledge, achieve flexible knowledge retrieval process, avoid large knowledge base, simplify knowledge base structure, and optimize diagnostic and decision-making processes. External knowledge is managed by domain specialist or system coordinator and can be shared by agents in lower layer. Therefore, only agents in system layer and component layer possess external knowledge.
An agent performs on the basis of utilizing internal knowledge. In case the function of the agent is not executable due to the lack of internal knowledge, for instance, a DAN agent encounters strange values or a failed knowledge representation in a component agent is caused by missing data and information, the agent queries complement knowledge from the agent in higher layer. In this situation, desired complement knowledge of other agents is invoked and shared through the coordination of the agent in the higher level. If the coordinative agent can not invoke required knowledge to be shared, the knowledge of domains specialist is required.
6.2.2 Knowledge of domain specialist
The knowledge derived from domain specialists is an important complement of the knowledge of IBCMC. Different from the knowledge represented as internal and external knowledge, knowledge of domain specialists usually focuses on partial and particular BCS situations that the IBCMC system has never experienced. Such knowledge is in “if … then…” structure regarding to specific abnormalities of BCS and its components. This type of knowledge is supervised and managed by domains specialists and plays the role of
complementing system and agent knowledge;
adapting reasoning processes;
solving non-experienced abnormalities;
controlling and coordinating agent actions;
verifying outputs from reasoning and decision-making processes.

86 Intelligent Belt Conveyor Monitoring and Control
6.3 Agent communication
As local intelligence, each agent performs particular tasks that are solely a part of the overall intelligent process. To achieve the goals of the IBCMC system that maintenance and operational decisions can be made in a system level, the coordination in system level and the cooperation in lower layers require agent communication. Agent communication languages (ACLs), such as knowledge query management language (KQML) (Payne, et al., 2002), have been widely accepted as standard languages and protocols by most MAS practitioners. Comparing to ACLs, events based agent communication is less flexible but more straightforward when the information flow is pre-defined in a diagnostic and decision-making process (Singh, 1998). Since the intelligent processes of IBCMC have the capacities to create such pre-defined information flow, the event based communication technology can be directly applied so that the development of specific communication languages in IBCMC can be avoided.
The agent communication in IBCMC follows the principle of events based broadcast with two communication modes (Shen et al., 2000). The first mode is point-to-point broadcast (one agent to one agent) that enables the communication between two agents in function layer (the cooperative communication). The second mode is multicast (one agent to an agent group) that enables the communication between agents in two layers (the coordinative communication). Each agent has its communication mechanism including a sender and a receiver. A broadcast consists of the information about available events and the linkages of the events during BCM.
6.3.1 Communication for agent cooperation
Cooperative communication happens only in the lowest agent layer, the function layer, aiming at the cooperation between function agents to achieve the function from DAC to DAN. In the communication process, one agent may function as a sender which broadcasts its events to another. As well one agent may function as a receiver that receives and recognizes the broadcasts from another. As shown in Figure 6.2, the function layer that relates to the monitoring of a certain BCS component is composed of a DAC module and a DAN module. Each module forms an agent with its knowledge, functions and local intelligence.
The DAC agent samples the raw data of desired parameters from BCS components. Requirements of DAC such as sample frequency, data flow size and parameter property are stored in the DAC agent as internal knowledge. Once a situation is monitored and the data is ready to be analyzed, this event will be broadcasted to the DAN agent, with the linkage of the event. After receiving and recognizing the event, the DAN agent invokes matched algorithms to analyze the monitored situation. If the monitored situation is healthy, the DAN agent broadcasts this event to inform DAC agent to discard the monitored data (Figure 6.3a). Otherwise, the DAC agent will be informed to store the data (Figure 6.3b). Meanwhile, the results of DAN will be reported to the component agent. Further, the component agent will evoke the data collected by DAC agent for knowledge representation.

Agent-based Architecture 87
DAC Agent
• Parameters and properties• Data sample requirements• Size of data flow ······
DAN Agent
• Fault identification• Fault quantification• Fault classification• Causal analyses ······
Broadcasts&
Queries
Broadcasts&
Queries
Figure 6.2 Agent communication in function layer
DAC Agent
DAN Agent
Monitored situationAvailable data
Healthy situationDiscard data
DAC Agent
DAN Agent
Monitored situationAvailable data
Unhealthy situationStore data
(a) (b)
Figure 6.3 Cooperative communication
In case of improper information provided by the DAC agent, such as insufficient information, inconsistent size of data flow, strange values, etc., the DAN agent broadcasts these events to the DAC agent. Then the DAC agent updates current DAC settings based on its internal knowledge and/or the external knowledge shared from its coordinator.
6.3.2 Communication for agent coordination
Coordinative communication aims at the coordination from component agents to function agents to ensure that the functions of the lowest layer can be fulfilled successfully. As well, coordinative communication enables the system coordinator to integrate the monitoring results of individual component agents so that an overview of the entire system can be gained.
The coordinative communication between component layer and function layer happens only when any abnormalities are discovered by the DAN agent. In this situation, the DAN agent broadcasts the event of unhealthy monitored condition to its component agent with the linkage of the results of data analyses. Then the component agent sends DAC a query to inquire relative monitored data. After receiving the linkage of the monitored data, the component agent evokes and represents the data to the knowledge required by decision-making process. Afterwards, the component agent informs the DAN agent to remove the results of data analyses (Figure 6.4). Further, the DAC agent is informed that the stored monitored data can be overwritten.

88 Intelligent Belt Conveyor Monitoring and Control
DAC Agent
DAN AgentMonitored situation
Available data
Unhealthy situationStore data
Component Agent
Linkage of data
Query of data Unhealthy situation
Discard DAN results
Figure 6.4 Coordinative communication component layer
In the IBCMC system, the integration of the information gathered by individual components agents is achieved with the assistance of the coordinative communication between system layer and component layer. When the situation of a BCS component is monitored and represented by a relative component agent, the event of represented knowledge is broadcasted to the system coordinator with the linkage of the knowledge. The system coordinator agent collects the represented knowledge from each component modules and integrates them into incomplete cases to be used as the input of decision-making process. The knowledge representation of each component agent is discarded after the case completion process is finished (Figure 6.5).
Component Agent 4
Component Agent 3
Component Agent 2
Component Agent 1
Represented knoweldge
System Coordinator
DecisionsDiscard knowledge
representation
Figure 6.5 Coordinative communication system layer
In case the knowledge representation can not be achieved due to the lack of internal knowledge of a component agent or the needs of extra information from other component agents, the component agent will query the system coordinator. Then the system coordinator feeds back the linkage of the sharable knowledge in its external knowledge or the linkages of the extra information which it queried from other component agents.

89
7 System Implementation and Evaluation
Conventional BCM systems focus on the health conditions of special BCS components. Traditionally, the information derived from the inspection and monitoring of individual BCS components is not integrated. Therefore, regarding to the monitored abnormalities during BCS performance, the decision-making for maintenance and operational activities is not based on the overall status of BCS. As well, to interpret the information from BCM systems and to make satisfactory decisions rely considerably on the knowledge and experience of domain specialists. The IBCMC system developed in this research project provides the solutions to minimize human involvement in BCS maintenance and operational decision-making based on the integration of BCM information.
The previous chapters have described that the IBCMC system can be achieved by its functional modules of automated DAC, DAN and decision-making. As already described in Section 4.1, these modules trace out the conversion process from data to information, and to knowledge. The integration of these modules with respect to different BCS components forms the MAS architecture of the IBCMC system. During the development of the IBCMC system, these functional modules have been implemented and validated in various environments such as BCS field tests, laboratory experiments and expert assessment. At the final stage, the IBCMC system has been implemented in a laboratory environment by integrating the developed modules into an agent-based system.
Table 7-1 Implementation environment of the IBCMC system
Module BCS field Simulation Laboratory Expertise
Data acquisition
Knowledge acquisition
Decision-making
Agent-based IBCMC

90 Intelligent Belt Conveyor Monitoring and Control
Table 7-1 summarizes the environments that have been applied during the development of the
IBCMC system. A mark indicates that the implementation, test and evaluation of a module
or the agent-based IBCMC system have been done in an environment.
Today’s advanced programming languages and computational tools enable the functions of BCM modules and the achievement of IBCMC. The software packages and tools employed in this research project mainly include:
Borland Delphi, as a software development package of Borland Software Cooperation, is employed to achieve the functions and build the interface of the IBCMC system;
LabVIEW, as a development environment of National Instruments (NI), is employed to carry out DAC and the pre-parse of collected data;
Simulink, as a tool of the MathWorks for modelling, simulating and analysing multi-domain dynamic systems, is employed to build BCS models and simulate BCS performance for knowledge acquisition;
The aim of this research is to develop an intelligent system that is able to automate the maintenance and operational control decision-making process by mean of integrating the information from individual BCM systems. The goal of this research project is not to develop a complete system that covers the monitoring and control of all BCS components, but to achieve the satisfactory implementation of the intelligent system with respect to the optimized decision-making results with less or without human efforts. This chapter presents the implementation of the developed IBCMC system. In Section 7.1, the implementation of a simplified ECD system, which has been introduced in Section 2.3, is presented to show the principles of this detection technology and the performance of automated DAC and DAN in IBCMC. Section 7.2 shows the implementation of automated decision-making, which is achieved by the simulation-based knowledge acquisition approach (Chapter 4) and the CBR process (Chapter 5). This part of the IBCMC system has been implemented on a test facility of a hydraulic belt conveyor brake system. In Section 7.3, the implementation of an agent-based system for IBCMC is given. Section 7.4 quantitatively evaluates the overall performance of the developed IBCMC system.
7.1 Implementation of data acquisition
One achievement of this research project is the novel ECD system introduced in Chapter 2. The implementation of the ECD system showed that the system was able to achieve its design purpose of the intelligent abilities in DAC and DAN. In a laboratory environment, the ECD is built on four fundamental components. The first component is the magnet matrix embedded in the belt. The embedded magnets provide the desired signals to represent actual performance of the belt. The second component is a magnetic sensor system that receives signals and raw data from magnets. The third is a set of high-speed DAC devices that include a NI DAC board, connection cables and a NI DAC card. The fourth is a combination of advanced data processing hardware and software. Figure 7.1 shows the setting of the ECD system that was

System Implementation and Evaluation 91
constructed in a laboratory environment. Integrated two-axis Hall sensor (type 2SA-10) and neodymium magnets (diameter 12mm, thickness 2mm) were used in the system. The properties of the sensor and magnets are given in Appendix A. The retail price of each magnet
is less than €1.00. The price of each sensor is around €15.00 including the printing board and
one internal inductive magnet (Figure 7.2).
DAC Device
Data Processer
Belt & Magnets
Sensor
Figure 7.1 Components of an ECD system
Figure 7.2 Magnetic sensor of ECD system Figure 7.3 Magnets line and sensor
As introduced in Section 2.3.4, the ECD system is intended to be built in a conveyor belt equipped with a magnet matrix. However, the manufacture of such a conveyor belt has not been achieved so far. Therefore, the ECD system has been implemented and tested by laboratory experiments, based on the individual monitoring aspects discussed in Section 2.3.3. This section presents the application of monitoring belt misalignment in detail to show the

92 Intelligent Belt Conveyor Monitoring and Control
procedures and results of implementing the ECD system. The experimental results of monitoring other aspects are briefly introduced.
To monitor belt misalignment, one single magnets line was buried 7 mm deep into the belt. The distance between two magnets was 250 mm. The magnetic Hall sensor was fixed on a steel frame to collect magnetic signal when magnets passed through it (Figure 7.3). The vertical distance between the sensor and magnets was set to 12 mm. The effective
measurement ranges in vertical and horizontal directions were 30 mm and 40 mm,
respectively.
0 5 10 15 20-5-10-15-20mm
Sen
sor
outp
ut (
v)
0
2.5
5.0
-2.5
-5.0Time (ms)5325 5575
3.28
Belt Speed (m/s)
?t = 1525 ms
Figure 7.4 Belt displacement monitoring in LabVIEW interface
3
3.5
4
4.5
5
0 5 10 15 20 25 30 35 40
Misalignment (mm)
Hal
l Sen
sor
Out
put (
v)
.
Figure 7.5 Hall sensor output vs belt misalignment
The DAC and data processing was constructed in a LabVIEW environment. Figure 7.4 is the graphic user interface of the LabVIEW application, when axial belt displacement was being

System Implementation and Evaluation 93
monitored. In this application, the data sample frequency was set to 1 kHz, which is 50 times higher than the frequency of the magnetic signals from magnets. The output voltage values of the magnetic sensor can be converted to the misalignment of the magnets line from the central line of the sensor. The misalignment of magnets line equals to actual belt displacement shown on the displacement scale in the computer interface. The results of laboratory experiments showed that the relation between the sensor outputs and the misalignment of the magnets line is as given in Figure 7.5.
In belt misalignment monitoring, the set points of belt displacement alarms were predefined as four levels from 5 mm to higher than 20 mm. When belt displacement exceeds one set point, relative alarm will be given. In the monitoring situation shown in Figure 7.4, the output of the magnetic sensor is around 3.3 v, which corresponds to 15 mm belt displacement and triggers the displacement alarm at the third level.
In this application, belt speed can be calculated based on the number of appeared magnetic pulses within a monitoring period:
)()(
))(),((
imjim
jimim
tt
dv
(7.1)
where v is the calculated belt speed, ( ( ), ( ))m i m i jd is the distance between two magnets, say, the
ith magnet ( )m i and the (i+j)th magnet ( )m i j (i, j = 1, 2, 3, …), that sequentially pass
through the sensor at time ( )m it and ( )m i jt , respectively. Figure 7.4 indicates that the
calculated belt speed was 3.28 m/s because 500 mm belt passed through the sensor within a period of 1.525 s.
Due to the detection limit, single Hall sensor can only monitor belt misalignment in a small range of a few centimeters. In this research project, sensor rulers have been developed in order to extend the measurement range of the detection system. As well, the ECD system was also implemented with respect to the monitoring of belt abrasion, belt vibration and belt identities. The monitoring of belt tension was not able to be implemented because tension could not be applied to the conveyor belt used in the laboratory experiments.
In belt abrasion monitoring, three magnet lines were embedded 0 mm, 5 mm and 10 mm deep in the belt. Three Hall sensors, the sensors A, B and C, which were installed above the belt with equal vertical distance from the belt surface, were used to measure the strength of magnetic signals of these magnet lines. The output voltage signals indicate the vertical distance between the sensor and the magnets. When the surface of a belt is worn, the distance between the embedded magnets and a sensor is reduced so that the strength of the magnetic signals increases. Figure 7.6 partially shows the monitoring results of three sensors. If the output of sensor C assumes an initial abrasion condition of a belt, then the outputs of sensor B and sensor A can be used to estimate the abrasion of the belt at 5 mm and 10 mm, respectively.
In the experiments of monitoring belt vibration, a magnet line was embedded at one edge of the belt where the vertical movement of the magnets can be detected by the sensor. Figure 7.7
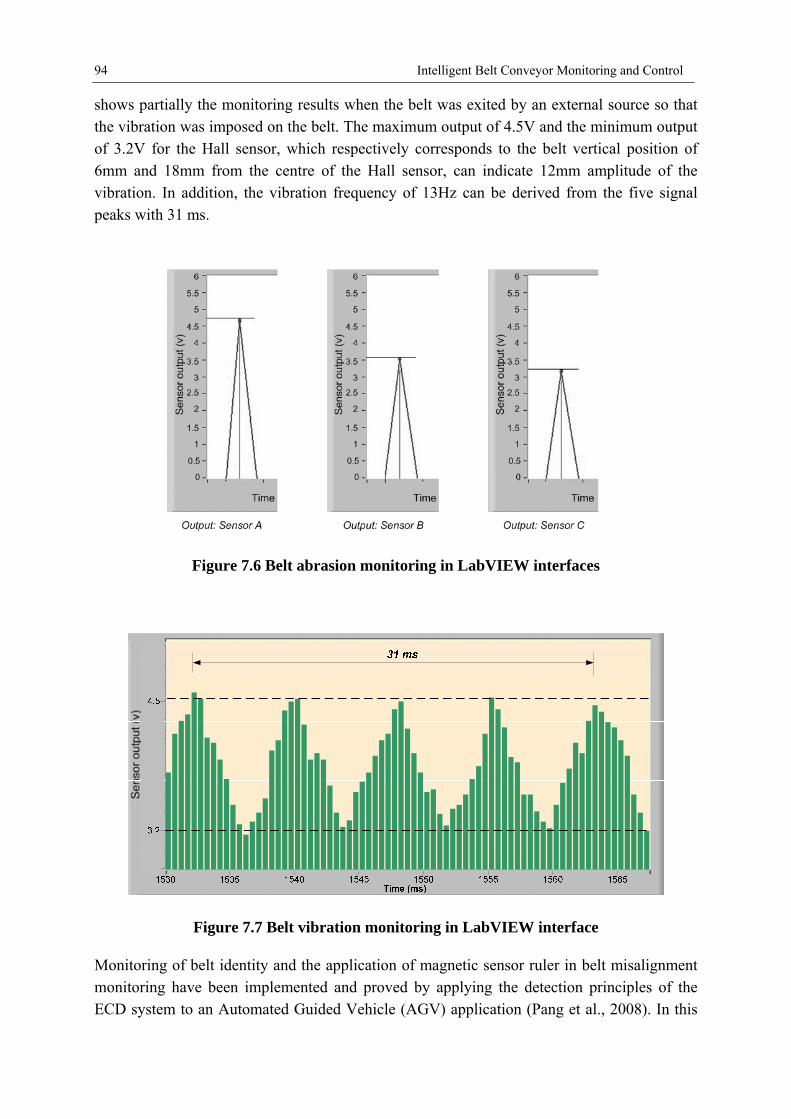
94 Intelligent Belt Conveyor Monitoring and Control
shows partially the monitoring results when the belt was exited by an external source so that the vibration was imposed on the belt. The maximum output of 4.5V and the minimum output of 3.2V for the Hall sensor, which respectively corresponds to the belt vertical position of 6mm and 18mm from the centre of the Hall sensor, can indicate 12mm amplitude of the vibration. In addition, the vibration frequency of 13Hz can be derived from the five signal peaks with 31 ms.
Figure 7.6 Belt abrasion monitoring in LabVIEW interfaces
Figure 7.7 Belt vibration monitoring in LabVIEW interface
Monitoring of belt identity and the application of magnetic sensor ruler in belt misalignment monitoring have been implemented and proved by applying the detection principles of the ECD system to an Automated Guided Vehicle (AGV) application (Pang et al., 2008). In this

System Implementation and Evaluation 95
application, an AGV travels through a magnet line. The magnets were embedded along the path of the AGV and arranged in the pattern that is able to provide binary information, as introduced in Section 2.3.3.1. The control system of the AGV collects the binary code along the path to identify the exact position of the vehicle and to decide operational actions such as turning, steering or stop. Two sensor rulers were equipped in the front and the back of the vehicle. Each ruler was composed of four Hall sensors (Figure 7.8) as described in Section 2.3.3.5. Each sensor provided an input signal to the control system of the AGV. Based on the signals from the eight sensors, the control system distinguished the misalignment of the front and rear parts of the vehicle from the path. Then the direction and the speed of the vehicle were controlled. The implementation of the AGV proved that such a magnetic positioning system can be successfully applied to the monitoring of conveyor belts.
Figure 7.8 Sensor ruler applied in magnetic positioning system
7.2 Implementation of knowledge acquisition and decision-making
To build up the IBCMC system to be a KBES, various knowledge sources need to be applied for knowledge acquisition. Section 4.1 discussed available knowledge sources for IBCMC and specially presented the advantages of using simulation as one source of knowledge. The simulation-based knowledge acquisition approach was one major part of this research project to achieve an effective way to build-up required knowledge in IBCMC (Pang and Lodewijks, 2006a). In this research project, this approach was implemented based on the modeling and simulation of a hydraulic brake system applied on BCS. Acquired knowledge, as the outputs of simulation, were validated by field tests and laboratory experiments. After being elicited from the simulation-based knowledge acquisition process, knowledge was represented to the format required by the reasoning process (Section 4.5) and to be retrieved for decision-making.
In Section 3.1.2, with respect to the net saving of developing an intelligent monitoring system, the potential payoff and the evaluation of system complexity have been discussed. Referring
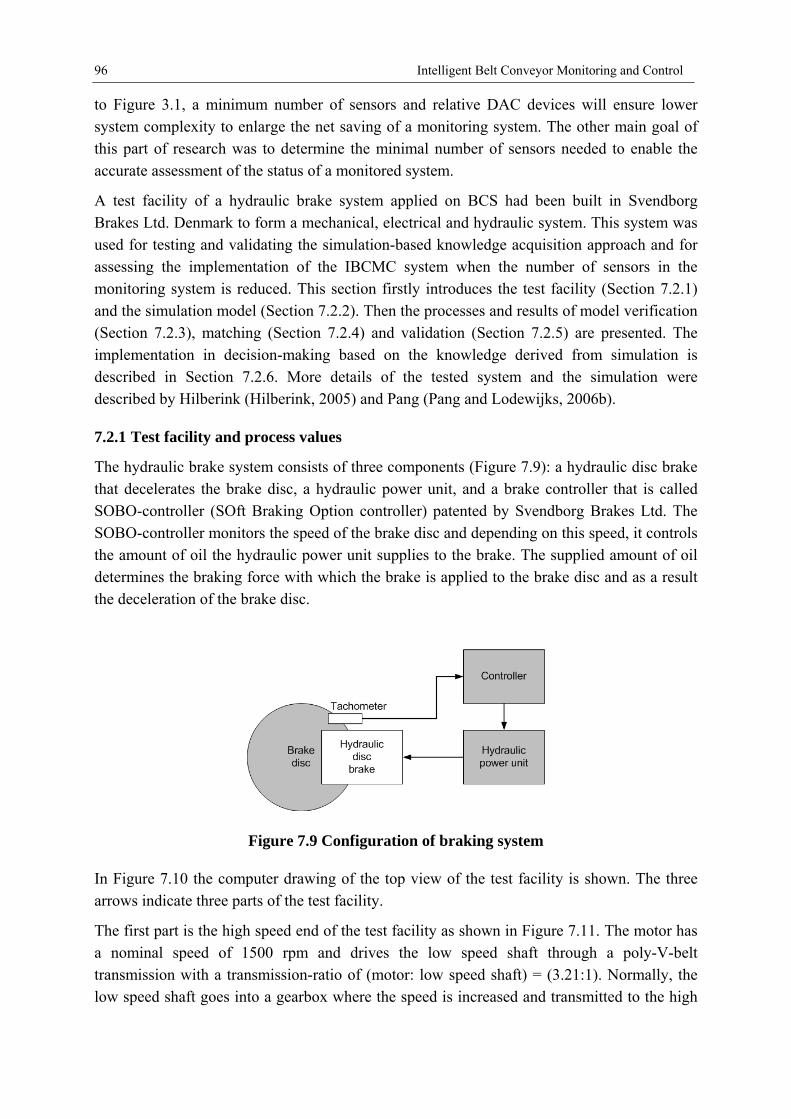
96 Intelligent Belt Conveyor Monitoring and Control
to Figure 3.1, a minimum number of sensors and relative DAC devices will ensure lower system complexity to enlarge the net saving of a monitoring system. The other main goal of this part of research was to determine the minimal number of sensors needed to enable the accurate assessment of the status of a monitored system.
A test facility of a hydraulic brake system applied on BCS had been built in Svendborg Brakes Ltd. Denmark to form a mechanical, electrical and hydraulic system. This system was used for testing and validating the simulation-based knowledge acquisition approach and for assessing the implementation of the IBCMC system when the number of sensors in the monitoring system is reduced. This section firstly introduces the test facility (Section 7.2.1) and the simulation model (Section 7.2.2). Then the processes and results of model verification (Section 7.2.3), matching (Section 7.2.4) and validation (Section 7.2.5) are presented. The implementation in decision-making based on the knowledge derived from simulation is described in Section 7.2.6. More details of the tested system and the simulation were described by Hilberink (Hilberink, 2005) and Pang (Pang and Lodewijks, 2006b).
7.2.1 Test facility and process values
The hydraulic brake system consists of three components (Figure 7.9): a hydraulic disc brake that decelerates the brake disc, a hydraulic power unit, and a brake controller that is called SOBO-controller (SOft Braking Option controller) patented by Svendborg Brakes Ltd. The SOBO-controller monitors the speed of the brake disc and depending on this speed, it controls the amount of oil the hydraulic power unit supplies to the brake. The supplied amount of oil determines the braking force with which the brake is applied to the brake disc and as a result the deceleration of the brake disc.
Figure 7.9 Configuration of braking system
In Figure 7.10 the computer drawing of the top view of the test facility is shown. The three arrows indicate three parts of the test facility.
The first part is the high speed end of the test facility as shown in Figure 7.11. The motor has a nominal speed of 1500 rpm and drives the low speed shaft through a poly-V-belt transmission with a transmission-ratio of (motor: low speed shaft) = (3.21:1). Normally, the low speed shaft goes into a gearbox where the speed is increased and transmitted to the high

System Implementation and Evaluation 97
speed shaft. For the testing during this research, it was decided not to install the gearbox because conveyor belt systems run on low speeds. Therefore, the test facility contains only one shaft, which is supported by a bearing half way its length.
The brake disc is mounted on the free end of the high speed shaft. For this research, the 800 mm disc made of steel 52-3 has been used during testing. While braking, the braking torque will be transmitted to the torque plate. This torque plate is mounted on two force links with which the braking force can be measured. On the other side of the poly-V-belt, the low speed shaft passes through a protection cover.
Figure 7.10 Top view of test facility
Protection cover
Poly-V-belt
Electrical drive
Speed shaft
Torque plate
Brake disc
Test brake
Force link
Figure 7.11 Field test facility of brake system

98 Intelligent Belt Conveyor Monitoring and Control
Behind the protection cover, several components are mounted on the low-end shaft as illustrated in Figure 7.12. The first component is the flywheel. This flywheel provides the mass moment of inertia that replaces the mass moment of inertia of the conveyor belt and its load in a BCS. This substitution induces the main simplification between a BCS and the test facility, because the complex dynamic influences a conveyor belt would exert on the system are replaced by the known dynamic behaviour of the flywheel. Behind the flywheel, a disc brake is mounted. This disc brake is used as emergency brake in case of failure of the test brake or when the system is out of control. The total mass moment of inertia of the rotating parts of the test facility equals 13008.66 kgm2.
Figure 7.12 View of fly wheel
In order to implement the model of the test facility in a software package, the brake system needs to be broken up into parts in modeling. These parts of the software model, called subsystems, represent the different physical components of the system which include the SOBO-controller, hydraulic power unit, disc brake and the disc. These subsystems consist of lower level subsystems that can reach the most detailed level of the system when all the data of process parameters can be collected from the model. Based on the model requirements and the working principles of the brake system and its components, 20 process value indicators were defined. These indicators correspond to a sensor list shown in Table 7-2 for the data collection from the test facility. The model requirements are further discussed in following sections in this chapter. The working principles of the brake system are given in Appendix B.

System Implementation and Evaluation 99
Table 7-2 Sensor list for measuring process parameters
Indicators of process values Sensors for process values
1p pressure in main accumulator Hydraulic pressure sensor
0p pressure in tank Hydraulic pressure sensor
%X pulse width modulation Volt meter
3 flow into brake cylinder Flow meter
3p pressure in brake cylinder Hydraulic pressure sensor
p2 lifting pressure of brake Hydraulic pressure sensor
cylF force executed by the piston on the brake pad Hydraulic pressure sensor
brakeF braking force Torque transducers
pvv angular velocity of the brake disc Incremental encoder
dx ; velocity of the brake pad Displacement sensor
x ; displacement of the brake pad Distance probe
Pumping time and number of times starting pumping Voltmeter
Pressure switch output signal Voltmeter
Valve position Displacement sensor
Air gap distance changes due to wear Analogue on/off
Fluid level in tank Level and thermo switch
Output tachometer Incremental encoder
padT temperature of the brake pad Temperature sensor
discT temperature of the brake disc Infrared sensor
Power supply Voltmeter
7.2.2 Mathematical software model
The model of the hydraulic brake system is a mathematical software model built in software package Simulink. In Simulink, the model was described by a set of differential equations in terms of so-called state variables and a set of algebraic equations. These equations relate to other system variables of interest to the state variables (Appendix C). This model generates simulated operational data and gathers information about process parameters that are the indicators for both normal operations and important failure causes of the hydraulic brake system. Simulation results are sent to the IBCMC system and represented as knowledge in the format of complete cases stored into knowledge bases. The knowledge derived from the software model is further retrieved when new situations are monitored and relative decisions need to be made.
As discussed in the previous section, the studied hydraulic brake system can be broking up into four subsystems based on its physical components. Based on the descriptions of the hydraulic brake system and the working principles of each of the components, the causalities that inter-relate these physical parts form the basic framework of the simulation model (Figure

100 Intelligent Belt Conveyor Monitoring and Control
7.13). In this model, measured process value of brake disc velocity (vps) is compared with a set point velocity (vsp). Results of the comparison are input to the controller to control the oil amount delivered to the brake, by means of adjusting the pulse width modulation (X%) of the controller to open and close the solenoid directional valves 20 and 21 (see Appendix B). The braking force (Fbrake) is changed with the cylinder pressure to decelerate the rotation of brake disc.
Figure 7.13 Simulation model of brake system
The modularity of the model results in a better overview and maintainability of the software model. Each of the subsystems can be broken up into different parts and contains other subsystems to reach a sufficient level of system details. The software models of these subsystems are viewed in detail in Appendix C.
The simulation of the software model has been executed on the test facility of hydraulic brake system. The model has been evaluated by the results of verification, matching and validation. The process of model verification, matching and validation was discussed in Section 4.2. After implementing the model of the hydraulic brake system in the Simulink, the complete software model was verified by known process values. Based on the measured data during testing, the process values as simulated by the software model are matched with the measured values. The results of model validation are given in Section 7.4 combining with the evaluation of the IBCMC system.
7.2.3 Verification of software model
Verification is the initial evaluation of the models, mainly based on theoretical process knowledge. Verification should show the ability of the models to describe the physical processes. Based on Grimmelius (Grimmelius, 2005) and the discussion in Section 4.2, the expected trends of the simulation outputs should be visible without demands on numerical precision. The model verification process in this research project consisted of three steps.
The first step in the model verification process was taken place during model development. In this step, key variables of each subsystem were adjusted to be alike as what these variables behave in process in order to identify and solve errors that deter the model from stable simulation.
In the second step, the model was verified to be numerically stable enough to run for at least three to five times the largest time constant in the model so that sufficient simulation results

System Implementation and Evaluation 101
can be available for evaluation. For the hydraulic brake system, the largest time constant in the model was taken as the time required to stop the disc from rotating while fully braking, which amounts to 78 seconds. To meet this requirement, simulation parameters, such as simulation time, numerical solver, step sizes, tolerance and output options, were set to the Simulink model.
The third step of model verification evaluated whether the simulation results followed the expected trends and whether they lied within the expected range. This evaluation was achieved by disconnecting the pulse width modulation output from the SOBO-controller to the solenoid directional valves 20 and 21 and instead giving a constant pulse width modulation (X% = constant) as input for these two valves.
Three different steady state tests, when the modulation was set as X% = 0, X% = 0 with added sine and X% = 100, have been executed on the model for verification. Figure 7.14 to Figure 7.16 give the results of success model verification with a constant pulse width modulation X% = 0. In this situation, the oil flow to the cylinder (flow3) (Figure 7.14) depends on the flow out of the cylinder (Figure 7.15) and the flow of accumulator A1 (Figure 7.16) (see Appendix Figure B.2). The flow delivered by the accumulator is expected to compensate partly for the flow through the return line. The flow of the accumulator does not compensate completely for the return flow because the capacity of the accumulator is too small. Therefore, the flow to the cylinder was expected to be negative at the beginning of the simulation and to slowly increase to zero. The flow became zero at the moment the pressure in the cylinder is equal to the pressure in the tank.
Figure 7.14 Simulation of flow to cylinder (Steady state test X%=0)

102 Intelligent Belt Conveyor Monitoring and Control
Figure 7.15 Simulation of flow out of cylinder (Steady state test X%=0)
Figure 7.16 Simulation of flow of accumulator (Steady state test X%=0)
As can be seen above, the process values from simulation met the expected trend and this part of the model was verified.
In this research, after three steady state tests, the model was also verified by three dynamic tests. The implementation of model verification based on these test concluded that all parts of the simulation system were working similar to the real system (Appendix C).

System Implementation and Evaluation 103
7.2.4 Matching of software model
Matching of the software model was executed with the purpose of adjusting process parameters in the model so that the simulated outputs approximate process values as accurately as possible over the entire operational range. The matching of process values is to match the simulated data from running the software model with the measured data from the performance of the hydraulic brake system.
The matching of the software model of the hydraulic brake test facility was carried out by steady state matching and dynamic state matching. The steady state matching was based on two steady tests of no braking and fully braking, with an initial angular disc velocity. During the steady states, the SOBO-controller does not have any influence so that matching is much easier than for the dynamic states. In dynamic state matching, the desired braking times defined in the SOBO-controller were set as less than, equal to and longer than the minimum feasible braking time during full braking. In these testing situations, the SOBO-controller behaves in dynamic that controls the braking force based on the pulse width modulation that is determined by measured brake disc velocity.
Figure 7.17 Steady state matching pressure in cylinder, no braking
Figure 7.17 to Figure 7.20 compares the simulation and measurement of several main process values to show the accuracy of model matching. Since the trends of the values generated by the model corresponded quite well with the trends in the measured data, matching could quite easily be done by just looking at the plots and examining the differences between the model and the measured data. More matching results are given in Appendix C. All matching tests for both steady states and dynamic states have shown that the simulation data matched the

104 Intelligent Belt Conveyor Monitoring and Control
measured data sufficiently accurate. The matching results of the software model concluded that the model was able to provide accurate enough simulation for the IBCMC system to distinguish the behaviors of the hydraulic brake system.
Figure 7.18 Steady state matching brake disc velocity, fully braking
Figure 7.19 Dynamic state matching pressure in cylinder, longer braking time

System Implementation and Evaluation 105
Figure 7.20 Dynamic state matching brake disc velocity, longer braking time
7.2.5 Knowledge representation and decision-making
In the IBCMC system, knowledge representation sequentially lists the attributes of relevant events. Such a list is composed of a series of codes based on a defined sequence of monitored BCS events. Each code represents one attribute of an event. A list of attributes forms the situation part of a case in CBR.
M I I S F V H I F F H I H I V
Aq ApAr Aq ApAr Aq ApAr
Event 1 Event 2 Event 3
Figure 7.21 Knowledge representation in IBCMC implementation
Figure 7.21 illustratively shows that a BCS situation, which contains three monitored events, can be represented by a coded description such as MIISFVHIFFHIHIV. Every five codes represent the three attributes of an event. Based on the principle of event classification introduced in Section 4.6, the codes can be intuitively understood. For instance, codes MIISF indicate an event, which is monitored within a MIddle value range, changes following the pattern of Increasingly Slowly Flyup. These codes, namely the S-Code, form the situation part of cases. Further, the representation of complete knowledge (complete cases) will be available when relative maintenance decisions, monitoring discoveries and operational solutions are known.

106 Intelligent Belt Conveyor Monitoring and Control
Belt ConveyorField
Knowledge Base
Reasoning Engine
MonitoredSituation
OperationalDecision
Figure 7.22 Knowledge-based IBCMC
In IBCMC, knowledge of past successful operational actions and maintenance strategies combining with relative operational situations are built up into knowledge base. Data and information, which represent BCS operational situations, are collected from BCS field and further analyzed. Once any abnormality is identified, the monitored situation is assessed by reasoning algorithms combining with the built knowledge base. Then proper operational decisions are recommended or automatically carried out (Figure 7.22).
Figure 7.23 CBR process with simulation-based knowledge
Following the CBR process introduced in Section 5.2, the IBCMC system receives the newly monitored BCS situation as the input. Then the knowledge that matches the new situation is retrieved from knowledge base (the case base) and provides output such as monitoring discoveries, control strategies or operational decisions (Figure 7.23).
Figure 7.24 CBR Output
The implementation of CBR in the IBCMC system gives outputs include a batch of monitored raw data, two group of situation codes for the knowledge representations of both newly

System Implementation and Evaluation 107
monitored situation and retrieved situation, the confidence level of case retrieval, the indication of possible system failure mode and relative operational solution (Figure 7.24). Two groups of situation codes, which are the same as described in Figure 7.21, are the coded description of BCS situation. The indication of retrieved solution originates from the established case base of the IBCMC system. The confidence level denotes the closeness between the new case and the retrieved case.
The implementation results given by Figure 7.24 shows the situation when a dirty brake disc (grease on disc) produces inefficient braking actions during BCS emergency stop because the friction coefficient between brake disc and brake pads is decreased. One direct indicator of this situation is that the currently monitored values of braking force (+/- 42.00 100 N), the parameter of F_brake, are less than the value that required for normal braking (e.g. +/- 55.00 100 N). However, the insufficient braking force itself does not reveal the real cause(s) of such abnormalities for maintenance decision-making, because the braking force can be effected by low pressure in brake cylinder, wrong setting of the pulse width modulation X% of the controller, the abrasion of disc pad, or a dirty brake disc. The causal-effect relationship can not be discovered if the monitored parameters are individually checked. By means of integrating the data and information from other monitored parameters, the IBCMC system overviews the monitored situation and provides the decision-making solutions as output. If the confidence of case retrieval is high enough comparing to a pre-set criterion, the retrieved decision-making solution can be directly applied to the currently monitored situation. In the case of insufficient knowledge or low confidence level for case retrieval, the reasoning process goes to the case adaptation process or directly to inquire domain specialists.
7.3 Implementation of agent-based system
An agent-based system for IBCMC has been built and tested in laboratory environment. Due to the limits of laboratory experiments, it was not possible to test the MAS with sufficient enough parameters which might fully represent the entire BCS. The main goal of the laboratory implementation was to verify the feasibility of applying agent-based architecture to IBCMC. Therefore, experiments were focused on the cooperation and coordination of the MAS among the function layer, the component layer and the system layer.
LaboratoryIBCMC Center
System agent BCS
DAC
Pulley agent
DANDAC
Belt agent
DANDAC
Structure agent
DAN
Figure 7.25 Agent-based system configuration

108 Intelligent Belt Conveyor Monitoring and Control
Figure 7.26 Component agent implementation
Figure 7.27 System agent implementation
As shown in Figure 7.25, three component agents are assigned in the laboratory setting that each agent undertakes the monitoring of a few parameters of one component of the BCS: a pulley agent covers the torque and the speed of the pulley at the tails side of the belt; a belt agent takes care of the speed and misalignment of the belt; and a structure agent monitors the tension of the belt and the forces of both the left and right side of conveyor frame at head pulley. Each component agent coordinates its own function agents that cooperate each other to achieve the functions of DAC and DAN. Three component agents are coordinated by an

System Implementation and Evaluation 109
agent in system level, which makes maintenance and operational decisions by taking an overview of BCS situations.
The MAS was implemented in a Delphi Environment. Appendix D gives the Delphi code for developing the MAS. Agent communication for agent cooperation and agent coordination was achieved by TCP/IP protocol. The results and the outputs of the implementation of the MAS are shown in Figure 7.26 and Figure 7.27. Figure 7.26 presents the execution of belt agent that includes the monitoring results of belt agent (left) and the received broadcasts from system agent (right) within a certain monitoring period. In this situation, the belt agent acquires data from the belt and evaluates the health condition of the belt. Monitored information and DAN results are collected by system agent. The system agent integrates the information from all component agents and broadcasts an overview of the entire BCS to component agents. The information integration enables the IBCMC system to distinguish BCS (potential) faults with respect to the overall BCS instead of individual BCS components. For example, in the second system broadcast shown in Figure 7.26, the system agent concludes that a difference between belt speed and pulley speed may indicate a slippage between the belt and the pulley. However, neither the belt agent nor the pulley agent is able to discover such a (potential) unhealthy BCS condition.
Besides broadcasting discoveries, the system agent integrates and represents the information from component agents to the format of knowledge, which can be used by the CBR process to produce maintenance decisions and operational solutions. Meanwhile, the DAN mechanism of the system coordinator predicts potential system failures and provides the probability of unhealthy BCS conditions. For instance, in Figure 7.27, a high probability of the belt slippage is given and relative operational solutions are suggested, although the monitoring results of component agents do not show any abnormalities in BCS performance.
7.4 Evaluation of the intelligent monitoring and control system
The AI communities have several methods and techniques to evaluate the implementation of KBES. However, since later 1970’s there is considerable agreement that there are no established metrics, techniques or benchmarks for KBES evaluation (Sharma and Conrath, 1993; Cairó and Barreiro, 2000; Wang, 2007). So far, the methods and techniques proposed in literature were mainly focused on their own KBES. Gasching (Gasching et al., 1983), Kumar (Kumar, 1990) and Yang (Yang et al., 2000) have identified their evaluation criteria with respect to the quality of system performance, the interaction between system and user, and system abilities. In other applications, specific aspects have been considered as the criteria to evaluate KBES, such as the system’s reliability, validity and usability (Hollnagel, 1989) and the system’s validation and implementation efficiency (O’Keefe et al., 1987).
It looks that all aspects above can be taken into account when an IBCMC system is to be evaluated. However, as a diagnostic and decision-making system in an industrial area, the evaluation of the IBCMC system is more towards the quality, correctness and reliability of the system. Conrath and Sharma (1992) proposed the evaluation of ES in a quantitative way.

110 Intelligent Belt Conveyor Monitoring and Control
Comparing with other evaluation principles, this approach is convenient because the performance of the IBCMC system can be evaluated by quantitative measurements. Therefore the evaluation of the IBCMC system is carried out by testing whether parts of the system and/or the entire system is good under the correctness and reliability of the results generated by the system.
Quantitative evaluation is the assessment that answers the question how much the IBCMC system does correctly. The aim is to express the quality of an intelligent system in terms of a numeric “measure of merit” known as a metric (Sharma and Conrath, 1993). Therefore, the evaluation should show that the intelligent system matches accurately enough the behaviour of BCS under both healthy operating conditions and the conditions after introducing failure modes to BCS operations and performances. Afterwards, the results and outputs derived from the intelligent system are compared with the measurements from BCS systems or test facilities to show the correctness, reliability and ability of the intelligent system.
In the framework of this research, the evaluation based on healthy BCS conditions is the verification process that shows the ability of the IBCMC system to correctly represent normal BCS physical processes. This part of verification was implemented in the test facility of hydraulic brake system. Experimental results of the implementation presented correct outputs for 100% of the measured data for healthy BCS conditions. It means that the IBCMC system is able to recognize experimental healthy BCS conditions effectively without distinguishing any abnormality.
On the other hand, the IBCMC system has also been tested and evaluated by introducing failure modes into the operations of the test facility. This evaluation matches the process values derived from the intelligent reasoning and from the measurements of the test facility. To achieve the evaluation under unhealthy BCS conditions, a list of failure modes needs to be selected. The failure modes, that both can be carried out by the IBCMC system and measured form BCS field, are the most interesting because the data collected from the intelligent system and test fields can be compared. During the experiments of system evaluation, the operational conditions of the measured data offered to IBCMC are known which means that the failure modes are known. Therefore, it is easy to verify whether the retrieved decision-making solutions given as the output by the intelligent system correspond with the failure modes as introduced and measured from BCS test facilities.
Compared to the evaluation under healthy BCS conditions, the evaluation when introducing failure modes looks more important because it denotes IBCMC’s ability and accuracy in knowledge retrieval, analysis, reasoning and decision-making. In total six failure modes were selected and introduced into the implementation of the IBCMC system (Table 7-3), which include the healthy operational condition of the test facility. These failure modes can both be implemented in the simulation and the test facility.
To implement the selected failure modes in the test facility, 8 sensors from the 20 sensors listed in Table 7-2 were used to measure the failure cause indicators. The selected sensors

System Implementation and Evaluation 111
were used to measure %X , 2P , 3P , brakeF , pvv , discT , power supply and the air gap between
disc pads and the brake disc.
Table 7-3 Introduced failure modes to implement IBCMC
Code of failure mode Failure mode
FM 0.0 Healthy condition, no failure mode introduced
FM 1.1 Oil, paint or grease on brake disc or pads
FM 1.2 Tachometer fails
FM 1.3 Control pressure too low
FM 2.6 Throttles or orifice, the valve 20.1, dirty
FM 3.1 SOBO controller fails
For each failure mode, the IBCMC system was tested and evaluated by 3 measurements by changing the status of the failure mode indicators in the test facility. Since the outputs from measurement and simulation and the decision-making results of the IBCMC system were very similar during the 3 tests for each failure mode, more tests were decided not to be carried out.
To evaluate the implementation of the IBCMC system, Seeded Error Theory (Mills, 1972) can be applied. The effectiveness of the IBCMC system can be defined based on the accuracy of discovering all introduced failure modes:
number of failure modes discoveredeffectiveness
number of failure modes introduced (7.2)
The IBCMC system was evaluated based on the summation of its outputs of 3 tests for each introduce failure mode. All outputs of case retrieval and the retrieved decision-making solutions had the combination with their confidence levels higher than 0.9. Such a high confidence level shows that sufficient knowledge derived from simulation has been built in the knowledge base of the IBCMC system and the CBR process is accurate enough.
Figure 7.28 and Figure 7.29 present two typical evaluations of the IBCMC system within a BCS brake operation based on the blocks of ten seconds sampling of braking time, offering the measurements during introducing failure modes of “control pressure low” and “SOBO-controller fails”.
In Figure 7.28, during the first 10 s, 90% of the cases retrieved by the IBCMC system were incorrect. Of the cases retrieved, 50% were healthy cases and 40% were cases indicating failure mode grease on disc. It is known that during the first 6 seconds, the retrieved cases indicated grease on disc. Between 10 and 20 s, 60% of the retrieved cases gave the incorrect indication healthy and 40% of the retrieved cases was correct. After 20s, the system gives a 100% correct output.

112 Intelligent Belt Conveyor Monitoring and Control
In Figure 7.29, during the first 10 s, 60% of the retrieved cases were cases that indicated failure mode grease on disc. The other 40% cases retrieved were correct. After 10s, the IBCMC system gave 100% correct outputs.
Figure 7.28 Evaluation result example 1: control pressure low
Figure 7.29 Evaluation result example 2: failed controller

System Implementation and Evaluation 113
Results above show that the healthy situation and the failure mode of grease on disc were distinguished from the real failure modes at the beginning stage of the braking process within the 78.32 s BCS braking period. The reason is that the brake pads did not fully clamp down on the brake disc yet at the beginning of braking. However, in both cases above, the final analytical results indicated the introduced failures correctly. After two blocks of ten seconds sampling, it can be concluded that the IBCMC system provides 100% correct reasoning results.
After offline analysis of the results of all tests, it was found that two reasoning caused the incorrect case retrieval of the IBCMC system. One reason is the setting of fuzzy categories in the stage of case representation. Currently in the IBCMC system the fuzzy categorization was only based on 5 fuzzy levels. At the beginning of a braking, process values were mostly fell into the same fuzzy category so that the detailed changes of these values could not be distinguished. Another reason is the database setting and the structure of the case base, which give priorities to retrieve cases for different introduced failure modes. After optimizing the fuzzy categorization in case representation and updating the retrieval priorities, the IBCMC system was able to provide 98% correct outputs for all failure modes in all periods. Detailed results of offline analyses and system evaluation based on all failure modes are given in Appendix C.
Figure 7.30 Summary of system evaluation results
After completing the tests of introducing 6 failure modes to the test facility, the results of implementing the IBCMC system provided 100% correct outputs with respect to its analytical abilities. It means that the final analytical results of the IBCMC system are completely correct and the IBCMC system has the ability to effectively distinguish all introduced failure modes, although some disturbances appeared. Based on the experimental results of all failure modes, the reasoning accuracy of the IBCMC system reached up to 98% based on all samples of introduced failure modes. The very small inaccuracy was mainly caused by monitoring noises at the beginning stage of the braking process, which has been discussed based on Figure 7.28 and Figure 7.29. The overall quantitative evaluation of the IBCMC system is given in evaluation Figure 7.30. In summary, the implementation results and the outputs of the

114 Intelligent Belt Conveyor Monitoring and Control
IBCMC system are accurate to be used in the monitoring and operational control in the industry using belt conveyors.
Above, the implementation and evaluation of the IBCMC system were achieved based on the measurements of 8 sensors in the monitoring system of the test facility. Compared to the originally defined 20 sensors given in Table 7-2, the complexity of the monitoring system has been considerably reduced in the premise of ensuring accurate and effective monitoring results and decision-making. Combing with the implementation of the IBCMC system in an agent-based architecture, it proved, as was one of the main goals of this research project, that the integration of the data and information from separate monitoring systems and individual monitored aspects significantly reduces the complexity of the overall monitoring system and enhances the payoff of developing the monitoring system. The integration of partial knowledge about a BCS enables the intelligent system to understand the overall BCS condition accurately, completely and consistently.

115
8 Conclusions and Recommendations
This research presents the possibilities to improve BCS performance by means of integrating the information derived from individual BCM systems into an overall maintenance and operational control decision-making system. To lessen human involvement in BCM and to prevent operational problems due to the lack of experience in the maintenance personnel, the applications of AI technologies contribute intelligent abilities to the decision-making system. The term of intelligence in this research is defined as the ability to integrate and interpret information gathered through sensors in BCS. Further intelligence indicates the ability to make maintenance and operational decisions based on the overall status of BCS. This research concerns the areas of BCM and AI. The output of this research project is not the development of a complete intelligent system that covers the monitoring and control of all components of BCS, but to demonstrate the effectiveness of an IBCMC system that optimizes the process of decision-making with less or without human efforts. This system contains three fundamentally automated processes: data acquisition, data analysis and decision-making. Based on the functionalities of these processes, the conclusions of this research are presented in Section 8.1. Section 8.2 gives the recommendations for future research.
8.1 Conclusions
This research project presents an IBCMC system, which integrates the information gathered from traditional individual BCM systems to automate and optimize the process of maintenance and operational control decision-making. This research reflects the results of the study on the design of an IBCMC system. The results of system implementation showed that the developed IBCMC system is able to automatically
acquire data from BCS components (Chapter 2);
identify system abnormalities and discover potential cause(s) (Section 4.3);
interpret a monitored situation and assess the system health condition and operational status (Section 4.4);
acquire experience and knowledge of improving BCS performance (Chapter 4.4);

116 Intelligent Belt Conveyor Monitoring and Control
retrieve stored experience and knowledge for decision-making on maintenance and operational control strategies (Chapter 5);
integrate individual monitoring systems of BCS components so that maintenance and operational control decisions can be made in a system level (Chapter 6).
A novel monitoring system
A novel ECD system was developed for this research project. The ECD system employs magnets that embedded into belt carcass to generate magnetic data to expose the information of belt conveyor when magnets pass through outside sensors. The ECD system is able to detect and monitor most parameters relevant to the conveyor belt. Compared to traditional BCM systems, the advantages of this ECD system include the ability of monitoring more BCS aspects, non-contact measurement and NDT, no signal stimulation and immunity to the harsh industrial environment. The implementation of the ECD approach showed that the data and information collected by the ECD system can be easily represented and comprehended by the IBCMC system.
Interpretation and assessment of system condition
AI technologies have been employed in the IBCMC system. This research concluded the feasibility of introducing various AI technologies into the system of monitoring and controlling belt conveyor. Results of system implementation have shown that fuzzy logic enables the IBCMC system to interpret monitored data and to perceive a symptom as a manifestation of the change in monitored parameters. Several typical fuzzy sets have been defined to successfully identify and evaluate the conditions of BCM aspects (Section 4.3.1). Fuzzy logic has also been applied to represent gathered data and information into a format of knowledge. The algorithm of fuzzy knowledge representation is able to represent how a monitored BCS parameter varies based on three fuzzified attributes (Section 4.4).
A causal modelling method by using fuzzy Bayesian inference was developed during this research that proved the ability of discovering the cause-effect relationships in a probabilistic way, when faults or abnormalities happened in BCS operations. Fuzzy logic was further applied to simplify the estimation of likelihood density function in Bayesian inference (Section 4.3.2). As well, the performance of the IBCMC system indicates that Bayesian method is a sound tool to evaluate the efficiency and correctness of knowledge retrieval in the decision-making process (Section 5.1.2).
Simulation-based knowledge acquisition
One significant development in this research project was the approach of simulation-based knowledge acquisition. Based on this approach the IBCMC system acquires knowledge from a software model that generates situations that can be monitored in real BCS systems or test facilities. These situations can be set in the model and relative knowledge can be acquired from the simulation of the real system. In the development of this approach, parts of a BCS component and their working principles can be extensively described. Based on these

Conclusions and Recommendations 117
descriptions, a mathematical model can be developed. Each physical part of the BCS component can be modelled as a separated subsystem in the software model, which results in a model with a modular structure. This makes it possible to add and adjust components within the same main structure in the future. From the results of implementing the IBCMC system, it can be concluded that this research has proven the possibility to acquire sufficient knowledge by using a software model of the BCS. Based on the knowledge derived from the simulation of the software model, accurate enough system diagnosis and adequate maintenance and operational decisions can be gained (Section 7.2).
The simulation-based knowledge acquisition approach was shown to be one solution for the bottleneck problem of knowledge acquisition in developing the IBCMC system. It significantly simplified the knowledge acquisition process and shortened the development time of building up the knowledge bases for IBCMC with high efficiency and accuracy.
System implementation
The IBCMC system was implemented and evaluated using laboratory experiments. Little additional domain knowledge was involved in the evaluation process. Most of system functioning results, intelligent outputs, the ability and efficiency of system intelligence have been proved correct and sufficient. System evaluation based on quantitative studies showed that the results and outputs of the IBCMC system were correct enough to be used for the monitoring and operational control in the industry using belt conveyors (Section 7.4).
One achievement of this research was the determination of the appropriate level of system complexity with respect to the potential payoff of the system, which has been discussed in Section 3.1.2. The IBCMC system was implemented in a test facility of a hydraulic braking system, based on two levels of system complexities. In the first level, the system monitored 20 parameters that were distributed in the test facilities. In the second level, the IBCMC system took 8 key parameters from the 20 into consideration. Implementation results showed that the decision-making in both system complexity levels were accurate and effective. It can be concluded that individual BCM systems and monitored aspects can be integrated into the intelligent system to monitor the overall BCS status. The integration considerably reduced the complexity and enhanced the potential payoff of the developed IBCMC system.
This research showed the feasibility of applying agent-based technologies to reduce the complexity of the IBCMC system by means of integrating individual monitoring systems. The system complexity in IBCMC lays in both the physical scale of BCS and the acquisition of data and information from BCS. The modular structure of the IBCMC system was set up based on the monitored BCS components. The autonomy ability of agents enables BCS components to be monitored and controlled by the local intelligence of agents. The implementation of an agent-based IBCMC system in laboratory environment has shown successful single agent functioning and multiple agents’ cooperation. The application of agent technologies in IBCMC was approved as feasible and capable.

118 Intelligent Belt Conveyor Monitoring and Control
8.2 Recommendations
AI technologies are feasible to be introduced and applied to IBCMC. AI algorithms that were developed in this research project still have some limitations. For instance, defined fuzzy membership functions are still not yet able to represent all BCS events; more parameter should be considered in Bayesian casual-effect modelling; time consumption is still a drawback when running the decision-making process online; etc. The optimization of AI algorithms is recommended in future researches.
Simulation-based knowledge acquisition approach can only be applied for a specific BCS. Once the BCS changes, the model and simulation need to be changed and adjusted as well. At the current stage of this research project, no generic simulation model has been developed. It might be a recommendation for a future research topic.
To this date, no other successful intelligent monitoring systems have been built in the field of belt conveyors. Therefore, the IBCMC system could hardly be validated and evaluated because there are no standards and guidelines available in this field. Currently, the performance of the IBCMC system could only be estimated and evaluated by comparing a set of system’s conclusions to field measurements and laboratory experiments, and sometimes by human judgement that could be erroneous. It is recommended that the standards and guidelines of evaluating and validating such an intelligent system have to be developed in the future.
The development of intelligent monitoring and control in the field of belt conveyors is still at an early stage. The realization of a fully automated, robust, trustworthy and adaptive IBCMC system still relies on future research and practice. Therefore, the development of the IBCMC system may be enable belt conveyor industry to set an industry standard for the future, towards the automation of system monitoring, intelligent operational decision-making and automated maintenance activities carried out by robots.

119
Appendix A: Properties of Magnets and Sensor in ECD System
This appendix presents the properties of the magnets and the Hall Effect sensor used in the Embedded Conductive Detection (ECD) system for monitoring conveyor belts.
A. 1. The magnets
A.1.1 Shape and size of magnets
Permanent magnets can be made in almost any shape imaginable. In order to embed magnets into the carcass of a conveyor belt without damaging the surface and internal rubber material, small and thin round magnet plates are required. The small disk NIB magnet, about 1.2cm diameter and 0.3cm thick, the very small disk NIB magnet about 0.5cm diameter and 0.1cm thick and the bigger disk NIB magnet about 2.5cm diameter and 0.6cm thick can fit the requirement. Two types of plate magnets have been tested in the ECD system (Figure A. 1 and Figure A. 2).
Figure A. 1 Magnet type I

120 Intelligent Belt Conveyor Monitoring and Control
Magnet type I has diameter of 8mm and thickness of 4mm. Magnet type II has diameter of 21mm and thickness of 27mm. Although magnets of type II are not proper to be used in ECD system due to its big size, the purpose of selecting this type of magnet is to test the property of the magnets and sensor.
Figure A. 2: Magnet type II
The magnetic field strength of a magnet depends not only on the material of the magnet but also on its size. In order to enable picking up a strong enough signal from sensors, a magnet plate with a diameter around 20mm and a thickness less than 4mm can be used. Experiments show that a distance of 30mm between the sensor and a ceramic magnet of such a size is suitable to derive a proper magnetic signal. If stronger magnets are selected the distance at which a measurement can be performed is larger.
A.1.2 Configuration of magnets
The magnet configuration is as important as its shape to receive magnetic signal from sensors. For example, a magnet can be magnetized where N (North pole) is on one edge and S (South pole) on another (Figure A. 3), or N is on the top side and S is on the bottom side, or N is on the outside and S is on the inside (Figure A. 4), or N and S are on both edges with separation of soft iron core (Figure A. 5).
Theoretically the magnetic field of the magnet shown in Figure A. 5 is stronger than the one shown in Figure A. 3; and the magnetic field of the magnet shown in Figure A. 5 is also stronger than the one shown in Figure A. 4. Therefore, the soft iron core single plate magnet is proposed for application in an ECD system.
Figure A. 3: Single plate magnet

Appendix A: Properties of Magnets and Sensor in ECD System 121
Figure A. 4: Surrounding magnet.
Figure A. 5: Single plate magnet with soft iron core.
A.1.3 Types of magnets
There are three main types of magnets:
Permanent magnets
Temporary magnets
Electromagnets
Permanent magnets are the most common magnets. They are permanent in the sense that once they are magnetized, they retain a level of magnetism. Different types of permanent magnets have different characteristics or properties with respect to how easily they can be demagnetized, how strong the magnetic signal can be, how the signal strength varies with temperature. Temporary magnets are those that act like a permanent magnet when they are within a strong magnetic field. They lose their magnetism when the magnetic field disappears. An electromagnet is a tightly wound helical coil of wire, usually with an iron core, which acts as a permanent magnet when current is flowing in the wire.
Both temporary magnets and electromagnets require additional stimulation to remain their magnetism. As a passive non-contact monitoring system, in order to reach the basic goals of maintenance-free and long life time (e.g. 20 years), permanent magnets are selected.
A.1.4 Materials of magnets
There are four classes of permanent magnet materials:
Neodymium Iron Boron (NdFeB or NIB)
Samarium Cobalt (SmCo)
Alnico
Ceramic or Ferrite

122 Intelligent Belt Conveyor Monitoring and Control
Table A. 1 gives the properties these four classes of magnets. Br is the maximum flux the magnet is able to produce in Gauss. Hc is the coercive magnetic field strength in Oersted, which indicates how easy the magnet becomes demagnetized by an external field. Bhmax is the term of overall energy density. The higher the number, the more powerful the magnet is.
Table A. 1 Special characteristics of magnets
Considering the characteristics listed in Table A. 1, NdFeB permanent magnets are used to ensure that the magnetic signal within DAC process is strong enough and that the distance between the belt surface and the sensors is as far as possible. Table A. 2 gives the changes of
magnetic flux density under the temperature variance from 0 Co to 100 Co .
Table A. 2 Changes of magnetic flux density with temperature
Magnets PropertiesBig size magent: Diameter 21mm, M aterial Ceramic
Small size magnet: Diameter 8mm, Thickness 4mm, M aterial NIB
00.20.40.60.8
11.21.41.61.8
22.22.42.62.8
33.23.43.63.8
44.24.44.64.8
55.2
0 5 10 15 20 25 30 35 40 45 50
Distance between magnet and sensor (mm)
Ou
tpu
t (V
)
Small N Pole Small S Pole Big N Pole Big S Pole
Figure A. 6: Magnet properties (vertical distance)
Material Br Hc Bhmax
NdFeB 12800 12300 40
SmCo 10500 9200 26
Alnico 12500 640 5.5
Ceramic of Ferrite 3900 3200 3.5
Materials Flux density at 100 Co compared to 0 Co
NdFeB About 89%
SmCo About 96%
Alnico About 98%
Ceramic About 83%

Appendix A: Properties of Magnets and Sensor in ECD System 123
From Table A. 2 it can be seen that ambient temperature does not significantly influence the flux density in a belt conveyor field ambience. Therefore magnetic characteristics related to temperature are not concerned here.
Figure A. 6 and A. 7 show the experiments results of the relationships between the output of magnetic sensor and the properties of magnets.
Magnets PropertiesBig size magnet: 21mm Diameter
Small size magnet: 8mm Diameter, Thickness 4mmDistance between magnet and sensor: 5mm
00.20.40.60.8
11.21.41.61.8
22.22.42.62.8
33.23.43.63.8
44.24.44.64.8
5
-90 -80 -70 -60 -50 -40 -30 -20 -10 0 10 20 30 40 50 60 70 80 90
Position (mm)
Ou
tpu
t (V
)
Diam_21mm Diam_8mm
Figure A. 7: Magnet properties (horizontal distance)
In figures above, it can be seen that the effective measuring ranges of both selected magnets
exceed 25mm for vertical movement and 15mm for horizontal movement. These properties
are proper to build the ECD system.
Figure A. 8: 2SA-10 integrated 2-axis Hall sensor

124 Intelligent Belt Conveyor Monitoring and Control
A.2 Hall Effect Sensor
The integrated 2-axis Hall sensor, produced by SENTRON B.V. Switzerland, was selected as the main sensor in the ECD system (Figure A. 8).
This magnetic sensor has its own advantages of very high sensitivity, low quiescent current, very low hysteresis, 2-D position sensing, very small dimension, and low cost. Table A. 3 gives the typical characteristics of this sensor. Flux density, measured in Gauss, is the most important specification to be considered when selecting the magnetic field sensors and magnetic switches. The number of measurement axes and the direction of the magnetic field (including bipolar measurement) are also important. The accuracy of sensor is represented as a percentage of full scale. Resolution represents the smallest change in reading the sensor can detect. Sensitivity (V/Gauss) and bandwidth (kHz) are important factors to consider as well.
Table A. 3 Typical characteristics of 2SA-10 Hall sensor
Parameter Characteristic
Magnet sensitivity Min 40v/T, Typ 50v/T, Max 60v/T
Suplly voltage 0~6v
Max. output voltage 95% Vsupply
Offset voltage -10mv ~10mv
Max. induction > 1000mT
Operating induction > 80mT
Full scale magnetic field range -45mT ~ 45mT
Linear magnetic field range -40mT ~ 40mT
Sensitivity temperature drift ±0.05% / °C

125
Appendix B: Working Principle of Hydraulic Brake System
A thorough understanding of the braking process taking place in the hydraulic brake system is essential for measuring these processes and building a software model to simulate these processes. The working principles of the hydraulic brake system is presented in this appendix per components of disc brake, hydraulic power unit and the SOBO-controller which is a Soft Braking Option control system patented by Svendborg Brakes Ltd (Christensen, 2004).
B.1 Working principle of disc brake
A schematic cross section of the hydraulic brake is shown in Figure B. 1.
Figure B. 1: Schematic cross section of the brake with brake disc

126 Intelligent Belt Conveyor Monitoring and Control
The mounting bracket of the brake is mounted on a solid foundation, such that the brake disc rotates in between the two brake pads. The pad retraction springs pull the brake pads against the piston ends and brake pad holders. The spring set in the piston is retracted and pushes the piston with the brake pad outwards. The force exercised on the piston by the spring set, is counteracted with a force executed on the same piston by the oil in the oil chamber. The sum of these two forces determines the force with which the brake pads are applied against the brake disc. The oil pressure in the oil chamber is determined by the hydraulic power unit. First the hydraulic pressure at the pressure ports is assumed to be smaller than the force required for compressing the springs. In this situation the springs will push the piston outwards, which in its turn will push the brake pads against the brake disc. If the oil pressure at the pressure ports is then increased until the oil acts with a higher force on the piston than the springs do, the piston with the brake pads is pushed back from the brake disc and therefore braking is stopped.
The size of the air gap between each brake pad and the brake disc, in the situation that the brake pads are retracted, must be adjusted to 1 mm at installation and is never allowed to exceed 3 mm. When the air gap is increasing due to wear of the brake pads, it can be adjusted by screwing the adjusting screw into the yoke. By doing so, the space for the springs is reduced and the springs are compressed more. Therefore, they will expand more and push out the piston further when oil pressure is reduced. The brake pads need to be replaced, when they have worn to such an extent that only the minimum of 1 mm brake pad material remains.
B.2 Working principle of hydraulic power unit
The working principle of the hydraulic power unit can be described based on the hydraulic diagram as shown in Figure B. 2. In this figure, symbols of the components important for the working principle of the hydraulic power unit are explained.
The hydraulic power unit is connected to the brake and the SOBO-controller is connected to the solenoid directional valves. When the hydraulic brake system is not in a braking sequence, the solenoid directional valves 20 and 21 are either both energized or not energized by the SOBO-controller, which results in two different operational states. In the situation that both valves are energized, oil flows through valve 20 into the oil chamber of the hydraulic disc brake, as indicated by the solid grey arrows in Figure B. 2. In the other situation both valves are not energized, which means that valve 20 is closed and oil flows from the brake cylinder through valve 21 into the tank, as indicated by the dashed grey arrows in Figure B. 2.
During a braking sequence, the opening and closing of the directional solenoid valves is determined by the SOBO-controller. The active hardware parts during braking are:
Main accumulator A1;
Small accumulator A2;
Directional valves 20, 21, 22 and 23;

Appendix B: Working Principle of Hydraulic Brake System 127
Figure B. 2: Symbol List of hydraulic diagram

128 Intelligent Belt Conveyor Monitoring and Control
Adjustable throttle valves 20.1 and 21.1, and
Back pressure valve 22.1.
The main accumulator serves as a buffer in case of grid failure. At the beginning of SOBO-braking directional valve 22 is energized in open position and backpressure valve 22.1 ensures that the pressure is dumped to the pressure level at which the forces of the spring and the oil exercised on the piston are equal, so there is constant contact between brake pads and disc. Backpressure valve 22.1 will immediately close when the system pressure equals the balance pressure. The reduction in hydraulic pressure will not be instant when the brake is activated, as the SOBO accumulator A2 and throttle valve 21.1 will try to keep the pressure up by “delaying” the flow of oil to the tank reservoir.
During the SOBO-braking, directional valve 22 is connected to power, so that the valve is energized in open position and backpressure valve 22.1 ensures constant contact between brake pads and the disc. During the braking sequence, valves 20 and 21 are switched on and off to regulate the flow in and out of the brake cylinder through the throttles, to control the pressure in the brake. The small accumulator makes the controlled oil volume larger, thus increasing the oil flow response time and acting as a dampening device on the brake line. To release the brake after the braking cycle, the hydraulic system will operate in the opposite way. The brake is “lifted” in a “soft” way because throttle valve 20.1 and the small accumulator delay the oil flow back to the brake cylinders. The pressure will increase, suppressing the brake springs and ultimately lifting the brakes.
B.3. Working principle of SOBO-controller
The SOBO-controller regulates the deceleration of the BCS during a braking sequence. Based on the brake disc velocity, the controller determines the ratio between energizing and de-energizing the solenoid directional valves. This results in more or less braking force. The SOBO controller ensures a controlled and “soft” braking process, resulting in less wear and stress on the components of the BCS. The working principle of the SOBO-controller is based on measuring the angular velocity of the brake disc and controlling the braking force based on this measurement. The SOBO-controller contains a computer program. In this program, the user gives in a ramp, which is named as the feasible braking ramp of the disc, which defines the desired angular velocity as a function of time. During the braking sequence, if the actual angular velocity is above the ramp, the pressure in the brake is relieved over the throttle by de-energizing valves 20 and 21, respectively shutting them off, resulting in an increased braking force and vice versa if the actual angular velocity is below the ramp. During the SOBO braking process, the braking force is determined by closing and opening the solenoid valves in a certain ratio. This control principle is realized by a system based on an off/on pulse width modulation on the two solenoid valves. Figure B. 3 gives one application of the pulse width modulation. The cycle time has a present value that typically amounts to 200 ms.

Appendix B: Working Principle of Hydraulic Brake System 129
By changing the ratio between braking off/on respectively energizing/de-energizing of solenoid valves 20 and 21, the braking force can be regulated.
Considering the cycle time of a high quality solenoid valve, which amounts to 35 to 60 ms, and the time required to process data and calculate setting, the regulation interval of the controller will be approximately 50 ms. The neutral duty cycle of the SOBO-controller was set to 50-55%. A duty cycle of 55% means that the valve modulation is 55/45% when the actual angular velocity lies exactly on the desired deceleration ramp.
200 ms
Example:Reg.Int. = 50 msPWM Cycle = 200 ms
200 ms 200 ms
PWM Cycle
Regulation Interval
50 ms
30/70 35/65 45/55
30
70
35/65
40/60
35
65
40/60 40/60 50/55
55/45
60/40
60/40
55
45
Calculated modulation
Figure B. 3: Pulse width modulation
Figure B. 4: Desired rpm ramp and actual RPM curve based on deviation bands

130 Intelligent Belt Conveyor Monitoring and Control
The SOBO-controller gives users the opportunity to define the desired ramp, by entering in the simplest case an angular velocity-value at starting time and entering a time at which it should be zero. After that, one can define a symmetrical deviation band around the desired angular velocity-ramp, as a percentage of the exact value at every point of time. The width of the deviation band affects the regulation brake torque. The regulation process is illustrated in Figure B. 4.
When the actual angular velocity curve touches the upper boundary of the deviation band, the controller will give a valve modulation of 0/100% and the brake will fully brake. When the actual angular velocity-curve crosses the desired ramp, the control will ideally give a modulation signal corresponding with the defined neutral duty cycle so the braking force will not change. And when the actual angular velocity-curve touches the lower boundary of the deviation band, the controller will give a signal of 100/0% and the brake pads will not give any braking force, but still they will just touch the disc in balance position as long as the braking sequence is in progress.

131
Appendix C: Software Model and Implementation
This appendix includes the introduction of the software model for the hydraulic brake system, the implementation of the model in Simulink environment, the results of model verification and matching, and the discussions of the decision-making outputs of the IBCMC system, which are based on the knowledge derived from simulation.
C.1 Software model and Simulink implementation
The parts of the hydraulic brake system that need to be included in the software model are the hydraulic disc brake, hydraulic power unit, the SOBO-controller and the brake disc. For the aim of modularity of the model, which results in a better overview and maintainability of the software model, the four physical parts of the system will each form a separate subsystem. A scheme of these four subsystems, of which the model consists, is shown in Figure C. 1.
Figure C. 1: Concept of the hydraulic brake system to be modelled
Considering the different physical pasts of the brake system as black boxes, the relations and causalities of different subsystems can be modelled in Simulink as shown in Figure C. 2. Each of the subsystems will be broken up into different parts in its turn until a sufficient level of details is reached.
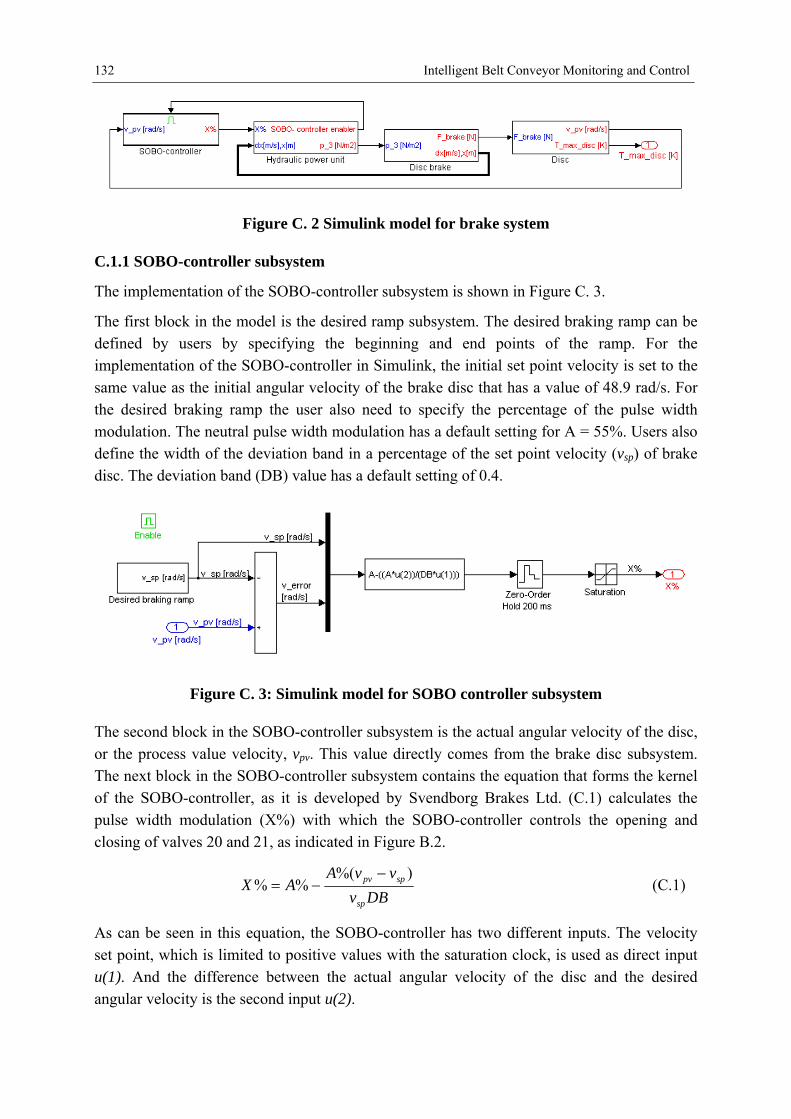
132 Intelligent Belt Conveyor Monitoring and Control
Figure C. 2 Simulink model for brake system
C.1.1 SOBO-controller subsystem
The implementation of the SOBO-controller subsystem is shown in Figure C. 3.
The first block in the model is the desired ramp subsystem. The desired braking ramp can be defined by users by specifying the beginning and end points of the ramp. For the implementation of the SOBO-controller in Simulink, the initial set point velocity is set to the same value as the initial angular velocity of the brake disc that has a value of 48.9 rad/s. For the desired braking ramp the user also need to specify the percentage of the pulse width modulation. The neutral pulse width modulation has a default setting for A = 55%. Users also define the width of the deviation band in a percentage of the set point velocity (vsp) of brake disc. The deviation band (DB) value has a default setting of 0.4.
Figure C. 3: Simulink model for SOBO controller subsystem
The second block in the SOBO-controller subsystem is the actual angular velocity of the disc, or the process value velocity, vpv. This value directly comes from the brake disc subsystem. The next block in the SOBO-controller subsystem contains the equation that forms the kernel of the SOBO-controller, as it is developed by Svendborg Brakes Ltd. (C.1) calculates the pulse width modulation (X%) with which the SOBO-controller controls the opening and closing of valves 20 and 21, as indicated in Figure B.2.
DBv
vvAAX
sp
sppv )%(%%
(C.1)
As can be seen in this equation, the SOBO-controller has two different inputs. The velocity set point, which is limited to positive values with the saturation clock, is used as direct input u(1). And the difference between the actual angular velocity of the disc and the desired angular velocity is the second input u(2).

Appendix C: Software Model and Implementation 133
C.1.2 Hydraulic power unit subsystem
Figure C. 4: Scheme of hydraulic power unit subsystem
Based on the working principle of the hydraulic power unit as was described Appendix B, it was decided that the software model only simulates normal braking sequences and for example no emergency braking. This decision led to a simplification, because for this purpose it will be sufficient to assume that a brake command is given at the moment the simulation is started. Before a braking command is given, the pressure in the cylinder is 8.5 MPa, which means that the pads are retracted from the disc. At the moment the braking command is given, valves 20, 21 and backpressure valve 22 are completely energized. This means that oil flows from the tank into the brake cylinder through valves 20 and 20.1 and that oil flows out of the brake cylinder into the tank through valve 22 and backpressure valve 22.1. Since more oil flows through valve 22.1 than through valve 20.1, the pressure in the cylinder drops to 4.4 MPa which equals the set pressure on the backpressure valve. During this initial pressure drop, the pads move towards the disc, until they are just touching the disc but no friction occurs between pads and disc. The brake pressure then equals the set pressure of the backpressure valve, which is set to 4.4 MPa. This pressure of 4.4 MPa is called the balancing pressure, because in this situation the force executed on the piston by the oil equals the force

134 Intelligent Belt Conveyor Monitoring and Control
executed on the piston by the spring in the cylinder. With this assumption, the emergency line containing valves 23 and 23.1 does not have to be included in the software model. It will be sufficient to only model the delivery line that contains valves 20 and 20.1, the return line that contains valves 21 and 21.1 and the backpressure line with valve 22. Figure C. 4 presents a scheme, including the parts of the hydraulic power unit subsystem mentioned in the discussion above.
The development of the hydraulic power unit subsystem and its implementation in Simulink started with the modeling of supply line, including the hydraulic part of the cylinder. Then the modeling of supply line was followed by the subsystems of return line, the accumulators and the backpressure line. After these models and their Simulink implementations for the separate subsystems have been developed, the Simulink models were combined and together formed the complete Simulink model for the hydraulic power unit (Figure C. 5).
Figure C. 5: Simulink model of the hydraulic power unit
C.1.3 Disc brake subsystem
The model of the hydraulic brake subsystem was split up into two different subsystems as shown in Figure C. 6.
Figure C. 6: Simulink scheme of hydraulic disc brake

Appendix C: Software Model and Implementation 135
The first subsystem contains the implementation of the model for the yoke and cylinder and the second subsystem contains the implementation of the model of the brake pad. Figure C. 7 gives a schematic drawing of the complete disc brake subsystem.
Figure C. 7: Hydraulic brake subsystem scheme
C.1.4 Disc subsystem
The Simulink model for the disc consists of two different subsystems, namely the dynamic disc and the thermodynamic disc, as illustrated in Figure C. 8.
Figure C. 8: Simulation model for disc subsystem
The dynamic disc subsystem is part of the model loop that simulates the braking sequence and it contains the simulation of the disc velocity process value. To close the braking sequence loop, the disc model needs to convert the braking force in a velocity. The braking force acting on the disc results in a braking torque at the same time the braking force causes the disc to decelerate. This deceleration acting on the mass moment of inertia of the disc results in a torque that has the same magnitude as the braking torque.
The thermodynamic disc subsystem is a side branch that contains the simulation of the maximum disc temperature. Due to the friction between brake pad and brake disc, temperature rises. Since braking only occurs for short periods, little heat will be dissipated through convection. The brake disk absorbs much more heat than the pads, firstly because the contact surface of the brake disk is much bigger (non-stationary contact) and also because it is a better conductor for heat than the pads. Therefore the assumption that all heat goes into disc is justifiable and adopted.
C.2 Verification of software model
Three steady state tests, X%=0, X%=0 added sine and X%=100 has been executed on the model to verify whether its results follow the expected trend and lie within the expected

136 Intelligent Belt Conveyor Monitoring and Control
range. After steady state tests, three dynamic tests have been executed. The first was based on a desired braking ramp that lies beneath the maximum feasible ramp for fully braking. The second was based on a desired braking ramp that equals the maximum feasible ramp. The third was based on a desired braking ramp that lies above the maximum feasible braking ramp of the disc.
Figure C. 9 SOBO modulation X%=0 with added sine
Figure C. 10 Braking force X%=0 with added sine

Appendix C: Software Model and Implementation 137
C.2.1 Model verification steady state test: X%=0 with added sine
By adding the sine to the pulse width modulation (Figure C. 9) on solenoid directional valves 20 and 21, it can be seen whether the signal is given through without delays or unexpected distortions.
Because the braking force is expected to apply later, the wave signal of braking force is expected to be delay and not have an ideal sine shape (Figure C. 10).
Figure C. 11 Cylinder pressure X%=100
Figure C. 12 Cylinder flow X%=100

138 Intelligent Belt Conveyor Monitoring and Control
Figure C. 13 Force executed by oil X%=100
Figure C. 14 Spring force X%=100
C.2.2 Model verification steady state test: X%=100
An input of X%=100 on the solenoid directional valves 20 and 21 means that they are continuously energized and the disc is fully braked. As a consequence, valve 20 in the supply line stays open all the time and valve 21 in the return line stays continuously close.

Appendix C: Software Model and Implementation 139
In this situation it is expected that the pressure in the cylinder will increase to the maximum cylinder pressure which equals the pressure delivered by the pump (Figure C. 11). The
cylinder flow ( 3flow ) is expected to be positive at the beginning of the simulation and to
slowly decrease to zero within the same time as it takes the pressure to rise to its maximum value (Figure C. 12).
Figure C. 13 and Figure C. 14 show that the simulation of the force executed by the oil on the piston and the spring force meet expected trends and values.
C.2.3 Model verification dynamic test: braking ramp under feasible braking ramp
For this test, the end time of the desired braking ramp is set shorter than the feasible braking ramp of 78.32 s, which is required for stopping the disc while fully braking.
Figure C. 15 and Figure C. 16 can conclude that the pulse width modulation reacts as expected. When the velocity error increases, the pulse width modulation decreases and at the moment the actual angular velocity of the disc crosses the upper deviation band, the pulse width modulation gets zero. This means the brake is fully applied from that moment. Also for this stopping time a more powerful brake is required if a controlled braking sequence is desired.
C.2.4 Model verification dynamic test: braking ramp equals feasible braking ramp
For this test, the end time of the desired braking ramp is given as the exact value of the time period it takes to stop the disc while fully braking, which is 78.32 s.
Figure C. 15 Desired and actual angular disc velocity

140 Intelligent Belt Conveyor Monitoring and Control
Figure C. 16 Velocity error and pulse modulation
Figure C. 17 Desired and actual angular velocity of the disc
It can be concluded by shown in Figure C. 17 and Figure C. 18, that the pulse width modulation reacts as expected. When the velocity error increases, the pulse width modulation decreases and at the moment the actual angular velocity of the disc crosses the upper deviation band the pulse width modulation becomes zero. This means the brake is fully applied from that moment. If it is desired that the braking sequence stays within the deviation bands, so it can be controlled for this stopping time, a more powerful brake is required.

Appendix C: Software Model and Implementation 141
When comparing with previous dynamic test, the difference in end time and the difference in time at which X% becomes zero equals the difference in desired stopping time of 3.32s.
Figure C. 18 velocity error and pulse width modulation
Figure C. 19 Desired and actual angular velocity disc

142 Intelligent Belt Conveyor Monitoring and Control
C.2.5 Model verification dynamic test: braking ramp above feasible braking ramp
For this dynamic test, the end time of the desired braking ramp will be longer than the value of the time period required for stopping the disc while fully braking.
Figure C. 19 and Figure C. 20 show that as was expected, the actual angular velocity of the disc will never get below the desired braking ramp. The exception exists at the beginning of the braking sequence. The actual angular velocity of the disc will get closer to the desired braking ramp, but will only reach it in the endpoint of the braking sequence.
Figure C. 20 Velocity error and pulse width modulation
C.3 Matching of software model
Matching of the process values as generated by the healthy model and measured at the test facility was started for two steady state tests of respectively X%=0 and X%=100 with an initial angular disc velocity of 300 rpm. During these steady states, the SOBO-controller does not have any influence. The model matching was also carried out by three dynamic tests. For the first dynamic test, the desired braking time of 40 s is shorter than the minimum feasible braking time of 49.3 s. For the second dynamic test, the desired braking time equals the minimum feasible braking time exactly. For the third, the desired braking time of 80 s exceeds the minimum feasible braking time
C.3.1 Steady state matching
Figure C. 21 shows that the brake disc in the measurements is decelerated, while the brake disc in the model turns at constant speed. This is caused by the fact that the bearing frictions and air resistances are neglected in the model. It can be seen that the frictions and resistance

Appendix C: Software Model and Implementation 143
have a significant influence on the angular disc velocity and should be accounted for. From the measured slope of the angular disc velocity, it follows that the deceleration is constant, which means that the bearing frictions and air resistances execute a constant force on the rotating parts of the test arrangement.
Figure C. 21 Angular velocity of disc X%=100
Figure C. 22 Angular velocity of disc X%=0

144 Intelligent Belt Conveyor Monitoring and Control
When the bearing frictions and air resistance were taken into account, it can concluded from Figure C. 21and Figure C. 22 that a higher friction coefficient between brake pads and disc and an increased mass moment of inertia match the measured process values for both steady states with respectively X%=0 and X%=100 well.
Figure C. 23 Angular disc velocity first dynamic test
Figure C. 24 Cylinder pressure first dynamic test
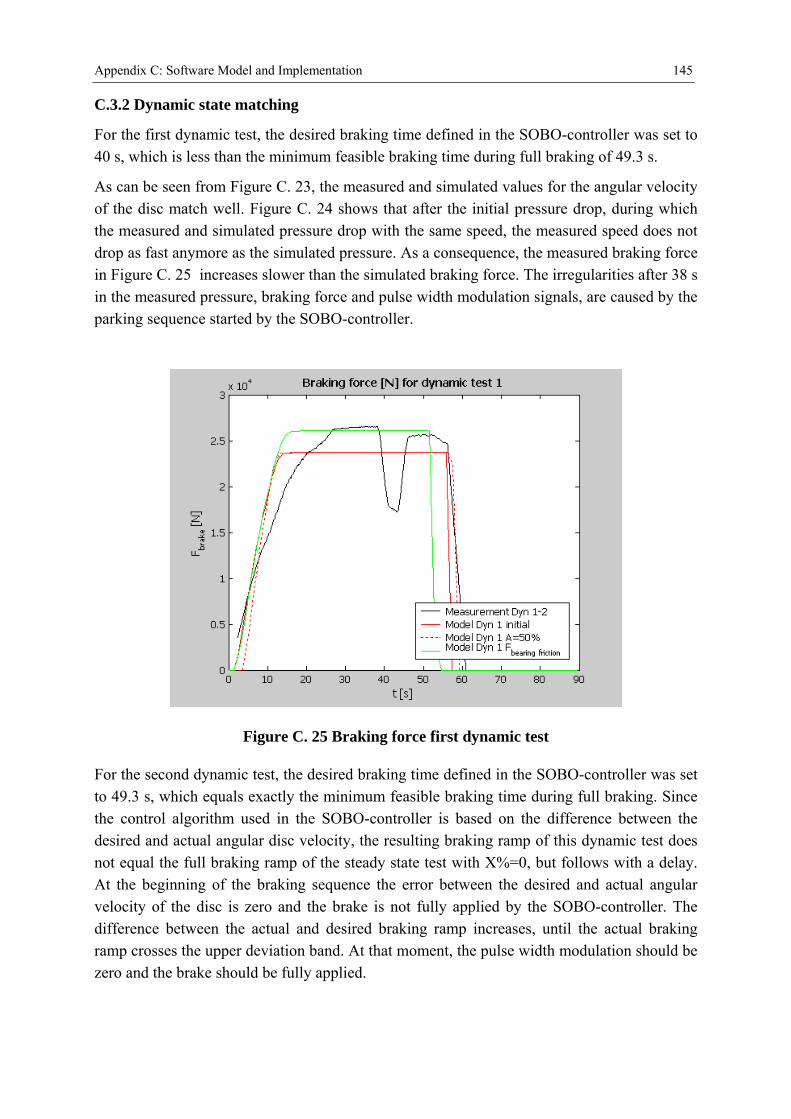
Appendix C: Software Model and Implementation 145
C.3.2 Dynamic state matching
For the first dynamic test, the desired braking time defined in the SOBO-controller was set to 40 s, which is less than the minimum feasible braking time during full braking of 49.3 s.
As can be seen from Figure C. 23, the measured and simulated values for the angular velocity of the disc match well. Figure C. 24 shows that after the initial pressure drop, during which the measured and simulated pressure drop with the same speed, the measured speed does not drop as fast anymore as the simulated pressure. As a consequence, the measured braking force in Figure C. 25 increases slower than the simulated braking force. The irregularities after 38 s in the measured pressure, braking force and pulse width modulation signals, are caused by the parking sequence started by the SOBO-controller.
Figure C. 25 Braking force first dynamic test
For the second dynamic test, the desired braking time defined in the SOBO-controller was set to 49.3 s, which equals exactly the minimum feasible braking time during full braking. Since the control algorithm used in the SOBO-controller is based on the difference between the desired and actual angular disc velocity, the resulting braking ramp of this dynamic test does not equal the full braking ramp of the steady state test with X%=0, but follows with a delay. At the beginning of the braking sequence the error between the desired and actual angular velocity of the disc is zero and the brake is not fully applied by the SOBO-controller. The difference between the actual and desired braking ramp increases, until the actual braking ramp crosses the upper deviation band. At that moment, the pulse width modulation should be zero and the brake should be fully applied.

146 Intelligent Belt Conveyor Monitoring and Control
Figure C. 26 Angular velocity disc second dynamic test
Figure C. 27 Cylinder pressure second dynamic test
As can be seen from Figure C. 26, the upper deviation band is crossed at 25 s for both the measured and the simulated angular disc velocity. But at that time, the measured pressure has not dropped to its minimum value, while the simulated pressure has, as can be seen in Figure C. 27. This can be explained by Figure C. 28 which shows that the measured pulse width modulation has not dropped to zero at the moment the angular disc velocity crossed the upper deviation boundary, but only drops to a minimum value of 35. After that, it even increases,

Appendix C: Software Model and Implementation 147
although the difference between the desired and actual braking ramp increases. This results in a smaller braking force as shown in Figure C. 28 and thus a longer braking time. It should be mentioned that the pulse width modulation value at the moment the angular disc velocity crosses the upper deviation band is higher than for the first dynamic test. At 47 s the parking sequence is started as can be seen from the measured data. For the third dynamic test, the desired braking time defined in the SOBO-controller is set to 80 s, which exceeds the minimum feasible braking time during full braking. This test simulates a braking sequence as can be found in practice.
Figure C. 28 Braking force second dynamic test
Figure C. 29 Angular velocity disc third dynamic test

148 Intelligent Belt Conveyor Monitoring and Control
Figure C. 30 Cylinder pressure third dynamic test
Figure C. 31 Braking force third dynamic test
A striking feature in Figure C. 29 is that the measured braking slope crosses the desired braking slope, while the simulated braking slope does not. The measured and simulated values for the cylinder pressure and braking force as shown respectively in Figure C. 30 and Figure C. 31 match up to 20 s. At that time point, the measured values make a jump. Due to

Appendix C: Software Model and Implementation 149
this sudden pressure drop and increase of the braking force, the angular velocity of the disc crosses the desired braking ramp. At the moment the actual braking ramp crosses the desired braking ramp, the pulse width modulation equals its neutral value of 55 as it was supposed to be and after that its value increases further as expected.
From the beginning of the braking sequence, the pressure in the cylinder drops as can be seen from Figure C. 30 and Figure C. 31 showing that the braking force increases proportional to the pressure drop and that the simulated values do match the measured values. After 20 s the pressure suddenly drops a lot more and the braking force increases with the same kind of jump. This effect can be explained by the behaviour of the piston moving in the cylinder. A mechanical phenomenon called stick-and-slide appears between the piston seals and the cylinder. While pressure drops and increases in the brake cylinder, the piston should move smoothly within the cylinder, but according to the sudden pressure drop in Figure C. 30 this does not happen. The pressure has to drop to a certain value, before the cylinder starts to move smoothly within the cylinder. Before this pressure value has been reached, the piston is moving small distances within the elastic deformation of the seals and some very small irregular stick and slide movements, causing the increasing braking force over this period. When the pressure has reached a certain value, the seals are tensed so much, that the piston suddenly starts to move and due to its mass moment of inertia, it moves further than its target position. The piston movement results in a sudden enlargement of the oil chamber, causing a sudden pressure drop, an increase of the braking force and a too fast deceleration of the disc. The pressure drops too far and therefore it can also be seen that after the jump, the pressure starts an immediate increase again. This increase and thus the decrease of the braking force does not go fast enough, because at around 60 s, the actual angular velocity of the disc crosses the lower deviation boundary and becomes zero before the desired braking time has been reached.
C.4 Discussion on decision-making results from the IBCMC system
The IBCMC system can be evaluated by the effectiveness based on the accuracy of discovering all introduced failure modes (FM).
C.4.1 Healthy operation
Offering the measurements during healthy operation of the test facility to the IBCMC system, the system gave the outputs as shown in Figure C. 32 during the blocks of ten seconds.
As illustrated, during the first 10 s no correct cases were retrieved. Of the retrieved cases, 70% indicated grease on disc, 10% gave control pressure low and 20% indicated that the SOBO-controller failed. Between 10 and 20 s, 70% of the retrieved cases were correct and 30% were incorrect, all of them were cases from FM 1.1 grease on disc. The fuzzy categories for respectively measurement healthy, model healthy and model FM 1.1 grease on disc are retrieved between 10 and 20 s. The similarity factor between measurement healthy and the cases of model healthy and model failure mode 1.1 grease on disc are similar. The IBCMC system retrieves the case that has a higher priority according to the retrieval sequence used. In

150 Intelligent Belt Conveyor Monitoring and Control
this case, the cases of grease on disc have a higher priority than the healthy cases and thus the cases of grease on disc are retrieved. Between 20 and 30 s, 40% of the retrieved cases was correct and indicated healthy operation. 60% of the retrieved cases were incorrect. All of them indicated control pressure low. The IBCMC system retrieves the case that has a higher priority according to the retrieval sequence used. In this case, the cases of control pressure low have a higher priority than the healthy cases and thus the cases of control pressure low are retrieved.
After 30 s, the IBCMC system only retrieved incorrect cases. These cases were all indicating the same failure mode, namely failure mode 1.3 control pressure low. The reason for these wrong indications is the same as for the retrieved cases of control pressure low during 20 and 30 s.
Figure C. 32 Decision-making retrieval for healthy operation
It was found out that the IBCMC system gives the highest priority to the simulation data that was put in the case base first. After rebuilding the case base with adding the healthy simulated data first, the IBCMC system gave the correct outputs for 100% of the measured data. This means that the IBCMC system is able to retrieve the correct cases when a failure mode is measured on the test facility.
C.4.2 Failure mode grease on disc
Offering the measurements during failure mode 1.1 of the test facility to the IBCMC system, it gave the outputs as shown in Figure C. 33 during the blocks of ten seconds.

Appendix C: Software Model and Implementation 151
During the first 10 s, 100% of the retrieved cases give the correct indication grease on disc. Between 10 and 20 s, 30% of the retrieved cases gave the incorrect indication healthy. The other 70% were correctly retrieved cases. It can be concluded that between 24 and 28 s, the similarity factors for the fuzzy representatives of model FM 1.1 grease on disc and model healthy are exactly the same. The IBCMC system retrieves the case that has a higher priority according to the retrieval sequence used. In this case, the cases of healthy have a higher priority than the grease on disc cases and thus the cases of healthy are retrieved. Between 20 and 30 s, 90% of the retrieved cases gave the correct indication grease on disc. Only 10% of the outputs was wrong and appeared at 14 and 15 s. Between 80 and 85 s, 60% of the retrieved cases were correct. The other retrieved cases gave the indication control pressure low.
Figure C. 33 Decision-making solutions failure mode grease on disc
As was mentioned for the analysis of the IBCMC system output for the healthy measurement, it was found out that the IBCMC system gives the highest priority to the simulation data that was put in the case base first. After rebuilding the case base with adding the simulated data for FM 1.1 grease on disc first, the IBCMC system gave the correct outputs for all periods, except between 20 and 30 s. This is the correct result, because the wrong outputs during all periods were the result of the priority problems in the IBCMC system, except for the outputs between 80 and 85 s, which were caused by the parking sequence that was measured but not simulated and between 20 and 30 s, caused by noises.

152 Intelligent Belt Conveyor Monitoring and Control
C.4.3 Failure mode control pressure low
Offering the measurements during failure mode 1.3 of the test facility to the IBCMC system, it gave the outputs as shown in Figure C. 34 during the blocks of ten seconds.
Figure C. 34 Decision-making solution for failure mode control pressure low
During the first 10 s, 90% of the retrieved cases by the IBCMC system were incorrect. Of the cases retrieved, 50% were healthy cases and 40% were cases indicating FM 1.1 grease on disc. 10% of the retrieved cases were correct. As can be concluded, the similarity factor for the similarity factors for the fuzzy representatives of model FM 1.3 control pressure low and model FM 1.1 grease on disc low are exactly the same. The IBCMC system retrieves the case that has a higher priority according to the retrieval sequence used. In this case, the cases of grease on disc have a higher priority than the control pressure low cases and thus the cases of grease on disc are retrieved. Between 10 and 20 s, 60% of the retrieved cases gave the incorrect indication healthy and 40% of the retrieved cases was correct. The healthy indications were again based on priority according to the retrieval sequence used.
After 20s, the IBCMC system gives a 100% correct output.
After rebuilding the case base with adding the simulated data for FM 1.3 control pressure low first, the IBCMC system gave the correct outputs for all periods.
C.4.4 Failure mode SOBO-controller fails
Offering the measurements during failure mode 3.1 of the test facility to the IBCMC system, it gave the outputs as shown in Figure C. 35 during the blocks of ten seconds.

Appendix C: Software Model and Implementation 153
During the first 10 s, 60% of the retrieved cases were cases indicating failure mode 1.1 grease on disc. The other 40% cases retrieved were correct. After 20s, the IBCMC system gives a 100% correct output.
After rebuilding the case base with adding the simulated data for FM 3.1 SOBO-controller fails first, the IBCMC system gave the correct outputs for all periods
Figure C. 35 Decision-making solutions failure mode SOBO controller fails

154 Intelligent Belt Conveyor Monitoring and Control

155
Appendix D: CD-ROM content
This appendix overviews the content of the CD-ROM accompanying this thesis. The items included in the CD-ROM are listed in Table D. 1.
Table D. 1: Items on the CD-ROM
Folder Item
Delphi Delphi source code
NI National Instruments LabVIEW diagram
Simulink Simulink model for hydraulic brake system
D.1 Delphi source code
Delphi source code presented in the CD-ROM includes:
The source code of the knowledge-based expert system for intelligent belt conveyor monitoring and control;
The source code of the multi-agent system for intelligent belt conveyor monitoring and control;
The source code of agent communication; The database structures applied to the intelligent belt conveyor monitoring and control
system.
D.2 National Instruments LabVIEW Program
A 16 channels data acquisition LabVIEW diagram is included in the CD-ROM.
This LabVIEW diagram has been used for data acquisition tasks in belt conveyor monitoring. Thanks to Mr. Ed Stok for helping building this diagram.
D.3 Simulink
This part of the CD-ROM provides the Simulink models of the hydraulic brake system and its subsystems. Simulation results and parameter settings are partially given.

156 Intelligent Belt Conveyor Monitoring and Control
D.4 Proclamations
The content on the CD-ROM can be used to study specific details but is not required to comprehend the contents of this thesis.
Due to the variance of software settings and hardware configurations, not all source codes, diagrams and executables can be viewed or executed on different computers.
The content on the CD-ROM is not intended to be used or altered by anyone but the author.

157
Nomenclature
Table 1. List of abbreviations
Abbreviation Description
ACL Agent Communication Language
AF Accumulation Factor
AGV Automated Guided Vehicle
AI Artificial Intelligence
ANN Artificial Neural Network
BBN Bayesian Belief Network
BCM Belt Conveyor Monitoring
BCS Belt Conveyor System
CBM Conveyor Belt Monitoring
CBR Case-based Reasoning
CM Condition Monitoring
DAC Data Acquisition
DAN Data Analysis
DF Damage Factor
ECD Embedded Conductive Detection
EF Extension Factor
ES Expert System
IBCMC Intelligent Belt Conveyor Monitoring and Control
IF Intensity Factor

158 Intelligent Belt Conveyor Monitoring and Control
KBES Knowledge-based Expert System
KBS Knowledge-based System
KQML Knowledge Query Management Language
LF Location Factor
MAS Multi-agent System
MF Match Factor
NDT Non-Destructive Testing
NI National Instruments
WT Weight Factor
Table 2. List of capital variables
Capital Unit Description
pA - Quantity attribute of event
pnA - Quantity attribute of the nth event
qA - Pattern attribute of event
qnA - Pattern attribute of the nth event
rA - Response level attribute of event
rnA - Response level attribute of the nth event
B Tesla Magnetic strength in B-field
iC - The ith case
nC - New case
pC - Past case
E - Event or evidence
nE - The nth event or evidence
mnE - The nth event of the mth monitored situation
F N Force
brakeF N Braking force
cylF N Force executed by the piston on the brake pad

Nomenclature 159
gF - Gauge factor of strain gauge
G N/m2 Young’s modular
H - Hypothesis in Bayesian inference
fI - Inspection frequency index
rI - Belt wear index
( )iP e - Probability of the ith event
( )P E - Probability of evidence E
( | )P E H - Posterior probability of evidence E, given hypothesis H
( )P H - Probability of hypothesis H
( | )P H E - Conditional probability hypothesis H, given evidence E
' ( | )P H E - Likelihood probability updated for the value of fuzzy range
*( | )P H E - Likelihood probability updated for the size of fuzzy range
L m Length
nL - Number of identity lines of an ECD system
TL - Data tunnel length
wL - Observation window length
nM - Number of magnets in one identity line of an ECD system
R ohm Electrical resistance
S m Space between two objects
CS - Similarity factor between cases
mS - The mth monitored BCS situation
refS m Reference space between two objects
discT °C Temperature of the brake disc
padT °C Temperature of the brake pad
ExV v Excitation voltage
outV v Output voltage
XV v Voltage output in X coordinate

160 Intelligent Belt Conveyor Monitoring and Control
YV v Voltage output in Y coordinate
%X - Pulse width modulation
Table 3. List of non-capital variables
Non-capital Unit Description
d m Distance
( ( ), ( ))m i m jd m Distance between the ith magnet and the jth magnet
dx m/s Velocity of the brake pad
ie - Set of i events or evidences
3flow m3/s Brake cylinder oil flow
)(xg - Fuzzy membership function
0bal m Distance between magnets a and b when empty belt
ball m Distance between magnets a and b when loaded belt
im - The ith magnet
rn rpm Rotational speed
0p N/m2 Pressure in tank
1p N/m2 Pressure in main accumulator
p2 N/m2 Lifting pressure of brake
3p N/m2 Pressure in brake cylinder
r m Radius
ir - The ith fuzzy level
ies - Size of the fuzzy range of the ith event/evidence
t s Time
0at s Time magnet a passes sensor when empty belt
0bt s Time magnet b passes sensor when empty belt
0ct s Time magnet c passes sensor when empty belt
alt s Time magnet a passes sensor when loaded belt

Nomenclature 161
blt s Time magnet b passes sensor when loaded belt
clt s Time magnet c passes sensor when loaded belt
( )m it s The time the ith magnet passes through a sensor
t s Time criterion
t s Time criterion
0bat s Time between magnets a and b pass sensor when empty belt
balt s Time between magnets a and b pass sensor when loaded belt
0cbt s Time between magnets b and c pass sensor when empty belt
cblt s Time between magnets b and c pass sensor when loaded belt
v m/s Velocity
pvv rad/s Process value of angular velocity of brake disc
u bar Brake hydraulic unit pressure
w mm Brake pad abrasion
- Strain
N/m2 Stress
3 m3/s Oil flow to brake cylinder

162 Intelligent Belt Conveyor Monitoring and Control

163
Bibliography
Aamodt, A. and Plaza, E. (1994) Case-based reasoning: Foundational issues, Methodological Variations, and System Approaches, in: Artificial Intelligence Communications, vol. 7, no. 1, pp. 39-52.
Alles, R. (1997) Transponder Trägermaterial, fördergurt mit eingelegten transpondern, DE patent 19544856.
Alles, R. and Wach, T. (2000) Method for monitoring a conveyor belt and system therefore, United States Patent 6047814.
Alles, R. (2001) Fördergurt zur überwachung eines fördergurtes, DE Patent 19603578.
Alles, R. (2002) System and method for monitoring a cover layer of a composite structure wherein the conveyor layer is subjected to wear, United States patent 6356201.
Alport, M., Governder, P., Plumb, S. and Van Der Merwe, L. (2001) Identification of Conveyor Belt Splices and Damages Using Neural Networks, in: proceeding of the BeltCon 11 conference, South Africa.
Andersen, W. A., Evett, M. P., Hendler, J. A. and Kettler, B.P. (1994) Massively parallel matching of knowledge structures, in: Kitano, H. and Hendler, J. (Eds) Massively Parallel Artificial Intelligence, AAAI Press/The MIT Press, Cambridge, USA, pp. 52-73.
Angeli, C. and Chatzinikolaou, A. (2001) Prediction and diagnosis of faults in hydraulic systems, in: Proceedings of Institution of Mechanical Engineers, Part B: Engineering Manufacture, Professional Engineering Publishing, vol. 216, no. 2, pp. 293-297.
Balakrishnan, A., Kumara, R. and Sundaresan, S (1999) Manufacturing in the digital Age: exploiting information technologies for product realization, in: Published in Information System Frontiers, Kluwer Publishers, Inaugural Issue.
Bartelmus, W. (2001) Mathematical modeling and computer simulation as an aid to gearbox diagnostics, in: Mechanical Systems and Signal Processing, vol. 15, no. 5, pp. 855-871.

164 Intelligent Belt Conveyor Monitoring and Control
Bartelmus, W., and Zimroz, R. (2001) Vibration condition monitoring of two stage gearboxes, in: Proceedings of 4th International Conference of Acoustical and Vibration Surveillance Methods and Diagnostics Techniques, France, pp. 645-656.
Bartelmus, W., and Zimroz, R. (2008) Belt conveyor driving system vibro-acoustic severity reduction by condition based maintenance, in: Scientific Papers of the Institute of Mining Technology in Wroclaw, Studies and materials, vol. 123, no. 34, pp. 5-16
Bartelmus, W., and Zimroz, R. (2009) A new feature for monitoring and condition of gearbox in non-stationary operating conditions, in: Mechanical Systems and Signal Processing, vol. 23, pp. 1528-1534.
Beckman, T. J. (1991) Selecting expert-system applications, in: AI Expert, vol. 6, no. 2, pp. 42-48.
Bellman, R. E. (1978) An introduction to artificial intelligence: can computers think?, Boyd & Fraser, San Francisco.
Bertola, P. and Teixeira, J. C. (2003) Design as a knowledge agent: How design as a knowledge process is embedded into organizations to foster innovation, in: Design Studies, vol. 24, no. 2, pp. 181-194.
Boullart, L. (1992) A gentle introduction to artificial intelligence, in: Application of artificial intelligence in process control, Pergamon Press, Oxford, UK.
Cairó, O. and Barreiro, J. (2000) The importance of metrics and evaluation process in knowledge based system, in: Proceedings of the 2nd International Workshop on Computer Science and Information Technologies (CSIT’2000), Ufa, Russia.
Christensen, N. (2004) Installation and maintenance manual BSFI 330-S-200, Svendborg Brakes, Vejstrup, Denmark.
Conrath, D. W. and Sharma, R. S. (1992) Towards a diagnostic instrument for assessing the quality of expert system, in: ACM SGIMIS Database, vol. 23, no. 1, pp. 37-43.
Dempster, A. P. (1967) Upper and lower probabilities induced by a multivalued mapping, in: The Annals of Mathematical Statistics, vol. 38, no. 2, pp. 325-339.
Encyclopaedia Britannica (1989), Genetics and heredity, 15th edition, vol. 19, pp. 724.
Feigenbaum, E. A. (1977) The art of artificial intelligence I: Themes and case studies of knowledge engineering, in: Computer Science Technical Report (CS-TR-77-621), Stanford University, Palo Alto, USA.
Feigenbaum, E. A. (1982) Knowledge engineering in the 1980s, PhD Thesis, Dept. of Computer Science, Stanford University, Stanford, CA, USA.
Fonseca, D.J., Uppal, G. and Greene, T. J. (2004) A knowledge-based system for conveyor equipment selection, in: Expert System with Application, vol. 26, no. 4, pp. 615-623.

Bibliography 165
Gartland, J. J. (2002) Conveyor belt with microcoil springwire sensor, United States Patent 6352149.
Gasching, J., Klahr, P., Pople, H., Shortliffe, E. and Terry, A. (1983) Evaluation of expert systems: Issues and case studies, in: Hayes-Roth, F., Waterman, D. and Lenet, D. (eds.), Building Expert Systems, Addison-Wesley. Reading.
Gasser, L. (1991) Social conceptions of knowledge and action: DAI foundations and open systems semantics, in: Artificial Intelligence, vol. 47, pp. 107-138.
Giarratano, J. (1998) Expert systems principles and programming, University of Houston – Clear Lake & Gary Riley (Calico Technology), 3rd edition, PWS Publishing Company, An International Thomson Publishing Company, Boston.
Grimmelius, H. T. (2005) Condition monitoring for marine refrigeration plants based on process models, PhD thesis, Delft University Press, Delft, the Netherlands.
Harrison, A. (1979) New development in conveyor belt monitoring, in: Mechanical and Product Engineering, no. 12, pp. 17.
Harrison, A. (1985) Testing steel cord belt splices with a magnetic conveyor belt monitor, in: Non destructive Evaluation, vol. 5, no. 1, pp 15-19.
Hecht-Nielsen, R. (1990) Neurocomputing, Addison Wesley, Reading, USA.
Hetzel, F. V. and Albright, R. K. (1941) Belt conveyors and belt elevators, 3rd edition, John Wiley & Sons, New York.
Hilberink, A. (2005) Generating knowledge with a software model: A knowledge-based expert system for condition monitoring of a hydraulic brake system”, M.Sc. Thesis, Report no. 2005.TT.6959, Department of Transport Engineering and Logistics, Delft University of Technology, Delft, the Netherlands.
Hollnagel, E. (1989) Evaluation of Expert System, in: Guida, G. and Tasso, C. (Eds.), Topics in Expert System Design Methodologies and Tools, Elsevier (North Holland), Amsterdam, pp. 377-416.
Howard, R. A. and Matheson, J. E. (1984) Reading on the principles and applications of decision analysis, Menlo Park CA: Strategic Decision Group, USA, pp. 719-762.
Jackson, P. (1999) Introduction to expert systems, Addison Wesley Longman Limited, Harlow, UK.
Jeinsch, T., Sader, M. , Noack, R., Barber, K., Ding, S.X., Zang, P. and Zhong, M. (2002) A robust model-based information system for monitoring and fault detection of large scale belt conveyor systems, in: Proceedings of the 4th World Congress on Intelligent Control and Automation, Shanghai, P. R. China.
Jones, M. T. (2008) Artificial Intelligence: A system approach, in: Computer Science Series, Jones and Bartlett Publishers, Inc.

166 Intelligent Belt Conveyor Monitoring and Control
Jurdziak, L. (2000) The conveyor belt wear index and its application in belts replacement policy, in: Proceedings of the International Symposium on Mine Planning and Equipment Selection, Athens, Greece.
Khodabandehloo, K. (1996) Analyses of Robot Systems Using Fault and Event Trees: Case Studies, in: Reliability Engineering Systems and Safety, vol. 53, pp. 247-264.
Kjærulff, U. (1994) Reduction of computational complexity in Bayesian networks through removal of weak dependences, in: Proceedings of the 10th conference on Uncertainty in Artificial Intelligence, Morgan Kaufmann, pp. 374-382
Koch, F., Westphall, C. B., Assuncao, M. D. and Xavier E. (2004) Distributed artificial intelligence for network management systems – New approaches, in: Proceedings of the First International Workshop of Service Assurance with Partial and Intermittent Resources, pp. 135-145.
Korbicz, J., Koscielny, J. M., Kowalczuk, Z. and Cholewa, W. (2004) Fault Diagnosis: Models, Artificial Intelligence, Applications, Springer, Berlin.
Koyuncu, M. and Yazici, A. (2005) A fuzzy knowledge-based system for intelligent retrieval, in: IEEE Transactions on Fuzzy Systems, vol. 13, issue 3, pp. 317-330.
Kumar, K. (1990) Post implementation evaluation of computer information systems: Current Practices, in: Communication of the Association of Computer Machinery (ACM), vol. 33, pp. 203-212.
Kurzweil, R. (1990) The Age of artificial intelligent machines, the MIT Press, Cambridge.
Küsel, B. (2004) Record Breakers! In: World Coal, June, pp. 69-71.
Leaney, V. C. and Sharpe, D. J. (1999) Condition monitoring techniques for optimisation of wind farm performance, in: Condition Monitoring and Diagnostic Engineering Management (COMADEM), vol. 2, pp. 5-13.
Leonard, T. and Hsu, J. S (1999) Bayesian Methods: an analysis for statisticians and interdisciplinary researchers, Cambridge University Press.
Liebowitz, J. (1998) The handbook of applied expert systems, 1st edition, CRC Press, Inc. Boca Raton, FL, USA.
Lodewijks, G. (1998) The power of field measurements – Part I, in: Bulk Solids Handling, vol. 18, no. 3, pp. 415-427.
Lodewijks, G. (2001) Two decades dynamics of belt conveyor systems, in: Proceedings of the BeltCon 11 Conference, Randburg, Republic of South Africa, pp. 1-18.
Lodewijks, G. (2003) Strategies for automated maintenance of belt conveyor systems, in: Proceedings of the BeltCon 12 Conference, Johannesburg, South Africa, pp. 1-13.
Lodewijks, G. (2004) Strategies for automated maintenance of belt conveyor systems, in: Bulk Solids Handling, vol. 24, pp. 16-24.

Bibliography 167
Lodewijks, G. and Pang, Y. (2004a) A knowledge-based expert system for intelligent belt monitoring, in: Proceedings of the 8th International Conference on Bulk Materials Storage, Handling and Transportation, pp. 317-321.
Lodewijks, G. and Ottjes, J. (2005) Belt conveyor inspection tools based on fuzzy logic, in: Bulk Solids Handling, vol. 25, no. 5, pp. 284-289.
Lodewijks, G. (2005a) Automation of belt conveyor systems – the application of intelligent maintenance concepts, in: Lecture notes of the Intensive Short Course in Belt Conveying, University of Newcastle, Newcastle, Australia.
Lorentzen, A. (2006) Global and local knowledge networks in innovation: A case study of Polish manufacturing enterprises, in: International conference of European network on industrial policy, University of Limeric, Ireland.
Lowe, R. B and Enabnit, R. S. (1973) Belt damage detector, United States Patent 3731113.
Maher, M. L. and Zhang, D. M. (1993) CADSYN: A case-based design process model, in: Artificial Intelligence in Engineering, Design, and Manufacturing, vol. 7, no. 2, pp. 97-110.
Mark, W., Simoudis, E. and Hinkle, D. (1996) Case-based reasoning: Expectations and results, in: Leake, D. B. (eds.), Case-based reasoning: Experiences, Lessons and Future Directions, AAAI Press, Menlo Park, USA, pp. 269-294.
McCarthy, J. and Hayes, P. J. (1969) Some philosophical problems from the standpoint of artificial intelligence, in: Machine Intelligence, vol. 4, pp. 463-502.
Mills, H. (1972) On the statistical validation of computer programs, IBM Federal Systems Division, Maryland, USA.
Moczulski, W. and Szulim, R. (2004) On case-based control of dynamic industrial processes with the use of fuzzy representation, in: Engineering Applications of Artificial Intelligent, vol. 17, no. 4, pp. 371-381.
Moulin, B. and Chaib-Draa, B. (1996) An overview of distributed artificial intelligence, in: O’Hare, G. M. P. and Jennings, N. R. (eds), Foundations of distributed artificial intelligence, John Wiley & Sons, New York, USA, pp. 3-55.
Navinchandra, D. (1991) Exploration and innovation in design: towards a computational model, Springer-Verlag, New York, USA.
Noltingk, B. E. (1985) Jones’ instrument technology. Vol. 1. Mechanical measurement, 4th edition, London: Butterworths.
Nonaka, I. and Takeuchi, H. (1995) The knowledge creating company. Oxford University Press.
Norton, H. N. (1989) Handbook of transducers, Prentice Hall, Englewood Cliffs, New Jersey.
O’Connor, P. D. T. (1991) Practical reliability engineering. 3rd Edition, John Wiley & Sons, Chichester, England.

168 Intelligent Belt Conveyor Monitoring and Control
O’Keefe, R. M., Balci, O. and Smith, E. P. (1987) Validating expert system performance, in: IEEE Expert, vol. 2, no. 4, pp. 81-90.
Owens, C. (1993) Integrating feature extraction and memory search, in: Machine Learning, vol. 10, no. 3, pp. 311-340.
Pang, Y. and Lodewijks, G. (2005a) Agent-based intelligent belt conveyor monitoring, in: Proceedings of Bulk Asia 2005, Mumbai, India, pp. 1-7.
Pang, Y. and Lodewijks, G. (2005b) Large-scale conveyor belt maintenance decision-making by using fuzzy causal modeling, in: Proceedings of the 8th International IEEE Conference on Intelligent Transportation Systems, Vienna, Austria, pp. 402-406.
Pang, Y. and Lodewijks, G. (2006a) Simulation-based knowledge acquisition for intelligent belt conveyor monitoring, in: Proceedings of the 5th International Conference for Conveying and Handling of Particulate Solids, Sorrento, Italy.
Pang, Y. and Lodewijks, G. (2006b) Knowledge-based maintenance decision-making for large-scale belt conveyor systems, in: Bulk Solids Handling, vol.26, no.1, pp. 32-39.
Pang, Y. and Veeke, H. P. M. and Lodewijks, G. (2006c) A simulation-based expert system for process diagnosis, in: Proceedings of the 4th Annual Industrial Simulation Conference, Italy.
Pang, Y. and Lodewijks, G. (2006d) A novel embedded conductive detection system for intelligent conveyor belt monitoring, in: Proceedings of 2006 IEEE International Conference on Service Operations and Logistics, and Informatics, Shanghai, P. R. China, pp. 803-808.
Pang, Y. and Lodewijks, G. (2006e) A Bayesian belief network approach to belt conveyor system monitoring, in: Proceedings of International Conference on Storing, Handling and Transporting Bulk, Barcelona, Spain.
Pang, Y., López De La Cruz, A. and Lodewijks, G. (2008) Bipolar magnetic positioning system for automated guided vehicles, in: Proceedings of IEEE intelligent vehicles symposium (IEEE intelligent transport society), Eindhoven, the Netherlands, pp. 883-888.
Payne, T. R., Paolucci, M., Singh, R. and Sycara, K. (2002) Communicating agents in open multi agent system, in: First GSFC/JPL Workshop on Radical Agent Concepts (WRAC), McLean, VA, USA, pp. 365-371.
Pearl, J. (1988) Probabilistic reasoning in intelligent systems: networks of plausible inference, Morgan Kanfmann Publishers, Inc., San Mateo, CA, USA.
Perner, P. (2002) Are case-based reasoning and dissimilarity-based classification two sides of the same coin?, in: Engineering Applications of Artificial Intelligence, vol. 15, pp. 193-203.
Polak, T. A. and Pande, C. (1999) Engineering measurement: methods and intrinsic errors, Professional Engineering Publishing Limited, London, UK.
Quinlan, J. R. (1993) Programs for machine learning, morgan kaufmann, San Mateo, USA.

Bibliography 169
Racz, R. (2001) Novel magnetic displacement sensors, in: Sensors and actuators A, vol. 91, pp. 46-50.
Ross, S., Fang, L. and Hipel K. W. (2002) A case-base reasoning system for conflict resolutions: design and implementation, in: Engineering Applications of Artificial Intelligence, vol. 5, pp. 363-383.
Saaty, T. L. (1994) How to make a decision: The analytic hierarchy process, in: Interfaces, vol. 24, pp. 19-43.
Saborido, M. T. (1992) An introduction to expert system development, Catalina University of Technology Press, Barcelona, Spain.
Sampath, S., Gulati A. and Singh, R. (2002) Artificial Intelligence Techniques for Gas Turbine Engine Fault Diagnostics, in: Proceedings of the 38th AIAA/ASME/SAE/ASEE Joint Propulsion Conference & Exhibit, Indianapolis, Indiana, USA.
Sandewall, E. (1994) Features and Fluents, Oxford Press.
Schank, R. C. (1984) Memory-based expert systems, Technical Report, no. AFOSR.TR.84-0814, Yale University, New Haven, USA.
Schott, C., Racz, R., Betschar, F. and Popovic, R. S. (2002) Magnetic position sensor, European patent application, EP 1243898.
Sharma, R. S. and Conrath, D. W. (1993) Evaluation expert systems: A review of applicable approaches, in: Artificial Intelligence Review, Kluwer Academic Publishers, the Netherlands, vol. 7, no. 2, pp. 77-91.
Schneider, M., Kandel, A., Langholz, G. and Chew, G. (1996) Fuzzy expert system tools, 3rd edition, John Wiley and Sons, New York.
Shafer, G. (1976) A Mathematical Theory of Evidence, Princeton University Press
Shen, W., Maturana, F. and Norrie, D. H. (2000) MetaMorph II: An agent-based architecture for distributed intelligent design and manufacturing, in: Intelligent Manufacturing, vol. 11, no. 3, pp. 237-251.
Singh, M. P. (1998) Agent communication languages: Rethinking the principles, in: Computer, vol. 31, no. 12, pp. 40-47.
Soanes, C., Spooner, A. and Hawker, S. (2001). The Oxford paperback: Dictionary, Thesaurus and Wordpower Guide, Oxford University Press, Oxford, NY.
Srbljinovic, A. and Skunca, O. (2003) An introduction to agent based modeling and simulation of social processes, in: Interdisciplinary Description of Complex Systems, vol. 1, no. 1-2, pp. 1-8.
Strader, D. S (1986) Conveyor belt damage sensor, United States Patent 4621727.
Sycaraa, K. P. (1998) Multi-agent systems, in: Artificial Intelligence, vol. 94, no. 1-2, pp. 79-97.

170 Intelligent Belt Conveyor Monitoring and Control
Tao, Y., Hong, T. and Sun. S. (2004) An XML implementation process model for enterprise applications, in: Computers in Industry, vol. 55, pp. 181-196.
Toscano, R. and Lyonnet, P. (2002) Parameterization of a fuzzy classifier fo the diagnosis of an industrial process, in: Reliability Engineering and System Safety, vol. 77, pp 269-279.
Turner, J. and Hill M. (1999) Instrumentation for engineers and scientists, Oxford Science Publications, Oxford University Press.
Van Dyke Parunak, H. (1998) What can Agents do in Industry, and Why? An Overview of Industrially Oriented R&D at CEC, in: Proceedings of the Second International Workshop on Cooperative Information Agents II, Learning, Mobility and Electronic Commerce for Information Discovery on the Internet, pp. 1-18.
Van Elst, L., Abecker, A., Bernardi, A., Lauer, A., Maus, H. and Schwarz, S (2004) An agent-based framework for distributed organizational memories, in: Proceedings of Coordination and Agent Technology in Value Networks, Multikonferenze Wirtschaftsinformatik (MKWI-2004), pp. 181-196.
Wang, J. (2007) The Development of an Expert System for Measurement Systems Evaluation, in: Issues in Information Systems, vol. 8, no. 2, pp. 321-328.
Watson, I. and Marir, F. (1994) Case-based reasoning: a review, in: The knowledge Engineering Review, vol. 9, no. 4, pp. 327-354.
Wirth, R., Berthold, B., Kramer, A. and Peter, G. (1996) Knowledge Based Support of System Analysis for the Analysis of Failure Modes and Effects, in: Engineering Application of Artificial Intelligence, vol. 9, no. 3, pp. 219-229.
Wooldridge, M. and Jennings, N. (1995) Intelligent agents: Theory and Practice, in: Knowledge Engineering Review, vol. 10, no. 2, pp. 115-152.
Wooldridge, M. (2002) An Introduction to MultiAgent Systems, John Wiley&Sons: Chicherster.
Wu, W., Zhang, W. and Li, H. (2003) Knowledge acquisition in incomplete fuzzy information systems via the rough set approach, in: Expert System, vol. 20, no. 5, pp 280-286.
Xu, Z., Gao, K. and Khoshgoftaar, T. M. (2005) Application of fuzzy expert system in test case selection for system regression test, in: Proceedings of IEEE International Conference Information Reuse and Integration (IRI-2005), pp. 120-125.
Yang, C. C. (1997) Fuzzy Bayesian inference, in: Proceedings of IEEE International Conference on Systems, Man and Cybernetics, Orlando, Florida, USA, vol. 3, pp. 2707-2712.
Yang, C., Kose, K., Phan, S. and Kuo, P. (2000) A simulation-based procedure for expert system evaluation, in: Proceedings of the IEA/AIE 13th International Conference, New Orleans.
Zadeh, L. A. (1965) Fuzzy sets, in: Information and Control, vol. 8, pp. 338-353.

Bibliography 171
Zadeh, L. A. (1975) Fuzzy logic and approximative reasoning, in: Synthesis, vol. 30: pp. 407-428.
Zimbardo, P. (1992). Assessing Individual Differences, in: Psychology of Life (13th edition), HarperCollins Publishers, New York, pp. 539-572.

172 Intelligent Belt Conveyor Monitoring and Control

173
Summary
Traditionally, belt conveyor inspection and monitoring focus on individual critical components and aim to response to catastrophic system failures. To overcome operational problems caused by the lack of domain knowledge of inspectors, the monitoring of belt conveyor systems (BCS) can be automated. Since few standards and guidelines for automated monitoring and control are currently available, this thesis reflects the results of the study on the design of an Intelligent Belt Conveyor Monitoring and Control (IBCMC) system. Conventional troughed belt conveyors were used as the objective of this research project due to their wide application.
The process of intelligent monitoring and control of belt conveyors follows the steps of data acquisition, data analysis and decision-making. To get a comprehensive impression of the operational status of a belt conveyor, the data and information derived from traditional monitoring systems need to be integrated into an overall maintenance and operational control decision-making system.
The acquisition of sufficient data and information, with the aim to optimize the maintenance and operational decisions based on the overall status of a belt conveyor, can be achieved by both integrating individual monitoring systems and by developing novel monitoring systems that can simultaneously take as many as possible aspects into account. An Embedded Conductive Detection (ECD) system has been developed in this research project. In the ECD system, magnets are embedded into the carcass of the conveyor belt to generate data that exposes the operational situation of belt conveyor when magnets pass through outside magnetic sensors. Compared to traditional monitoring systems, the advantages of the ECD system include the ability of monitoring most of conveyor belt parameters, non-contact monitoring, non-destructive test, immune in harsh industrial environment, etc.
One feature of the IBCMC system is the ability of automated data analysis that indicates abnormalities during BCS operations and evaluates the overall BCS status. To do so, several artificial intelligence technologies were employed. Fuzzy logic was applied for evaluating the conditions of monitored parameters and BCS components. The algorithm of fuzzy knowledge representation enables the IBCMC system to represent collected data and information as

174 Intelligent Belt Conveyor Monitoring and Control
knowledge that can be used by the intelligent system for diagnostic reasoning and decision-making. Bayesian inference method was employed to evaluate system uncertainties and predict system failures.
The decision-making was achieved by case-based reasoning based on the knowledge stored in the IBCMC system, which has been built as a knowledge-based expert system (KBES). Knowledge acquisition is always a bottleneck for developing knowledge-based expert systems. A simulation-based knowledge acquisition approach was developed and implemented for this research project. One unique aspect of this method is that the bottleneck problem can be solved by the use of software model in discovering operational solution and maintenance strategies in BCS performance. From experimental results it was found that that the knowledge required by the IBCMC system can be sufficiently derived from system modeling and simulation. The simulation-based approach was able to provide accurate enough outputs for system diagnosis and correct enough maintenance and operational control decisions. This method shortens and simplifies the knowledge acquisition process and shows its efficiency and accuracy of building up knowledge bases in IBCMC. The application of KBES in IBCMC provides a systematic procedure for accumulating domain knowledge for optimizing BCS performance and retrieving past experience quickly and precisely. The advantages of applying KBES include (1) well accessible and extensive knowledge from domain specialist and past experiences can be accumulated and reused continuously and consistently; (2) the deviations in expertise among different operators can be overcome; and (3) human effort can be reduced with the assistance of the intelligent system.
Agent-based technology, as another artificial intelligence technology, has been employed by the IBCMC system for system integration. In belt conveyor monitoring, the monitoring systems of most BCS components are already available but distributed in different fields of a BCS. The organization and integration of individual monitoring systems are based on monitored BCS components. The implementation of the IBCMC system has proven that the integration of the data and information from individual monitoring systems and monitored aspects is able to significantly reduce the complexity of the overall monitoring system and enhance the payoff of developing the monitoring system. Besides autonomy, an agent of one BCS component is able to communicate and cooperate with other agents via the agent of system coordination. An agent-based IBCMC system has been implemented and tested in laboratory environment. Results showed successful single agent functioning and multiple agents’ cooperation. The application of agent technologies in IBCMC was approved feasible and capable.
To estimate and evaluate the performance of an intelligent system, it is necessary to compare the system with a validation standard. However, such a standard does not currently exist in belt conveyor industry. Since the IBCMC system developed during this research project is the only automated system in the field of belt conveyors up to this date, its performance and the accuracy of system outputs can not be compared with the performance of some other systems. There is no standard data readily accessible for validating such a system, so by consequence, a precise estimation and evaluation of IBCMC performance cannot be obtained. In this research

Summary 175
project, the system of IBCMC was evaluated by qualitative study and quantitative study. Qualitative evaluation showed that the IBCMC system was mainly validated by experiments carried out in a laboratory environment and the measurements from BCS fields, with little knowledge of domain specialists involved. Therefore, most of system functioning results, intelligent outputs, the abilities and efficiencies of the IBCMC system can be approved correctly and sufficiently. Quantitative evaluation showed that the results and outputs of the IBCMC system are correct enough to be used for the monitoring and operational control in the industry using belt conveyors.
The automation of the monitoring and operational control of belt conveyors is likely to become a widespread research topic and will benefit the future of the industry using belt conveyors. AI technologies are feasible and capable to realize the intelligent abilities and add enough significant worth to be introduced into the applications of intelligent monitoring for belt conveyors. Since the development of intelligent belt conveyor monitoring and control is still at early stage, developing such an intelligent system may enable belt conveyor industry to set an industrial standard.

176 Intelligent Belt Conveyor Monitoring and Control

177
Samenvatting
Inspectie en monitoring van bandtransportsystemen (E.: belt conveyor system (BCS)) zijn meestal gericht op het voorkomen en signaleren van fouten in individuele, kritische onderdelen die gevolgen kunnen hebben voor het functioneren van het hele systeem. Om problemen, die kunnen ontstaan door onvoldoende specifieke kennis van het inspectiepersoneel, te vermijden, kunnen de inspectie en monitoring van een bandtransportsysteem worden geautomatiseerd. Op dit moment zijn er nog nagenoeg geen regels of richtlijnen voor dergelijke geautomatiseerde monitoring. Dit proefschrift bevat de resultaten van een onderzoek naar het ontwerp van een Intelligent Belt Conveyor Monitoring and Control (IBCMC) systeem. Het onderzoek is toegespitst op het gebruik van een dergelijk systeem bij conventionele, veel gebruikte open bandtransportsystemen.
In het proces van intelligente monitoring en besturing van bandtransportsystemen kunnen drie stappen worden onderscheiden: verzamelen van gegevens (data acquisitie), analyseren van gegevens (data analyse) en beslissen. Om een samenhangend beeld te vormen van de operationele status van een bandtransportsysteem, moeten het verzamelen van gegevens en informatie van traditionele monitoringsystemen worden geïntegreerd in een overall beslissingsmodel voor onderhoud en besturing.
Het verzamelen van gegevens en informatie, gericht op optimalisering van beslissingen voor onderhoud en bedrijfsvoering, gebaseerd op de globale toestand van het totale systeem, kunnen zowel worden bereikt door het gebruik van aparte monitoringsystemen, als door het ontwikkelen van nieuwe monitoringsystemen, waarmee meerdere aspecten kunnen worden gevolgd. Tijdens dit onderzoek is een Embedded Conductive Detection (ECD) systeem ontwikkeld. In de transportband zijn magneten ingesloten, waarmee informatie over de status van de transportband kan worden uitgelezen met behulp van externe sensoren. Voordelen van het ECD-systeem, in vergelijking met traditionele monitoringsystemen, zijn de mogelijkheid om nagenoeg alle toestandsparameters van de band te volgen, de mogelijkheid om op afstand en niet-destructief te monitoren, ongevoeligheid voor omgevingsfactoren, enz.
Met het IBCMC-systeem is geautomatiseerde gegevensanalyse mogelijk, met behulp waarvan bijzonderheden in de werking van het bandtransportsysteem kunnen worden gesignaleerd en

178 Intelligent Belt Conveyor Monitoring and Control
waarmee de overall status van het systeem kan worden geëvalueerd. Daarvoor is een aantal technieken uit de kunstmatige intelligentie gebruikt. Met behulp van fuzzy logic zijn gevolgde parameters en BCS-parameters geëvalueerd. Door de fuzzy representatie van de verzamelde gegevens en informatie kunnen die worden gebruikt in een intelligent diagnose- en beslissysteem. Er is een bayesiaans model gebruikt voor het evalueren van onzekerheden en het voorspellen van systeemfalen.
Het beslissingsmodel maakt gebruikt van ‘case-based reasoning’, gebaseerd op de kennis in het IBCMC-systeem, dat is ingericht als een ‘knowledge-based’ expertsysteem (KBES). Het vergaren van kennis is meestal de bottleneck bij het ontwikkelen van knowledge-based expertsystemen. Tijdens dit onderzoek is een simulatiemodel ontwikkeld en toegepast voor het genereren en verzamelen van gegevens. Een bijzonder aspect van deze werkwijze is dat de bottleneck in het vergaren van de kennis wordt omzeild door het gebruik van een softwaremodel voor het operationeel gedrag van een BCS en onderhoudsstrategieën voor zo’n systeem. Uit experimenten is gebleken dat met behulp van het simulatiemodel voldoende gegevens kunnen worden verzameld als kennis voor het IBCMC-systeem. Met deze op simulatie gebaseerde methode kan uitvoer worden gegenereerd welke nauwkeurig genoeg is voor het beoordelen van de toestand van het systeem en voor het nemen van beslissingen ten aanzien van onderhoud en operationele besturing. Met deze methode is de kennisverzameling korter en eenvoudiger, en worden efficiëntie en kwaliteit van het opbouwen van kennis in IBCMC gedemonstreerd. Met KBES beschikt IBCMC over een systematische procedure voor de verzameling van kennis voor het optimaliseren van de prestaties van een BCS en voor het snel en nauwkeurig terugzoeken van gegevens uit het verleden. Voordelen van het gebruik van KBES zijn onder andere: (1) goed-toegankelijke en uitgebreide kennis van deskundigen en van ervaringen in het verleden kan worden opgeslagen, en meerdere keren en consistent worden gebruikt; (2) verschillen in kennis en ervaring van verschillende gebruikers worden vermeden; en (3) de inzet van personeel kan worden beperkt door het gebruik van het intelligente systeem.
Voor de integratie van de verschillende delen van het IBCMC-systeem is gebruik gemaakt van een ‘agent-based’ methode. Voor de monitoring van de meeste onderdelen van bandtransportsystemen zijn al systemen beschikbaar, maar deze zijn beperkt tot de aparte onderdelen van het bandtransportsysteem. De organisatie en de integratie van de aparte monitoringsystemen gaan uit van de beschouwde componenten van het transportsysteem. Uit de implementatie van het IBCMC-systeem is gebleken dat door integratie van gegevens en informatie uit de aparte monitoringsystemen en de gevolgde aspecten, de complexiteit van het overall monitoringsysteem sterk kan worden gereduceerd en de opbrengst bijdrage van een dergelijke systeem kan worden verbeterd. Een agent bij een BCS-component kan autonoom opereren, maar ook communiceren en samenwerken met andere agents, via de agent systeemcoördinatie. In een laboratoriumomgeving is een agent-based IBCMC-systeem geïmplementeerd en getest. Het is gebleken dat de toepassing van een agent-based systeem mogelijk en bruikbaar is.

Samenvatting 179
Om de kwaliteit van een intelligent systeem vast te stellen en te waarderen, is het nodig om te beschikken over een genormeerde vergelijkingsbasis. Een dergelijke standaard bestaat er evenwel niet in de wereld van de bandtransporteurs. Omdat het IBCMC-systeem dat tijdens dit onderzoek is ontwikkeld, op dit moment het enige geautomatiseerde systeem is op dit gebied, kan het gedrag en de kwaliteit ervan niet worden vergeleken met het gedrag en de kwaliteit van andere systemen, en bestaan er geen standaard gegevens voor de validatie van een dergelijk systeem. Daardoor kunnen het gedrag en de kwaliteit van IBCMC niet precies worden een geschat en gewaardeerd. Tijdens het onderzoek zijn kwalitatieve en kwantitatieve evaluaties gedaan. Het IBCMC-systeem vooral is gevalideerd door experimenten in het laboratorium en met metingen aan BCS systemen, zonder menselijke input. Het blijkt dat de meeste onderdelen van het systeem goed functioneren en dat output, resultaten, mogelijkheden, en efficiëntie van het IBCMC-systeem correct en voldoende zijn. Uit kwalitatieve evaluatie blijkt dat de resultaten en output voldoende zijn om te worden gebruikt voor de monitoring en operationele besturing van bandtransportsystemen.
Automatisering van monitoring en operationele besturing van bandtransporteurs wordt naar verwachting een gebied van onderzoek waaraan veel aandacht wordt besteed, en zal een bijdrage kunnen leveren aan de verbetering van het gebruik van bandtransporteurs. Met AI-methoden is het mogelijk om intelligentie aan te brengen. Het is zinvol om AI-methoden te gebruiken voor intelligente monitoring van bandtransportsystemen. Omdat de ontwikkeling van intelligente systemen voor de monitoring van bandtransportsystemen nog in een beginstadium verkeert, kan met de ontwikkeling van een dergelijk systeem ook een standaard worden gezet voor de bandtransporteurindustrie.

180 Intelligent Belt Conveyor Monitoring and Control

181
Biography
Yusong Pang was born on May 16, 1970 in Changzhi, Shanxi Province, P. R. China. In 1992, he graduated from Taiyuan University of Technology (TUT), P. R. China, with a bachelor education in process automation. After working at the department of Electrical Engineering and the department of Information Technology at TUT as a lecturer and assistant professor for 8 years, he received his master degree in Electrical Engineering in the direction of automatic measurement and control. In September 2000, he was invited by Henk Koppelaar, the professor of the research group of Data and Knowledge Systems, faculty of Information Technology and Systems, Delft University of Technology (TUDelft), to carry out several projects of knowledge-based system and industrial process-oriented life-cycle management in the Netherlands, working in the cooperation of a few Dutch companies. In April 2003, Yusong joined the section of Transport Engineering and Logistics at TUDelft where he started his PhD research project under the supervision of professor Gabriël Lodewijks. In 2007, Yusong was employed as project engineer and mechanical engineer at the advisory group of Industrial Installations, Haskoning Nederland B.V. in Rotterdam. In this company he carried out projects related to the design and specification of various material handling and storage facilities in sea and inland ports, transport and logistics planning and industry process simulation. From April 2010 Yusong returned to the section of Transport Engineering and Logistics at TUDelft as an assistant professor.

182 Intelligent Belt Conveyor Monitoring and Control

183
Trail Thesis Series
The following list contains the most recent dissertations in the TRAIL Thesis Series. For a complete overview of more than 100 titles see the TRAIL website: www.rsTRAIL.nl.
The TRAIL Thesis Series is a series of the Netherlands TRAIL Research School on transport, infrastructure and logistics.
Pang, Y., Intelligent Belt Conveyor Monitoring and Control, T2010/12, December 2010, TRAIL Thesis Series, the Netherlands
Kim, N.S., Intermodal Freight Transport on the Right Track? Environmental and economic performances and their trade-off, T2010/11, December 2010, TRAIL Thesis Series, the Netherlands
Snelder, M., Designing Robust Road Networks: a general design method applied to the Netherlands, T2010/10, December 2010, TRAIL Thesis Series, the Netherlands
Hinsbergen, C.P.IJ. van, Bayesian Data Assimilation for Improved Modeling of Road Traffic, T2010/9, November 2010, TRAIL Thesis Series, the Netherlands
Zuurbier, F.S., Intelligent Route Guidance, T2010/8, November 2010, TRAIL Thesis Series, the Netherlands
Larco Martinelli, J.A., Incorporating Worker-Specific Factors in Operations Management Models, T2010/7, November 2010, TRAIL Thesis Series, the Netherlands
Ham, J.C. van, Zeehavenontwikkeling in Nederland: naar een beter beleidsvormingsproces, T2010/6, August 2010, TRAIL Thesis Series, the Netherlands
Boer, E. de, School Concentration and School Travel, T2010/5, June 2010, TRAIL Thesis Series, the Netherlands
Berg, M. van den, Integrated Control of Mixed Traffic Networks using Model Predictive Control, T2010/4, April 2010, TRAIL Thesis Series, the Netherlands
Top, J. van den, Modelling Risk Control Measures in Railways, T2010/3, April 2010, TRAIL Thesis Series, the Netherlands

184 Intelligent Belt Conveyor Monitoring and Control
Craen, S. de, The X-factor: A longitudinal study of calibration in young novice drivers, T2010/2, March 2010, TRAIL Thesis Series, the Netherlands
Tarau, A.N., Model-based Control for Postal Automation and Baggage Handling, T2010/1, January 2010, TRAIL Thesis Series, the Netherlands
Knoop, V.L., Road Incidents and Network Dynamics: Effects on driving behaviour and traffic congestion, T2009/13, December 2009, TRAIL Thesis Series, the Netherlands
Baskar, L.D., Traffic Control and Management with Intelligent Vehicle Highway Systems, T2009/12, November 2009, TRAIL Thesis Series, the Netherlands
Konings, J.W., Intermodal Barge Transport: Network Design, Nodes and Competitiveness, T2009/11, November 2009, TRAIL Thesis Series, the Netherlands
Kusumaningtyas, I., Mind Your Step: Exploring aspects in the application of long accelerating moving walkways, T2009/10, October 2009, TRAIL Thesis Series, the Netherlands
Gong, Y., Stochastic Modelling and Analysis of Warehouse Operations, T2009/9, September 2009, TRAIL Thesis Series, the Netherlands
Eddia, S., Transport Policy Implementation and Outcomes: the Case of Yaounde in the 1990s, T2009/8, September 2009, TRAIL Thesis Series, the Netherlands
Platz, T.E., The Efficient Integration of Inland Shipping into Continental Intermodal Transport Chains: Measures and decisive factors, T2009/7, August 2009, TRAIL Thesis Series, the Netherlands
Tahmasseby, S., Reliability in Urban Public Transport Network Assessment and Design, T2009/6, June 2009, TRAIL Thesis Series, the Netherlands
Bogers, E.A.I., Traffic Information and Learning in Day-to-day Route Choice, T2009/5, June 2009, TRAIL Thesis Series, the Netherlands
Amelsfort, D.H. van, Behavioural Responses and Network Effects of Time-varying Road Pricing, T2009/4, May 2009, TRAIL Thesis Series, the Netherlands
Li, H., Reliability-based Dynamic Network Design with Stochastic Networks, T2009/3, May 2009, TRAIL Thesis Series, the Netherlands
Stankova, K., On Stackelberg and Inverse Stackelberg Games & their Applications in the Optimal Toll Design Problem, the Energy Markets Liberalization Problem, and in the Theory of Incentives, T2009/2, February 2009, TRAIL Thesis Series, the Netherlands
Li, T., Informedness and Customer-Centric Revenue, T2009/1, January 2009, TRAIL Thesis Series, the Netherlands
Agusdinata, D.B., Exploratory Modeling and Analysis: A promising method to deal with deep uncertainty, T2008/17, December 2008, TRAIL Thesis Series, the Netherlands

Trail Thesis Series 185
Kreutzberger, E., The Innovation of Intermodal Rail Freight Bundling Networks in Europe: Concepts, Developments, Performances, T2008/16, December 2008, TRAIL Thesis Series, the Netherlands
Taale, H., Integrated Anticipatory Control of Road Networks: A game theoretical approach, T2008/15, December 2008, TRAIL Thesis Series, the Netherlands

186 Intelligent Belt Conveyor Monitoring and Control

![1 SERIES Belt Conveyor System B090 - Bett Sistemi Srl€¦ · CONVEYOR BELT DEVELOPMENT CALCULATION FORMULA Conveyor belt length = 300 + {[(L-94)-(2• Conveyor belt thick. )]•2}](https://static.fdocuments.in/doc/165x107/5ad3c4047f8b9a48398b7ae4/1-series-belt-conveyor-system-b090-bett-sistemi-conveyor-belt-development-calculation.jpg)