Integrity of Underground Piping William M. Shields, J.D ... · Overall conclusions: (a) failure...
58
William M. Shields, J.D., Ph. D. Department of Energy Fire Protection Workshop Oak Ridge, Tennessee April 2010
Transcript of Integrity of Underground Piping William M. Shields, J.D ... · Overall conclusions: (a) failure...

William M. Shields, J.D., Ph. D.Department of Energy Fire Protection Workshop
Oak Ridge, TennesseeApril 2010

“If an adequate municipal water supply is available, it
is generally the least costly and may be the most
reliable source for safety significant or safety class
systems ... since DOE has little control over the design
and operation of these systems, an analysis should be
made to ensure the municipal water system will
perform reliably in accordance with the DSA functional
and reliability requirements and DOE O 420.1B in a
manner that is equivalent to or exceeds that provided
by stand alone systems controlled by DOE.”
2
3
-- from Sec. 5.3.1, Interim Guidance on Design
and Operational Criteria for Water Supply
Systems Supporting Safety Class and Safety
Significant Fire Suppression Systems,
Milestone 5.3.1 Deliverable, Defense Nuclear
Facilities Safety Board Recommendation
2008-1, Safety Classification of Fire
Protection Systems.

4

Reliability and redundancy of sources (rivers, reservoirs, wells, etc.)
Soundness of underground pipingGridding, valving (alternate pathways)Maintenance and surveillance practicesFailure history Environmental factors (e.g. freezing) Rapidity of repairs
5
1. What does the published literature offer by way of methods to analyze the reliability of underground piping systems?
2. What does the published literature tell us about failure modes and rates in existing municipal water supply systems?
6
Doleac, Lackey & Bratton, “Prediction of Time-to-Failure For Buried Cast Iron Pipe,” American Water Works Association, 1980 Annual Conference Proceedings, pp. 31-38.
Theoretical failure model focused on corrosion and pitting of cast iron.
Empirical study of Vancouver, B.C., water system, installed in the late 1800s.
Downtown Vancouver served by 42 miles of cast iron pipe installed circa 1900.
7
Surveyed leak repair records, 11 years of water quality data, sampled soil at 200 locations, 20 locations chosen for excavation and examination of pipes.
Average internal metal loss ranged from 50-90 mils.
Average external loss was 65 mils, max observed was 170 mils.
8
Application of model to data suggested that main breaks would begin around 1995, at less than 1% of 200 sampled locations.
2% would break in the years 2010-2030. Remainder of sampled locations would break
after 2030, based on current corrosion trends.
9

10
Broken Water Main, Vancouver, 2009
Source: http://www.rosemerena.org/home/2009/10/16/pipe-replacement-in-vancouver-water-main-break-at-32nd-q-st/

Substantial report entitled: “Additional Federal Aid For Urban Water Distribution Systems Should Wait Until Needs Are Established.” (CED-81-17, Nov. 24, 1980)
Wide-ranging study of the deterioration of urban water supply systems, with focus on Boston, New Orleans and Washington D.C.
11

Points out that age and failure rate may not be directly linked: some old systems fail rarely, and some new ones frequently.
“[Louisville] mains installed from 1926 to 1930 failed nearly four times as often as those installed from 1862 to 1900.”
12

Complimentary papers published in the American Water Works Association (AWWA) Journal.
March issue: Walski & Pellicia, “Economic Analysis of Water Main Breaks,” pp. 140-147.
November issue: Kelly O’Day, “Organizing and Analyzing Leak and Break Data For making Main Replacement Decisions,” pp. 589-994.
13
Army Corps of Engineers asked by the State of New York to study Binghamton NY water supply system, in order to upgrade it at the lowest possible cost.
Corps funded a study to develop guidelines on which mains were most likely to break and hence should be replaced first.
Corps had already conducted a study of Manhattan’s system; this study was also a source or earlier data on other systems.
14
Authors develop an exponential relationship that is then modified by a “previous break factor”, “pipe size factor,” and “frost penetration effects factor.”
Data is fed into model to gauge which pipes are most likely to break in the next 20 years.
Using this approach, many pipes were found to be unlikely to break until at least 100 years old.
15

However, some sections of pipe – generally rather short – were identified as very likely to break in the near future.
Overall conclusions: (a) failure models need to consider corrosion, improper laying, impact, contact with other structures, freezing and frost loads.
Decisions to replace lengths of main hinge on both likelihood of failure and cost to repair.
16

Wide-ranging discussion of causes of main breaks, historical experience, previous studies, geographic analysis of leak and break patterns.
Central conclusion: replacement criteria should focus on physical condition of mains, not on age.
Geographic analysis of leaks and breaks may reveal sections of the system where pipe condition is poor, regardless of age.
17
Harry Hasegawa & Howard Lambert, “Reliability Study on the Lawrence Livermore National Laboratory Water Supply System,” Proc. of the First International Conference on Fire Safety Science.
Purpose of this PRA-oriented analysis was “to determine if an adequate supply of water would be available in the event of a major fire.”
18
Applied fault tree/event tree model to Livermore National Lab water supply system, looking for system vulnerabilities and common mode failures.
Used reliability data derived from past 15 years of operations.
19
Prediction: “inadequate water supply of water to extinguish a major fire on the average of 3.1 times per year.”
Demand unavailability calculated at 3.6x10(-4), which authors concluded “agreed reasonably well with the historical data.”
20

21

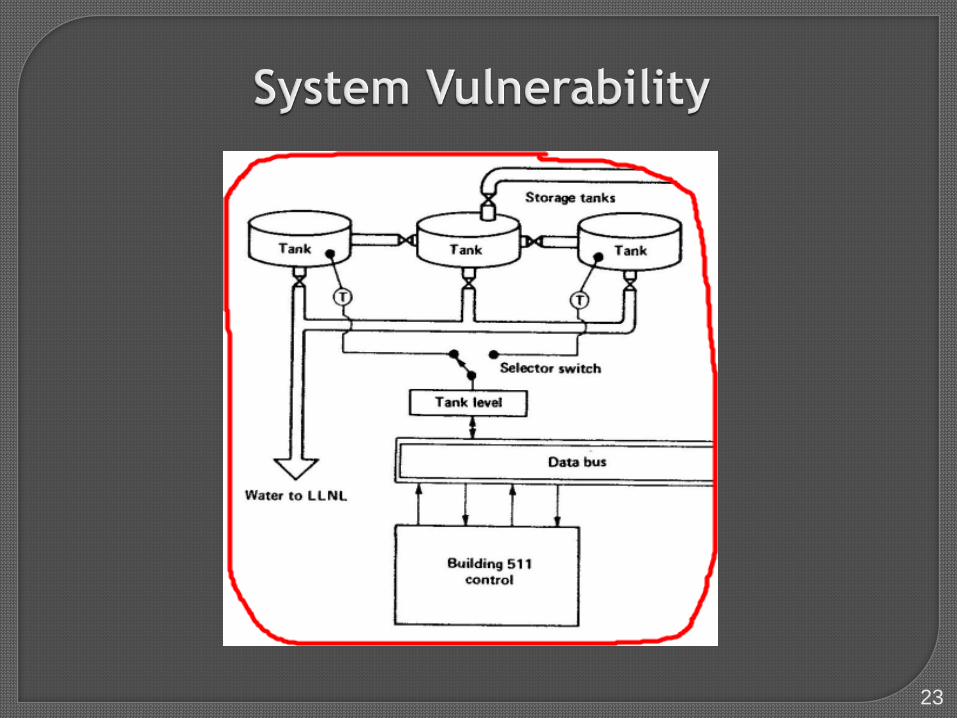
At one time, all three storage tanks had independent, continuous water level indication in the control room.
At the time of the study, a manual switch controlled level indication for Tank 1 or Tank 3 (Tank 2 is connected to pumps/standpipes).
Hence overall system capacity can only be known by operator regularly operating the switch to check levels in Tanks 1 and 3.
22
23
Authors recommended that each storage tank should have its own independent water-level sensor reading in the control room.
Mod would in their view reduce the probability of system unavailability by a factor of 50.
Audience question: was this modification pursued?
24

25
Compendium of Papers:Larry Mays, Ed., 1989.

Task Committee on Risk and Reliability Analysis of Water Distribution Systems formed by Dr. Mays (Univ. Texas Austin), sponsored by the American Society of Civil Engineers.
Held paper sessions at three major conferences in 1985, 1986, and 1988.
26

Purpose: “to present state-of-the-art methodologies and models for the reliability analysis and reliability-based design of water distribution systems.”
Despite its 21-year age, Mays’s book remains a central work in the field.
27

Some studies are highly theoretical and mathematical; others are largely empirical.
Deterministic and probabilistic methods are explored, though PRA methods are those of the 1980s.
Abundance of historical data and references to sources for additional data.
Many different models explored and applied.
Copies of this book are available—but rare.28

Ahammed & Melchers, “Reliability of Underground Pipelines Subject to Corrosion,” Journal of Transportation Engineering, Nov./Dec. 1994, pp. 989-1002.
Study devoted to corrosion effects (external and internal) on the strength of piping under external and internal loads.
Two part model: deterministic equations for stresses and loss of wall thickness, probabilistic approach for failure-time estimates.
29

Heavy-duty mathematics used to arrive at limit-state function giving the stress at which failure occurs:
Application of method to steel pipes buried under a roadway revealed that failure probability was closely tied to corrosion parameters—reducing corrosion rate could substantially extend the life of buried pipes.
30

Rajani and Makar, “A Methodology to Estimate Remaining Service Life of Grey Cast Iron Water Mains,” Canadian Journal of Civil Engineering, December 2000, pp. 1259-1272.
Authors assume that “primary cause of in-service pipe failures is corrosion pitting.”
Their model (deterministic) also considers thermal effects, frost-loading and traffic loads.
31

Model applied to hypothetical pipes.Field application would require either
measurements of pitting during maintenance activities or and NDTmethod for pipes in service.
Authors recommend that validation studies be undertaken in Canadian systems.
32

Kleiner and Rajani, “Comprehensive Review of Structural Deterioration of Water Mains: Physical Models,” Urban Water, Oct. 2001, pp. 151-164.
Kleiner and Rajani, “Comprehensive Review of Structural Deterioration of Water Mains: Statistical Models,” Urban Water, Oct. 2001, pp. 131-150.
Review articles covering previous 20 years of investigations into reliability and failure modes of underground water systems.
33

Summarizes factors leading to main breaks: corrosion (iron), deterioration (PVC, asbestos-cement and concrete), manufacturing defects, installation errors, stresses from frost and traffic.
Reviews numerous deterministic and probabilistic models in the literature.
Authors offer brief critique of each model. References are often to sources that would
otherwise be hard to locate.34

Same format and extensive references list as physical models paper.
Reviews numerous statistical models used to predict water main failures.
Deterministic and probabilistic approaches are covered.
Critiques provided for each model.
35

Most recent paper found is Wood and Lence, “Using Water Main Break Data to Improve Asset Management for Small and Medium Utilities: District of Maple Ridge, B.C.,” Journal of Infrastructure Systems, June 2009, p. 111-119.
Authors provide an overview of previous studies and analytical methods.
Main purpose is to assist a water utility to “gain insights about the rate of pipe breakage ... whether the quantity of expected breaks is increasing linearly or exponentially.”
36
Prediction model looks for data on pipe age, material and diameter; pipe lining; bedding and backfill material; pipe protection; pipe condition; soil type; traffic loading factors; depth of cover and type of overburden; normal operating pressure; and typical flow rates.
Model then applied to municipal water supply system for Laity View Community of Maple Ridge, B.C.
37

Maple Ridge’s population is 69,000. Laity View is a neighborhood of 6,000 served by water mains installed after 1959.
Laity View’s mains are a mixture of cast iron, ductile iron and steel, and asbestos cement.
Diameters used are 150, 200, and 250 mm. (6 inches, 8 inches, 10 inches).
Break data available for 1983-2004; 54 breaks in this period, seven after 2000.
38

Pipes were grouped by age, material, diameter. Time-linear and time-exponential equations
applied to break data. In general, time-linear analysis corresponded
with data much better than time-exponential. High break rates are predicted for 250-mm
asbestos-cement pipes installed in clay soil 1960-1969 and for 150-mm asbestos-cement pipes installed in clay soil 1970-1974.
39

Adding soil type data to the model’s application reduced the model error for many pipe groups.
Importance of soil type emphasized need to re-examine bedding and backfilling practices; led to changes in construction specs and inspection practices.
Assessment and break data demonstrated that old cast iron pipes may be far less likely to rupture than newer asbestos-cement pipes laid in clay soils.
40

Larry Mays, Ed., Urban Water Supply Handbook, McGraw-Hill, 2002.
Chapter 10: “Reliability and Availability Analysis of Water Distribution Systems,” by Larry Mays, Kevin Lansey, and Y.K. Tung, pp. pp. 10.1-10.40.
Comprehensive review of literature, models, data. Offers clear exposition of mathematical framework
for analyzing time-to-failure. Discussion of “availability,” which can be defined as
“percentage of time the system is in operating condition within a specified time period.”
41

Also introduces the concept of “hydraulic availability,” defined as “the ability of the system to provide an acceptable level of interruption in spite of abnormal conditions.”
This approach focuses on required minimum pressure delivered by a supply system at one point despite a break somewhere else.
This methodology is applied to the Tucson water supply system, using two sets of pipe failure rates (Tucson’s and St. Louis’s.)
42

General conclusion: “… the above discussion might indicate that the problem of assessing and measuring reliability in water distribution networks has been essentially solved. However, this is clearly not the case. It is generally accepted in the literature… that there is currently no method or measure for assessment of reliability that is both comprehensive in its interpretation of reliability and computationally practical.”
43

Robert Zalosh, Industrial Fire Protection Engineering, Wiley 2003.
Covers water supply reliability at pp. 38-41.
Very good summary of previous work, including references to Livermore study, O’Day papers, Walski and Pellicia.
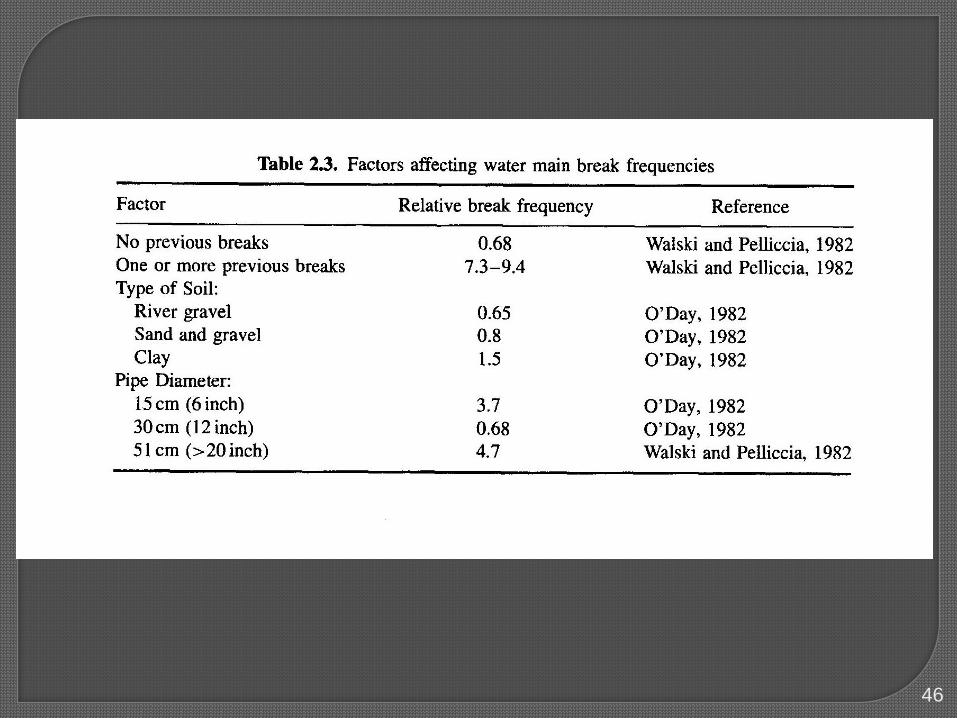
Useful tables of break frequencies and factors causing breaks.
44

45
46

Works an informative example: loss of water main during 1965 Cambridge warehouse fire ($1 million loss in 1965 dollars.)
Arrives at water supply failure probability between 3.6 x 10(-5) and 5.6 x 10(-4).
In his view, this probability is “low, but not sufficiently low to ignore the possibility of losing water access, particularly in view of the consequences that actually occurred.”
47

Zalosh asks: “How large can the probability of public water supply being unavailable be before it significantly degrades plant fire protection?”
In the Cambridge case, the calculated water supply failure probability was “two to three orders of magnitude smaller than the total probability of a sprinkler system failing to control the fire…[T]herefore this failure mode would not have been an important factor in [warehouse] site selection.”
48

However…the data tables show that failure probabilities of some cities’ mains are two orders of magnitude higher than Cambridge.
This is especially true in areas where large numbers of breaks have already occurred.
“In those cases, public water supply unavailability can significantly decrease the probability of successfully controlling a fire.”
49
Recent failure history—say past 20 years—when carefully analyzed, will yield a good estimate of reliability and probability of pipe failure.
Some portions of some municipal water piping systems are very unlikely to experience breaks or severe leaks compromising system function.
These high-reliability systems or portions of systems may be very old (≈ 100 years).
50
Some portions of some municipal water supplies are likely to experience breaks or leaks potentially compromising system functions.
These low-reliability systems or portions of systems may be old or new, cast iron, steel, PVC, or asbestos cement.
51

Old systems may be experiencing end-of-life deterioration from corrosion and other effects.
Newer systems may be failing due to poor QA of materials, faulty installation, soil issues, frost effects, or increased loading from traffic.
52

The published literature offers a range of analytical models applicable to estimating the reliability of underground water supply systems (municipal or private).
No one model is viewed as “definitive.” While one could use an “off-the-shelf”
model, study of the literature would also support developing a hybrid model suitable for specific DOE/contractor needs.
53

Reliability and redundancy of sources (rivers, reservoirs, wells, etc.)
Soundness of underground piping Gridding, valving (alternate pathways) Maintenance and surveillance practices Failure history Environmental factors (e.g. freezing) Rapidity of repairs
54

Reliability and redundancy of sources: need to analyze likelihood of low volume (e.g.,drought), large main failures reducing redundancy, loss of sources due to earthquakes.
Gridding, valving: multiple interconnections and shutoffs can compensate for main failures; lack of these features lowers system’s ability to compensate for pipe breaks.
55

Maintenance and surveillance: active and focused program can in some measure compensate for pipe breaks; poor program will work in opposite direction.
Rapidity of repairs: demonstrated ability to quickly repair breaks or serious leaks can compensate for lack of gridding and valving; slow response lowers system availability.
56

1. Municipal systems can be shown to be a highly reliable source of water for safety applications in DOE facilities.
2. The supporting analysis must take into account likelihood of pipe failures (based on history and predictive studies) as well as a other factors that may be positive or negative.
57

William M. Shields, J.D., Ph. D.Department of Energy Fire Protection Workshop
Oak Ridge, TennesseeApril 2010