Integration Study for Stabilized Grid Operation in Andaman ...
76
Integration Study for Stabilized Grid Operation in Andaman and Nicobar Islands
Transcript of Integration Study for Stabilized Grid Operation in Andaman ...
Integration Study for Stabilized Grid Operation in Andaman and
Nicobar Islands

Integration Study for Stabilized Grid Operation in Andaman and
Nicobar Islands
ii
© THE ENERGY AND RESOURCES INSTITUTE, 2020
All rights reserved. No part of this publication may be reproduced, stored in a retrieval system, or transmitted, in any form or by any means, without prior permission in writing to The Energy and Resources Institute, New Delhi, India, or as expressly permitted by law, or under terms agreed with the appropriate organizations. Enquiries concerning reproduction should be sent to the address:The Energy and Resources InstituteDarbari Seth Block, India Habitat Centre, Lodhi Road, New Delhi – 110 003, India
DISCLAIMER
This report is the work product of an employee or a group of employees of various organizations, institutes, departments of the Government of India and non-government organizations. However, the statements, opinions, or conclusions contained herein are those of the authors and do not necessarily represent the statements, opinions, or conclusions of the Government of India or their affiliated organizations or institutes.
SUGGESTED FORMAT FOR CITATION
Muddineni Kapil, Vijay Barthwal, and Dhingra Sunil. 2020. Integration study for stabilized grid operation in Andaman and Nicobar Islands. New Delhi: The Energy and Resources Institute.
Name of the Partner Organization#1Electricity Department, Andaman and Nicobar Administration
Editorial and designMuskaan Johri and Sudeep Pawar, TERI Press
PUBLISHED BY
The Energy and Resources Institute (TERI)
FOR MORE INFORMATIONProject Monitoring Cell, TERI, Darbari Seth Block, IHC Complex, Lodhi Road, New Delhi 110 003, IndiaTel.: +91 11 2468 2100 or 2468 2111 | Fax: +91 11 2468 2144 or 2468 2145Email: [email protected] | Web: www.teriin.org

Table of Contents
Project Team xiii
Acknowledgements xv
List of Abbreviations xvii
Executive Summary 1
1. Electricity in Andaman and Nicobar Islands 5
1.1 Background 5
1.2 Current Status of Power in South Andaman 5
1.3 Future planning in South Andaman 5
1.4 Study objectives 6
2. Approach and Methodology 7
2.1 Literature review 7
2.2 Site visits, data collection, and analysis 7
2.3 Power sharing between multiple plants 8
2.4 Load flow analysis 8
3. Literature review 9
3.1 Electricity supply in South Andaman 9
3.2 Current status of power houses in South Andaman 10
3.3 Transition towards renewables 11
3.4 Network operations and management 12
3.5 Challenges 14
4. Data Collection and Analysis 15
4.1 Key parameters 15
4.2 Network Configuration 16
4.3 Generation profiles 16
4.4 Simulation scenarios 18
5. Load Flow Analysis 21
5.1 Assumptions 21
5.2 Network Modelling 21
5.3 Present Case 23
5.4 Future case 29

6. Key Interventions for Grid Management in Andaman Islands 33
6.1 Grid code for islands 33
6.2 Dispatch schedule optimization algorithm 33
6.3 Three-part generation tariffframework 34
6.4 Differential tariff during solar and non-solar hours 35
6.5 Frequency response 37
7. Study Findings, Gaps, and Proposed Interventions 39
Appendix A: Layout Diagram of South Andaman Network 41
Appendix B: Specifications of Network Elements 42
Appendix C: Feeder loading 43
Appendix D: Additional Simulation Results 45
Appendix E: Assumptions Taken in Estimating the Cost of Generation 50
Appendix F: Category-wise Tariff for Andaman and Nicobar(2019-20) 52
Appendix G: An Illustration of three part generation tariff 55
Appendix H: Stakeholder consultations 56
References 59

List of Figures
Figure 2.1. Approach and methodology 7
Figure 3.1. Annual energy generation pattern of all power plants in South Andaman 9
Figure 4.1. Summary of key parameters 15
Figure 4.2. List of key technical parameters 15
Figure 4.3. Simplified single-line diagram of the South Andaman network 16
Figure 4.4. Graph of daily peak demand and daily electricity generation 17
Figure 4.5. Monthly generation profiles of all the power plants 17
Figure 4.6. Graph showing monthly total generation profile 18
Figure 5.1. Single-line diagram of the present network 22
Figure 5.2. Minute-level variability assumed for solar and load 22
Figure 5.3. Graph of power sharing between generators in ‘hourly variation and Phoenix Bay Power House as slack generator’ for September 23
Figure 5.4. Map of the network showing loading and voltage levels in ‘hourly variation and Phoenix Bay Power House as slack generator’ for September 24
Figure 5.5. Power sharing and network loading in ‘hourly variation and HPP-2 as slack generator’ for April 24
Figure 5.6. Power sharing and network loading in ‘hourly variation and Phoenix Bay Power House as slack generator’ for April 25
Figure 5.7. Power sharing and network loading in ‘hourly variation and dispatch based on inertia’ for September 25
Figure 5.8. Power sharing and network loading in ‘hourly variation and dispatch-based distributed slack’ for April 26
Figure 5.9. Single-line diagram of future network with LNG and PV 29
Figure 5.10. Single-line diagram of future network with diesel generator and photovoltaic 29
Figure 5.11. Simulation results for future scenarios with LNG and photovoltaic for April 30
Figure 5.12. Simulation results of various future scenarios with diesel generators and photovoltaic for April 31
Figure 6.1. Schematic illustrating the optimum power dispatch in island power system 34
Figure 6.2. Results of revenue gap calculations under various solar-use scenarios 37
Figure 6.3. Resources contributing to frequency management in a control area 37
Figure A.1. Layout of South Andaman network 41
Figure D.1: Map of a network showing loading and voltage levels in ‘hourly variation and Phoenix Bay Power House as slack generator’ for April 45
Figure D.2: Power sharing and network loading in ‘hourly variation and HPP-2 as slack generator’ for September 45
Figure D.3: Power sharing and network loading in ‘hourly variation and Phoenix Bay Power House as slack generator’ for September 46
Figure D.4: Power sharing and network loading in ‘hourly variation and dispatch based on inertia’ for April 46
Figure D.5: Power sharing and network loading in ‘hourly variation and dispatch-based distributed slack’ for September 47
Figure D.6: Graphs of power for future scenarios with LNG and PV for April 47
Figure D.8: Graphs of power of various future scenarios with diesel generators and PV for April 48
Figure D.7: Graphs of power for future scenarios with LNG and PV for September 48
Figure D.9: Graphs of power of various future scenarios with diesel generators and PV for September 49
Figure E.1. Assumed fuel consumption characteristics of a diesel generatorset 51
Figure G.1: Sample Interchange Rate Curve for Andaman 55
Photos taken during interactions with ED officials 56
Photos taken during site visits with officials at substations and power plant operators 57
List of Tables
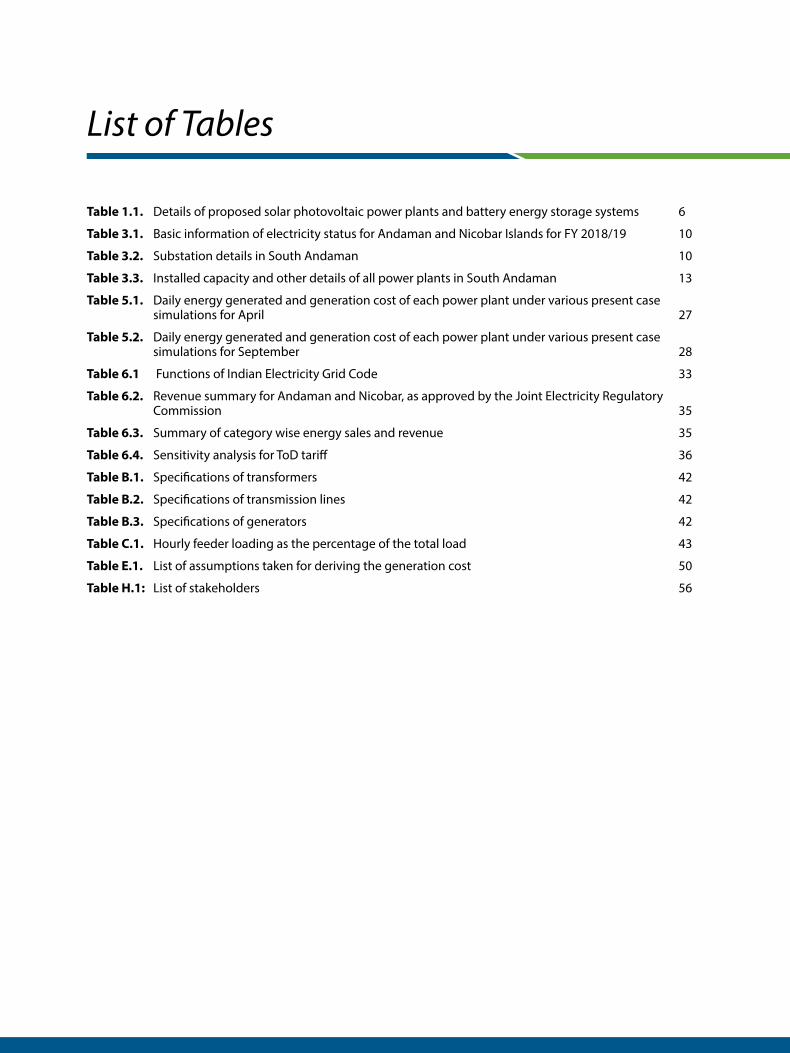
Table 1.1. Details of proposed solar photovoltaic power plants and battery energy storage systems 6
Table 3.1. Basic information of electricity status for Andaman and Nicobar Islands for FY 2018/19 10
Table 3.2. Substation details in South Andaman 10
Table 3.3. Installed capacity and other details of all power plants in South Andaman 13
Table 5.1. Daily energy generated and generation cost of each power plant under various present case simulations for April 27
Table 5.2. Daily energy generated and generation cost of each power plant under various present case simulations for September 28
Table 6.1 Functions of Indian Electricity Grid Code 33
Table 6.2. Revenue summary for Andaman and Nicobar, as approved by the Joint Electricity Regulatory Commission 35
Table 6.3. Summary of category wise energy sales and revenue 35
Table 6.4. Sensitivity analysis for ToD tariff 36
Table B.1. Specifications of transformers 42
Table B.2. Specifications of transmission lines 42
Table B.3. Specifications of generators 42
Table C.1. Hourly feeder loading as the percentage of the total load 43
Table E.1. List of assumptions taken for deriving the generation cost 50
Table H.1: List of stakeholders 56

xii

xiii
Project Team
ADVISORS
TEAM LEAD TECHNICAL TEAM
Sunil Dhingra Kapil Muddineni Vijay Barthwal
TECHNICAL TEAM
Dr Ashvini Kumar Girish Sethi
Richa Singh Sandeep Thakre

xiv

xv
Acknowledgements
This research has been made possible through the research grant provided by the MacArthur Foundation. We are grateful to the MacArthur Foundation for the same.
The research team received full support from the Electricity Department, Andaman and Nicobar Islands and gratefully acknowledge the same. Special mention is made for Mr Uttam Kumar Paul, Ex-Superintending Engineer, Mr Bernard Ajit, Superintending Engineer, and Mr Vivek Goel, Chief Engineer, CEA for the encouragement and guidance during the course of the study.
The research team also gratefully acknowledges the cooperation and support extended by Mr Karuna Jaydhar, Executive Engineer, Ms Madhuri Shukla, Executive Engineer, NRSE, Mr Yogesh Tiwari, Additional Engineer (Planning), and other officials at various levels for facilitating the study through in-depth discussions and inputs. The help from Mr Vinay Sandesh, Junior Engineer and other officials of Electricity Department, Andaman and Nicobar Islands is gratefully acknowledged for facilitating the research work.
Support and guidance of Mr K Ramanathan, Distinguished Fellow, Electricity and Fuels Division, TERI, Mr A K Saxena, Senior Director, Electricity and Fuels, TERI, Er. Alekhya Datta, Fellow and Area Convenor, Electricity and Fuels Division, TERI, and Mr S Narayan Kumar, Fellow, Electricity and Fuels Division, TERI, is also gratefully acknowledged.

xvi

xvii
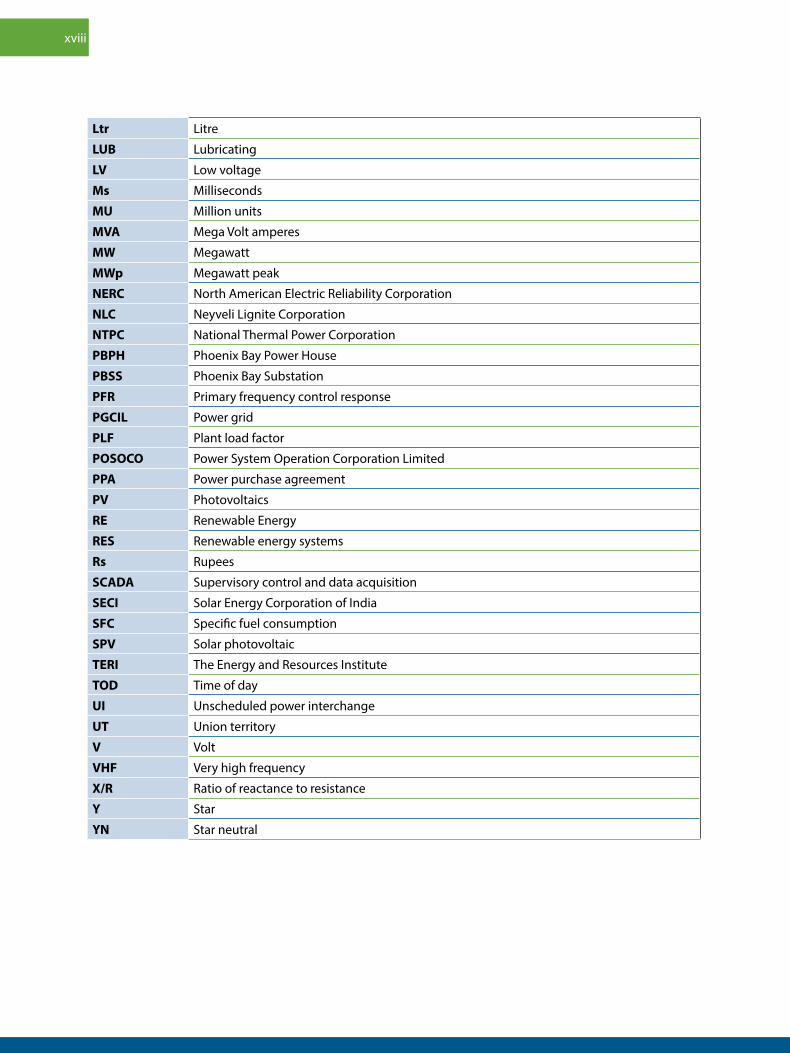
List of Abbreviations
A&N Andaman and Nicobar
ABT Availability-based tariff
AcoS Average cost of supply
AGC Automatic generation control
BESS Battery energy storage system
CEA Central Electricity Authority
CERC Central Electricity Regulatory Commission
CFA Central financial assistance
CPH Chatham Power House
Cr Crore
CSC Common service centre
DG Diesel generator
DSM Deviation settlement mechanism
ED Electricity department
EMC Energy Management Centre
ESS Energy storage systems
FFR Fast frequency response
FSRU Floating storage regasification unit
GoI Government of India
GSS Garacharma Substation
HPP Hiring power plants
HSD High speed diesel
HT High tension
HV High voltage
Hz Hertz
IEGC Indian Electricity Grid Code
INR Rupees
IPP Independent power producer
IR Inertial response
JERC Joint Electricity Regulatory Commission for the state of Goa and union territories
kV KiloVolt
kVA Kilo-Volt amperes
kW Kilowatt
kWh Kilowatt hour
LED Light-emitting diode
LNG Liquefied natural gas
LT Low tension
xviii
Ltr Litre
LUB Lubricating
LV Low voltage
Ms Milliseconds
MU Million units
MVA Mega Volt amperes
MW Megawatt
MWp Megawatt peak
NERC North American Electric Reliability Corporation
NLC Neyveli Lignite Corporation
NTPC National Thermal Power Corporation
PBPH Phoenix Bay Power House
PBSS Phoenix Bay Substation
PFR Primary frequency control response
PGCIL Power grid
PLF Plant load factor
POSOCO Power System Operation Corporation Limited
PPA Power purchase agreement
PV Photovoltaics
RE Renewable Energy
RES Renewable energy systems
Rs Rupees
SCADA Supervisory control and data acquisition
SECI Solar Energy Corporation of India
SFC Specific fuel consumption
SPV Solar photovoltaic
TERI The Energy and Resources Institute
TOD Time of day
UI Unscheduled power interchange
UT Union territory
V Volt
VHF Very high frequency
X/R Ratio of reactance to resistance
Y Star
YN Star neutral

1
Executive Summary
The Andaman and Nicobar (A&N) islands represent an archipelago of around 572 islands in the Bay of Bengal of which only 37 islands are inhabited. The power distribution system of the A&N Islands is a ‘stand-alone system’, with each island having its own distribution system. The islands are dependent on diesel-generated power, which is both costly and a source of pollution. Keeping view of this, the island administration, with the help of the Government of India (GoI), has envisaged large-scale penetration of renewable energy sources in the islands. The largest section of the electrical network is located at Port Blair. An action plan has also been chalked out to install i) grid-connected rooftop and ground-mounted solar systems along with battery energy storage system (BESS); and ii) liquefied natural gas (LNG)-based power plants by 2022.
In order to undertake the study, the project team conducted site visits with an aim to understand the challenges in grid operations in the region. As per the information gathered, the details of the various generating stations are as follows:
Generating Station Installed Capacity (MW)
Continuous Capacity (MW)
Monthly Energy Generation (MU)
Diesel generators
Own generation
Chatham Power House 7.5 1.44
Phoenix Bay Power House 10.8 1.74
Power purchase plants
HPP-1 5 5 2.94
HPP-2 10 10 5.85
HPP-3 5 5 3.5
HPP-4 10 10 5.85
Subtotal 48.3
Renewable power plants
5 MW solar plant in Garacharma 5 6 (annually)
Other solar plant in different locations (rooftop and ground mounted)
1
Subtotal 6
Total 60.3
Summary of power plants in South AndamanVarious power plants in South Andaman are linked with 33 kV transmission line network in mesh configuration. The transmission lines are double circuited to ensure reliability. The challenges faced by the electricity department are reported in different categories, namely, technical, operational, and financial. As per the present strategy, hiring power plants are contracted to meet the monthly energy generation and capacity requirements in peak hours as per specific terms and conditions. Power plants operated by the electricity department supply balance
2
of power to meet the system’s demand and maintain the grid in the region. In the event of any mismatch between generation and demand, grid voltage and frequency vary and leads to generators moving out of the system, resulting in blackouts.
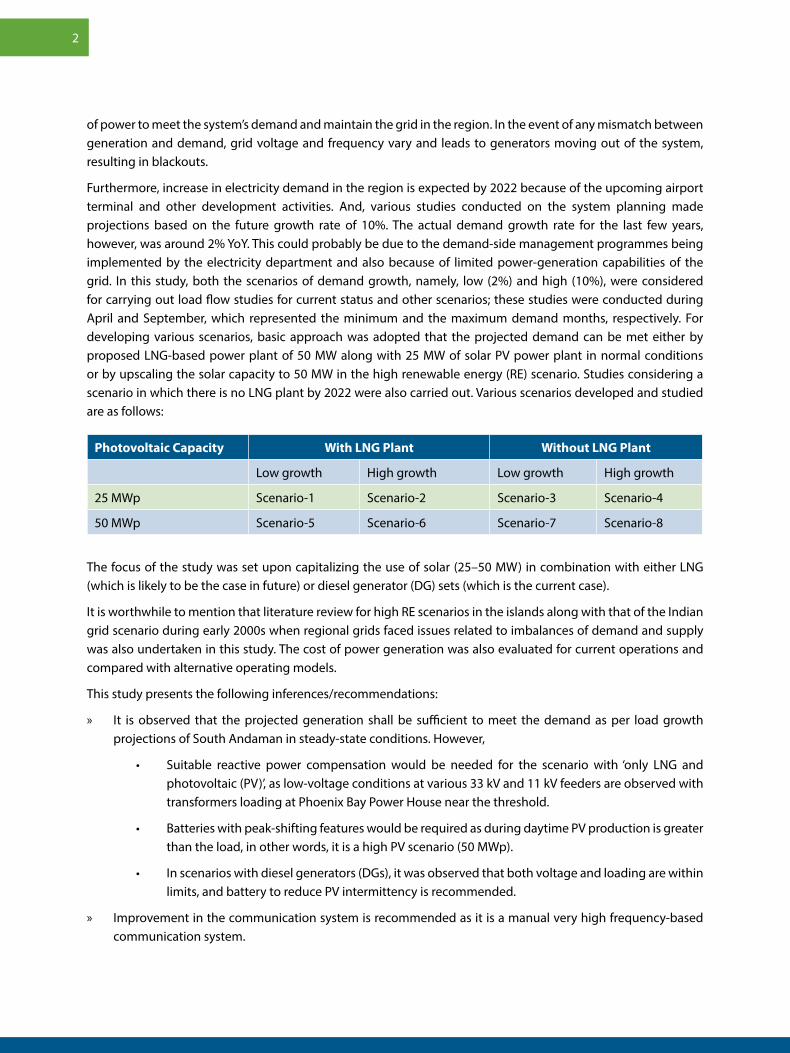
Furthermore, increase in electricity demand in the region is expected by 2022 because of the upcoming airport terminal and other development activities. And, various studies conducted on the system planning made projections based on the future growth rate of 10%. The actual demand growth rate for the last few years, however, was around 2% YoY. This could probably be due to the demand-side management programmes being implemented by the electricity department and also because of limited power-generation capabilities of the grid. In this study, both the scenarios of demand growth, namely, low (2%) and high (10%), were considered for carrying out load flow studies for current status and other scenarios; these studies were conducted during April and September, which represented the minimum and the maximum demand months, respectively. For developing various scenarios, basic approach was adopted that the projected demand can be met either by proposed LNG-based power plant of 50 MW along with 25 MW of solar PV power plant in normal conditions or by upscaling the solar capacity to 50 MW in the high renewable energy (RE) scenario. Studies considering a scenario in which there is no LNG plant by 2022 were also carried out. Various scenarios developed and studied are as follows:
Photovoltaic Capacity With LNG Plant Without LNG Plant
Low growth High growth Low growth High growth
25 MWp Scenario-1 Scenario-2 Scenario-3 Scenario-4
50 MWp Scenario-5 Scenario-6 Scenario-7 Scenario-8
The focus of the study was set upon capitalizing the use of solar (25–50 MW) in combination with either LNG (which is likely to be the case in future) or diesel generator (DG) sets (which is the current case).
It is worthwhile to mention that literature review for high RE scenarios in the islands along with that of the Indian grid scenario during early 2000s when regional grids faced issues related to imbalances of demand and supply was also undertaken in this study. The cost of power generation was also evaluated for current operations and compared with alternative operating models.
This study presents the following inferences/recommendations:
» It is observed that the projected generation shall be sufficient to meet the demand as per load growth projections of South Andaman in steady-state conditions. However,
• Suitable reactive power compensation would be needed for the scenario with ‘only LNG and photovoltaic (PV)’, as low-voltage conditions at various 33 kV and 11 kV feeders are observed with transformers loading at Phoenix Bay Power House near the threshold.
• Batteries with peak-shifting features would be required as during daytime PV production is greater than the load, in other words, it is a high PV scenario (50 MWp).
• In scenarios with diesel generators (DGs), it was observed that both voltage and loading are within limits, and battery to reduce PV intermittency is recommended.
» Improvement in the communication system is recommended as it is a manual very high frequency-based communication system.

3
» Renovation and modernization of the distribution network is needed to revisit the long distance distribution lines.
» It is recommended to develop a grid code for the islands, which may include, among others, renewable energy generation and demand forecasting on daily basis. A Renewable Energy Management Centre is already planned for the Andaman Islands, which may be considered for assigning this task. This would facilitate preparation of a daily schedule on a 15-min basis in the day ahead based on the projected demand, solar generation, and availability of other generators. Planning of the day-ahead scheduling is important as it is observed that the operating cost of diesel/LNG generator could be minimized when solar power is used as much as possible; the total energy excess or deficiency due to forecasting error is fully compensated by energy storage systems (ESS). However, the ESS must provide fast frequency response if a generator is tripped.
» Generators and loads may be suitably incentivized to maintain frequency within the operating band during real-time operation, which may include a three-part tariff for the generators and a time-of-day tariff for consumers.

4

Chapter 1
1. Electricity in Andaman and Nicobar Islands
1.1 BackgroundAndaman and Nicobar (A&N) Islands represent an archipelago of around 572 islands in the Bay of Bengal of which only 37 islands are inhabited. The islands’ maximum population are distributed in the north, middle, and south Andaman. In the Nicobar Islands, the most densely populated island is the Car Nicobar group of islands. The weather in the A&N Islands is mainly tropical with the monsoon season lasting for more than 180 days in a year. Relative humidity on the islands ranges between 70% and 90% for most part of the year.
South Andaman Island is the southernmost island of the Great Andaman, is the third largest in the group, and is home to the majority of the population of the Andaman Islands. According to the 2011 census, it had population of 238,142, while the total population in the entire A&N Islands was 379,944 [1]. Port Blair, the capital of the islands, is located on the southern part of this island. Other big cities in the island are Bambooflat, Prothrapur, and Garacharma. The largest section of the electrical network is located in South Andaman.
1.2 Current Status of Power in South AndamanThe electricity department of A&N administration (ED) is responsible for managing the electricity supply in the islands. Since the islands are disconnected from the mainland India and with each other, the power generation and distribution system of A&N Islands is served by a stand-alone system and each island has its own generation and distribution system. The islands are dependent on diesel-generated power, which is costly, generates pollution, and affects energy security. Keeping view of this, the island administration with the help of the Government of India (GoI) envisaged large-scale penetration of renewable energy (RE) sources in the islands.
In Port Blair, the ED provides electricity to about 91,863 consumers through two power houses of 18.3 MW capacity (7.5 MW capacity of Chatham Power House and 10.8 MW of Phoenix Bay Power House), four hiring power plants of 30 MW capacity (two hiring power plants, that is, 10 MW run by M/S Sudhir Ready Gensets, New Delhi, 5 MW of New Bharat, Mumbai, and other two hiring power plants run by National Thermal Power Corporation Limited), and a 6 MW solar power plant (rooftop and ground mounted) with a total installed capacity of 60.3 MW. The solar photovoltaic (PV) power plant helps to reduce diesel consumption in Port Blair. The plant does not have any battery backup, due to which solar-generated power is only available during daytime and that too with significant variation owing to frequent cloudy conditions.
1.3 Future planning in South AndamanA&N Islands fulfil 10% of their energy requirement through RE sources, which comprise small hydro and solar power plants. A&N administration intends to achieve 25% of the energy generation through RE sources by the end of 2022.

6
The A&N administration with the help of the GoI planned to install 50 MW of additional solar capacity with 20 MW/20 MWh of battery energy storage (BESS) by 2019–20 (details given in Table 1.1) and 50 MW liquefied natural gas (LNG)-based power plant with floating storage regasification unit by 2020-21. Currently, a 5 MWp ground-mounted solar PV plant and 1 MWp of solar rooftop capacity are in operation since April 2014. Also, it was observed that the frequent phenomenon of intermittent weather changes in these islands has a serious impact on power generation, grid stability, and other issues that arise in grid operation.
1.4 Study objectivesThe broad objective of this study is to carry out a grid integration study considering various power supply options, including solar plants with battery energy storage, solar rooftop, LNG-based power plant, and diesel generators, and varying demand by 2022. This study consists of the following two parts:
i. A grid integration study considering various supply options, including solar plants with battery energy storage, solar rooftop, LNG-based power plant, and diesel generators, and varying demand by 2022 for South Andaman.
ii. Develop optimal power dispatch strategy for effective utilization of all the available generators so as to meet the present and future demands.
Table 1.1. Details of proposed solar photovoltaic power plants and battery energy storage systems
RE Projects Developer Capacity BESS
SPV plant, AttamPahad NLC 20 MW 8 MW, 8 MWh
SPV plant, Chidiyatapu NTPC 8 MW 3.2 MW, 3.2 MWh
SPV plant, Manglutan 17 MW 6.8 MW, 6.8 MWh
BESS for existing SPV 2 MW, 2 MWh
Rooftop SPV SECI 3 MW NIL
Rooftop SPV (on residential buildings) ED 2 MW NIL
Total solar 50 MW 20 MW, 20 MWhBESS: Battery energy storage system; ED: Electricity department; MWh: Megawatt hour; NLC: Neyveli Lignite Corporation; NTPC: National Thermal Power Corporation; RE: Renewable energy; SECI: Solar Energy Corporation of India; SPV: Solar photovoltaic
2. Approach and Methodology
Chapter 2
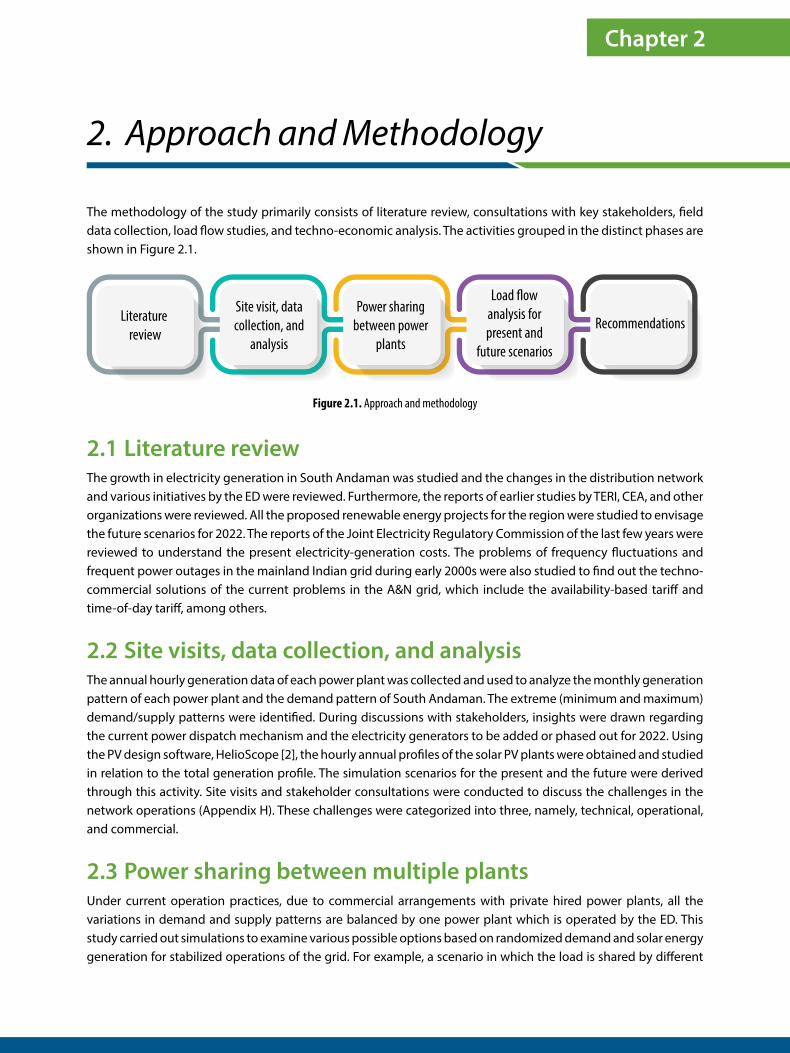
The methodology of the study primarily consists of literature review, consultations with key stakeholders, field data collection, load flow studies, and techno-economic analysis. The activities grouped in the distinct phases are shown in Figure 2.1.
Figure 2.1. Approach and methodology
2.1 Literature reviewThe growth in electricity generation in South Andaman was studied and the changes in the distribution network and various initiatives by the ED were reviewed. Furthermore, the reports of earlier studies by TERI, CEA, and other organizations were reviewed. All the proposed renewable energy projects for the region were studied to envisage the future scenarios for 2022. The reports of the Joint Electricity Regulatory Commission of the last few years were reviewed to understand the present electricity-generation costs. The problems of frequency fluctuations and frequent power outages in the mainland Indian grid during early 2000s were also studied to find out the techno-commercial solutions of the current problems in the A&N grid, which include the availability-based tariff and time-of-day tariff, among others.
2.2 Site visits, data collection, and analysisThe annual hourly generation data of each power plant was collected and used to analyze the monthly generation pattern of each power plant and the demand pattern of South Andaman. The extreme (minimum and maximum) demand/supply patterns were identified. During discussions with stakeholders, insights were drawn regarding the current power dispatch mechanism and the electricity generators to be added or phased out for 2022. Using the PV design software, HelioScope [2], the hourly annual profiles of the solar PV plants were obtained and studied in relation to the total generation profile. The simulation scenarios for the present and the future were derived through this activity. Site visits and stakeholder consultations were conducted to discuss the challenges in the network operations (Appendix H). These challenges were categorized into three, namely, technical, operational, and commercial.
2.3 Power sharing between multiple plantsUnder current operation practices, due to commercial arrangements with private hired power plants, all the variations in demand and supply patterns are balanced by one power plant which is operated by the ED. This study carried out simulations to examine various possible options based on randomized demand and solar energy generation for stabilized operations of the grid. For example, a scenario in which the load is shared by different
Literature review
Site visit, datacollection, and
analysis
Power sharingbetween power
plants
Load �owanalysis forpresent and
future scenarios
Recommendations

8
generators and there are solar PV plants with a must-run status (with continuous variation in solar irradiation) was analysed. For this, the literature review of response characteristics was also conducted.
2.4 Load flow analysisThe network consisting of 33 kV transmission lines to 11 kV feeders is modeled for simulation using a power system software, PowerFactory-DIgSILENT [3], based on the single-line diagram collected from the ED. Technical parameters collected during the site visits and literature review were used to configure the simulation model. Scenarios for the present and for 2022 were configured on the model and simulations at 1-min intervals were conducted. The results of these simulations were analyzed to understand energy supply mix and the nature of power flow (which includes voltage levels, transformer loading, line loadings, and power generated from individual power plants). The simulation results of load flow analysis present an understanding on the nature of power flows; these results point towards the sections of the network that would need attention in the near future (2022) in order to cater to the rise in demand and the change in supply mix.
This chapter covers the literature review of various studies on electricity consumption and feasibility of transition towards renewables. The challenges faced in the current network are detailed into the following categories: operational, technical, and commercial.
3. Literature review
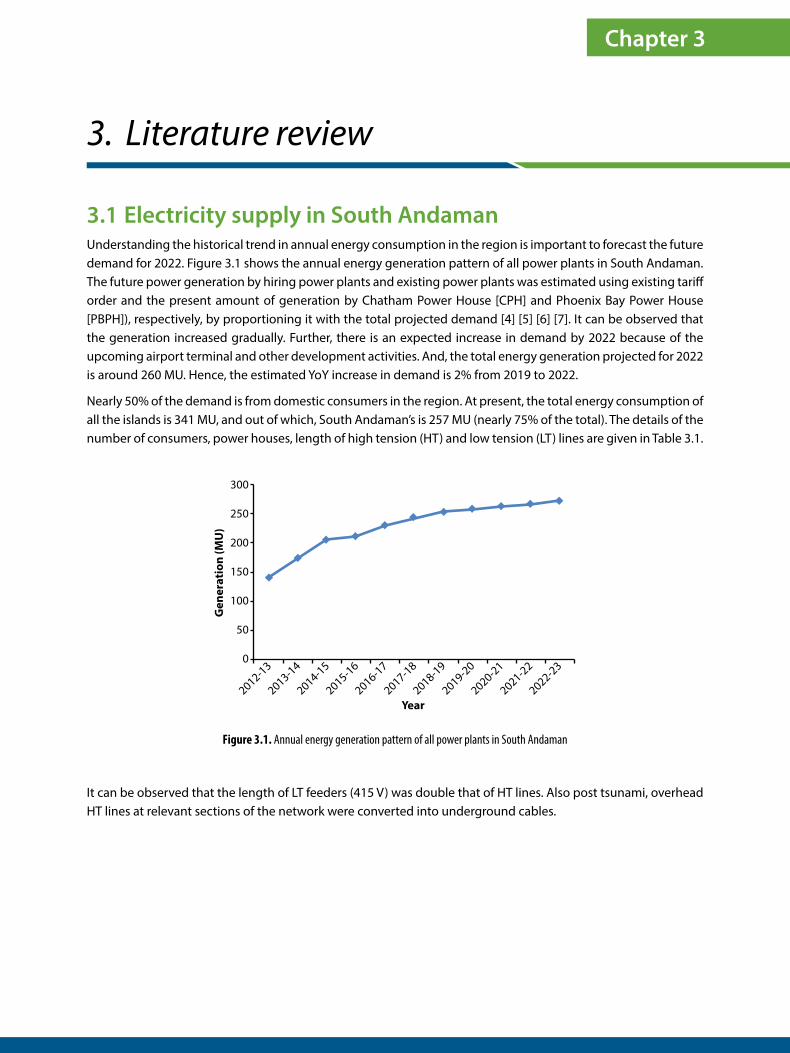
3.1 Electricity supply in South AndamanUnderstanding the historical trend in annual energy consumption in the region is important to forecast the future demand for 2022. Figure 3.1 shows the annual energy generation pattern of all power plants in South Andaman. The future power generation by hiring power plants and existing power plants was estimated using existing tariff order and the present amount of generation by Chatham Power House [CPH] and Phoenix Bay Power House [PBPH]), respectively, by proportioning it with the total projected demand [4] [5] [6] [7]. It can be observed that the generation increased gradually. Further, there is an expected increase in demand by 2022 because of the upcoming airport terminal and other development activities. And, the total energy generation projected for 2022 is around 260 MU. Hence, the estimated YoY increase in demand is 2% from 2019 to 2022.
Nearly 50% of the demand is from domestic consumers in the region. At present, the total energy consumption of all the islands is 341 MU, and out of which, South Andaman’s is 257 MU (nearly 75% of the total). The details of the number of consumers, power houses, length of high tension (HT) and low tension (LT) lines are given in Table 3.1.
Figure 3.1. Annual energy generation pattern of all power plants in South Andaman
It can be observed that the length of LT feeders (415 V) was double that of HT lines. Also post tsunami, overhead HT lines at relevant sections of the network were converted into underground cables.
Chapter 3
300
250
200
150
100
50
0
2012-13
2013-14
2014-15
2015-16
2016-17
2017-18
2018-19
2019-20
2020-21
2021-22
2022-23
Year
Gen
erat
ion
(MU
)
10
Table 3.1. Basic information of electricity status for Andaman and Nicobar Islands for FY 2018/19
S. No.
Description Units Region Total
South Andaman
Middle and North Andaman
Nicobar
1 Power house Nos 16 13 25 54
2 Consumers Nos 91,863 33,095 10,013 134,971
3 33 kV HT line Km 230.06 77 - 307.06
4 11 kV HT line Km 304.57 212.60 219.20 736.37
5 415 V LT line Km 1466.17 814.52 247.79 2528.48
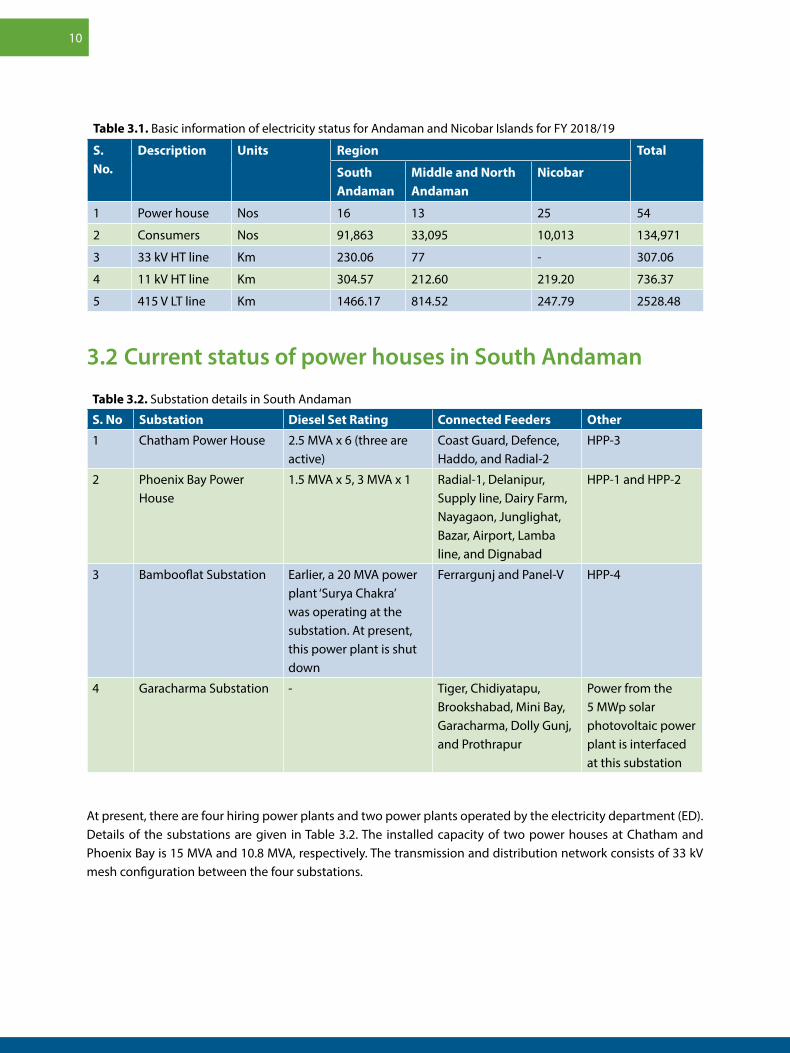
3.2 Current status of power houses in South Andaman
Table 3.2. Substation details in South Andaman
S. No Substation Diesel Set Rating Connected Feeders Other
1 Chatham Power House 2.5 MVA x 6 (three are active)
Coast Guard, Defence, Haddo, and Radial-2
HPP-3
2 Phoenix Bay Power House
1.5 MVA x 5, 3 MVA x 1 Radial-1, Delanipur, Supply line, Dairy Farm, Nayagaon, Junglighat, Bazar, Airport, Lamba line, and Dignabad
HPP-1 and HPP-2
3 Bambooflat Substation Earlier, a 20 MVA power plant ‘Surya Chakra’ was operating at the substation. At present, this power plant is shut down
Ferrargunj and Panel-V HPP-4
4 Garacharma Substation - Tiger, Chidiyatapu, Brookshabad, Mini Bay, Garacharma, Dolly Gunj, and Prothrapur
Power from the 5 MWp solar photovoltaic power plant is interfaced at this substation
At present, there are four hiring power plants and two power plants operated by the electricity department (ED). Details of the substations are given in Table 3.2. The installed capacity of two power houses at Chatham and Phoenix Bay is 15 MVA and 10.8 MVA, respectively. The transmission and distribution network consists of 33 kV mesh configuration between the four substations.

11
3.3 Transition towards renewablesIn order to shift from diesel to cleaner and renewable sources for energy generation, the Andaman and Nicobar (A&N) ED signed a ‘Memorandum of Understanding’ with The Energy and Resources Institute (TERI) on November 30, 2013. This was signed to explore the possibility of the phasing out of diesel-based power through renewables mainly solar, wind, and biomass-based energy sources. Detailed assessment of several renewable sources in the identified islands was conducted. The renewable energy (RE) potential from various sources in A&N Islands is as follows: 3.67 MW from biomass, 7.5–16.1 MW from rooftop solar photovoltaic (PV), and 7 MW from wind energy [8].
The ‘Power-for-all’ roadmap was prepared that highlights all the encompassing power sector interventions including power generation, transmission, distribution, RE, and energy efficiency/deviation settlement mechanism measures, proposed to be implemented during FY16 to FY19 [9]. This report considers a composite growth rate of 10% in demand for projecting future energy sales. This report emphasises the need for ED A&N to plan the evacuation arrangement for effective utilization of the proposed power generations with LNG and RE-based generation capacity additions. Certain steps to improve collection efficiency were proposed in this roadmap such as all domestic consumers to be billed through a common service centre. The installation of a VSAT system in the islands to improve system monitoring was also proposed. Thereby, this study suggested for a system-wide technical audit to determine the causes of high power loss levels. A proposal was made for a functional energy auditing and monitoring cell to increase system efficiency in the long run. As part of the energy efficiency plan, a draft notification was prepared that mandates the use of rooftop solar PV (SPV) for promoting energy-efficient building designs. The main reason behind the high cost of power supply in the islands is low consumer base along with high cost of power generation. The high cost indicates that power tariffs in the islands are lower than the cost of supply.
The MNRE on April 5, 2016 issued an administrative approval for the implementation of a scheme on setting up of distributed grid-connected SPV power projects of an aggregate capacity of 40 MW in A&N and Lakshadweep Islands with an estimated central financial assistance of Rs 192.20 crore [10]. The objectives of the scheme are to develop carbon-free islands by phasing out the use of diesel for electricity generation and to contribute to the National Action Plan on Climate Change. The initiative will also help in reducing the cost of electricity generation. Petronet LNG proposed to install a 50 MW LNG-based generation plant in South Andaman to reduce the consumption of diesel. The configurations of the storage systems with SPV plants are: 8 MW SPV plant along with 3 MW, 3.2 MWh battery energy storage system (BESS) at Chidiya Tapu, South Andaman, and 17 MW SPV project along with 6.8 MW, 6.8 MWh BESS.
The Central Electricity Authority (CEA) had constituted a committee for Port Blair (South Andaman), with members from CEA, PGCIL, and POSOCO to finalize the optimal energy mix and to study the grid-related issues in A&N Islands due to new solar projects and feasibility of setting up of an Energy Management Centre (EMC) [11]. In 2016, the committee suggested the addition of 45 MW in the capacity of solar power plants in Port Blair keeping view of the potential sites available, along with the power evacuation system of the proposed plants and capacities of different BESS considering the grid stability. It was also recommended that an EMC should be established for grid monitoring and operation and solar forecasting. Subsequently, due to the high cost of proposed BESS, the recommendations were reviewed by the committee in 2017 for the optimal energy mix for

12
Port Blair. Also, a feasibility report for the installation of 40 MW LNG-based power plant in Port Blair was initiated in 2017 by the Ministry of Power. The key recommendations of the committee were as follows:
» The existing 5 MWp Garacharma Solar Power Plant to be integrated with a 2 MW, 2 MWh battery system for a solar smoothening (power) application.
» Setting up of an LNG plant is under the planning stage for past few years. Since an LNG plant is essential to meet the base load requirement of South Andaman and to make it diesel-free, expeditious actions must be taken up by A&N administration for its implementation.
» It is observed that sometimes in monsoon SPV provides very less output, therefore, energy time shift application may not be useful during that period.
» The committee noted that in Lakshadweep there are frequency controllers installed on all the diesel generator (DG) sets to improve the load response of DGs. It is suggested that the ED, A&N may also explore the possibility for such installations for fast response in case of a solar mix.
» The proposed BESS solutions at Garacharma-NTPC Power Plant (5 MW) (power application) and NLC Attampahad Power Plant (20 MW) (energy application and firming up) will also provide to the ED, A&N an experience in operating SPV with BESS system based on which future installation of SPV and BESS capacity can be decided.
In order to support the transition towards cleaner sources of energy, TERI had suggested a phase-wise approach to the ED in 2018 [12]. The first phase included a detailed load flow analysis and grid integration study for various supply scenarios, installation of a 2 MWh BESS at the 5 MWp SPV plant at Garacharma, and retrofitting DG systems with electronic governors. The second phase included establishing an Energy Management Centre, implementing energy-efficiency measures, and augmenting SPV power capacity (rooftop and ground mounted) along with BESS. This was followed by the installation and commissioning of an LNG power plant in the final phase.
From all the above-mentioned studies, it can be concluded that in future, power grids would be moving towards 100% renewable sources such as SPV and LNG with energy storage systems. However, the current scenario is of a vital importance when DGs are phased out and new clean power generation plants are functioning. However, there are challenges in commissioning of these systems. Hence, this report focuses on stabilized grid operations for various supply scenarios in 2022 with techno-commercial implications.
3.4 Network operations and managementThe power generation from hiring power plants and others is managed by operators at Chatham Power House. At each substation, voltage and grid frequency are monitored manually. In any of the power systems, there is an instantaneous variation in demand and generation. This leads to fluctuations in voltage and frequency. Currently, operators at each substation maintain voltage and frequency by performing load curtailment (demand reduction) or reducing generation (supply reduction). Since these corrective actions are performed manually, it is highly probable that the operating voltage and frequency exceed a threshold. This leads to the generators moving out of the system and ultimately causing blackouts. Post blackout, time taken by generators to restart leads to sequential re-establishment of the interlinkages between the generators. This involves several iterations in matching the generated power to the total load of the network.
The communication between operators is crucial for effective grid management. Hence, a dedicated very high frequency communication network was established in the region. It aids in monitoring and fault-rectification activities. Distribution feeders consist of long distance lines that lead to increase in fault-rectification time. To ensure reliability, protection coordination between various sections plays a crucial role. Due to inadequate

13
protection device coordination in the transmission and distribution network, occurrence of false tripping is common. During monsoon, which is prolonged in these islands, all these problems increase many folds.
Table 3.3. Installed capacity and other details of all power plants in South Andaman
Generating Station Installed Capacity (MW)
Continuous Capacity (MW)
Monthly Energy Generation (MU)
Own Generation
Chatham Power House 7.5
Phoenix Bay Power House 10.8
Power Purchase Plants
HPP-1 5 5 2.94
HPP-2 10 10 5.85
HPP-3 (Aggreko) 5 5 3.5
HPP-4 (NTPC) Bambooflat 10 10 5.85
5 MW Garacharma Solar Plant 5 5 6 (annually)
Other solar plants in different locations (rooftop and ground mounted)
1
Total 60.3
As per the contract arrangement, hiring power plants are required to maintain the peak-hour capacity and meet the monthly generation units. The fuel (diesel) required to generate electricity is provided by the ED. The tariff of hiring power plants is to cater to the operational costs of the power plants. The details on monthly energy commitment, installed capacity, and peak-hour capacity are listed in Table 3.3. The commercial terms of operation of a hiring power plant, based on draft power purchase agreement of HPP-4 indicates the following:
» The hiring power plants have to maintain 100% availability of electricity during 17:00 h to 22:00 h, which is verified using the actual energy delivered during this period. Any shortfall in peak supply below 100% is penalized at the rate of Rs 200/- per 50 KW or part thereof for every hour in the same proportion.
» The fuel shall be supplied to the hiring power plants on free of cost basis, as per actual. The minimum specific fuel consumption (SFC) shall not fall below 0.270 L/kWh (equivalent to 3.7 kWh per litre) and any excess consumption of high speed diesel (HSD) beyond 0.270 L/kWh will go to the generator’s account. On the other hand, if the SFC is better than 0.256 L/unit (equivalent to 3.9 kWh per litre) then HSD will be accounted as per actual and no incentive will be paid on the account of HSD saved.
» Fixed energy charge for sale of power shall be paid for per unit electricity supplied on actual basis. The HPP shall ensure minimum 1.92 lakh units per day (plant load factor [PLF] 80%) on average. If the generation is below this level then penalty at the rate double of per unit cost will be levied for the shortfall in average generation below 1.92 lakh units per day, accounted on monthly basis.
» An incentive at the rate of 50% of per unit cost will be paid if the energy supplied exceeds beyond 2.16 lakh units per day (PLF 90%) on average, accounted on monthly basis. However, no incentive shall be paid for the energy supplied beyond 2.64 lakh units per day (PLF 110%), accounted on monthly basis.
The commitment of average daily energy generated based on 80% PLF and thresholds on SFC to be met by power plants would end in operators locking of each unit at 80% loading. Also, this limits the generators to

14
participate in minimizing the gap in supply and demand of electricity as there is no incentive for operating above and below 80% PLF for short durations. This ends up as a burden on the power plants (CPH and PBPH) to stabilize the grid operation.
3.5 Challenges
3.5.1 OperationalThe operational challenges include lack of communication systems, lack of service support for old DG sets, inadequate equipment, etc. The distribution network has issues of frequent tripping of LT feeders and high voltage due to charging of long cables, thereby increasing the demand–supply mismatch. Lack of an integrated energy management system leads to further weakening of the grid in days with high solar penetration.
3.5.2 TechnicalTechnical challenges faced by the network operators are lack of fast-response electronic governors, absence of energy storage systems to reduce intermittency in the grid and energy shifting, absence of low-speed generators (inertial response of a low-speed generator is high), inadequacy of protection scheme, etc. Renovation and modernization of the distribution network is needed to revisit the long distance distribution lines.
3.5.3 CommercialThe cost of generation per unit is high as majority of the generation is from diesel. The high cost of generation coupled with low tariff for consumers requires large amount of subsidy to be provided to consumers and this leaves little margin for the network’s upgradation.
In order to overcome these challenges, modifications are required in technical operations, supply mix, and regulatory and tariff structure. Also, evaluation of power flows for the present and future networks is required.
4. Data Collection and Analysis
Chapter 4
The data were collected during the site visits on generation profile and network specifications. Line diagram of the 33/11 kV network was used in modelling electrical networks. From the data of feeder loading, as recorded in log sheets, variation of individual feeder with respect to total generation is derived. Also, various operational strategies and present and future simulation scenarios considered are detailed in this section.
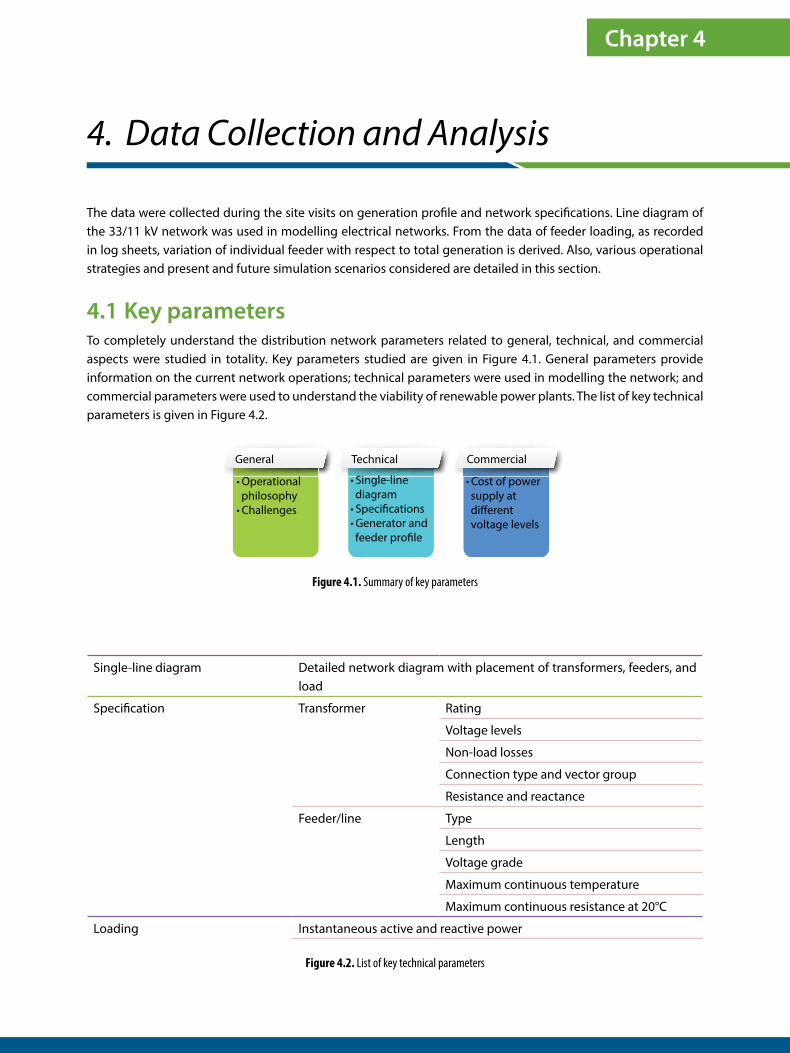
4.1 Key parametersTo completely understand the distribution network parameters related to general, technical, and commercial aspects were studied in totality. Key parameters studied are given in Figure 4.1. General parameters provide information on the current network operations; technical parameters were used in modelling the network; and commercial parameters were used to understand the viability of renewable power plants. The list of key technical parameters is given in Figure 4.2.
Figure 4.1. Summary of key parameters
Figure 4.2. List of key technical parameters
General Technical Commercial
• Operational philosophy
• Challenges
• Cost of power supply at di�erent voltage levels
• Single-line diagram
• Speci�cations• Generator and feeder pro�le
Single-line diagram Detailed network diagram with placement of transformers, feeders, and load
Specification Transformer Rating
Voltage levels
Non-load losses
Connection type and vector group
Resistance and reactance
Feeder/line Type
Length
Voltage grade
Maximum continuous temperature
Maximum continuous resistance at 20°C
Loading Instantaneous active and reactive power
16
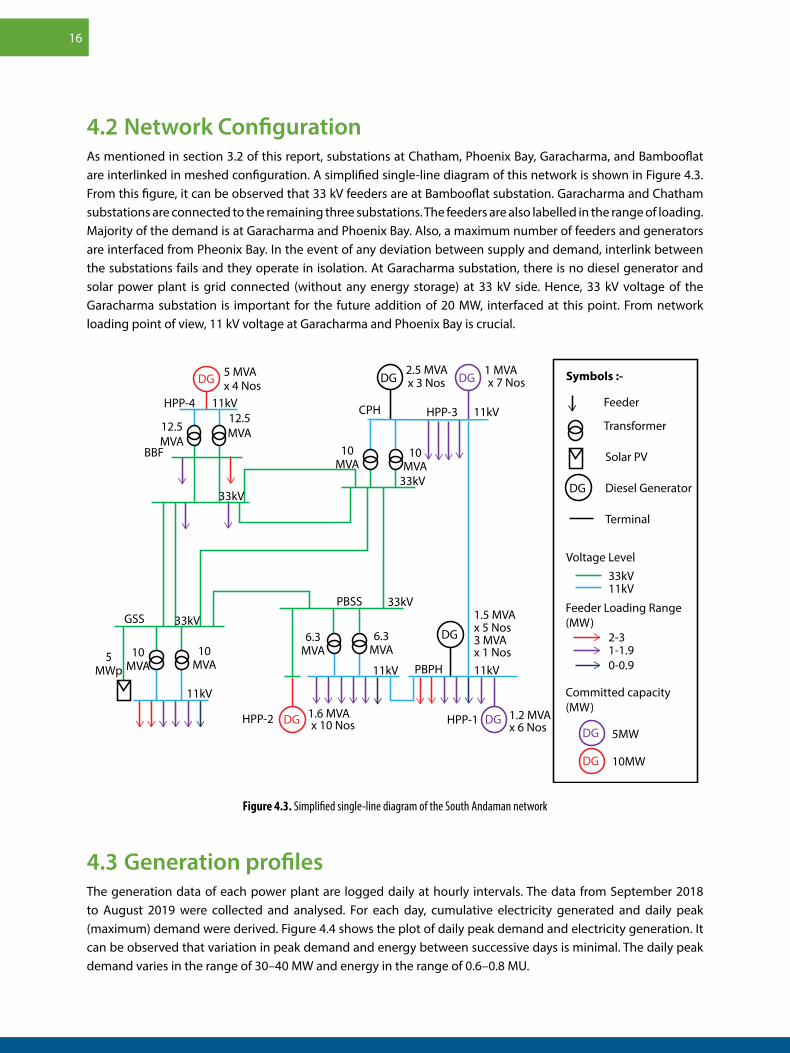
4.2 Network ConfigurationAs mentioned in section 3.2 of this report, substations at Chatham, Phoenix Bay, Garacharma, and Bambooflat are interlinked in meshed configuration. A simplified single-line diagram of this network is shown in Figure 4.3. From this figure, it can be observed that 33 kV feeders are at Bambooflat substation. Garacharma and Chatham substations are connected to the remaining three substations. The feeders are also labelled in the range of loading. Majority of the demand is at Garacharma and Phoenix Bay. Also, a maximum number of feeders and generators are interfaced from Pheonix Bay. In the event of any deviation between supply and demand, interlink between the substations fails and they operate in isolation. At Garacharma substation, there is no diesel generator and solar power plant is grid connected (without any energy storage) at 33 kV side. Hence, 33 kV voltage of the Garacharma substation is important for the future addition of 20 MW, interfaced at this point. From network loading point of view, 11 kV voltage at Garacharma and Phoenix Bay is crucial.
Figure 4.3. Simplified single-line diagram of the South Andaman network
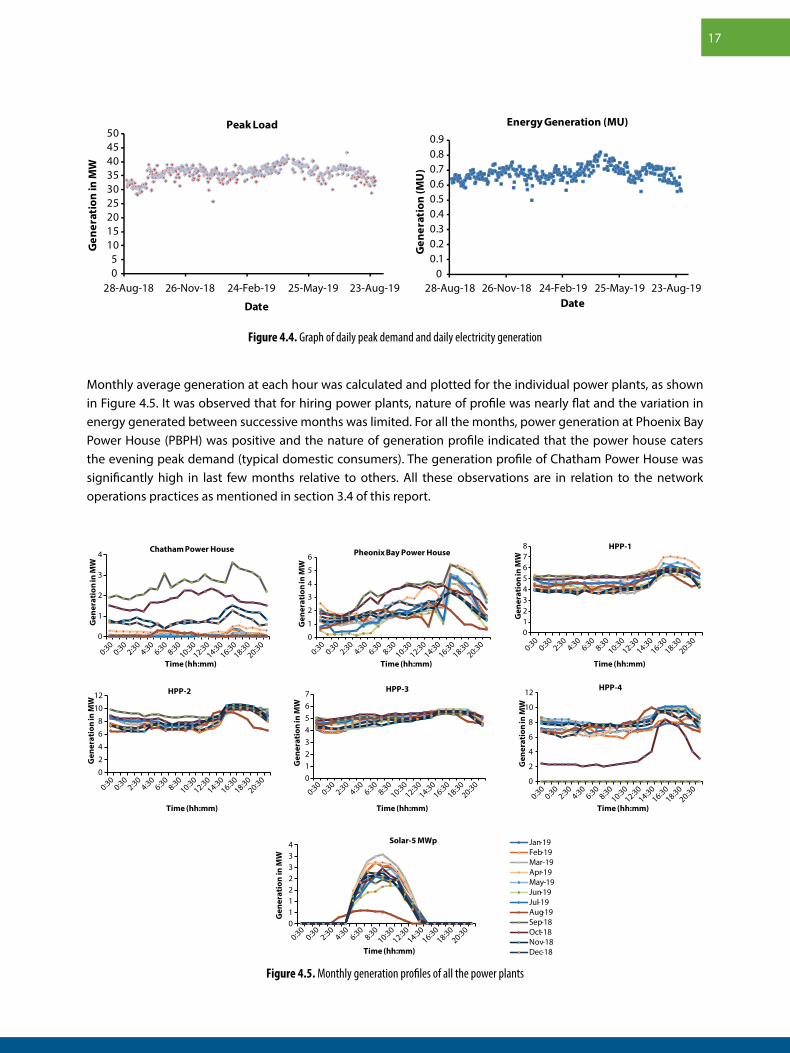
4.3 Generation profilesThe generation data of each power plant are logged daily at hourly intervals. The data from September 2018 to August 2019 were collected and analysed. For each day, cumulative electricity generated and daily peak (maximum) demand were derived. Figure 4.4 shows the plot of daily peak demand and electricity generation. It can be observed that variation in peak demand and energy between successive days is minimal. The daily peak demand varies in the range of 30–40 MW and energy in the range of 0.6–0.8 MU.
DG DG
DG
DG
DG
DG
DG
DGDG
Symbols :-
Feeder
Transformer
Diesel Generator
Solar PV
Terminal
Voltage Level
Feeder Loading Range(MW)
Committed capacity(MW)
33kV
5 MVA 1 MVA
10MVA
10MVA
1.6 MVA 1.2 MVA
3 MVA
1.5 MVA
x 10 Nos x 6 Nos
x 1 Nos
x 5 Nos
HPP-1
10MVA
5MWp
HPP-2
6.3MVA
6.3MVA
10MVA
12.5MVA
2.5 MVAx 3 Nos
HPP-3CPH12.5MVA
BBF
33kV
33kV
33kVPBSS
PBPH
GSS
33kV
11kV
11kV 11kV
x 4 Nos x 7 Nos
11kV11kV
HPP-4
11kV
2-31-1.90-0.9
5MW
10MW
17
Monthly average generation at each hour was calculated and plotted for the individual power plants, as shown in Figure 4.5. It was observed that for hiring power plants, nature of profile was nearly flat and the variation in energy generated between successive months was limited. For all the months, power generation at Phoenix Bay Power House (PBPH) was positive and the nature of generation profile indicated that the power house caters the evening peak demand (typical domestic consumers). The generation profile of Chatham Power House was significantly high in last few months relative to others. All these observations are in relation to the network operations practices as mentioned in section 3.4 of this report.
Figure 4.4. Graph of daily peak demand and daily electricity generation
Figure 4.5. Monthly generation profiles of all the power plants
05
101520253035404550
Gen
erat
ion
in M
W
Date
Peak Load
00.10.20.30.40.50.60.70.80.9
Gen
erat
ion
(MU
)
Date
Energy Generation (MU)
28-Aug-18 26-Nov-18 24-Feb-19 25-May-19 23-Aug-19 28-Aug-18 26-Nov-18 24-Feb-19 25-May-19 23-Aug-19
0
1
2
3
4
Gen
erat
ion
in M
W
Time (hh:mm)
Chatham Power House
0:300:30
2:304:30
6:308:30
10:3012:30
14:3016:30
18:3020:30
012345678
Gen
erat
ion
in M
W
Time (hh:mm)
HPP-1
0:300:30
2:304:30
6:308:30
10:3012:30
14:3016:30
18:3020:300
1
2
3
4
5
6
Gen
erat
ion
in M
W
Time (hh:mm)
Pheonix Bay Power House
0:300:30
2:304:30
6:308:30
10:3012:30
14:3016:30
18:3020:30
0
2
4
6
8
10
12
Gen
erat
ion
in M
W
Time (hh:mm)
HPP-2
0:300:30
2:304:30
6:308:30
10:3012:30
14:3016:30
18:3020:30 0
1234567
Gen
erat
ion
in M
W
Time (hh:mm)
HPP-3
0:300:30
2:304:30
6:308:30
10:3012:30
14:3016:30
18:3020:30 0
2
4
6
8
10
12
Gen
erat
ion
in M
W
Time (hh:mm)
HPP-4
0:300:30
2:304:30
6:308:30
10:3012:30
14:3016:30
18:3020:30
Gen
erat
ion
in M
W
01122334
Time (hh:mm)
Solar-5 MWp Jan-19Feb-19Mar-19Apr-19May-19Jun-19Jul-19Aug-19Sep-18Oct-18Nov-18Dec-18
0:300:30
2:304:30
6:308:30
10:3012:30
14:3016:30
18:3020:30
18
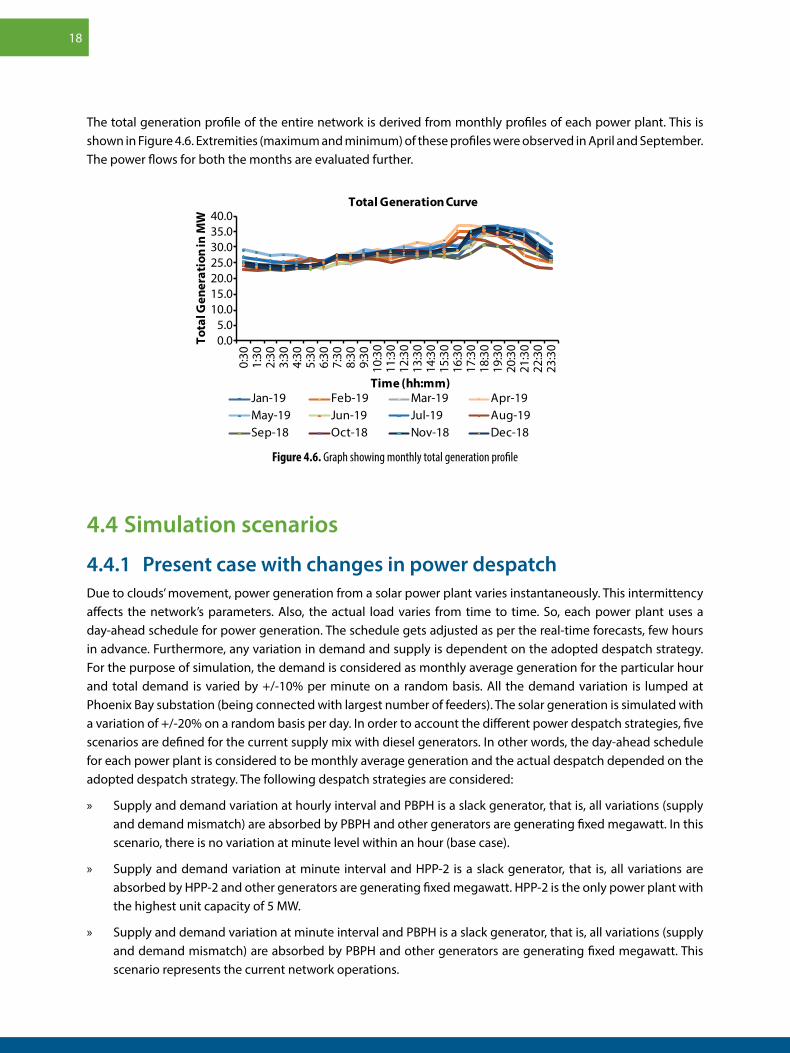
The total generation profile of the entire network is derived from monthly profiles of each power plant. This is shown in Figure 4.6. Extremities (maximum and minimum) of these profiles were observed in April and September. The power flows for both the months are evaluated further.
Figure 4.6. Graph showing monthly total generation profile
4.4 Simulation scenarios
4.4.1 Present case with changes in power despatchDue to clouds’ movement, power generation from a solar power plant varies instantaneously. This intermittency affects the network’s parameters. Also, the actual load varies from time to time. So, each power plant uses a day-ahead schedule for power generation. The schedule gets adjusted as per the real-time forecasts, few hours in advance. Furthermore, any variation in demand and supply is dependent on the adopted despatch strategy. For the purpose of simulation, the demand is considered as monthly average generation for the particular hour and total demand is varied by +/-10% per minute on a random basis. All the demand variation is lumped at Phoenix Bay substation (being connected with largest number of feeders). The solar generation is simulated with a variation of +/-20% on a random basis per day. In order to account the different power despatch strategies, five scenarios are defined for the current supply mix with diesel generators. In other words, the day-ahead schedule for each power plant is considered to be monthly average generation and the actual despatch depended on the adopted despatch strategy. The following despatch strategies are considered:
» Supply and demand variation at hourly interval and PBPH is a slack generator, that is, all variations (supply and demand mismatch) are absorbed by PBPH and other generators are generating fixed megawatt. In this scenario, there is no variation at minute level within an hour (base case).
» Supply and demand variation at minute interval and HPP-2 is a slack generator, that is, all variations are absorbed by HPP-2 and other generators are generating fixed megawatt. HPP-2 is the only power plant with the highest unit capacity of 5 MW.
» Supply and demand variation at minute interval and PBPH is a slack generator, that is, all variations (supply and demand mismatch) are absorbed by PBPH and other generators are generating fixed megawatt. This scenario represents the current network operations.
0.05.0
10.015.020.025.030.035.040.0
0:30
1:30
2:30
3:30
4:30
5:30
6:30
7:30
8:30
9:30
10:3
011
:30
12:3
013
:30
14:3
015
:30
16:3
017
:30
18:3
019
:30
20:3
021
:30
22:3
023
:30To
tal G
ener
atio
n in
MW
Time (hh:mm)
Total Generation Curve
Jan-19 Feb-19 Mar-19 Apr-19May-19 Jun-19 Jul-19 Aug-19Sep-18 Oct-18 Nov-18 Dec-18
19
» Supply and demand variation at minute interval and power despatch is based on the principle of inertia, that is, all variations (supply and demand mismatch) are shared between the power plants in the ratio of their inertial capabilities.
• Supply and demand variation at minute interval and power despatch is based on distributed slack between diesel generators, that is, all variations (supply and demand mismatch) are shared between the power plants in the ratio of a day-ahead schedule.
The cost of power generation and the net energy generated by each power plant were derived. The economic comparison from the results for extreme months presented the viability of a particular despatch strategy.
4.4.2 Future caseAs presented in section 3.3 of this report, the supply mix of 2022 could vary depending on the load growth, presence or absence of LNG plant, commissioning of the additional 25 MWp solar power plant, and integration of battery energy storage system (BESS). The battery storage system reduces the intermittency of solar power. Within the steady-state analysis, instead of a BESS, stable solar generation is considered. BESS’s load-shifting application would require commercial arrangements for scheduling. Therefore, BESS is not considered in extreme cases that are examined here. In the presence of the LNG power plant, all existing diesel power plants shall be decommissioned. As mentioned in section 3.1, low growth in demand was observed to be 2%. And, 10% YoY was considered as high growth in demand for 2022, as as described in section 3.3.
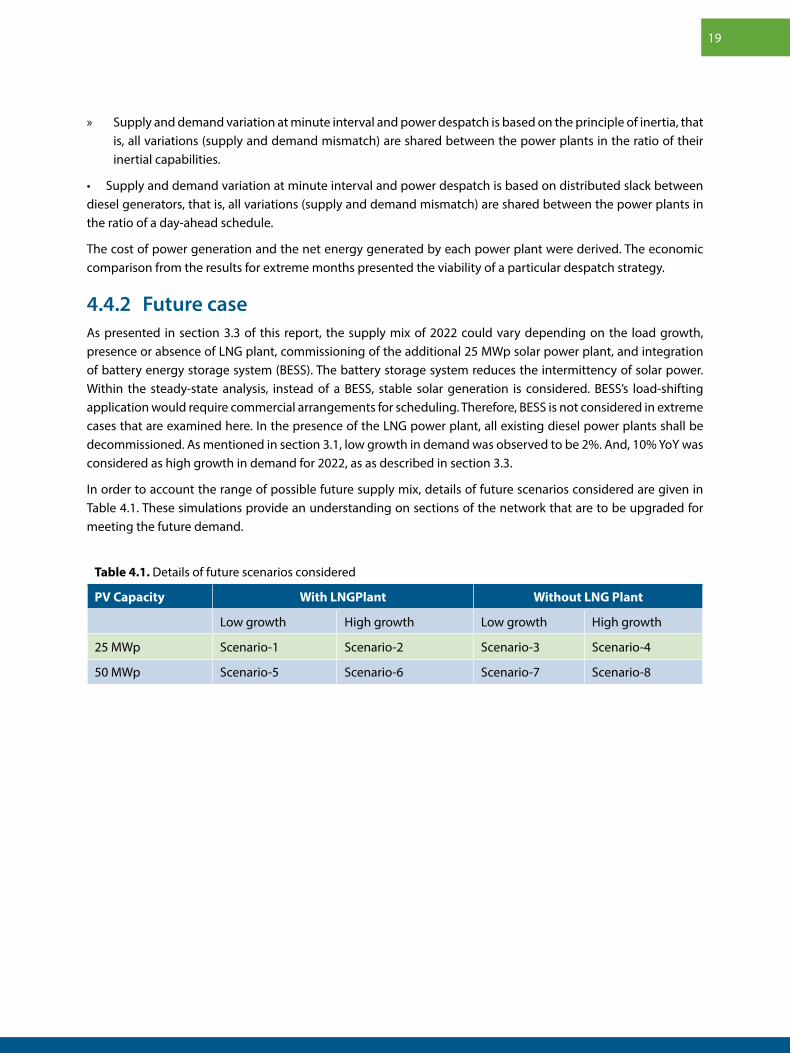
In order to account the range of possible future supply mix, details of future scenarios considered are given in Table 4.1. These simulations provide an understanding on sections of the network that are to be upgraded for meeting the future demand.
Table 4.1. Details of future scenarios considered
PV Capacity With LNGPlant Without LNG Plant
Low growth High growth Low growth High growth
25 MWp Scenario-1 Scenario-2 Scenario-3 Scenario-4
50 MWp Scenario-5 Scenario-6 Scenario-7 Scenario-8

20
The scenarios considered for present and future conditions of the network have been detailed in Chapter 4 of this report. For each scenario, load flow analysis is carried out to understand the power flows, network loading, voltage levels and contribution of each power generator. This chapter details the results of load flow for various scenarios and simulation cases.
5.1 AssumptionsThe following are the assumptions taken for simulating the distribution network:
» Loads are lumped at feeder level.
» All rural loads are considered to have a unity power factor,where-ever reactive power dataarenot available.
» The network under the studycomprises diesel generators and solar power plants. For the purpose of load flow, diesel generators are modelled as synchronous generators and solar power plant is providing only active power.
» On-load tap changer in transformers is assumed to be absent.
» In cases of lack of individual feeder load profile, load profile of the feeder is simulated based on peak load data of that feeder.
5.2 Network ModellingLayout diagram with insights on physical dimensions of lines are presented in Appendix A.The detailed specifications of all the network elements are given in Appendix B. Single-line diagram of the present network is given in Figure 5.1.
5. Load Flow Analysis
Chapter 5

22
Figure 5.1. Single-line diagram of the present network
Figure 5.2. Minute-level variability assumed for solar and load
Load flow analysis is conducted in present scenario by considering the hourly generation in each power plant (from monthly data).The instantaneous variability (at 1-min interval) in solar and load is derived using randomization (a bell curve with standard deviation of 10% from mean value and range of 60% to 120% of mean for solar and 80% to 120% for load), and is plotted inFigure 5.2.
0.60.70.80.9
11.11.21.31.4
0:00 4:48 9:36 14:24 19:12 0:00Time (hh:mm)
Load Solar

23
5.3 Present CaseGeneration data of each power plant for the months of April and September are considered in the model. The corresponding feeder loading is detailed in Appendix C. In load flow analysis for convergence of simulation, power loss and supply–demand mismatch have to be generated by a slack generator. The slack generator can be a single machine or a group of machines. As discussed in section 4.4, simulations are performed for various scenarios in April and September. The power generated in each case is plotted as a graph. Important results in each case are mentioned in this section and additional results are given in Appendix D.
5.3.1 Supply and demand variation at hourly interval and PhoenicBay Power House as slack generatorThe network map for the month of September is given inFigure 5.4. In this map, the direction of power flow in transmission lines is indicated by arrow marks. It can be observed that sections of network in Chatham Power House (CPH) and Phoenix Bay Power House (PBPH)Substations are overloaded. Also, the power profile of generatorsis given inFigure 5.3. It can be observed that HPP-4 is out of operation, thereby leading to an increased burden on PBPH and CPH.
Figure 5.3. Graph of power sharing between generators in ‘hourly variation and Phoenix Bay Power House as slack generator’ for September
The network map for the month of September is given inFigure 5.4. In this map, the direction of power flow in transmission lines is indicated by arrow marks. It can be observed that sections of network in Chatham Power House (CPH) and Phoenix Bay Power House (PBPH)Substations are overloaded. Also, the power profile of generatorsis given inFigure 5.3. It can be observed that HPP-4 is out of operation, thereby leading to an increased burden on PBPH and CPH.
0
5
10
15
20
25
30
0:00
2:06
4:12
6:18
8:24
10:3
012
:36
14:4
216
:48
18:5
421
:00
Pow
er (M
W)
Time (hh:mm)
SOLAR
CPH
PBPH
HPP-3
HPP-1
HPP-4
HPP-2

24
5.3.2 Supply and demand variation at minute interval and HPP-2 as slack generatorThe network map for April and the power profiles of generators are given inFigure 5.5. It can be observed that the mismatch between generation and demand is met by HPP-2. There is no overloading observed in any network element. However, HPP-2 is nearing its rated power level. The voltages at 33kV and 11 kV buses are within the regulation limit.
Figure 5.4. Map of the network showing loading and voltage levels in ‘hourly variation and Phoenix Bay Power House as slack generator’ for September
Figure 5.5. Power sharing and network loading in ‘hourly variation and HPP-2 as slack generator’ for April
0
5
10
15
20
25
30
35
40
45
0:00
1:13
2:26
3:39
4:52
6:05
7:18
8:31
9:44
10:5
712
:10
13:2
314
:36
15:4
917
:02
18:1
519
:28
20:4
121
:54
Pow
er (M
W)
Time
HPP-2
SOLAR
HPP-4
CPH
PBPH
HPP-3
HPP-1
Loading Range
80%
1. p.u.
1. p.u.
0.95 p.u.
1.05 p.u.
1.1 p.u.
0.9 p.u.
...
...
...
...
100%
Lower Voltage Range
Upper Voltage Range
8
1
1
0
1
1
0
..
..
..
..
1
Lower
Uppe
Loading Range
80%
1. p.u.
1. p.u.
0.95 p.u.
1.05 p.u.
1.1 p.u.
0.9 p.u.
...
...
...
...
100%
Lower Voltage Range
Upper Voltage Range
8
1
1
0
1
1
0
..
..
..
..
1
Lower
Uppe

25
5.3.3 Supply and demand variation at minute interval and PBPH as slack generatorThe network map for April and the power profiles of generators are given inFigure 5.6. It can be observed that the mismatch between generation and demand is met by PBPH. There is overloading observed in sections of the network at CPH and PBPH substations. The voltages at 33kV and 11 kV buses are within the regulation limit.
Figure 5.6. Power sharing and network loading in ‘hourly variation and Phoenix Bay Power House as slack generator’ for April
5.3.4 Supply and demand variation at minute interval and power dispatch based on inertiaThe network map for April and power profiles of generators are given inFigure 5.7. It can be observed that the mismatch between generation and demand is shared between the diesel generators as inertial capability. There is no overloading observed in any network element. The voltages at 33kV and 11kV buses are within the regulation limit.
Figure 5.7. Power sharing and network loading in ‘hourly variation and dispatch based on inertia’ for September
05
1015202530354045
0:00
1:03
2:06
3:09
4:12
5:15
6:18
7:21
8:24
9:27
10:3
011
:33
12:3
613
:39
14:4
215
:45
16:4
817
:51
18:5
419
:57
21:0
022
:03
Pow
er (M
W)
Time
SOLARCPHPBPHHPP-3HPP-1HPP-4HPP-2
0
5
10
15
20
25
30
35
0:00
1:17
2:34
3:51
5:08
6:25
7:42
8:59
10:16
11:33
12:50
14:07
15:24
16:41
17:58
19:15
20:32
21:49
Pow
er (M
W)
Time
HPP-4
SOLAR
CPH
PBPH
HPP-3
HPP-1
HPP-2
Loading Range
80%
1. p.u.
1. p.u.
0.95 p.u.
1.05 p.u.
1.1 p.u.
0.9 p.u.
...
...
...
...
100%
Lower Voltage Range
Upper Voltage Range
8
1
1
0
1
1
0
..
..
..
..
1
Lower
Uppe
Loading Range
80%
1. p.u.
1. p.u.
0.95 p.u.
1.05 p.u.
1.1 p.u.
0.9 p.u.
...
...
...
...
100%
Lower Voltage Range
Upper Voltage Range
8
1
1
0
1
1
0
..
..
..
..
1
Lower
Uppe

26
5.3.5 Supply and demand variation at minute interval and power dispatch based on distributed slack between diesel generatorsThe network map for April and the power profiles of generators are given inFigure 5.8. It can be observed that the mismatch between generation and demand is shared between diesel generators in proportion to the scheduled power. There is no overloading observed in any network element. The voltages at 33kV and 11kV buses are within the regulation limit.
Figure 5.8. Power sharing and network loading in ‘hourly variation and dispatch-based distributed slack’ for April
5.3.6 SummaryFrom the simulation results of all the scenarios it can be concluded that with distributed slack, there are no overloaded elements in the network. Distributed generation between multiple generators improves system reliability. In order to understand the implication of various dispatch strategies,energy generated is computed and the corresponding cost of generation is derived.
0
5
10
15
20
25
30
35
40
45
0:00
1:01
2:02
3:03
4:04
5:05
6:06
7:07
8:08
9:09
10:1
011
:11
12:1
213
:13
14:1
415
:15
16:1
617
:17
18:1
819
:19
20:2
021
:21
22:2
2
Pow
er (M
W)
Time
SOLAR
CPH
PBPH
HPP-3
HPP-1
HPP-4
HPP-2
Loading Range
80%
1. p.u.
1. p.u.
0.95 p.u.
1.05 p.u.
1.1 p.u.
0.9 p.u.
...
...
...
...
100%
Lower Voltage Range
Upper Voltage Range
8
1
1
0
1
1
0
..
..
..
..
1
Lower
Uppe

27
Table 5.1. Daily energy generated and generation cost of each power plant under various present case simulations for April
Power Plant
Parameter Variation at Hourly Interval and PBPH as Slack Generator
Variation at Minute Interval and HPP-2 as Slack Generator
Variation at Minute Interval and PBPH as Slack Generator
Variation at Minute Interval and Power Dispatch Based on Inertia
Variation at Minute Interval and Power Dispatch Based on Distributed Slack Between Diesel Generators
HPP-1 Cost (Rs inlakh) 36.47 36.47 36.47 33.86 32.08
Energy (lakh units)
1.33 1.33 1.33 1.24 1.33
HPP-2 Cost (Rs inlakh) 31.25 31.02 55.76 48.49 49.07
Energy (lakh units)
1.13 1.13 1.13 1.76 1.13
HPP-3 Cost (Rs inlakh) 34.96 34.96 34.96 32.38 30.75
Energy (lakh units)
1.26 1.26 1.26 1.16 1.26
HPP-4 Cost (Rs inlakh) 53.14 53.14 53.14 47.27 46.72
Energy (lakh units)
1.92 1.92 1.92 1.70 1.92
PBPH Cost (Rs inlakh) 19.47 19.47 4.61 15.52 17.07
Energy (lakh units)
0.70 0.70 0.70 0.56 0.70
CPH Cost (Rsin lakh) 2.48 2.48 2.48 2.06 2.28
Energy (lakh units)
0.06 0.06 0.06 0.03 0.06
Solar Cost (Rsin lakh) 1.86 1.87 1.87 1.87 1.87
Energy (lakh units)
0.20 0.20 0.20 0.20 0.17
Total Cost (Rs inlakh)
179.63 179.41 189.29 181.45 179.83
Energy (lakh units)
6.60 6.60 6.60 6.66 6.58
Per unit cost (Rs/unit)
27.22 27.18 28.68 27.26 27.35
CPH: Chatham Power House; HPP: Hiring power plants; PBPH: Phoenix Bay Power House
For April, all power plants are operating. Summary of each power plant is given in Table 5.1. It can be observed that out of all the five scenarios PBPH has maximum total cost of generation as reference machine for minute-level variations. This represents the case with current network operations. All other dispatch strategies have a reduction of around 5% in cost of generation relative to the maximum.
28
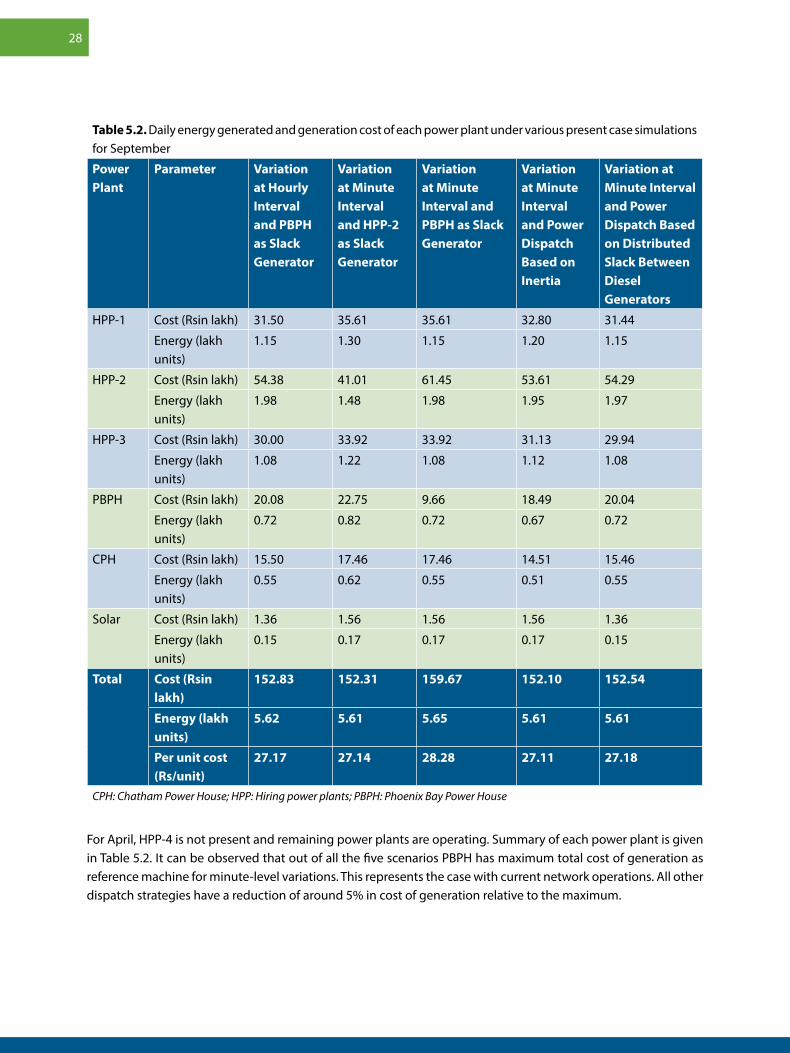
For April, HPP-4 is not present and remaining power plants are operating. Summary of each power plant is given in Table 5.2. It can be observed that out of all the five scenarios PBPH has maximum total cost of generation as reference machine for minute-level variations. This represents the case with current network operations. All other dispatch strategies have a reduction of around 5% in cost of generation relative to the maximum.
Table 5.2. Daily energy generated and generation cost of each power plant under various present case simulations for September
Power Plant
Parameter Variation at Hourly Interval and PBPH as Slack Generator
Variation at Minute Interval and HPP-2 as Slack Generator
Variation at Minute Interval and PBPH as Slack Generator
Variation at Minute Interval and Power Dispatch Based on Inertia
Variation at Minute Interval and Power Dispatch Based on Distributed Slack Between Diesel Generators
HPP-1 Cost (Rsin lakh) 31.50 35.61 35.61 32.80 31.44
Energy (lakh units)
1.15 1.30 1.15 1.20 1.15
HPP-2 Cost (Rsin lakh) 54.38 41.01 61.45 53.61 54.29
Energy (lakh units)
1.98 1.48 1.98 1.95 1.97
HPP-3 Cost (Rsin lakh) 30.00 33.92 33.92 31.13 29.94
Energy (lakh units)
1.08 1.22 1.08 1.12 1.08
PBPH Cost (Rsin lakh) 20.08 22.75 9.66 18.49 20.04
Energy (lakh units)
0.72 0.82 0.72 0.67 0.72
CPH Cost (Rsin lakh) 15.50 17.46 17.46 14.51 15.46
Energy (lakh units)
0.55 0.62 0.55 0.51 0.55
Solar Cost (Rsin lakh) 1.36 1.56 1.56 1.56 1.36
Energy (lakh units)
0.15 0.17 0.17 0.17 0.15
Total Cost (Rsin lakh)
152.83 152.31 159.67 152.10 152.54
Energy (lakh units)
5.62 5.61 5.65 5.61 5.61
Per unit cost (Rs/unit)
27.17 27.14 28.28 27.11 27.18
CPH: Chatham Power House; HPP: Hiring power plants; PBPH: Phoenix Bay Power House
29
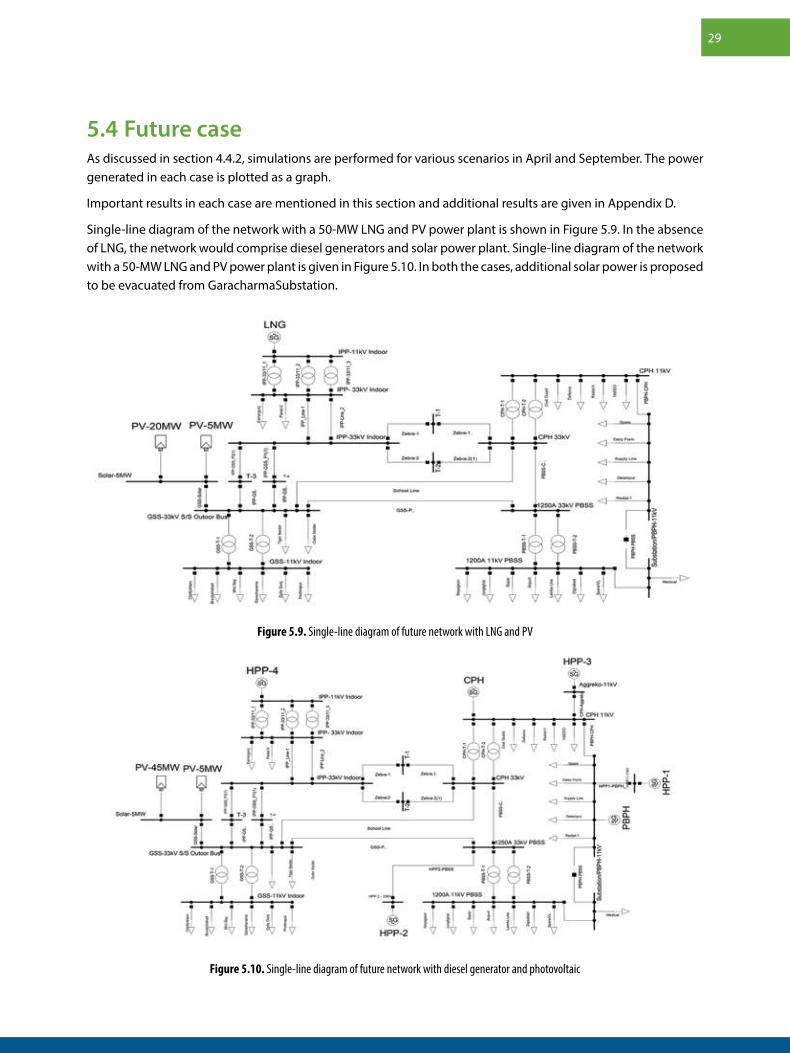
5.4 Future caseAs discussed in section 4.4.2, simulations are performed for various scenarios in April and September. The power generated in each case is plotted as a graph.
Important results in each case are mentioned in this section and additional results are given in Appendix D.
Single-line diagram of the network with a 50-MW LNG and PV power plant is shown in Figure 5.9. In the absence of LNG, the network would comprise diesel generators and solar power plant. Single-line diagram of the network with a 50-MW LNG and PV power plant is given in Figure 5.10. In both the cases, additional solar power is proposed to be evacuated from GaracharmaSubstation.
Figure 5.9. Single-line diagram of future network with LNG and PV
Figure 5.10. Single-line diagram of future network with diesel generator and photovoltaic

30
5.4.
1 N
etw
ork
with
LN
G
Figu
re 5.
11. S
imula
tion r
esult
s for
futu
re sc
enar
ios w
ith LN
G an
d pho
tovo
ltaic
for A
pril
PV C
apac
ityW
ith
LNG
Low
Gro
wth
Hig
h G
row
th
25 M
Wp
50M
Wp
Load
ing
Rang
e
80%
1. p
.u.
1. p
.u.
0.95
p.u
.
1.05
p.u
.
1.1
p.u.
0.9
p.u.
... ... ......100%
Low
er V
olta
ge R
ange
Upp
er V
olta
ge R
ange
8 1 10 1 10.. .. ....1
Low
er
Upp
e
31
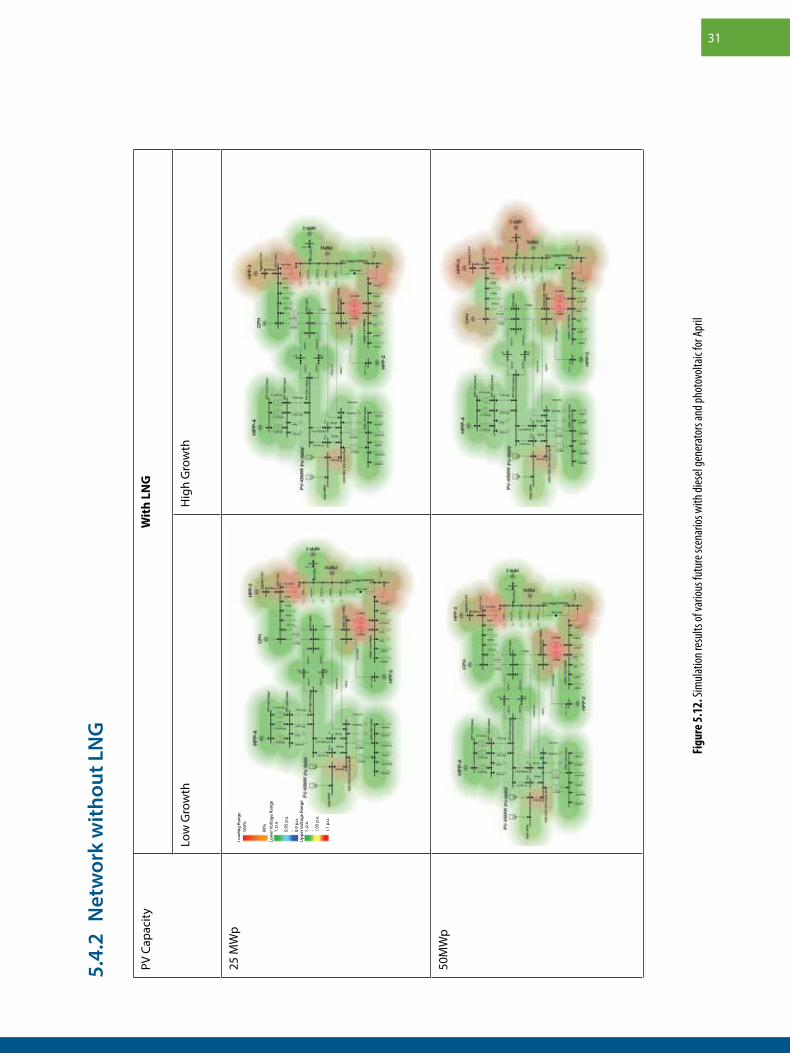
5.4.
2 N
etw
ork
with
out L
NG
Figu
re 5.
12. S
imula
tion r
esult
s of v
ariou
s fut
ure s
cena
rios w
ith di
esel
gene
rato
rs an
d pho
tovo
ltaic
for A
pril
PV C
apac
ityW
ith
LNG
Low
Gro
wth
Hig
h G
row
th
25 M
Wp
50M
Wp
Load
ing
Rang
e
80%
1. p
.u.
1. p
.u.
0.95
p.u
.
1.05
p.u
.
1.1
p.u.
0.9
p.u.
... ... ......100%
Low
er V
olta
ge R
ange
Upp
er V
olta
ge R
ange
8 1 10 1 10.. .. ....1
Low
er
Upp
e

32
5.4.3 SummaryThe network maps for future scenarios with and without LNG power plant are given in Figure 5.11 and Figure 5.12, respectively. It can be observed that in all the scenarios certain sections of the network at PBPH and CPH are overloaded. Hence, they need to be upgraded. With LNG plant (all diesel generators phased out), the network has voltage regulations issues. Hence, additional reactive compensators are needed. Voltage at Garacharma Substation is most critical as additional utility scale solar plants are planned to be interfaced at this terminal.
The generation profiles of each power plant for future scenarios with and without LNG power plant are given in Figure D.6andFigure D.8. It can be observed that in all the scenarios with LNG power at high growth rate, the peak demand (approximately 45 MW) occurs at evening. Hence, battery storage with peak shifting capability is recommended with LNG power plant. In scenarios of low-demand growth with LNG, it can be observed that PV generation from 50 MWp exceeds day-time load. Hence, battery storage with peak-shifting features would be required as excess PV power can be stored and utilized during evening peak hours.

The current network operations and challenges faced by grid operators are detailed in Chapter 3. Few key interventionsmay be incorporated, which have helped the mainland grid for smooth operations, can be adopted in island regions.
6.1 Grid code for islands
6. Key Interventions for Grid Management in Andaman Islands
Chapter 6
Table 6.1 Functions of Indian Electricity Grid Code
Documentation of principles and procedure that defines relationship of various users
Optimal planning, operation, and maintenance of national/regional grid
Facilitation for functioning of power market and ancillary services
Facilitation of development of renewable energy sources
In order to ensure most secure, reliable, economic, and efficient power system, it is important to adopt mandatory rules, standards, and guidelines to be followed by various persons and participants in the power system to plan, develop, maintain, and operate the power system. Although scale of South Andaman network is very small compared to mainland Indian grid, measuresfacilitating healthy competition in generation and supply of electricity are vital. The Central Electricity Regulatory Commission issues and revises the Indian Electricity Grid Code (IGEC). Functions of IGEC are tabulated in Table 6.1. It brings together a single set of technical and commercial rules, encompassing all the stakeholders connected to/or using the transmission system. The various components of IGEC given are planning code, connection code, operating code, scheduling and dispatch code, and miscellaneous. At the state level, almost all states have issued the State Electricity Grid codes, which cover almost the same set of rules in similar structure, based on state-specific requirements for users of intra-state transmission system apart from supply code, which defines the obligation of supply licensee. Joint Electricity regulatory Commission for the states of Goa and Union Territories (JERC) has issued JERC (state grid code regulations 2010) for the states and UTs under its jurisdiction, which is broadly based on mainland grid operation. The islands have very small grid size and need special treatment. In these regulations, the specific provisions to codify the rules for operation of island grids are not available.
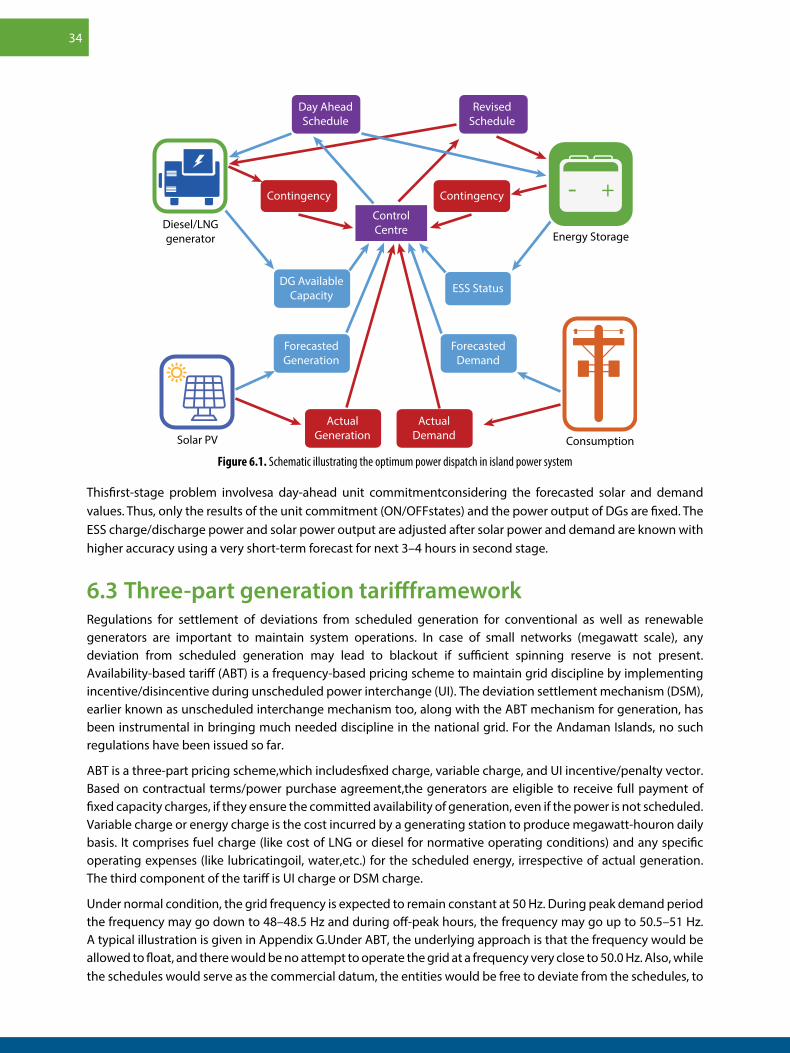
6.2 Dispatch schedule optimization algorithmGeneration planning plays an important role in achieving optimal energy mix, leading to reduced cost of supply. Schematic illustrating the optimum power dispatch in island power system is given in Figure 6.1. The algorithm for the optimization problem is formulated for day-ahead scheduling of the islandpower system including diesel generator (DG)/LNG generator, solar, and energy storage systems(ESS) with frequency criteria. The operating cost is minimized when solar power is used as much as possible. With the given forecasted solar power and demand, the operating mode of the DGs including ON/OFF state and power output is determined every hour/15 min for a 24-h time horizon. The total energy excess or deficiency due to forecasting error is fully compensated by the ESS. Furthermore, the ESS must provide fast frequency response(FFR) if a generator is tripped[13]. Hence, scheduling of the ESS should be donesuch that it not only has enough energy to discharge but also can recharge to utilize much energy from solar power.
34
Thisfirst-stage problem involvesa day-ahead unit commitmentconsidering the forecasted solar and demand values. Thus, only the results of the unit commitment (ON/OFFstates) and the power output of DGs are fixed. The ESS charge/discharge power and solar power output are adjusted after solar power and demand are known with higher accuracy using a very short-term forecast for next 3–4 hours in second stage.
6.3 Three-part generation tariffframeworkRegulations for settlement of deviations from scheduled generation for conventional as well as renewable generators are important to maintain system operations. In case of small networks (megawatt scale), any deviation from scheduled generation may lead to blackout if sufficient spinning reserve is not present. Availability-based tariff (ABT) is a frequency-based pricing scheme to maintain grid discipline by implementing incentive/disincentive during unscheduled power interchange (UI). The deviation settlement mechanism (DSM), earlier known as unscheduled interchange mechanism too, along with the ABT mechanism for generation, has been instrumental in bringing much needed discipline in the national grid. For the Andaman Islands, no such regulations have been issued so far.
ABT is a three-part pricing scheme,which includesfixed charge, variable charge, and UI incentive/penalty vector. Based on contractual terms/power purchase agreement,the generators are eligible to receive full payment of fixed capacity charges, if they ensure the committed availability of generation, even if the power is not scheduled. Variable charge or energy charge is the cost incurred by a generating station to produce megawatt-houron daily basis. It comprises fuel charge (like cost of LNG or diesel for normative operating conditions) and any specific operating expenses (like lubricatingoil, water,etc.) for the scheduled energy, irrespective of actual generation. The third component of the tariff is UI charge or DSM charge.
Under normal condition, the grid frequency is expected to remain constant at 50 Hz. During peak demand period the frequency may go down to 48–48.5 Hz and during off-peak hours, the frequency may go up to 50.5–51 Hz. A typical illustration is given in Appendix G.Under ABT, the underlying approach is that the frequency would be allowed to float, and there would be no attempt to operate the grid at a frequency very close to 50.0 Hz. Also, while the schedules would serve as the commercial datum, the entities would be free to deviate from the schedules, to
Figure 6.1. Schematic illustrating the optimum power dispatch in island power system
Energy Storage
ConsumptionSolar PV
Diesel/LNGgenerator
Day AheadSchedule
DG AvailableCapacity
ForecastedGeneration
ActualGeneration
ActualDemand
ForecastedDemand
ESS Status
RevisedSchedule
ControlCentre
Contingency Contingency

35
achieve real island-wide merit order in generation, in an autonomous, decentralized, and cost-effective manner, without depending on any communication andsupervisory control and data acquisition(SCADA) system. The price vector and frequency band specific to island, based on generation sources and capacity need to be formulated.
The DSM also includes commercial mechanism for reactive power management. Introduction of commercial mechanism for reactive power on these lines may help in voltage management in Andaman too.
6.4 Differential tariff during solar and non-solar hoursFor maximum utilization of solar generation, it is imperative to reduce the demand during non-solar hours and increase the demand during solar hours. The demand pattern of Andaman and Nicobar(A&N) suggests that there is a lot of lighting load for residential and commercial consumers, which can be reduced by replacing the conventional lights with LED, converting street lights into solar street lights.Solar power can also be used for cooling and heating applications.
Currently the levelized cost of solar generation is of the order of Rs 5.00/kWh and current average cost of supply of electricity in A&N is Rs 25.35 per kWh.Acommercial mechanism, wherein consumers are encouraged to use more electricity during daytime, needs to be worked out for minimising cost of supply. The time-of-day (ToD) tariff concept implemented in various states for different categoriesof consumers can be implemented in the island too, with some adjustments.
Table 6.2. Revenue summary for Andaman and Nicobar, as approved by the Joint Electricity Regulatory Commission
S. No. Particulars Amount
1 Net revenue requirement (Rsin crore) 747.85
2 Average cost of supply/unit (Rs/kWh) 25.35
3 Energy sales (MU) 295.06
4 Revenue from tariff (Rs in crore) 203.33
5 Average billing rate (Rs/kWh) 6.89
6 Revenue gap (Rs/kWh) 18.46
7. Total subsidy needed (Rsin crore) 544.52
Table 6.3. Summary of category wise energy sales and revenue
S. No. Category Approved Tariff
AverageRate (INR/unit) % of Average Cost of Supply
1 Life-line connection(Upto 50 units)
2.05 8.09%
2 Domestic 4.38 17.30%
3 Commercial 9.01 35.55%
4 Government connection 10.41 41.07%
5 Industrial 7.4 29.20%
6 Irrigation pumps and agriculture 1.84 7.27%
7 Public lighting 6.75 26.65%
8 Bulk supply 12.54 49.47%
9 Overall 6.89 27.19%

36
The tariff calculation for 2019-20 for Andaman Islands as proposed by Electricity Department, A&N administration and approved by JERC,with revenue summary is given in Table 6.2. Detailed energy sales and revenue are showninAppendix Fand summarized in Table 6.3. In the absence of specific breakup of category wise energy consumption profile, it was assumed that 30% of energy is consumed during solar hours and balance 70% is consumed during non-solar hours by all the consumers in proportion totheir current billing pattern. The variable cost of generation from solar is almost nil, but, there are certain days, when solar generation exceeds the total demand and on other days, DG/LNG continue to operate as spinning reserve, which may cause underutilization of solar generation, therefore, to incentivize the electricity consumption during solar hours, we further assumed that 50% discount be applied on energy supplied during solar hours and 20% surcharge beapplied on non-solar hours.It would be revenue and tariff neutral, as the impact on billing and total revenue is less than 1.0% at these consumption levels. A sensitivity analysis for different discounts and surcharge and impact due to different consumption pattern is shown in Table 6.4
Table 6.4. Sensitivity analysis for ToD tariff
Tariff Generation Revenue (Rs in crore) Difference (%)
Solar Hours Non-solar Hours Solar Hours Non-solar Hours
100% 100% 30% 70% 203.34 0%
50% 120% 30% 70% 201.37 0.97%
60% 120% 30% 70% 207.28 -1.94%
40% 120% 30% 70% 195.47 3.87%
50% 110% 30% 70% 187.60 7.74%
50% 130% 30% 70% 215.15 -5.81%
50% 120% 25% 75% 208.26 -2.42%
50% 120% 35% 65% 194.95 4.13%
Assuming the variable cost of generation from LNG at Rs 10.00/kwh and nil from solar plants, the revenue gap is calculated to be Rs 5.16 crores(excluding fixed cost of generation).Due to such changes in tariff, the consumption is increased during solar hours to 40% and only 60% consumption remains during non-solar hours, the average tariff for consumers (or the revenue realization) would further reduce by approximately7% and at the same time there would be revenue surplus of Rs 10.5 crores(excluding fixed cost of generation). The revenue gap calculations under various solar use scenariosare given in Figure 6.2.
The revenue surplus can be used for setting up more solar/renewable energyinstallations, in place of paying for subsidy towards diesel. Also, this tariff model can be further tweaked, with differential discounts and surcharges, so that electric vehicle charging, industrial consumption, and energy storage systems can use maximum electrical energy during solar hours only.

37
Figure 6.2. Results of revenue gap calculations under various solar-use scenarios
6.5 Frequency responseSystem frequency is a continuously changing variable that is determined and controlled by the second-by-second (real time) balances between system demand and total generation. The ABT along with the Indian Electricity Grid Code and ToDtariff has been able to manage the national grid effectively; however, a few distinct issues related to frequency response for isolated solar–diesel/LNG-energy storage system require extensive analysis. In this regard, atechnical document prepared by the NERC Resources Subcommittee[14](which provides a control continuum for balancing and frequency control over a continuum of time using different resources) may be referred. .
In [15], review of various frequency response characteristics is presented. The sequence of responses of various elements is given in Figure 6.3. Any change in frequency is inherently opposed by system inertia. It is desirable to have a system with higher inertia. The network’s contribution to the frequency response comprises two components, namely, load response and governor response of generators.
The most crucial frequency control activity is the primary frequency control response (PFR), which is based on the characteristic of the conventional speed governor. In networks with high renewable penetration, frequency response is more crucial as renewable power plants are power electronic-based system (i.e., no inertial). Furthermore, due to the stochastic nature of wind and solar irradiation, the reserved capacity for PFR from renewable energy systems is also uncertain.
-15
-10
-5
0
5
10
15
20
25
30
0
50
100
150
200
250
0.20 0.25 0.30 0.35 0.40 0.45 0.50 0.55
Reve
nue
surp
lus
(Cr R
s)Ta
riff
redu
ctio
n (%
)
Var
iabl
e co
st o
f gen
erat
ion
(Cr R
s)Re
venu
e (C
r Rs)
Fraction of solar energy generation
Variable Cost of generation (Cr Rs)
Revenue (Rs Cr)
Revenue Surplus, excluding �xed cost of generation (Rs Cr)
Tari� reduction
Figure 6.3. Resources contributing to frequency management in a control area
FrequencyResponse
Regulations(seconds to
minutes)
OperatingReserves
(10-15 min)
LoadFollowing(30 min)
Market(hourly)
Time

38
In island power systems, frequency control and regulation are even more challenging because the primary resources are DGs with low inertia and limited operating capability. With the increasing penetration of renewable generation and energy storage in power systems, the fast frequency response (FFR) method has been introduced as a measure to improve frequency stability[16]. With a very short response time, which can be less than 250 ms depending on the technology, ESSsare able to instantly increase or decrease their power output to counteract a system power imbalance[17].
The LNG/DGs with suitable spinning and non-spinning reserves are capable of taking care of secondary and tertiary responses in an island grid, if suitable automatic generation control, SCADA is implemented, due to their fast start-up and load capabilities. Based on this, an optimal day-ahead scheduling problem can be defined as simultaneously minimizing the operating cost of the system, take full advantage of the available solar power, and ensure that the ESS has enough energy to provide FFR when the solar power and demand are uncertain.

39
7. Study Findings, Gaps, and Proposed Interventions
Chapter 7
Various power plants are linked with 33 kV transmission line network in mesh configuration. The transmission lines are double circuited to ensure reliability. The challenges faced by the electricity department have been reported in different categories,namely, technical, operational, and financial. As per present strategy, the hiring power plants are contracted to meet monthly energy generation and capacity availability in peak hours as per specific terms and conditions. Power plants operated by electricity department supply balance of power to meet the system demand and maintain the grid. In the event of any mismatch between generation and demand, it is reported that grid voltage and frequency vary, which leads to generators moving out of the system and consequently resulting in blackouts.
Further, there is an expected increase in demand by 2022 because of the new airport terminal and other development activities coming into being. Various studies conducted on system planning have made projections based on future growth rate of 10%. The actual demand growth for the last few years, however, has been seen to be around 2% only YoY. This could probably be due to the demand-side management programmes being implemented by electricity department and also because of limited generation capabilities. In this study, both the scenarios of demand growth,namely, low (2%) and high (10%) have been considered for carrying out load flow studies for current status and various other scenarios; these studies were made for April and September, which have minimum and maximum demand, respectively. For developing various scenarios, basic approach was taken that the projected demand can be met either by proposed LNG-based power plant of 50 MW along with 25 MW of solar PV power plant in normal conditions or upscaling solar capacity to 50 MW in high renewable energy(RE) scenario. The studies have also been conducted considering a scenario in which there is no LNG plant by 2022. Till now, various scenarios have been developed and studied with and without LNG power plant in both low growth and high growth.
The focus of the study has been set upon capitalizing the use of solar (25 MW–50 MW) in combination with either LNG (which is likely to be the case in future) or with diesel generators (DG) sets (which is the current case), based on cost and climatic conditions.
It is worthwhile to mention here that literature review for high RE scenarios in islands along with that of the Indian grid scenario during early 2000s when regional grids faced issues related to imbalances of demand and supply was also undertaken under this study. It is recommended to develop the grid code for islands, which may include, among others, RE generation and demand forecasting on daily basis. A Renewable Energy Management Centre is already planned for Andaman Islands and that may be considered for assigning such tasks. This would facilitate preparation of daily schedule on day-ahead 15-min basis based on projected demand, solar generation, and availability of other generators. Planning of the day-ahead scheduling is important as it is observed that the operating cost of DG/LNG generator could be minimized when solar power is used as much as possible; the total energy excess or deficiency due to forecasting error is compensated by the energy storage system (ESS). However, the ESS must provide fast frequency response if a generator is tripped. Generators and loads may be suitably incentivized to maintain frequency within operating band during real-time operation, which may include three-part tariff for generators and time-of-day tariff for consumers.

40
The report includes learning from these reviews. The cost of generation was also evaluated for current operations and was compared with alternative power dispatch models.
In addition, the following inferences/recommendations are made:
» It is observed that the projected generation shall be sufficient to meet the demand as per load growth projections of South Andaman in steady-state conditions. However,
• Suitable reactive power compensation would be needed for the scenario with ‘only LNG and PV’ scenarios, as low-voltage conditions at various 33 kV and 11 kV feeders are observed with transformers loading at Phoenix Bay Power House near the threshold.
• Battery storage with peak shifting features would be required during daytime as PV production is greater than the daytime load in high PV scenario (50MWp).
• In scenarios with DGs, it was observed that the voltage and loading are within limit and battery to reduce PV intermittency is recommended.
» Improvement in communication system is recommended as at present it is a manual very high frequency-based communication system.
» Renovation and modernization of the distribution network is needed to revisit the long distance distribution lines.
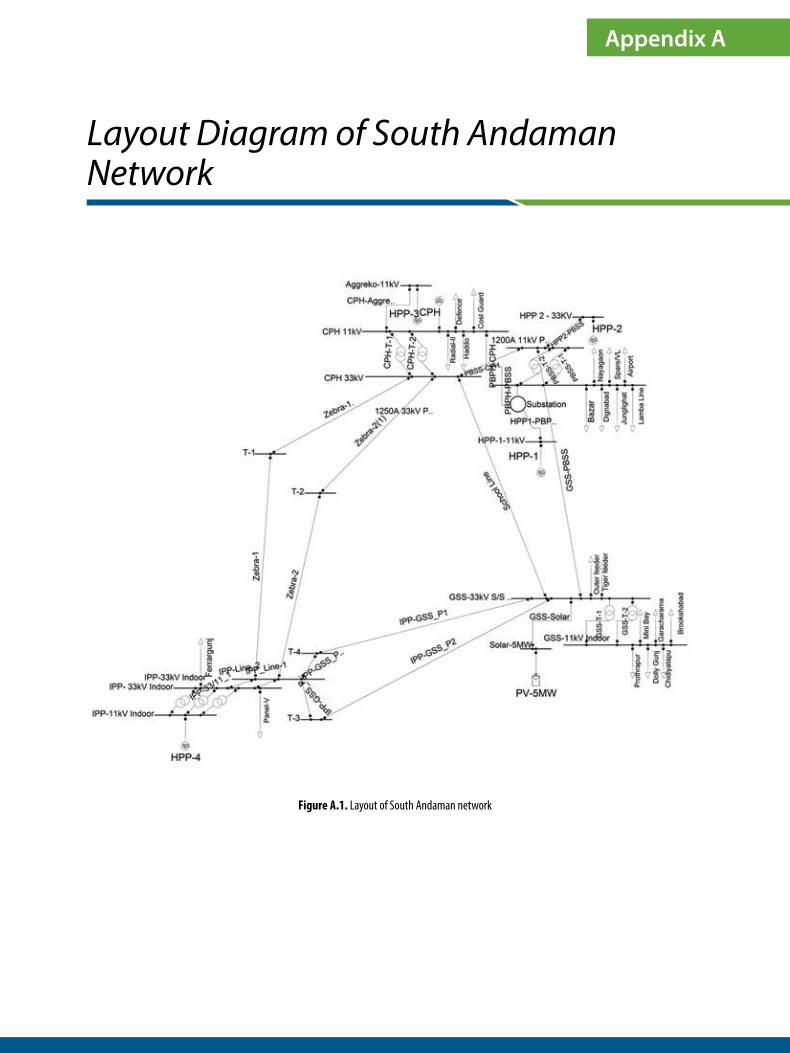
Layout Diagram of South Andaman Network
Appendix A
Figure A.1. Layout of South Andaman network
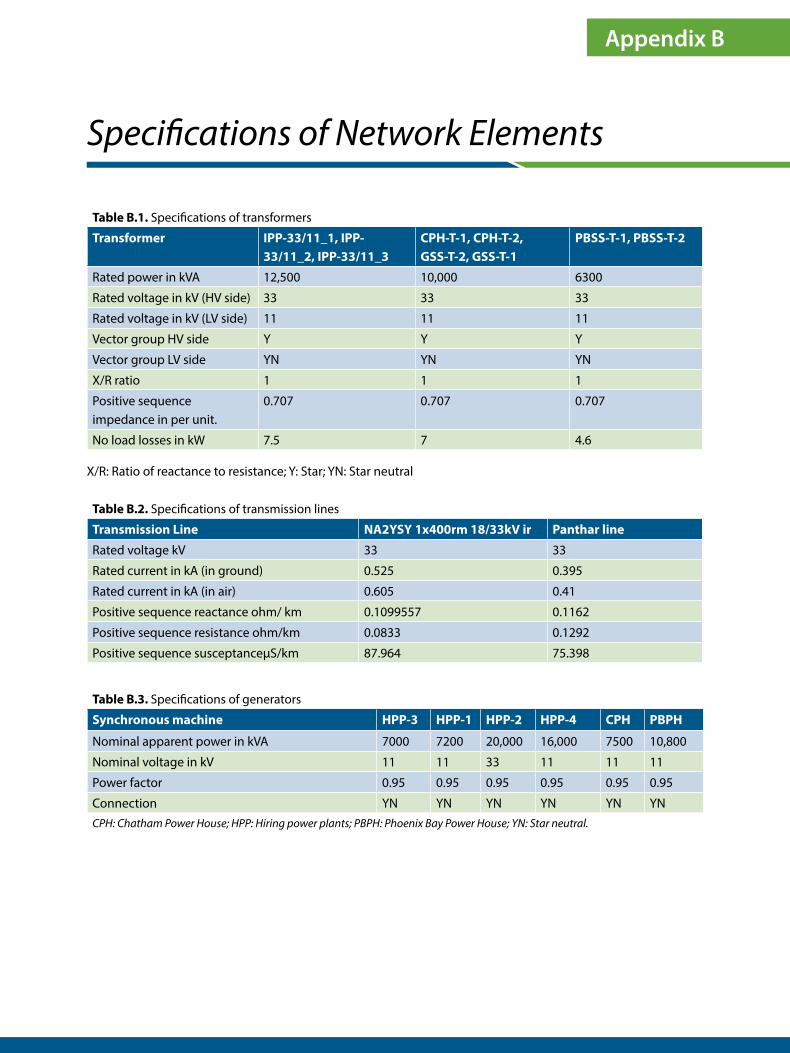
X/R: Ratio of reactance to resistance; Y: Star; YN: Star neutral
Specifications of Network Elements
Appendix B
Table B.1. Specifications of transformers
Transformer IPP-33/11_1, IPP-33/11_2, IPP-33/11_3
CPH-T-1, CPH-T-2, GSS-T-2, GSS-T-1
PBSS-T-1, PBSS-T-2
Rated power in kVA 12,500 10,000 6300
Rated voltage in kV (HV side) 33 33 33
Rated voltage in kV (LV side) 11 11 11
Vector group HV side Y Y Y
Vector group LV side YN YN YN
X/R ratio 1 1 1
Positive sequence impedance in per unit.
0.707 0.707 0.707
No load losses in kW 7.5 7 4.6
Table B.2. Specifications of transmission lines
Transmission Line NA2YSY 1x400rm 18/33kV ir Panthar line
Rated voltage kV 33 33
Rated current in kA (in ground) 0.525 0.395
Rated current in kA (in air) 0.605 0.41
Positive sequence reactance ohm/ km 0.1099557 0.1162
Positive sequence resistance ohm/km 0.0833 0.1292
Positive sequence susceptanceµS/km 87.964 75.398
Table B.3. Specifications of generators
Synchronous machine HPP-3 HPP-1 HPP-2 HPP-4 CPH PBPH
Nominal apparent power in kVA 7000 7200 20,000 16,000 7500 10,800
Nominal voltage in kV 11 11 33 11 11 11
Power factor 0.95 0.95 0.95 0.95 0.95 0.95
Connection YN YN YN YN YN YNCPH: Chatham Power House; HPP: Hiring power plants; PBPH: Phoenix Bay Power House; YN: Star neutral.
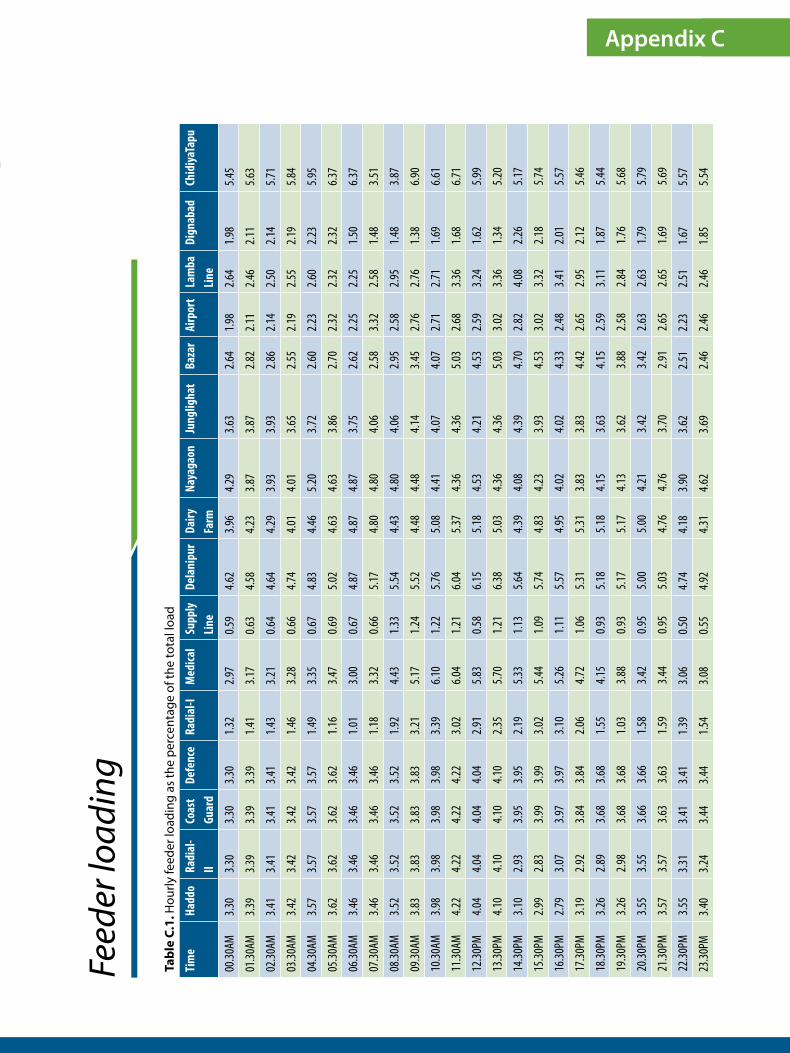
43
Feed
er lo
adin
g
Appendix C
Tabl
e C.
1. H
ourly
feed
er lo
adin
g as
the
perc
enta
ge o
f the
tota
l loa
d
Tim
eHa
ddo
Radi
al-
IICo
ast
Guar
dDe
fenc
eRa
dial
-IM
edica
lSu
pply
Lin
eDe
lani
pur
Dairy
Fa
rmNa
yaga
onJu
nglig
hat
Baza
rAi
rpor
tLa
mba
Lin
eDi
gnab
adCh
idiya
Tapu
00.30
AM3.3
03.3
03.3
03.3
01.3
22.9
70.5
94.6
23.9
64.2
93.6
32.6
41.9
82.6
41.9
85.4
5
01.30
AM3.3
93.3
93.3
93.3
91.4
13.1
70.6
34.5
84.2
33.8
73.8
72.8
22.1
12.4
62.1
15.6
3
02.30
AM3.4
13.4
13.4
13.4
11.4
33.2
10.6
44.6
44.2
93.9
33.9
32.8
62.1
42.5
02.1
45.7
1
03.30
AM3.4
23.4
23.4
23.4
21.4
63.2
80.6
64.7
44.0
14.0
13.6
52.5
52.1
92.5
52.1
95.8
4
04.30
AM3.5
73.5
73.5
73.5
71.4
93.3
50.6
74.8
34.4
65.2
03.7
22.6
02.2
32.6
02.2
35.9
5
05.30
AM3.6
23.6
23.6
23.6
21.1
63.4
70.6
95.0
24.6
34.6
33.8
62.7
02.3
22.3
22.3
26.3
7
06.30
AM3.4
63.4
63.4
63.4
61.0
13.0
00.6
74.8
74.8
74.8
73.7
52.6
22.2
52.2
51.5
06.3
7
07.30
AM3.4
63.4
63.4
63.4
61.1
83.3
20.6
65.1
74.8
04.8
04.0
62.5
83.3
22.5
81.4
83.5
1
08.30
AM3.5
23.5
23.5
23.5
21.9
24.4
31.3
35.5
44.4
34.8
04.0
62.9
52.5
82.9
51.4
83.8
7
09.30
AM3.8
33.8
33.8
33.8
33.2
15.1
71.2
45.5
24.4
84.4
84.1
43.4
52.7
62.7
61.3
86.9
0
10.30
AM3.9
83.9
83.9
83.9
83.3
96.1
01.2
25.7
65.0
84.4
14.0
74.0
72.7
12.7
11.6
96.6
1
11.30
AM4.2
24.2
24.2
24.2
23.0
26.0
41.2
16.0
45.3
74.3
64.3
65.0
32.6
83.3
61.6
86.7
1
12.30
PM4.0
44.0
44.0
44.0
42.9
15.8
30.5
86.1
55.1
84.5
34.2
14.5
32.5
93.2
41.6
25.9
9
13.30
PM4.1
04.1
04.1
04.1
02.3
55.7
01.2
16.3
85.0
34.3
64.3
65.0
33.0
23.3
61.3
45.2
0
14.30
PM3.1
02.9
33.9
53.9
52.1
95.3
31.1
35.6
44.3
94.0
84.3
94.7
02.8
24.0
82.2
65.1
7
15.30
PM2.9
92.8
33.9
93.9
93.0
25.4
41.0
95.7
44.8
34.2
33.9
34.5
33.0
23.3
22.1
85.7
4
16.30
PM2.7
93.0
73.9
73.9
73.1
05.2
61.1
15.5
74.9
54.0
24.0
24.3
32.4
83.4
12.0
15.5
7
17.30
PM3.1
92.9
23.8
43.8
42.0
64.7
21.0
65.3
15.3
13.8
33.8
34.4
22.6
52.9
52.1
25.4
6
18.30
PM3.2
62.8
93.6
83.6
81.5
54.1
50.9
35.1
85.1
84.1
53.6
34.1
52.5
93.1
11.8
75.4
4
19.30
PM3.2
62.9
83.6
83.6
81.0
33.8
80.9
35.1
75.1
74.1
33.6
23.8
82.5
82.8
41.7
65.6
8
20.30
PM3.5
53.5
53.6
63.6
61.5
83.4
20.9
55.0
05.0
04.2
13.4
23.4
22.6
32.6
31.7
95.7
9
21.30
PM3.5
73.5
73.6
33.6
31.5
93.4
40.9
55.0
34.7
64.7
63.7
02.9
12.6
52.6
51.6
95.6
9
22.30
PM3.5
53.3
13.4
13.4
11.3
93.0
60.5
04.7
44.1
83.9
03.6
22.5
12.2
32.5
11.6
75.5
7
23.30
PM3.4
03.2
43.4
43.4
41.5
43.0
80.5
54.9
24.3
14.6
23.6
92.4
62.4
62.4
61.8
55.5
4
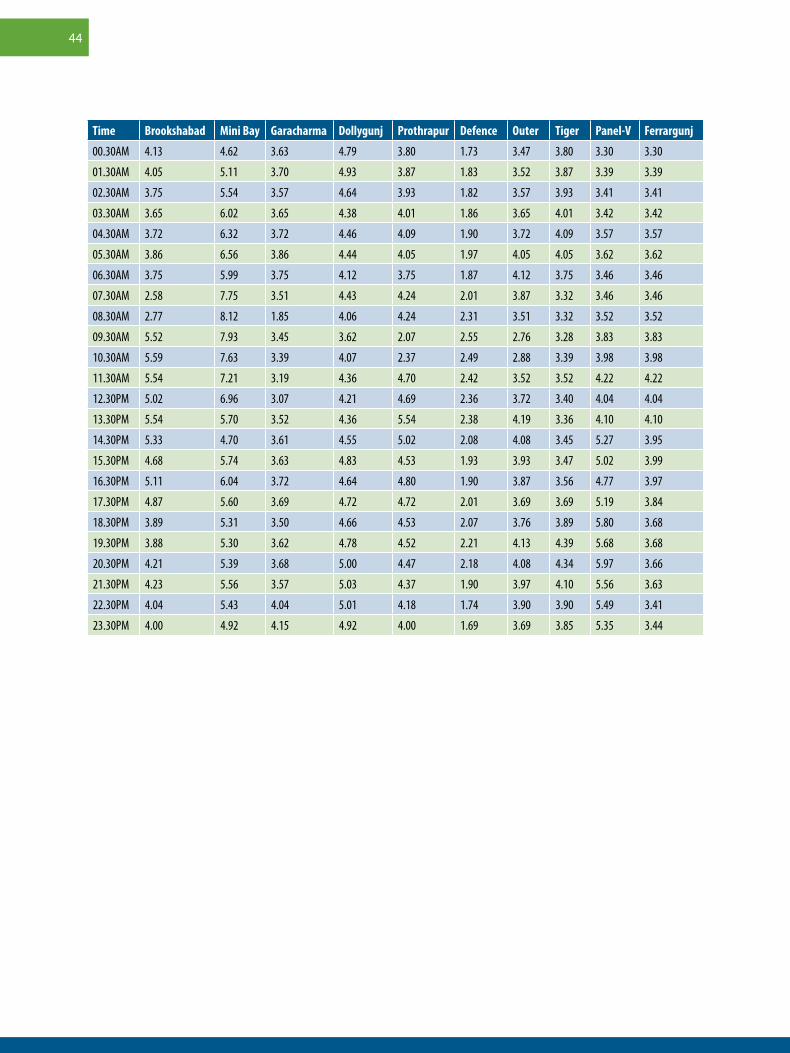
44
Time Brookshabad Mini Bay Garacharma Dollygunj Prothrapur Defence Outer Tiger Panel-V Ferrargunj
00.30AM 4.13 4.62 3.63 4.79 3.80 1.73 3.47 3.80 3.30 3.30
01.30AM 4.05 5.11 3.70 4.93 3.87 1.83 3.52 3.87 3.39 3.39
02.30AM 3.75 5.54 3.57 4.64 3.93 1.82 3.57 3.93 3.41 3.41
03.30AM 3.65 6.02 3.65 4.38 4.01 1.86 3.65 4.01 3.42 3.42
04.30AM 3.72 6.32 3.72 4.46 4.09 1.90 3.72 4.09 3.57 3.57
05.30AM 3.86 6.56 3.86 4.44 4.05 1.97 4.05 4.05 3.62 3.62
06.30AM 3.75 5.99 3.75 4.12 3.75 1.87 4.12 3.75 3.46 3.46
07.30AM 2.58 7.75 3.51 4.43 4.24 2.01 3.87 3.32 3.46 3.46
08.30AM 2.77 8.12 1.85 4.06 4.24 2.31 3.51 3.32 3.52 3.52
09.30AM 5.52 7.93 3.45 3.62 2.07 2.55 2.76 3.28 3.83 3.83
10.30AM 5.59 7.63 3.39 4.07 2.37 2.49 2.88 3.39 3.98 3.98
11.30AM 5.54 7.21 3.19 4.36 4.70 2.42 3.52 3.52 4.22 4.22
12.30PM 5.02 6.96 3.07 4.21 4.69 2.36 3.72 3.40 4.04 4.04
13.30PM 5.54 5.70 3.52 4.36 5.54 2.38 4.19 3.36 4.10 4.10
14.30PM 5.33 4.70 3.61 4.55 5.02 2.08 4.08 3.45 5.27 3.95
15.30PM 4.68 5.74 3.63 4.83 4.53 1.93 3.93 3.47 5.02 3.99
16.30PM 5.11 6.04 3.72 4.64 4.80 1.90 3.87 3.56 4.77 3.97
17.30PM 4.87 5.60 3.69 4.72 4.72 2.01 3.69 3.69 5.19 3.84
18.30PM 3.89 5.31 3.50 4.66 4.53 2.07 3.76 3.89 5.80 3.68
19.30PM 3.88 5.30 3.62 4.78 4.52 2.21 4.13 4.39 5.68 3.68
20.30PM 4.21 5.39 3.68 5.00 4.47 2.18 4.08 4.34 5.97 3.66
21.30PM 4.23 5.56 3.57 5.03 4.37 1.90 3.97 4.10 5.56 3.63
22.30PM 4.04 5.43 4.04 5.01 4.18 1.74 3.90 3.90 5.49 3.41
23.30PM 4.00 4.92 4.15 4.92 4.00 1.69 3.69 3.85 5.35 3.44

45
Present case
Hourly interval
Additional Simulation Results
Appendix D
05
10152025303540
0:00
2:06
4:12
6:18
8:24
10:3
012
:36
14:4
216
:48
18:5
421
:00
Pow
er (M
W)
Time
RooftopSolar 1MWp SOLAR5MWp CPHPBPHAggreko(5MW) HPP-1(5MW) HPP-4(10MW)
Figure D.1: Map of a network showing loading and voltage levels in ‘hourly variation and Phoenix Bay Power House as slack generator’ for April
0
5
10
15
20
25
30
35
0:00
2:06
4:12
6:18
8:24
10:3
012
:36
14:4
216
:48
18:5
421
:00
Pow
er (M
W)
Time
HPP-2(10 MW) SOLAR5MWp CPHPBPHAggreko(5MW) HPP-1(5MW)HPP-4(10MW)
Figure D.2: . Power sharing and network loading in ‘hourly variation and HPP-2 as slack generator’ for September
Loading Range
80%
1. p.u.
1. p.u.
0.95 p.u.
1.05 p.u.
1.1 p.u.
0.9 p.u.
...
...
...
...
100%
Lower Voltage Range
Upper Voltage Range
8
1
1
0
1
1
0
..
..
..
..
1
Lower
Uppe
Loading Range
80%
1. p.u.
1. p.u.
0.95 p.u.
1.05 p.u.
1.1 p.u.
0.9 p.u.
...
...
...
...
100%
Lower Voltage Range
Upper Voltage Range
8
1
1
0
1
1
0
..
..
..
..
1
Lower
Uppe
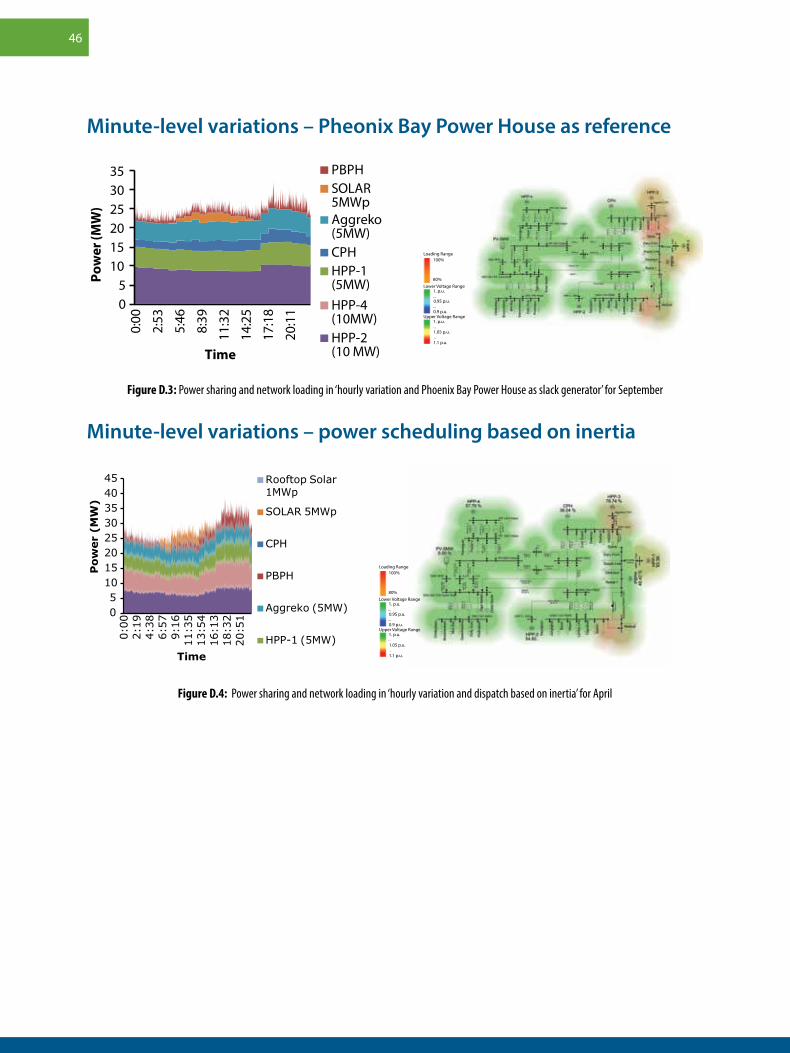
46
Minute-level variations – Pheonix Bay Power House as reference
05
101520253035
0:00
2:53
5:46
8:39
11:3
2
14:2
5
17:1
8
20:1
1
Pow
er (M
W)
Time
PBPHSOLAR5MWpAggreko(5MW)CPHHPP-1(5MW)HPP-4(10MW)HPP-2(10 MW)
Figure D.3: Power sharing and network loading in ‘hourly variation and Phoenix Bay Power House as slack generator’ for September
Minute-level variations – power scheduling based on inertia
Figure D.4: Power sharing and network loading in ‘hourly variation and dispatch based on inertia’ for April
05
1015202530354045
0:00
2:19
4:38
6:57
9:16
11:3
513
:54
16:1
318
:32
20:5
1
Pow
er (
MW
)
Time
Rooftop Solar1MWp
SOLAR 5MWp
CPH
PBPH
Aggreko (5MW)
HPP-1 (5MW)
Loading Range
80%
1. p.u.
1. p.u.
0.95 p.u.
1.05 p.u.
1.1 p.u.
0.9 p.u.
...
...
...
...
100%
Lower Voltage Range
Upper Voltage Range
8
1
1
0
1
1
0
..
..
..
..
1
Lower
Uppe
Loading Range
80%
1. p.u.
1. p.u.
0.95 p.u.
1.05 p.u.
1.1 p.u.
0.9 p.u.
...
...
...
...
100%
Lower Voltage Range
Upper Voltage Range
8
1
1
0
1
1
0
..
..
..
..
1
Lower
Uppe
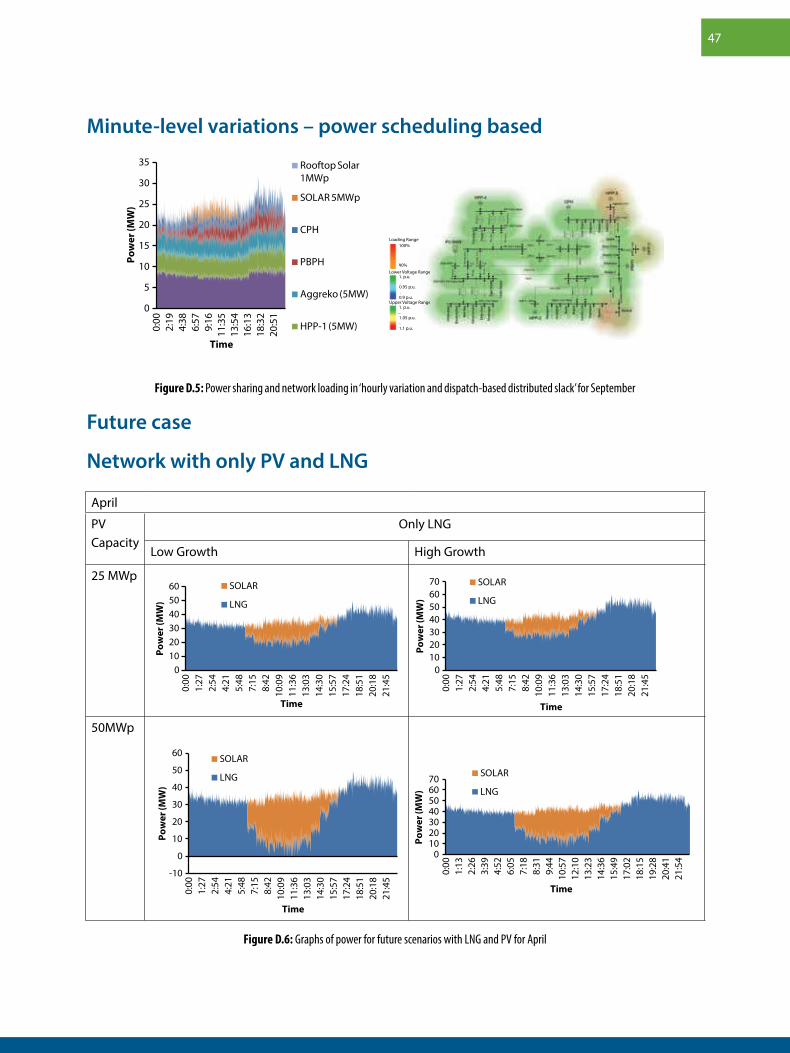
47
Minute-level variations – power scheduling based
Figure D.5: Power sharing and network loading in ‘hourly variation and dispatch-based distributed slack’ for September
0
5
10
15
20
25
30
350:
002:
194:
386:
579:
1611
:35
13:5
416
:13
18:3
220
:51
Pow
er (M
W)
Time
Rooftop Solar1MWp
SOLAR 5MWp
CPH
PBPH
Aggreko (5MW)
HPP-1 (5MW)
Future case
Network with only PV and LNG
April
PV Capacity
Only LNG
Low Growth High Growth
25 MWp
50MWp
Figure D.6: Graphs of power for future scenarios with LNG and PV for April
0102030405060
0:00
1:27
2:54
4:21
5:48
7:15
8:42
10:0
911
:36
13:0
314
:30
15:5
717
:24
18:5
120
:18
21:4
5
Pow
er (M
W)
Time
SOLAR
LNG
010203040506070
0:00
1:27
2:54
4:21
5:48
7:15
8:42
10:0
911
:36
13:0
314
:30
15:5
717
:24
18:5
120
:18
21:4
5
Pow
er (M
W)
Time
SOLAR
LNG
-10
0
10
20
30
40
50
60
0:00
1:27
2:54
4:21
5:48
7:15
8:42
10:0
911
:36
13:0
314
:30
15:5
717
:24
18:5
120
:18
21:4
5
Pow
er (M
W)
Time
Time
SOLAR
LNG
010203040506070
0:00
1:13
2:26
3:39
4:52
6:05
7:18
8:31
9:44
10:5
712
:10
13:2
314
:36
15:4
917
:02
18:1
519
:28
20:4
121
:54
Pow
er (M
W)
SOLAR
LNG
Loading Range
80%
1. p.u.
1. p.u.
0.95 p.u.
1.05 p.u.
1.1 p.u.
0.9 p.u.
...
...
...
...
100%
Lower Voltage Range
Upper Voltage Range
8
1
1
0
1
1
0
..
..
..
..
1
Lower
Uppe
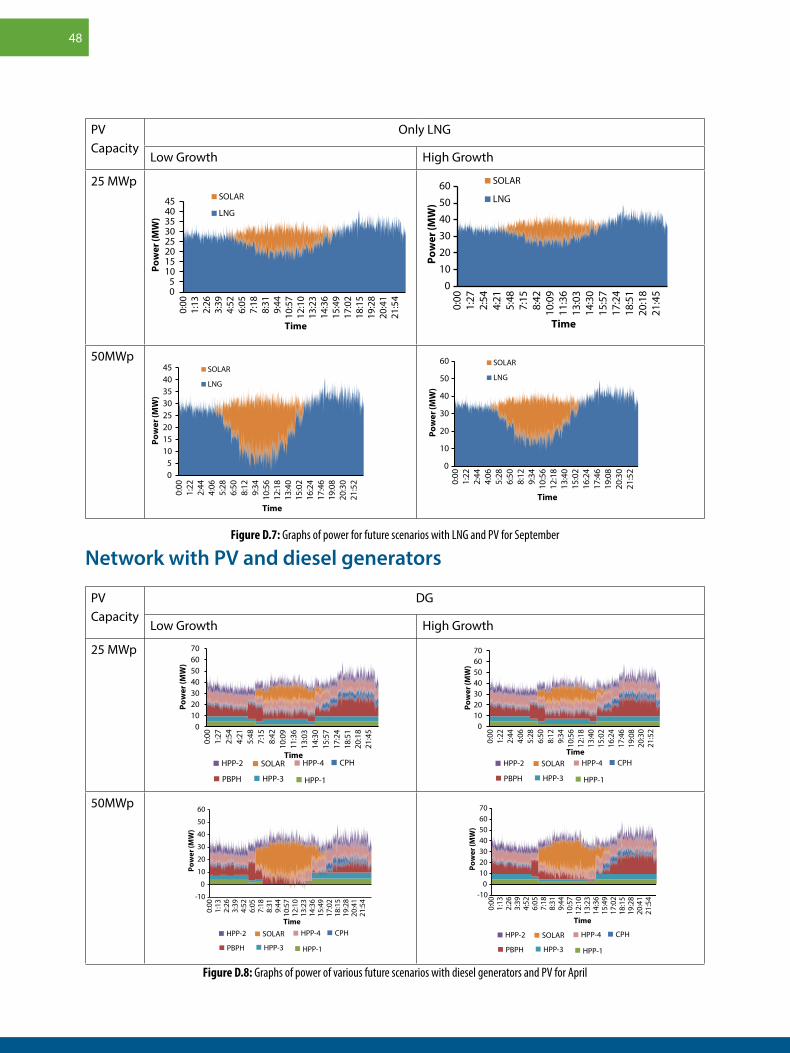
48
Network with PV and diesel generators
Figure D.8: Graphs of power of various future scenarios with diesel generators and PV for April
PV Capacity
Only LNG
Low Growth High Growth
25 MWpSOLAR
LNG
SOLAR
LNG
SOLAR
LNG
SOLAR
LNG
05
1015202530354045
Pow
er (M
W)
Time
0102030405060
Pow
er (M
W)
Time
05
1015202530354045
Pow
er (M
W)
Time
0
10
20
30
40
50
60
Pow
er (M
W)
Time
20:3
021
:52
0:00
1:22
2:44
4:06
5:28
6:50
8:12
9:34
10:5
612
:18
13:4
015
:02
16:2
417
:46
19:0
8
0:00
1:22
2:44
4:06
5:28
6:50
8:12
9:34
10:5
612
:18
13:4
015
:02
16:2
417
:46
19:0
820
:30
21:5
2
0:00
1:13
2:26
3:39
4:52
6:05
7:18
8:31
9:44
10:5
712
:10
13:2
314
:36
15:4
917
:02
18:1
519
:28
20:4
121
:54
0:00
1:27
2:54
4:21
5:48
7:15
8:42
10:0
911
:36
13:0
314
:30
15:5
717
:24
18:5
120
:18
21:4
5
SOLAR
LNG
SOLAR
LNG
SOLAR
LNG
SOLAR
LNG
05
1015202530354045
Pow
er (M
W)
Time
0102030405060
Pow
er (M
W)
Time
05
1015202530354045
Pow
er (M
W)
Time
0
10
20
30
40
50
60
Pow
er (M
W)
Time
20:3
021
:52
0:00
1:22
2:44
4:06
5:28
6:50
8:12
9:34
10:5
612
:18
13:4
015
:02
16:2
417
:46
19:0
8
0:00
1:22
2:44
4:06
5:28
6:50
8:12
9:34
10:5
612
:18
13:4
015
:02
16:2
417
:46
19:0
820
:30
21:5
2
0:00
1:13
2:26
3:39
4:52
6:05
7:18
8:31
9:44
10:5
712
:10
13:2
314
:36
15:4
917
:02
18:1
519
:28
20:4
121
:54
0:00
1:27
2:54
4:21
5:48
7:15
8:42
10:0
911
:36
13:0
314
:30
15:5
717
:24
18:5
120
:18
21:4
5
50MWp
SOLAR
LNG
SOLAR
LNG
SOLAR
LNG
SOLAR
LNG
05
1015202530354045
Pow
er (M
W)
Time
0102030405060
Pow
er (M
W)
Time
05
1015202530354045
Pow
er (M
W)
Time
0
10
20
30
40
50
60Po
wer
(MW
)
Time
20:3
021
:52
0:00
1:22
2:44
4:06
5:28
6:50
8:12
9:34
10:5
612
:18
13:4
015
:02
16:2
417
:46
19:0
8
0:00
1:22
2:44
4:06
5:28
6:50
8:12
9:34
10:5
612
:18
13:4
015
:02
16:2
417
:46
19:0
820
:30
21:5
2
0:00
1:13
2:26
3:39
4:52
6:05
7:18
8:31
9:44
10:5
712
:10
13:2
314
:36
15:4
917
:02
18:1
519
:28
20:4
121
:54
0:00
1:27
2:54
4:21
5:48
7:15
8:42
10:0
911
:36
13:0
314
:30
15:5
717
:24
18:5
120
:18
21:4
5
SOLAR
LNG
SOLAR
LNG
SOLAR
LNG
SOLAR
LNG
05
1015202530354045
Pow
er (M
W)
Time
0102030405060
Pow
er (M
W)
Time
05
1015202530354045
Pow
er (M
W)
Time
0
10
20
30
40
50
60
Pow
er (M
W)
Time
20:3
021
:52
0:00
1:22
2:44
4:06
5:28
6:50
8:12
9:34
10:5
612
:18
13:4
015
:02
16:2
417
:46
19:0
8
0:00
1:22
2:44
4:06
5:28
6:50
8:12
9:34
10:5
612
:18
13:4
015
:02
16:2
417
:46
19:0
820
:30
21:5
2
0:00
1:13
2:26
3:39
4:52
6:05
7:18
8:31
9:44
10:5
712
:10
13:2
314
:36
15:4
917
:02
18:1
519
:28
20:4
121
:54
0:00
1:27
2:54
4:21
5:48
7:15
8:42
10:0
911
:36
13:0
314
:30
15:5
717
:24
18:5
120
:18
21:4
5
Figure D.7: Graphs of power for future scenarios with LNG and PV for September
PV Capacity
DG
Low Growth High Growth
25 MWp
010203040506070
0:00
1:27
2:54
4:21
5:48
7:15
8:42
10:0
911
:36
13:0
314
:30
15:5
717
:24
18:5
120
:18
21:4
5
Time
010203040506070
Pow
er (M
W)
Pow
er (M
W)
Time
-10
0
10
20
30
40
50
60
Pow
er (M
W)
Time
-100
10203040506070
Pow
er (M
W)
Time
0:00
1:13
2:26
3:39
4:52
6:05
7:18
8:31
9:44
10:5
712
:10
13:2
314
:36
15:4
917
:02
18:1
519
:28
20:4
121
:54
18:1
519
:28
20:4
121
:54
0:00
1:13
2:26
3:39
4:52
6:05
7:18
8:31
9:44
10:5
712
:10
13:2
314
:36
15:4
917
:02
0:00
1:22
2:44
4:06
5:28
6:50
8:12
9:34
10:5
612
:18
13:4
015
:02
16:2
417
:46
19:0
820
:30
21:5
2
HPP-2 HPP-4
HPP-4
HPP-3 HPP-1
CPH
PBPH
SOLAR HPP-2 HPP-4
HPP-3 HPP-1
CPH
PBPH
SOLAR
HPP-2
HPP-3 HPP-1
CPH
PBPH
SOLAR HPP-2 HPP-4
HPP-3 HPP-1
CPH
PBPH
SOLAR
010203040506070
0:00
1:27
2:54
4:21
5:48
7:15
8:42
10:0
911
:36
13:0
314
:30
15:5
717
:24
18:5
120
:18
21:4
5
Time
010203040506070
Pow
er (M
W)
Pow
er (M
W)
Time
-10
0
10
20
30
40
50
60
Pow
er (M
W)
Time
-100
10203040506070
Pow
er (M
W)
Time
0:00
1:13
2:26
3:39
4:52
6:05
7:18
8:31
9:44
10:5
712
:10
13:2
314
:36
15:4
917
:02
18:1
519
:28
20:4
121
:54
18:1
519
:28
20:4
121
:54
0:00
1:13
2:26
3:39
4:52
6:05
7:18
8:31
9:44
10:5
712
:10
13:2
314
:36
15:4
917
:02
0:00
1:22
2:44
4:06
5:28
6:50
8:12
9:34
10:5
612
:18
13:4
015
:02
16:2
417
:46
19:0
820
:30
21:5
2
HPP-2 HPP-4
HPP-4
HPP-3 HPP-1
CPH
PBPH
SOLAR HPP-2 HPP-4
HPP-3 HPP-1
CPH
PBPH
SOLAR
HPP-2
HPP-3 HPP-1
CPH
PBPH
SOLAR HPP-2 HPP-4
HPP-3 HPP-1
CPH
PBPH
SOLAR
50MWp
010203040506070
0:00
1:27
2:54
4:21
5:48
7:15
8:42
10:0
911
:36
13:0
314
:30
15:5
717
:24
18:5
120
:18
21:4
5
Time
010203040506070
Pow
er (M
W)
Pow
er (M
W)
Time
-10
0
10
20
30
40
50
60
Pow
er (M
W)
Time
-100
10203040506070
Pow
er (M
W)
Time
0:00
1:13
2:26
3:39
4:52
6:05
7:18
8:31
9:44
10:5
712
:10
13:2
314
:36
15:4
917
:02
18:1
519
:28
20:4
121
:54
18:1
519
:28
20:4
121
:54
0:00
1:13
2:26
3:39
4:52
6:05
7:18
8:31
9:44
10:5
712
:10
13:2
314
:36
15:4
917
:02
0:00
1:22
2:44
4:06
5:28
6:50
8:12
9:34
10:5
612
:18
13:4
015
:02
16:2
417
:46
19:0
820
:30
21:5
2
HPP-2 HPP-4
HPP-4
HPP-3 HPP-1
CPH
PBPH
SOLAR HPP-2 HPP-4
HPP-3 HPP-1
CPH
PBPH
SOLAR
HPP-2
HPP-3 HPP-1
CPH
PBPH
SOLAR HPP-2 HPP-4
HPP-3 HPP-1
CPH
PBPH
SOLAR
010203040506070
0:00
1:27
2:54
4:21
5:48
7:15
8:42
10:0
911
:36
13:0
314
:30
15:5
717
:24
18:5
120
:18
21:4
5
Time
010203040506070
Pow
er (M
W)
Pow
er (M
W)
Time
-10
0
10
20
30
40
50
60
Pow
er (M
W)
Time
-100
10203040506070
Pow
er (M
W)
Time
0:00
1:13
2:26
3:39
4:52
6:05
7:18
8:31
9:44
10:5
712
:10
13:2
314
:36
15:4
917
:02
18:1
519
:28
20:4
121
:54
18:1
519
:28
20:4
121
:54
0:00
1:13
2:26
3:39
4:52
6:05
7:18
8:31
9:44
10:5
712
:10
13:2
314
:36
15:4
917
:02
0:00
1:22
2:44
4:06
5:28
6:50
8:12
9:34
10:5
612
:18
13:4
015
:02
16:2
417
:46
19:0
820
:30
21:5
2
HPP-2 HPP-4
HPP-4
HPP-3 HPP-1
CPH
PBPH
SOLAR HPP-2 HPP-4
HPP-3 HPP-1
CPH
PBPH
SOLAR
HPP-2
HPP-3 HPP-1
CPH
PBPH
SOLAR HPP-2 HPP-4
HPP-3 HPP-1
CPH
PBPH
SOLAR

49
Figure D.9: Graphs of power of various future scenarios with diesel generators and PV for September
PV Capacity
DG
Low Growth High Growth
25 MWp
50MWp
HPP-2 (10 MW)
HPP-4 (10 MW)HPP-1 (5MW)CPH
PBPH
Aggreko (5MW)
SOLAR 5MWp
0
10
20
30
40
50
60
Pow
er (M
W)
Time
0
10
20
30
40
50
60
Pow
er (M
W)
TimeHPP-2 (10 MW)
HPP-4 (10 MW)HPP-1 (5MW)CPH
PBPH
Aggreko (5MW)
SOLAR 5MWp
-10
0
10
20
30
40
50
110
019
929
839
749
659
569
479
389
299
110
9011
8912
88
Pow
er (M
W)
Time
0
10
20
30
40
50
60
Pow
er (M
W)
Time
110
821
532
242
953
664
375
085
796
410
7111
7812
85
110
821
532
242
953
664
375
085
796
410
7111
7812
85110
019
929
839
749
659
569
479
389
299
110
9011
8912
88
HPP-2 (10 MW)
HPP-4 (10 MW)HPP-1 (5MW)CPH
PBPH
Aggreko (5MW)
SOLAR 5MWpHPP-2 (10 MW)
HPP-4 (10 MW)HPP-1 (5MW)CPH
PBPH
Aggreko (5MW)
SOLAR 5MWp
HPP-2 (10 MW)
HPP-4 (10 MW)HPP-1 (5MW)CPH
PBPH
Aggreko (5MW)
SOLAR 5MWp
0
10
20
30
40
50
60Po
wer
(MW
)
Time
0
10
20
30
40
50
60
Pow
er (M
W)
TimeHPP-2 (10 MW)
HPP-4 (10 MW)HPP-1 (5MW)CPH
PBPH
Aggreko (5MW)
SOLAR 5MWp
-10
0
10
20
30
40
50
110
019
929
839
749
659
569
479
389
299
110
9011
8912
88
Pow
er (M
W)
Time
0
10
20
30
40
50
60Po
wer
(MW
)
Time
110
821
532
242
953
664
375
085
796
410
7111
7812
85
110
821
532
242
953
664
375
085
796
410
7111
7812
85110
019
929
839
749
659
569
479
389
299
110
9011
8912
88
HPP-2 (10 MW)
HPP-4 (10 MW)HPP-1 (5MW)CPH
PBPH
Aggreko (5MW)
SOLAR 5MWpHPP-2 (10 MW)
HPP-4 (10 MW)HPP-1 (5MW)CPH
PBPH
Aggreko (5MW)
SOLAR 5MWp
HPP-2 (10 MW)
HPP-4 (10 MW)HPP-1 (5MW)CPH
PBPH
Aggreko (5MW)
SOLAR 5MWp
0
10
20
30
40
50
60
Pow
er (M
W)
Time
0
10
20
30
40
50
60
Pow
er (M
W)
TimeHPP-2 (10 MW)
HPP-4 (10 MW)HPP-1 (5MW)CPH
PBPH
Aggreko (5MW)
SOLAR 5MWp
-10
0
10
20
30
40
50
110
019
929
839
749
659
569
479
389
299
110
9011
8912
88
Pow
er (M
W)
Time
0
10
20
30
40
50
60
Pow
er (M
W)
Time
110
821
532
242
953
664
375
085
796
410
7111
7812
85
110
821
532
242
953
664
375
085
796
410
7111
7812
85110
019
929
839
749
659
569
479
389
299
110
9011
8912
88
HPP-2 (10 MW)
HPP-4 (10 MW)HPP-1 (5MW)CPH
PBPH
Aggreko (5MW)
SOLAR 5MWpHPP-2 (10 MW)
HPP-4 (10 MW)HPP-1 (5MW)CPH
PBPH
Aggreko (5MW)
SOLAR 5MWp
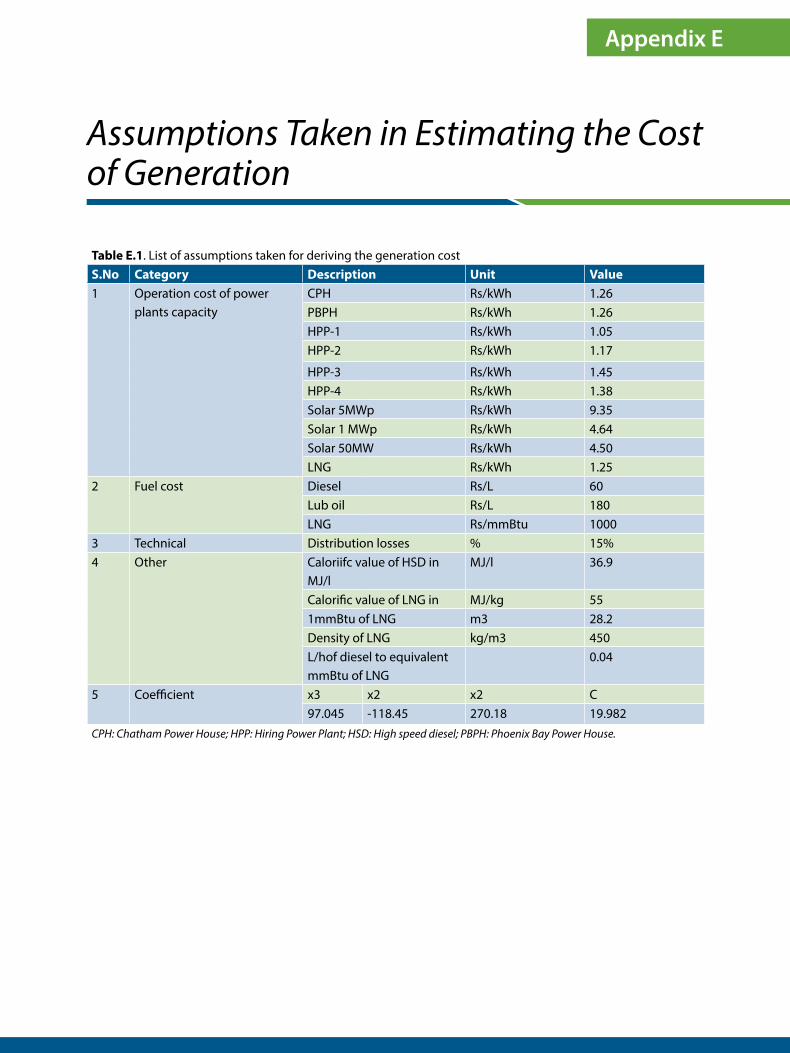
Assumptions Taken in Estimating the Cost of Generation
Appendix E
Table E.1. List of assumptions taken for deriving the generation costS.No Category Description Unit Value1 Operation cost of power
plants capacityCPH Rs/kWh 1.26PBPH Rs/kWh 1.26HPP-1 Rs/kWh 1.05HPP-2 Rs/kWh 1.17
HPP-3 Rs/kWh 1.45HPP-4 Rs/kWh 1.38Solar 5MWp Rs/kWh 9.35Solar 1 MWp Rs/kWh 4.64Solar 50MW Rs/kWh 4.50LNG Rs/kWh 1.25
2 Fuel cost Diesel Rs/L 60Lub oil Rs/L 180LNG Rs/mmBtu 1000
3 Technical Distribution losses % 15%4 Other Caloriifc value of HSD in
MJ/lMJ/l 36.9
Calorific value of LNG in MJ/kg 551mmBtu of LNG m3 28.2Density of LNG kg/m3 450L/hof diesel to equivalent mmBtu of LNG
0.04
5 Coefficient x3 x2 x2 C97.045 -118.45 270.18 19.982
CPH: Chatham Power House; HPP: Hiring Power Plant; HSD: High speed diesel; PBPH: Phoenix Bay Power House.

51
y = 97.04x3-118.4x2+ 270.1x + 19.98R² = 1
0
50
100
150
200
250
300
0.25 0.45 0.65 0.85
Fuel
Con
sum
ptio
n (L
t/hr
)
Output power (MVA)
Fuel Consumption for 1 MVA DieselGenerator
1MVA Poly. (1MVA)
0
50
100
150
200
250
300
350
0.25 0.45 0.65 0.85
SFC
(lt/M
W-h
r)
Output power (MVA)
Speci�c Fuel Consumption of 1 MVADiesel Generator
Figure E.1. Assumed fuel consumption characteristics of a diesel generatorset

Category-wise tariff and revenue for 2019-20 for Andaman and Nicobar as approved by Joint Electricity Regulatory Commission for the state of Goa and union territories is as below:
Category-wise Tariff for Andaman and Nicobar(2019-20)
Appendix F
S. No.
Category No. of Consumers
Energy Sales (in MU)
Approved Tariff Fixed Charges (Rs in Crore)
Energy Charges (Rs in Crore)
Total Revenue (Rs in Crore)
Fixed Charges Energy Charge (Rs/Kwh)
1 Life lineconnection
0 to 50 units
7.98 Rs 10 per connection per month or part thereof
2.05 1.64 1.64
2 Domestic
0 to 100 units
118,077 70.25 Rs20 per connection per month or part thereof for single phase andRs70 per connection per month for three phases or part thereof for three phases
2.25 2.97 15.81
101 to 200 units
46.94 5.00 23.47
201 to500 units
20.78 7.20 14.96
501 units and above
10.51 7.50 7.88
Subtotal 148.48 2.97 62.12 65.09
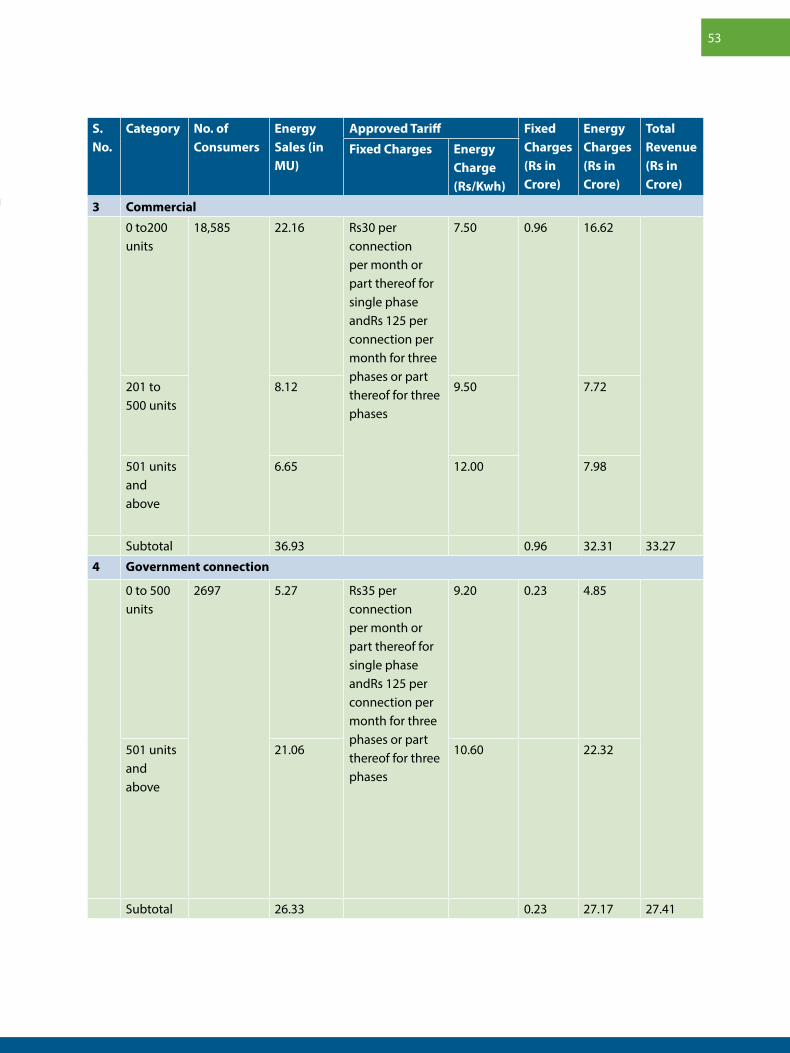
53
S. No.
Category No. of Consumers
Energy Sales (in MU)
Approved Tariff Fixed Charges (Rs in Crore)
Energy Charges (Rs in Crore)
Total Revenue (Rs in Crore)
Fixed Charges Energy Charge (Rs/Kwh)
3 Commercial
0 to200 units
18,585 22.16 Rs30 per connection per month or part thereof for single phase andRs 125 per connection per month for three phases or part thereof for three phases
7.50 0.96 16.62
201 to 500 units
8.12 9.50 7.72
501 units and above
6.65 12.00 7.98
Subtotal 36.93 0.96 32.31 33.27
4 Government connection
0 to 500 units
2697 5.27 Rs35 per connection per month or part thereof for single phase andRs 125 per connection per month for three phases or part thereof for three phases
9.20 0.23 4.85
501 units and above
21.06 10.60 22.32
Subtotal 26.33 0.23 27.17 27.41

54
S. No.
Category No. of Consumers
Energy Sales (in MU)
Approved Tariff Fixed Charges (Rs in Crore)
Energy Charges (Rs in Crore)
Total Revenue (Rs in Crore)
Fixed Charges Energy Charge (Rs/Kwh)
5 Industrial
0 to 500 units
614 15.56 Rs 50 per kVA per month or part thereof
6.00 1.68 9.34
501 units and above
8.37 8.00 6.70
Subtotal 23.93 1.68 16.03 17.71
6 Bulk supply
All units 68 41.60 Rs 100 per kVA per month or part thereof
12.50 0.16 52.00 52.16
7 Public Lighting
All units 704 8.65 Rs 150 per kVA per month or part thereof
6.10 0.57 5.28 5.84
8 Irrigation pumps andagriculture
All units 464 1.15 Rs 50 per connection per month or part thereof
1.60 0.03 0.18 0.21
9 Electric vehicle charging station
- - Rs 100/- per KVA per month or part thereof
6.89 - - -
10 Temporary supply
All units - - 1.5 times the rate applicable to the relevant category of consumers
- - -
11 Total 141,208 295.05 6.59 196.74 203.33
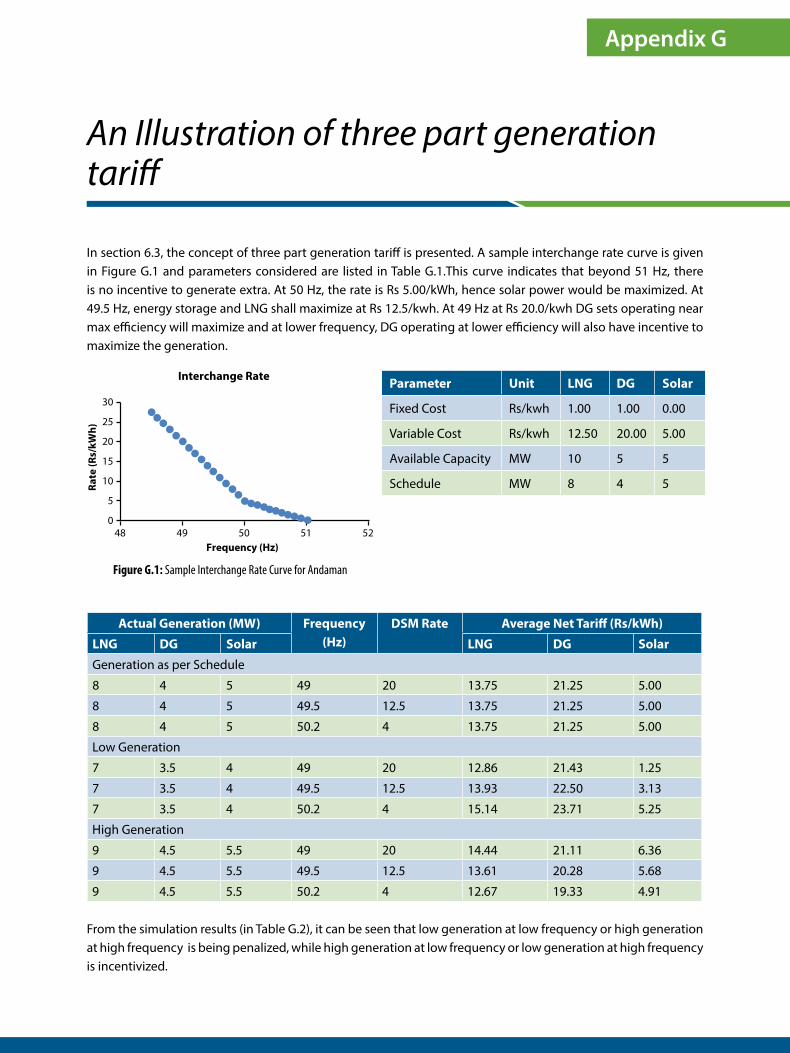
In section 6.3, the concept of three part generation tariff is presented. A sample interchange rate curve is given in Figure G.1 and parameters considered are listed in Table G.1.This curve indicates that beyond 51 Hz, there is no incentive to generate extra. At 50 Hz, the rate is Rs 5.00/kWh, hence solar power would be maximized. At 49.5 Hz, energy storage and LNG shall maximize at Rs 12.5/kwh. At 49 Hz at Rs 20.0/kwh DG sets operating near max efficiency will maximize and at lower frequency, DG operating at lower efficiency will also have incentive to maximize the generation.
An Illustration of three part generation tariff
Appendix G
Parameter Unit LNG DG Solar
Fixed Cost Rs/kwh 1.00 1.00 0.00
Variable Cost Rs/kwh 12.50 20.00 5.00
Available Capacity MW 10 5 5
Schedule MW 8 4 5
48 49 50 51 52Frequency (Hz)
Rate
(Rs/
kWh)
0
5
10
15
20
25
30
Interchange Rate
Figure G.1: Sample Interchange Rate Curve for Andaman
From the simulation results (in Table G.2), it can be seen that low generation at low frequency or high generation at high frequency is being penalized, while high generation at low frequency or low generation at high frequency is incentivized.
Actual Generation (MW) Frequency (Hz)
DSM Rate Average Net Tariff (Rs/kWh)
LNG DG Solar LNG DG Solar
Generation as per Schedule
8 4 5 49 20 13.75 21.25 5.00
8 4 5 49.5 12.5 13.75 21.25 5.00
8 4 5 50.2 4 13.75 21.25 5.00
Low Generation
7 3.5 4 49 20 12.86 21.43 1.25
7 3.5 4 49.5 12.5 13.93 22.50 3.13
7 3.5 4 50.2 4 15.14 23.71 5.25
High Generation
9 4.5 5.5 49 20 14.44 21.11 6.36
9 4.5 5.5 49.5 12.5 13.61 20.28 5.68
9 4.5 5.5 50.2 4 12.67 19.33 4.91
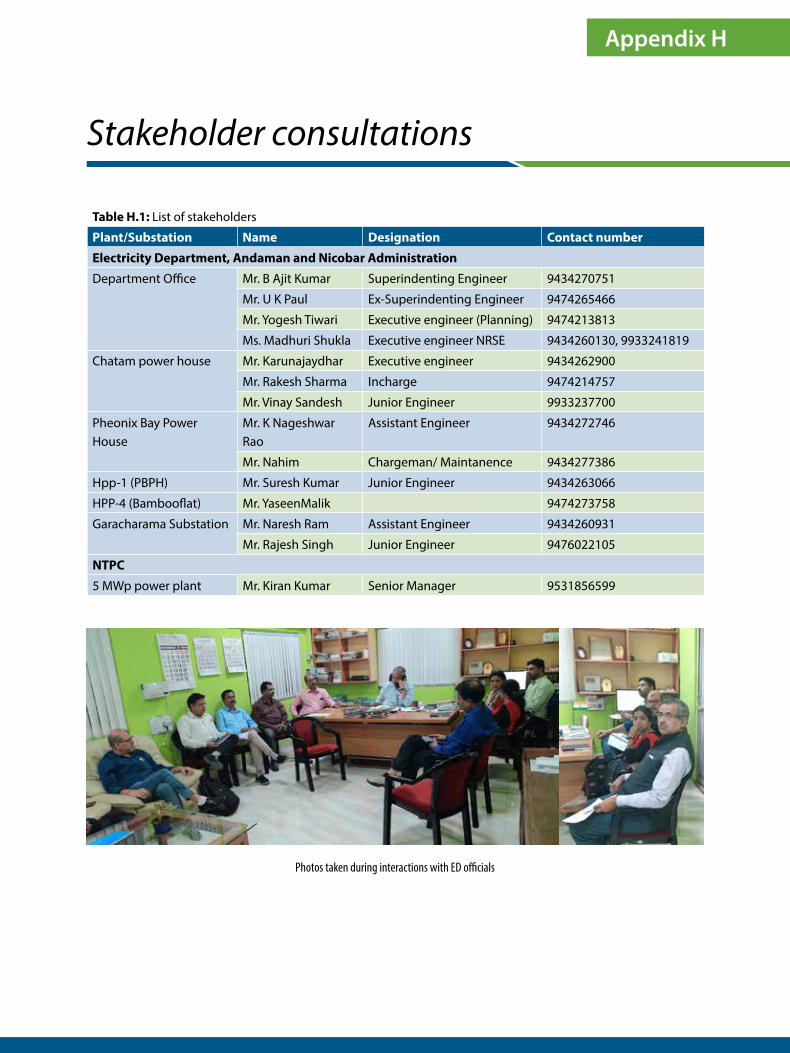
Appendix H
Stakeholder consultations
Table H.1: List of stakeholders
Plant/Substation Name Designation Contact number
Electricity Department, Andaman and Nicobar Administration
Department Office Mr. B Ajit Kumar Superindenting Engineer 9434270751
Mr. U K Paul Ex-Superindenting Engineer 9474265466
Mr. Yogesh Tiwari Executive engineer (Planning) 9474213813
Ms. Madhuri Shukla Executive engineer NRSE 9434260130, 9933241819
Chatam power house Mr. Karunajaydhar Executive engineer 9434262900
Mr. Rakesh Sharma Incharge 9474214757
Mr. Vinay Sandesh Junior Engineer 9933237700
Pheonix Bay Power House
Mr. K Nageshwar Rao
Assistant Engineer 9434272746
Mr. Nahim Chargeman/ Maintanence 9434277386
Hpp-1 (PBPH) Mr. Suresh Kumar Junior Engineer 9434263066
HPP-4 (Bambooflat) Mr. YaseenMalik 9474273758
Garacharama Substation Mr. Naresh Ram Assistant Engineer 9434260931
Mr. Rajesh Singh Junior Engineer 9476022105
NTPC
5 MWp power plant Mr. Kiran Kumar Senior Manager 9531856599
Photos taken during interactions with ED officials

57
Photos taken during site visits with officials at substations and power plant operators

58
Discussion on final project findings
Date: 13th January 2020 Time: 5 p.m. Place: Port Blair
Attendees:
Electricity Department, Andaman and Nicobar TERI
Mr B Ajit Kumar, Superindenting Engineer Mr Sunil Dhingra, Associate Director
Mr Yogesh Tiwari, Executive engineer (Planning) Mr Vijay Barthwal, Consultant
Ms Madhuri Shukla, Executive engineer (NRSE) Mr Kapil Muddineni, Associate Fellow
Mr KarunaJaydhar, Executive engineer
Mr Suresh Kumar, Junior Engineer and others
Minutes:
i. TERI team had presented the study findings of this project. Load flow analysis of network for low and high growth scenarios resulted in identification of critical sections of electrical network that would need upgradation. Various supply scenarios with and without LNG power plant were detailed. In order to improve grid management, key interventions related to grid code, dispatch schedule optimization, tariff structure and frequency response are necessary.
ii. Officials from Electricity Department (ED) have acknowledged the study findings and added that these results could play a prominent role in the network planning and grid management.
iii. In addition, ED officials have indicated the following observations/challenges in network operations and management:
a. The increased solar penetration has increased the system wide ATC loss percentage from 18% to 24%. This has been noticed by ED, A&N that during sunny days, system loss is more and less on non-sunny days. It was suggested that part of this could be due to loss calculation methodology and part could be due to improper aggregation of load and generation on different days. Also, high frequency operations of generators during such period could also cause high system losses. This cannot be analysed without measuring instantaneous values of demand-supply at all points. ED, A&N suggested that this can be validated by switching-off all solar simultaneously; roof top and/or other major solar and measurements can be taken at different nodes of grid.
b. ED, A&N opined that with the increased single phase solar roof-top systems in grid, high neutral current, harmonics and reverse flow problems are likely to increase.
c. ED, A&N opined that the position of reactive compensation and BESS needs to be examined. It was suggested that these are system stability measures and need to be analyses while planning specific schemes like LNG plant, new grid connected solar etc.
d. Island receives severe cyclonic storms every year leading to long-duration black-outs.
e. Fault identification and clearance in distribution network remains to be a challenge.
f. Skill development of staff on latest operational practices
TERI team had suggested new projects/collaborative activities should be planned to address these challenges.
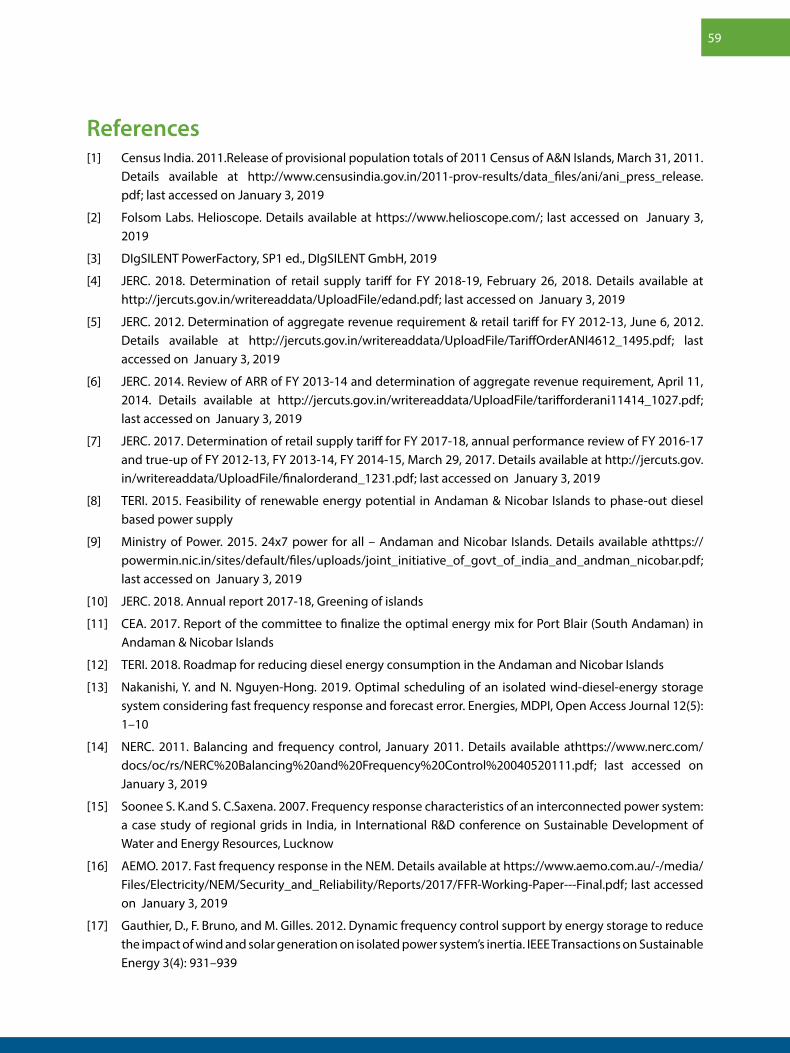
59
References[1] Census India. 2011.Release of provisional population totals of 2011 Census of A&N Islands, March 31, 2011.
Details available at http://www.censusindia.gov.in/2011-prov-results/data_files/ani/ani_press_release.pdf; last accessed on January 3, 2019
[2] Folsom Labs. Helioscope. Details available at https://www.helioscope.com/; last accessed on January 3, 2019
[3] DIgSILENT PowerFactory, SP1 ed., DIgSILENT GmbH, 2019
[4] JERC. 2018. Determination of retail supply tariff for FY 2018-19, February 26, 2018. Details available at http://jercuts.gov.in/writereaddata/UploadFile/edand.pdf; last accessed on January 3, 2019
[5] JERC. 2012. Determination of aggregate revenue requirement & retail tariff for FY 2012-13, June 6, 2012. Details available at http://jercuts.gov.in/writereaddata/UploadFile/TariffOrderANI4612_1495.pdf; last accessed on January 3, 2019
[6] JERC. 2014. Review of ARR of FY 2013-14 and determination of aggregate revenue requirement, April 11, 2014. Details available at http://jercuts.gov.in/writereaddata/UploadFile/tarifforderani11414_1027.pdf; last accessed on January 3, 2019
[7] JERC. 2017. Determination of retail supply tariff for FY 2017-18, annual performance review of FY 2016-17 and true-up of FY 2012-13, FY 2013-14, FY 2014-15, March 29, 2017. Details available at http://jercuts.gov.in/writereaddata/UploadFile/finalorderand_1231.pdf; last accessed on January 3, 2019
[8] TERI. 2015. Feasibility of renewable energy potential in Andaman & Nicobar Islands to phase-out diesel based power supply
[9] Ministry of Power. 2015. 24x7 power for all – Andaman and Nicobar Islands. Details available athttps://powermin.nic.in/sites/default/files/uploads/joint_initiative_of_govt_of_india_and_andman_nicobar.pdf; last accessed on January 3, 2019
[10] JERC. 2018. Annual report 2017-18, Greening of islands
[11] CEA. 2017. Report of the committee to finalize the optimal energy mix for Port Blair (South Andaman) in Andaman & Nicobar Islands
[12] TERI. 2018. Roadmap for reducing diesel energy consumption in the Andaman and Nicobar Islands
[13] Nakanishi, Y. and N. Nguyen-Hong. 2019. Optimal scheduling of an isolated wind-diesel-energy storage system considering fast frequency response and forecast error. Energies, MDPI, Open Access Journal 12(5): 1–10
[14] NERC. 2011. Balancing and frequency control, January 2011. Details available athttps://www.nerc.com/docs/oc/rs/NERC%20Balancing%20and%20Frequency%20Control%20040520111.pdf; last accessed on January 3, 2019
[15] Soonee S. K.and S. C.Saxena. 2007. Frequency response characteristics of an interconnected power system: a case study of regional grids in India, in International R&D conference on Sustainable Development of Water and Energy Resources, Lucknow
[16] AEMO. 2017. Fast frequency response in the NEM. Details available at https://www.aemo.com.au/-/media/Files/Electricity/NEM/Security_and_Reliability/Reports/2017/FFR-Working-Paper---Final.pdf; last accessed on January 3, 2019
[17] Gauthier, D., F. Bruno, and M. Gilles. 2012. Dynamic frequency control support by energy storage to reduce the impact of wind and solar generation on isolated power system’s inertia. IEEE Transactions on Sustainable Energy 3(4): 931–939

The Energy and Resources Institute (TERI)Darbari Seth Block,IHC Complex, Lodhi Road,New Delhi - 110 003, INDIA
Tel: (+91 11) 2468 2100Fax: (+91 11) 2468 2144, 2468 2145
Web: www.teriin.org
We are an independent, multi-dimensional organization, with capabilities in research, policy, consultancy and implementation. We are innovators and agents of change in the energy, environment, climate change and sustainability space, having pioneered conversations and action in these areas for over four decades.
We believe that resource efficiency and waste management are the keys to smart, sustainable and inclusive development. Our work across sectors is focused on
• Promoting efficient use of resources
• Increasing access and uptake of sustainable inputs and practices
• Reducing the impact on environment and climate
Our research, and research based solutions have had a transformative impact on industry as well as communities. We have fostered international collaboration on sustainability action by creating a number of platforms and forums. We do this by translating our research into technology products, technical services, as well as policy advisory and outreach.
Headquartered in New Delhi, we have regional centres and campuses in Gurugram, Bengaluru, Guwahati, Mumbai, Panaji , and Nainital. Our 1200-plus team of scientists, sociologists, economists and engineers delivers insightful, high quality action-oriented research and transformative solutions supported by state- of-the-art infrastructure