Integration of BIM and utility sensor data for facilities ...
76
Purdue University Purdue e-Pubs Open Access eses eses and Dissertations 12-2016 Integration of BIM and utility sensor data for facilities management Kamal Suprabhas Purdue University Follow this and additional works at: hps://docs.lib.purdue.edu/open_access_theses Part of the Civil Engineering Commons is document has been made available through Purdue e-Pubs, a service of the Purdue University Libraries. Please contact [email protected] for additional information. Recommended Citation Suprabhas, Kamal, "Integration of BIM and utility sensor data for facilities management" (2016). Open Access eses. 900. hps://docs.lib.purdue.edu/open_access_theses/900
Transcript of Integration of BIM and utility sensor data for facilities ...
Purdue UniversityPurdue e-Pubs
Open Access Theses Theses and Dissertations
12-2016
Integration of BIM and utility sensor data forfacilities managementKamal SuprabhasPurdue University
Follow this and additional works at: https://docs.lib.purdue.edu/open_access_theses
Part of the Civil Engineering Commons
This document has been made available through Purdue e-Pubs, a service of the Purdue University Libraries. Please contact [email protected] foradditional information.
Recommended CitationSuprabhas, Kamal, "Integration of BIM and utility sensor data for facilities management" (2016). Open Access Theses. 900.https://docs.lib.purdue.edu/open_access_theses/900

i
INTEGRATION OF BIM AND UTILITY SENSOR DATA FOR FACILITIES
MANAGEMENT
A Thesis
Submitted to the Faculty
of
Purdue University
by
Kamal Suprabhas
In Partial Fulfillment of the
Requirements for the Degree
of
Master of Science
December 2016
Purdue University
West Lafayette, Indiana

Graduate School Form30 Updated
PURDUE UNIVERSITYGRADUATE SCHOOL
Thesis/Dissertation Acceptance
This is to certify that the thesis/dissertation prepared
By
Entitled
For the degree of
Is approved by the final examining committee:
To the best of my knowledge and as understood by the student in the Thesis/Dissertation Agreement, Publication Delay, and Certification Disclaimer (Graduate School Form 32), this thesis/dissertation adheres to the provisions of Purdue University’s “Policy of Integrity in Research” and the use of copyright material.
Approved by Major Professor(s):
Approved by:Head of the Departmental Graduate Program Date
KAMAL SUPRABHAS
INTEGRATION OF BIM AND UTILITY SENSOR DATA FOR FACILITIES MANAGEMENT
Master of Science in Building Construction Management
HAZAR NICHOLAS DIBCo-chair
CLARK CORY Co-chair
BRYAN HUBBARD
HAZAR NICHOLAS DIB, CLARK CORY
BRYAN HUBBARD 10/5/2016

ii
To my parents and sister, without whom life would be meaningless.

iii
ACNOWLEDGEMENTS
I am indebted to my committee members: Professor Cory, Professor Dib and
Professor Hubbard for their continuous support and guidance during the course of my
research. I would like to thank my family-my mother, Shobha, my father, Suprabhas and
my sister, Kaveri for their unconditional love and support. I am also grateful to the
department of building construction management and computer graphics technology for
letting me use their equipment for my research.

iv
TABLE OF CONTENTS
Page
LIST OF TABLES ............................................................................................................. vi
LIST OF FIGURES .......................................................................................................... vii
LIST OF ABBREVIATIONS ............................................................................................ ix
ABSTRACT ........................................................................................................................ x
CHAPTER 1. INTRODUCTION .................................................................................... 1
1.1 Statement of the problem ...........................................................................................1
1.2 Research question .......................................................................................................2
1.3 Definitions ..................................................................................................................2
1.4 Scope ..........................................................................................................................2
1.5 Significance ................................................................................................................3
1.6 Assumptions ...............................................................................................................3
1.7 Limitations .................................................................................................................4
1.8 Delimitations ..............................................................................................................4
CHAPTER 2. LITERATURE REVIEW ......................................................................... 5
2.1 Building Information modelling ................................................................................5
2.2 Building Automation and Smart buildings ................................................................7
2.3 Radio Frequency Identification and Wireless Sensor Networks (WSN) ...................8
2.4 BIM and sensor integration ........................................................................................9
2.5 Standards for sensor data .........................................................................................11
2.7 BIM Standards and Interoperability .........................................................................13
2.8 BIM for facility management ...................................................................................15
2.8.1 Facility management databases and Construction Operations Building
Information Exchange (COBie) ................................................................................. 20

v
Page
2.9 Chapter summary .....................................................................................................25
CHAPTER 3. METHODOLOGY .................................................................................. 26
3.1 Research methodology. ............................................................................................26
3.2 Data collection .........................................................................................................27
3.3 Prototype development .............................................................................................27
CHAPTER 4. RESULTS AND DISCUSSIONS ........................................................... 30
4.1 Use of shared and project parameters. .....................................................................34
4.2 Description of the plugin functions ..........................................................................35
4.3 Results from collected sensor data ...........................................................................39
4.4 Discussions ...............................................................................................................41
CHAPTER 5. CONCLUSION AND FUTURE WORK ............................................... 44
5.1 Conclusion ................................................................................................................44
5.2 Conclusions from the collected data ........................................................................44
5.3 Recommendations and future work .........................................................................45
LIST OF REFERENCES .................................................................................................. 46
APPENDICES
Appendix A: Code for Programming the Sink and Parent Nodes .................................... 51
Appendix B: Code for Reading Serial Data from the Gateway Mote .............................. 56
Appendix C: Code for the Plugin Creation ....................................................................... 62

vi
LIST OF TABLES
Table Page
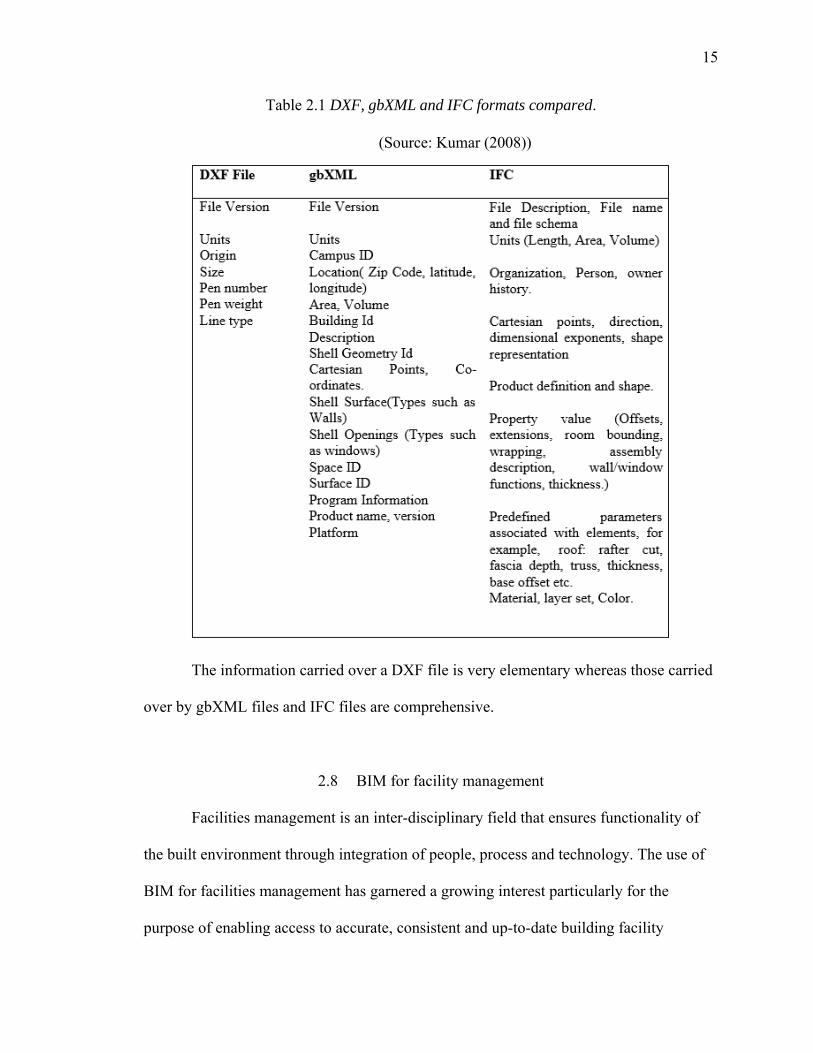
Table 2.1 DXF, gbXML and IFC formats compared. ........................................................ 15
vii
LIST OF FIGURES
Figure Page
Figure 2.1: Work order activities affected by COBie depicted in blue color .................... 24
Figure 3.1 WSN network employed using motes. .............................................................. 26
Figure 4.1: KNOY hall of technology floor plan. .............................................................. 30
Figure 4.2: Diagram of the Wireless Sensor Network employed. ..................................... 31
Figure 4.3: Diagram of the sensor setup ........................................................................... 31
Figure 4.4: SQL data stored online. .................................................................................. 32
Figure 4.5: Color scheme for selected room. .................................................................... 34
Figure 4.6: Figure showing sensor data for a time range. ............................................... 35
Figure 4.7: Daily report of sensor data plotted against time. ........................................... 36
Figure 4.8: Bar chart of sensor data plotted against a range of dates ............................. 37
Figure 4.9: Server settings. ............................................................................................... 38
Figure 4.10: Flowchart showing the plugin workflow ...................................................... 39
Figure 4.11: Bar chart with sensor data. .......................................................................... 40
Figure 4.12: Straight line graph of sensor data. ............................................................... 40
Figure 4.13: Bar graph with sensor data for room 1 ........................................................ 41
Figure 4.14: Bar graph with sensor data for room 1 ........................................................ 42
Figure 4.15: Bar graph with filtered sensor data for room 1 ........................................... 42

viii
Figure Page
Figure 4.16: Bar graph with sensor data for room 2 ........................................................ 43
ix
LIST OF ABBREVIATIONS
BIM- Building Information Modeling
HVAC-Heating Ventilation and Air-Conditioning
CAD-Computer Aided Design
UGSBC-United States Green Building Council
RFID-Radio Frequency Identification
WSN-Wireless Sensor Network
SensorML-Sensor Model Language
IFC- Industry Foundation Classes
IEEE-Institute of Electrical and Electronics Engineers
FM-Facilities management
x
ABSTRACT
Suprabhas, Kamal. M.S., Purdue University, December 2016. Integration of BIM and Utility Sensor Data for Facilities Management. Major Professor: Hazar Nicholas Dib and Clark Cory
Building information modelling represents a building as a database of
coordinated, consistent and computable information in construction (Sabol, 2008). There
has been a recent trend to study the usage of BIM for post-construction facility
management. Recently, attempts are also being made to link a BIM model with smart
sensing technology or building automation systems (BAC).
This thesis aims to investigate the feasibility of using sensor data from mote based
light sensors tied to a BIM model, to be used for maintenance based facility management.
More specifically, a prototype will be developed that integrates lighting sensor
data collected using a mote tied to a wireless sensor network(WSN), with a BIM model.
This integration will then be further developed for its capability of being used as a facility
management tool for equipment inventory and preventive maintenance by linking COBIE
sheets to it.

1
CHAPTER 1. INTRODUCTION
1.1 Statement of the problem
BIM or building information modelling constitutes the process of development
and utilization of a computer generated 3D model to simulate design, construction and
operation of building facilities (Azhar et.al, 2009). Increased efforts are being made to
utilize the benefits associated with BIM to improve the operation and maintenance phases
of a building facilities lifecycle (Jordani, 2010).
With the advent of smart building technology, several buildings are being
equipped with intelligent building automation systems that use several types of sensors to
obtain large amounts of data (Liu & Akinci, 2009). Such data can assist in assessing
building performance and could also be used to support decisions made concerning the
facility operations and maintenance of equipment (Xuesong Li). Real time data collected
and accumulated by sensors along with their spatial information extracted from a BIM
model could be integrated. This integration can be advantageous in assessing the
performance of building systems and could also aid in decisions made concerning facility
management and operations (Liu & Akinci, 2009). “The Construction-Operations
Building information exchange (COBie) format is the international standard for the
exchange of information about managed facility assets” (East,2010). Since COBIE data
can be generated using BIM software, there exists a possibility to combine facility asset
2
data and sensor data for post construction facilities management and preventive
maintenance.
1.2 Research question
To what extent can utility sensor data be tied to a BIM model for post
construction facility management?
1.3 Definitions
AEC – Architecture, Engineering, Construction
BIM – Building Information Modeling – It is a digital representation of the functional
and physical characteristics of a building facility. It functions as a shared knowledge
database that forms a reliable basis for decisions made during a buildings life cycle.
CMMS – Computerized Maintenance Management System – a software program used
in work order management preventative maintenance, and other functions for the
purpose of facility management.
1.4 Scope
This research aims to develop a model that integrates information acquired from
utility sensors with spatial data obtained using the building information model (BIM) of
a facility. More specifically it aims at looking at how this integration could benefit
preventive maintenance and facilities management by linking this sensor data to its
corresponding equipment information and specifications.

3
1.5 Significance
As discussed earlier, BIM allows for multi-disciplinary information (details
regarding building forms, materials, and context and technical systems) to be
superimposed within one model (Autodesk, 2008).
This research aims to explore the suitability of using sensor data from utility
sensor motes connected to a wireless network gateway and integrating this data with the
BIM model linked to equipment affected by this sensor data.
1.6 Assumptions
The research is done and conclusions are arrived upon keeping the following
assumptions in mind:
The overall dimensions and floor plan details of the building will be
considered to be accurate and up to date
The materials used to create the 3-D BIM model will be assumed to match up
accurately with those mentioned in the plan details
The locations of the fixtures of the building facility will be assumed to be up
to date and accurate with the actual building specifications and plans
The accuracy of the sensor data transmitted will be assumed to be of
reasonable standards.

4
1.7 Limitations
The research is limited by the following:
The sensor data that could be collected by means of building automation
systems include humidity, temperature, carbon dioxide levels and AC current
per outlet. Sensor data could potentially be used to detect issues with the
heating ventilation, and air conditioning systems. However, for this research
study, the sensor data collected will be limited to illumination data (lighting
sensor data) of selected light fixtures in two office rooms.
1.8 Delimitations
The research is carried out with the following delimitations:
3-D modelling software use will be limited to Autodesk Revit Architecture
The sensors will be mounted and sensor data will be collected from two rooms
in KNOY hall of technology in Purdue.
The sensor node or mote used to form the wireless sensor network (WSN) for
sensor data collection will be the TelosB TPR2420.

5
CHAPTER 2. LITERATURE REVIEW
This chapter provides a summary of existing literature pertaining to the thesis
topic area. The first section of the chapter provides an introduction of the building
information modelling concept. The later sections deal with the type and utility of BIM
compatible smart building sensors, and, usage of wireless sensor networks and motes.
The literature developed was largely researched and gathered by making use of
the Purdue University Library’s online research database and the ProQuest Thesis and
dissertation database.
2.1 Building Information modelling
Building information modeling (BIM) is a relatively new trend that has taken over
the construction industry by storm. There has been a constant debate over an acceptable
universal definition of a building information model and the process of building
information modeling.
An early definition of BIM was put forward by Dr. Charles Eastman from
Georgia Institute. His theory combines the terms building product model and building

6
information model. ‟Building information modeling integrates all of the geometric model
information, the functional requirements and capabilities, and piece behavior information
into a single interrelated description of a building project over its lifecycle. It also
includes process information dealing with construction schedules and fabrication
processes” (Eastman, 1999, p. 71)
Another comprehensive definition of BIM, as put forth by US General Services
Administration is discussed below:
Building Information Modeling is the process of developing and using a multi-
faceted computer based software data model to not only document a building
design, but to simulate the construction and operation of a new capital facility or a
recapitalized facility. The resulting Building Information Model is a data-rich,
intelligent and parametric digital representation of the building facility, from
which views relevant to various users’ needs could be analyzed extracted and to
generate feedback and improvement of the facility design. (GSA n.d., p. 29).
As is clear from the above mentioned definitions, BIM is not just a software. In
addition to being a technology, it is also a process. The technological aspect of BIM helps
stakeholders involved in a project to visualize the facility being built to identify design,
construction and also operational issues. The process aspect of BIM enables collective
participation of all stakeholders in a project (Azhar et.al, 2012)
Starting from the design phase of a building, to its construction, and maintenance
after occupancy has begun, BIM is thus a tool that can be used in all phases of a
building’s entire life cycle (Bilal, 2009).

7
A unique property of BIM is its capability of bringing all the disciplines together
to work on a project. Historically, the various disciplines working on a construction
project, had made their decisions and designs separately, independent from one another.
Now with the availability of 3D BIM tools, the development of a virtual 3D BIM model
may comprise of collective efforts by various project team members. The BIM model can
be coordinated such that existing conflicts between the contributing members can be
identified and resolved. It is more practical to coordinate the different building systems
using a 3D modelling tool as the location and relationship of all components and their
conflicts could be resolved in the project planning phase (Grilo & Jardim-Goncalves,
2010). In other words, using BIM, Architects, engineers and contractors of a project can
all work in tandem on the same virtual model and make design changes together at the
same time, making sure that those changes are accurate and do not interfere with other
aspects of the building model (Azhar, 2011).
2.2 Building Automation and Smart buildings
Recent advances in the field of communication technology have led to an
increased interest in the construction and management of smart building environments
(SBE).A smart building environment corresponds to a system which has several smart
objects like actuators and sensors embedded in it. These objects with their computation
and communication capabilities serve the function of forming an environment smart
enough to communicate intelligently with its users (Zhang et.al, 2015).

8
2.3 Radio Frequency Identification and Wireless Sensor Networks (WSN)
Radio Frequency Identification and Wireless sensor networks are two major
technologies that have garnered increased attention over the past several years for
wireless computing (Arslan et.al, 2014). Radio frequency identification (RFID) is an
efficient automatic identification system used for a good variety of objects. RFID systems
comprise of three major components. These include tags, readers and a host computer
(Jain, et al., 2010). RFID tag, also known as a transponder (transmitter/responder),
contains a microchip, antennas and enclosures for processing, interpreting,
communicating and accumulating data in its memory (Sardroud, 2012). RFID tags when
embedded into objects give distinct coding for counting and recognition purposes
(Azevedo, et al., 2014). RFID tags can be categorized as active, passive or semi-active.
The tag is considered active when power is supplied providing a read and write function,
and a broader range of communication. Active RFID tags are capable of reading and
writing information to tags by means of wireless communication. RFID middleware
software aids in processing and collecting data. RFID technology has extensively been
employed in stock management, supply chain tracking, inventory control and so on.
Wireless Sensor Networks (WSN) are capable of self-configuring and networking
which makes them an attractive solution for several environmental monitoring,
surveillance, and healthcare applications (Estrin et.al, 2002). The tiny computing nodes
that make up a sensor network have extremely restricted communication, computational
and battery capabilities. The hardware platform that forms a WSN typically consists of
Radio Frequency (RF) transceivers, microcontrollers and power sources. The sink node
aggregates all the information picked up by a sensor. Since sensors cannot power

9
communication over a long range to reach a sink, wireless connectivity is used to transfer
data to the nearest sink. A good variety of sensors are available to monitor a wide
number of parameters including temperature, light, humidity, pressure etc. (Othman and
Shazali, 2012). Recent advancements in the field of wireless computing have led to the
emergence of low cost and multifunctional sensing nodes or motes to enable sensing
along with data processing (Yang, et al., 2014). WSNs are now being extensively used
for a several purposes, including environmental monitoring, facility management and
maintenance, site security and various other applications (Andonovic, 2009; Zhang, et al.,
2007). The radio module within a mote or node transmits and receives data through a
communication standard. The standards that are currently being used which are suitable
with the requirements imposed by development of sensor networks are Bluetooth and
ZigBee both based on IEEE 802.15.1 (Wielens, et al., 2008). These standards have been
designed for applications where the transfer speed is not the best but it makes possible for
the motes to be powered through batteries.
2.4 BIM and sensor integration
BIM software, RFID tag/sensor information and software application are the key
elements of any BIM and RFID/sensor integrated system (Meadati, et al., 2010). This
integration is only possible by modifying the Application Programming Interfaces (API)
of the BIM software as well as those of the sensors systems. Several attempts of BIM-
sensor based integration have been previously carried out to achieve a variety of
purposes.
10
Guinard et.al (2009) used a wireless sensor network based tool to aid building
energy management. Available BIM data in the form of an IFC model was used to outline
the deployment environment for a Wireless sensor network.
Attar et.al (2011) discussed a method for real time building performance
visualization which involved data collection using a sensor network for an individually
controlled and monitored cubicle. Several approaches for advanced visualization of
performance data by means of integrating semantic information with a geometric model
was dealt with.
Woo et.al (2011) developed a parsing engine to translate sensor data transferred in
SensorML, an acceptable XML schema to be used with a Revit API environment. The
parsing engine was designed to access a database sever to access recorded sensor data
and this was mapped to XML data of the sensor with the geometric, and dynamic
characteristics defined within it.
Attempts have also been made to use an IFC model uploaded on a server with
objects capable of supporting sensor data (Cahill, et.al, 2012). An open source software
called BIMserver capable of working with small IFC files was able to store static data
sets from sensor data sources in relevant IFC objects.
Furthermore, the usage of BIM in smart building environments have been carried
out. Zhang et.al (2015) developed a tool which provided IFC parsing and 3D presentation
capabilities. An adapter layer was created that parses the IFC file data and mapped real
time dynamic data from grid connected smart sensors for energy management.
Liu & Akinci (2009) developed a prototype capable of integrating sensor
metadata with BIM using SensorML schema. A sensor type was created using sensorML
11
model editor and an instance of the sensor was created on the 2D plan of an imported IFC
model.
2.5 Standards for sensor data
There are several standards previously been used for representing sensor
metadata:
These include the following:
IEEE 1451 is an interface standard created by Institute of Electrical and
Electronics Engineers. It consists of a combination of open and network
independent interface systems for linking sensors to microprocessors.
SensorML, is an xml based schema that describes processes connected
with sensors. It can be used for a wide variety of sensors including
stationary and dynamic platforms. Functions that are supported using
SensorML include senor geolocation and discovery. It provides a rich
collection of metadata that could be used for discovery of sensor systems
and observational processes.
ANSI N4242 is a standard developed for transfer of data from radiation
measurement instruments. It is based on the XML schema and is capable
of representing information from several different manufacturers. (Lee
2007)
oBIX or Open Building Information exchange is a file format geared with
the aim of creating a standard XML and Web services guideline to enable
information transfer between building electrical and mechanical systems,

12
and enterprise applications. oBIX helps facilitate several communications
protocols to be encapsulated. These include LON, BACnet and so on.
IFC, is a file format with object oriented properties developed by
buildingSMART to enable interoperability amongst BIM software used in
the AEC industry. It is primarily utilized to describe building and
construction data. However, since it is capable of representing sensor
geometric/location data, it can be extended to represent important sensor
metadata
2.6 Selection of mote
As discussed in sections before, a wireless sensor network (WSN) is formed by linking
several spatially dispersed autonomous devices that use sensors for monitoring
environmental or physical conditions at selected locations. These WSN nodes, also
known as motes currently have sizes varying from disc shaped boards less than 1cm to
enclosed systems with dimensions less than 5 cms.
Nodes are favored primarily because
The topology of the network doesn’t have to be fixed as they can be
randomly deployed without a definite pattern of arrangement.
They are more error tolerant than other network types, as a failure in one
node could be compensated by rerouting through several other nodes.
Energy is conserved as motes could be powered solely using batteries
For this research, the TelosB motes (TPR2400) developed by Crossbow Technology Inc.
will be employed. This mote bundles all essential components soldered within a single

13
board which includes an IEEE radio, a light sensor suite, MCU and a USB interface. It is
capable of being powered by two AA batteries. On being plugged into a computer via
USB, power is provided by the host computer. It runs on the Tiny OS open source system
developed by University of California, Berkeley. It is an embedded OS with a component
based architecture and Nested C coding. The development of TinyOS was carried out
with objectives of minimal energy consumption, flexibility and synchronism (Dogan &
Erdem, 2015).
The TelosB mote uses Texas Instruments MSP430 Processor Company with a RISC
architecture that draws in a current of 1.8 mA and 5.1 μA in active and sleep modes
respectively. It uses a CC2420 Zigbee radio for communication that allows
communication over distances of up to 100 meters outdoors and 30 meters indoors. The
light sensor being used is the Hemamatsu s1087 light sensor.
The selection of the mote is due to its availability, popularity with node designs and its
compatibility with open source TinyOS that supports self-configuring networks.
2.7 BIM Standards and Interoperability
According to Kumar (2008), “the ideal interoperability should be a seamless
exchange of data among software tools, eliminate the need for duplicating data
generation, and allow the bidirectional updates, the changes in one program should be
able to flow between the programs”. (p. 17)
The interoperability between BIM and third party energy analysis software’s is
typically attained by developing a shared data file format. The formats commonly used
include IFC, gbXML and DXF. These are explained in depth below.

14
IFC
IFC refers to Industry Foundation Classes. It usually includes objects, building
geometry, timeline and events. It was created by buildingSMART and is used for
interoperability between various building industry applications (Khemlani, 2004). IFC
files typically comprise of components like beams, columns walls and doors that are
tangible along with abstract concepts of geometry, finishes, and materials and so on.
gbXML
gbXML stands for green building EXtensible Markup Language schema. It was
initially developed to transfer energy simulation information. However, it is now utilized
to facilitate transfer of data stored within BIM models to ensure interoperability amongst
energy analysis models and 3D BIM models.
DXF
DXF corresponds to Drawing Exchange Format. It was one of the first few data
file formats developed for interoperability between AutoCAD and various other
programs. It provides information in the native CAD file type and is powerful for
geometry information transfer. A comparison of these three commonly used file formats
depending on the information they carry over was made by Kumar (2008). This is shown
in table 2.1.
15
Table 2.1 DXF, gbXML and IFC formats compared.
(Source: Kumar (2008))
The information carried over a DXF file is very elementary whereas those carried
over by gbXML files and IFC files are comprehensive.
2.8 BIM for facility management
Facilities management is an inter-disciplinary field that ensures functionality of
the built environment through integration of people, process and technology. The use of
BIM for facilities management has garnered a growing interest particularly for the
purpose of enabling access to accurate, consistent and up-to-date building facility

16
information. The information transferred via a BIM process and stored using a BIM
based database system could benefit various FM practices including closeout,
commissioning, preventive maintenance and repair, and so on.
BIM could aid in facilities management in several different ways. Krukowski &
Arsenijevic(2010) identified the following potential application areas associated with
Facilities management which BIM could positively impact.
Locating building components:
In order to carry out commissioning or preventive maintenance, a facility
manager is required to locate and identify building equipment and materials for quick
problem solution and detection. In the conventional method, Facility managers rely on
available blueprints and their experience or intuition for finding and locating equipment.
Locating building equipment is a time consuming and labor intensive ordeal for both the
repair technicians and facility managers. Having the ability to use an as built 3D BIM
model to locate electrical, mechanical and plumbing equipment facilitates the capability
of locating such equipment and also data delivery process that is relevant to the
maintenance context (Krukowski & Arsenijevic, 2010).This greatly decreases
maintenance costs by eliminating guesswork for locating building equipment
commissioning, replacement or repair. By using BIM based tools and software, FM
personnel can navigate and utilize special functions on BIM models like search, highlight
and filter within the BIM software to locate the equipment that is meant to be inspected.
Furthermore, a link established between BIM models and FM databases with equipment
specifications and maintenance logs could assist in diagnosing and detecting issue with
them.

17
Enabling real-time access of data.
Facility managers have to regularly perform preventive, corrective and predictive
maintenance, replace outdated items and carry out predictive checkups to maintain the
building facility (Becerik-Gerber et.al, 2012). To execute these tests, FM managers need
access to operation manuals and should be able to log into different databases. They
should also be able to locate and print the required information vital to perform certain
tasks. Important facility management data along with knowledge gained through
experience from operating and maintaining facilities in the form of a knowledge database
could be transferred by means of a BIM model. Immediate and efficient accessibility to
such information can substantially reduce time and labour otherwise need to retrieve it,
which in turn avoids ineffective decisions (Ergen et.al, 2007).
Preventive maintenance can be defined as the servicing and care provided by
facility personnel for maintaining building equipment and facilities in acceptable
operating conditions. This serves the purpose of systematic and consistent detection,
inspection and correction of equipment failures before their occurrence or before their
transition into major issues. For regular inspections, a schedule will be created. Detailed
work description is conducive to improving overall productivity. This includes facility
ID, work order information, location, and description of preventive work necessary, list
of documents required to carry out maintenance, average estimated and true labor hours
and frequency of preventive maintenance activity. All this data could be integrated into a
BIM database as documents and attributes.

18
Visualization and marketing
With the 3D capabilities offered by BIM along with its ability of integrating
material texture and exterior topography, BIM enables facility management personnel to
have an enhanced visualization of the model space. This aids them in performing what-if
analyses. During the construction of remodels and renovations, the visualization
capabilities provided by BIM software could be used to assist the purpose of assessing
various construction methods. This is of greater importance in areas with limited access,
where building equipment operation and accessibility could be verified through 3D
modeling. The 3D model representation could also be utilized for emergency
evacuation/safety plan training. Furthermore, the navigating and walkthroughs created
using BIM software could be used for marketing purposes.
Maintainability
BIM has the potential to facilitate maintainability studies dealing with
accessibility, and sustainability of materials.
Accessibility: This involves checking temporary access to building facades and
equipment that require adequate accessibility for physical inspection on a timely basis.
This includes fire safety and protection equipment, ensuring sufficiently large opening to
allow ejection and replacement of its components.
Material sustainability: This includes restricting usage of materials that lead to
defects being caused. It also includes identification of common defect types that could be
caused, and evaluation of material performance and longevity.
Further, lessons learnt from past experience could be stored within BIM software
to aid in the design process of new buildings and also for risk management. BIM models

19
could be used to automate the process of testing maintainability especially during the
operational phase of a building by making use of the semantic and geometric data
contained within them.
Creating digital assets
Digital assets are usually developed and transmitted to the facility management
systems to support several functions. These include work order management, repair and
maintenance management and so on. Implementation of BIM throughout the entire
building construction phase creates an opportunity for FM personnel to digitally upload
and transfer asset information immediately once the building commissioning is
completed. Digital asset information that could be extracted during construction and
design are as follows:
Equipment: Plumbing, Heating ventilation and air conditioning systems, building sensor
networks and, fire and safety equipment.
Data: manufacturer information, location information (zone and floor information) and
equipment description and attributes.
Documents: List of specifications, operation and maintenance manuals and, warranties
and instructions.
Energy monitoring
Energy management systems measure the energy consumed within a zone defined
in a building facility over a specific time period. For energy management and control,
facility managers rely on such systems. Using BIM along with the dynamic energy model
of a building, enables the development of what-if scenarios to determine the use of
energy systems under several configurations. The integration between BIM based

20
visualization tools and occupancy sensors could be exploited to monitor energy
consumption. BIM also has the potential to be utilized for tracking historical energy
consumption associated with zones or rooms, and for associating this data with smart
objects embedded within the model. This could further be utilized for analyzing and
predicting the energy consumption behavior.
Over the lifecycle of a building project, the largest percentage of expenses occurs
over the operations and maintenance phases (Liu et.al 1994). Only about 15 % of the total
construction cost is expended during the construction and design phases, whereas
operations accounts for about 60% of the entire construction cost. According to Sullivan
et.al (2004) for prioritizing maintenance work and for supporting decisions associated
with planning maintenance, a reliable maintenance database is necessary.
2.8.1 Facility management databases and Construction Operations Building
Information Exchange (COBie)
Buildings today are comparatively sophisticated and the requirement for facility
information to maintain and operate them is important (Jordani, 2010). Such information
can make it possible to track components accurately, identify building operations
inefficiencies and respond to client requests (Forns-Samso, 2010). Each asset in a facility
management inventory has an associated cost with its installation and, operations and
maintenance. An accurate and updated equipment inventory is essential for budgeting
replacement and maintenance costs (GSA, 2011). This process usually takes place just
prior to the building being occupied, recognized as the best time for accumulating and
uploading facility asset information (Edgar, 2000).

21
Facility management activities heavily rely on the accessibility and accuracy of
equipment and asset data developed during the design and construction phases which is
then maintained during the operation and maintenance phases. According to Keady
(2009) failure to accurately track equipment inventory reduces reliability of cost
estimates and affects emergency response. It also impacts the capability of making
executive decisions associated with equipment replacement.
Since the majority of building facility data is developed during the construction
phase, it is imperative to implement an extensive data collection process throughout a
projects life cycle, beginning from the design phase. Hence the timing of the data
gathering process being early in the life cycle of a construction project is key to be able to
use BIM as a data management tool according to Jordani(2010).
Most construction contracts require handover of such data in the form of printed
documents comprising of equipment information, data sheets, list of spare parts,
warranties, schedules for preventive maintenance and so on(East,2011). This type of
information that uses design and constructional data to support operations and
maintenance is often classified by industry professionals as operational documents
Currently, there has been an increased amount of interest generated towards
Construction Operations Information Exchange (COBIE), which is a data exchange
format for facility management data handover. COBIE sheets are usually generated in
excel format as a plugin within the BIM modeling software. According to the GSA BIM
guide of facility management (2011) COBIE is an IFC based data exchange application
which describes information exchange between the operations and construction project
phases.

22
Interoperable file formats and standards could be used during the process of using
BIM and COBIE for Facilities management in two phases. The first phase includes the
use of IFC standard for formatting BIM models developed in the design and construction
phases. The second stage involves extracting information from these IFC BIM files into a
COBIE spreadsheet. COBIE allows extracting asset information from a BIM model,
retrieving maintenance plans and instructions through an excel spreadsheet and importing
this facility data into a facility managers computerized maintenance management system.
According to Gallaher (2004) this could result in a savings of around $613 million which
is estimated to be spent on converting facility information into a format that is usable by
facility managers.
A common issue which limits the usage of COBIE spreadsheets is that the
formulation of their dataset is carried out after the construction phase (Lavy &
Jawadekar,2014). This results in important information collected during the building
design, programming and construction phases critical to the COBIE database to be
omitted. Another issue commonly detected is that the establishment of IFC standards for
formatting BIM models is not accomplished during the design and construction phases.
In a research carried out by Lavy and Jawadekar(2014), it was shown that the use
of BIM for data formulation and COBIE as a tool for data formatting positively impacted
facility management of certain selected projects with regard to gathering and
accumulating inventory data for preventive maintenance. It was also found that the use of
COBIE as a data handover tool was beneficial. It served purposes of storing data
extracted from BIM models and extracting the spatial information for integration with
inventory data. According to facility managers, it was found that savings in time for

23
responding to a work order showed a 9 percentage time saving. However, to achieve this
the importance of initiating database formulation in the design phase was highlighted.
Existing methods of planning and implementation of facility management and
maintenance are primarily based on personal experience, knowledge and intuition of
facility management personal or tradespersons. Typically, there are no records available
to facility managers that help them in identifying or diagnosing problems or increasing
their awareness of a previous problem history, and maintenance history information
associated with the component they are maintaining (Akcamete et.al.). Utilization of
COBIE sheets associated with a BIM model has the possibility of providing facility
information in addition to the maintenance history of the components being repaired or
maintained. COBie files provide the flexibility of being automatically imported and
recognized by most popular CMMS software. This further facilitates automatic
integration of monthly and weekly preventive maintenance schedules or work orders with
the CMMS software.
In a research project carried out by Jawedlkar(2012), by means of interviews with
the facility managers of the Facilities and Construction, Utilities, Security and
Safety(FUSS) department of Texas A&M University, using COBIE databases uploaded
into compatible CMMS systems, was shown to positively impact several activities in the
typical work order process of a facility manager. These are identified in the figure 2.1.

24
Figure 2.1: Work order activities affected by COBie depicted in blue color Source:Jawedlkar(2012)
In a survey conducted for two facility management organizations- the
International Facility Management Association (IFMA) and the building owners and
manager’s association (BOMA), it was also found that facility managers do not receive
adequate information during a close out process. This includes warranty information,
vendor/manufacturer contacts, maintenance history, equipment information, operations
and maintenance information and so on (Thomas-Mobley and Khuncumchoo, 2006).
Arditi & Manop (1999) developed a questionnaire to study the facility
management and maintenance practices of 230 property management firms. It was found
that the most maintenance related complaints were associated with air circulation, heat
loss/gain and lighting. For services associated with cleaning, inspecting and repairing, it
was found that mechanical and electrical systems were the most problematic to fix.
Electrical systems, however, were identified to be the most difficult to carry out

25
inspections. In a research project involving reactive maintenance work orders of fixed
assets for a campus building carried out for an entire year, it was found that most work
orders were associated with lighting changes (Akcamete et.al, 2010).
2.9 Chapter summary
Relevant literature associated with the use of sensor data with a BIM model to
achieve different objectives in previous years were presented in this chapter. The use of
wireless sensor networks and motes in smart buildings and the compatibility of sensor
data with BIM models were also discussed. Further the use of COBIE sheets as a data
handover tool was highlighted.

26
CHAPTER 3. METHODOLOGY
3.1 Research methodology.
A prototype that utilizes the benefits of integrating mote based sensor technology
with a BIM model was developed as part of this research. This integration is further
expected of being used as a facility management tool for equipment inventory and
preventive maintenance by linking COBIE sheets to it.
A wireless sensor network is established by making use of three TelosB sensor
nodes. The base station node or node was connected via USB to an active computer
running Windows OS. The other motes (parent motes) mounted on the wall within the
test rooms accumulate light sensor data and communicate this data to the sink node. The
sink mote was then programmed to transfer the data collected via USB to an SQL
database.
Figure 3.1 WSN network employed using motes

27
3.2 Data collection
In this research, data collected was restricted to light sensor data using three
TelosB motes. The parent motes collecting the sensor data was mounted in rooms 379b
and 379d within the KNOY hall of technology. The sink mote was connected to a
computer setup in room 379c.
3.3 Prototype development
A prototype application is designed to assist a facility manager performing
preventive maintenance as per the below mentioned steps.
Facility manager invokes the monitoring application by using the external
add-in tool within Revit 2016.
The user interface is developed such that it displays the latest sensor
values aggregated from the light sensor mote (TelosB) embedded within
the test room.
If the sensor value is below a required threshold for the room, it can be
visualized within a sheet in the Revit document with a separate color
scheme. Color schemes are set up for several ranges of collected lux
sensor data.
The user application created is configured to store all the light sensor data
within a database management system with time stamps and their
corresponding distinct identification information marked.

28
A data connection is established between the modelling software and the
database system using the Revit programming interface. For this purpose,
the unique id or room tag number within Revit was used to link it to the
sensor which uses the same id as it is located within the same room.
A COBIE spreadsheet is generated by tagging the room within Revit thus
using the unique id for that room. A link will be provided within the user
developed interface that connects the spreadsheet to the unique id of the
room model. This enables the facility manger to make a connection
between the acquired sensor data and equipment data associated to that
sensor.
In the options provided to export a COBie Tool kit, additional equipment sheets
could be made available. This is achieved by picking each installed equipment work book
within the COBIE tool kit and by selecting all components that belong to that category.
When this workbook is finally exported as a spreadsheet, all the selected components
picked will be exported including the current data associated with them.
In the case of lighting equipment, this could include equipment name, type,
category (part or spare), specifications section number, suppler information, part number,
warranty information, supplier catalog information and so on.
In this research lighting fixtures data associated with the room for which sensor
data is collected is exported as COBIE sheets.
A link is provided in the prototype created, to the COBIE excel sheet for the
fixtures associated with the room for which sensor data has been collected. This

29
integration of equipment information and associated sensor data is expected to aid a
facility manager by allowing him/her easy access to field conditions and maintenance
information prior to/ or during running maintenance checks

30
CHAPTER 4. RESULTS AND DISCUSSIONS
The sensors were programmed and mounted in two test rooms-379b and 379d in
the KNOY hall of technology at Purdue University. The rooms are highlighted in the
figure 4.1. The placement of sensors was finalized depending on their closeness to the
light sources in the selected rooms. There were six 4 feet long light tubes in each room.
Room 379b has a window which allows considerable amount of sunlight into the room as
opposed to the room 379d which is devoid of any daylighting. The two test rooms 379b
and 379d were named and tagged as room 1 and room 2 respectively for convenience
within the Revit model.
Figure 4.1: KNOY hall of technology floor plan.

31
The gateway sensor was kept connected to a computer within the room 379c. The
two parent motes were programmed using C# to communicate their light sensor data. The
gateway mote and parent motes were programmed to turn on their radio modules at an
interval of every 5 minutes to send and receive light sensor data. The motes were
programmed in Tinyos using separate mote ids to distinguish their data. The mote in
room 379b was programmed with ID number 1 whereas the one in 379d was
programmed with ID number 2.
Figure 4.2: Diagram of the Wireless Sensor Network employed.
Figure 4.3: Diagram of the sensor setup
32
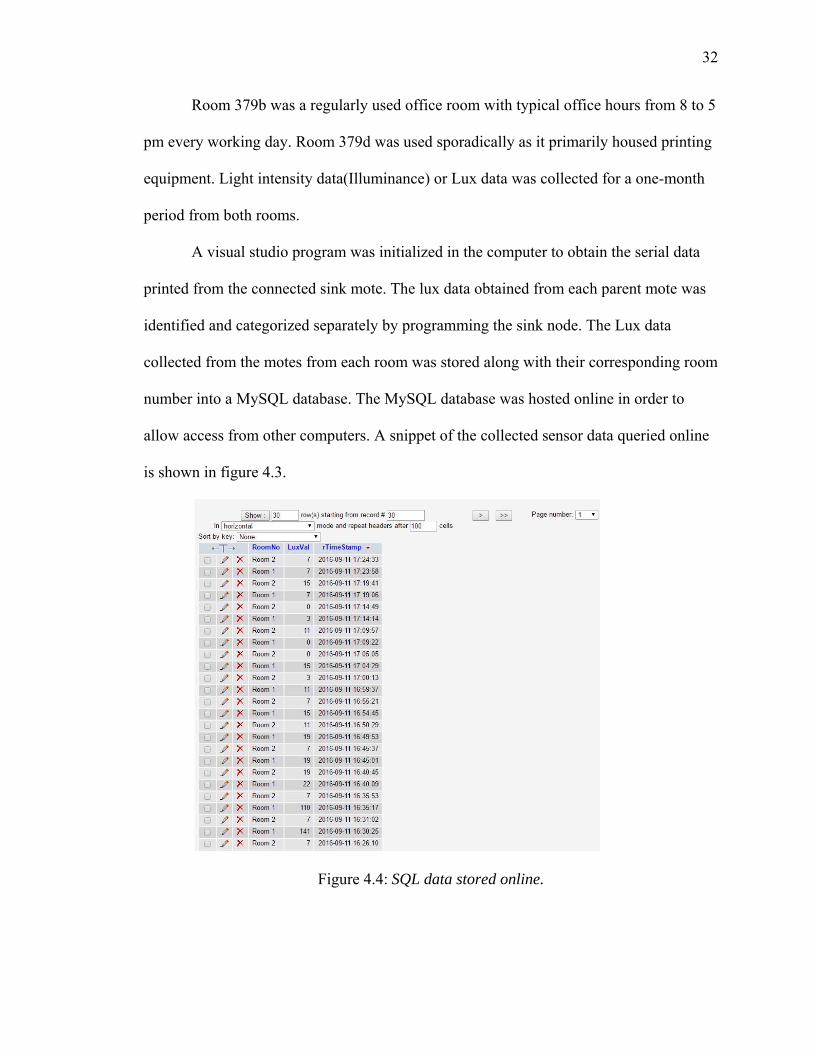
Room 379b was a regularly used office room with typical office hours from 8 to 5
pm every working day. Room 379d was used sporadically as it primarily housed printing
equipment. Light intensity data(Illuminance) or Lux data was collected for a one-month
period from both rooms.
A visual studio program was initialized in the computer to obtain the serial data
printed from the connected sink mote. The lux data obtained from each parent mote was
identified and categorized separately by programming the sink node. The Lux data
collected from the motes from each room was stored along with their corresponding room
number into a MySQL database. The MySQL database was hosted online in order to
allow access from other computers. A snippet of the collected sensor data queried online
is shown in figure 4.3.
Figure 4.4: SQL data stored online.

33
The data was hosted by purchasing a web based SQL hosting service on
www.godaddy.com to handle the administration of MySQL servers over the internet. A
single database was created to store sensor values from both rooms which included three
columns – the room number, Lux value and a time stamp which is automatically
generated on the website.
Within Revit, a plugin was created by using Microsoft Visual Studio. The user
interface was created to display the sensor values based on a user specified date range.
The sensor values were depicted visually using bar and line graphs. For a single day, the
sensor values are plotted against time in a straight line graph.
For a range of dates, the maximum, minimum and average values are represented
in bar graphs. The values can be further filtered for a two-hour time range.
Furthermore, an ‘Apply to Revit’ button was created which applies the sensor
maximum, minimum and average values to a Revit sheet containing three floor plans of
the two rooms, 379b and 379d. A color scheme is enabled in Revit which displays
different colors for the room tag depending on the range within which the sensor values
fall. This color scheme is shown below.

34
Figure 4.5: Color scheme for selected room.
4.1 Use of shared and project parameters.
The color scheme is applied to each room by applying the values by means of
Shared parameters within Revit. Shared parameters- Lux average, minimum and
maximum are added to the room category within Revit. The shared parameters time and
date are grouped under the category of project information. The Lux values are then
coded using the Revit api to have their values applied to the parameters corresponding to
the specific room tag number. In this particular case, the room tag created with the name
as ‘room 1’ would have the Lux average, minimum and maximum values entered
corresponding to the data stored under the room name listed as ‘room 1’ hosted over the
SQL server. In a sheet within Revit, a custom label is also created to reflect the project
parameters of date and time for which the values are applied using the apply to Revit key
within the tool. These labels can be seen in the previous figure 4.4.

35
4.2 Description of the plugin functions
Selection of dates is carried out for a range of dates or a single date.
When the load button is clicked, updated sensor values for each room are loaded
from the online SQL server and displayed in a table as shown in the figure below.
The chart area selected depends upon the selection of dates.
Figure 4.6: Figure showing sensor data for a time range.
For a range, a bar chart is displayed whereas for a single day a straight line chart
is displayed. For a single day, Lux values are plotted in real time against time on
the X axis for both rooms as shown in figure 4.5.
36
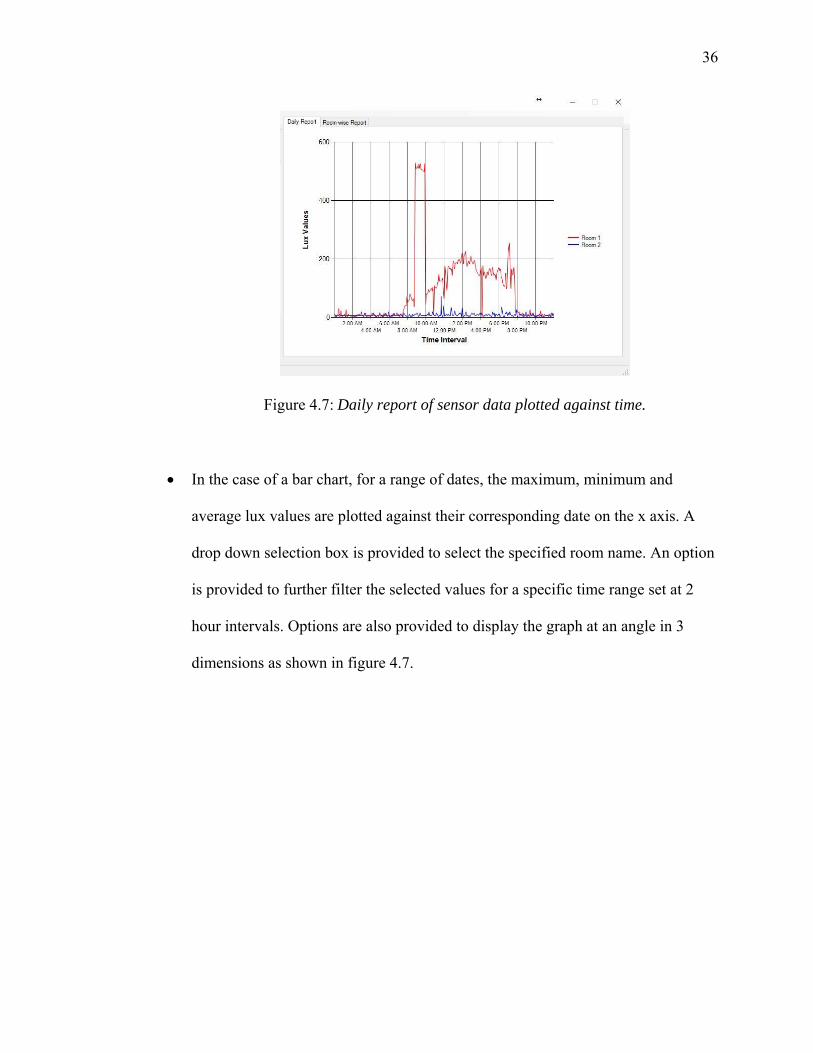
Figure 4.7: Daily report of sensor data plotted against time.
In the case of a bar chart, for a range of dates, the maximum, minimum and
average lux values are plotted against their corresponding date on the x axis. A
drop down selection box is provided to select the specified room name. An option
is provided to further filter the selected values for a specific time range set at 2
hour intervals. Options are also provided to display the graph at an angle in 3
dimensions as shown in figure 4.7.

37
Figure 4.8: Bar chart of sensor data plotted against a range of dates
For each date, a separate dialog box has been created with each date in the range
specified earlier to apply the minimum, maximum and average Lux data to the
shared parameters under each room tag - room 1 and room 2. This is
accomplished by clicking the apply to Revit button.
Depending on the color scheme selected, the room tag displays different colors
for each room based on the range within which the Lux data for that date falls.
Two other tabs are provided within the plugin to access the SQL server settings
for the database hosted online and to provide information on how the plugin
functions.
38
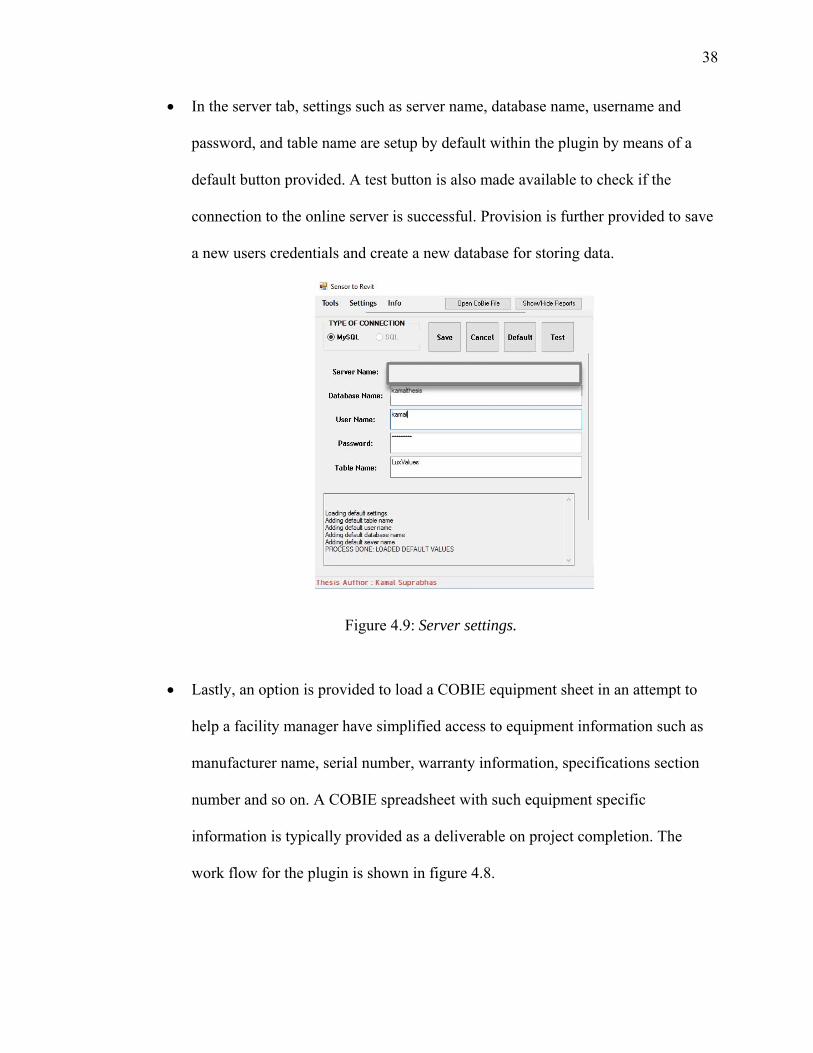
In the server tab, settings such as server name, database name, username and
password, and table name are setup by default within the plugin by means of a
default button provided. A test button is also made available to check if the
connection to the online server is successful. Provision is further provided to save
a new users credentials and create a new database for storing data.
Figure 4.9: Server settings.
Lastly, an option is provided to load a COBIE equipment sheet in an attempt to
help a facility manager have simplified access to equipment information such as
manufacturer name, serial number, warranty information, specifications section
number and so on. A COBIE spreadsheet with such equipment specific
information is typically provided as a deliverable on project completion. The
work flow for the plugin is shown in figure 4.8.
39
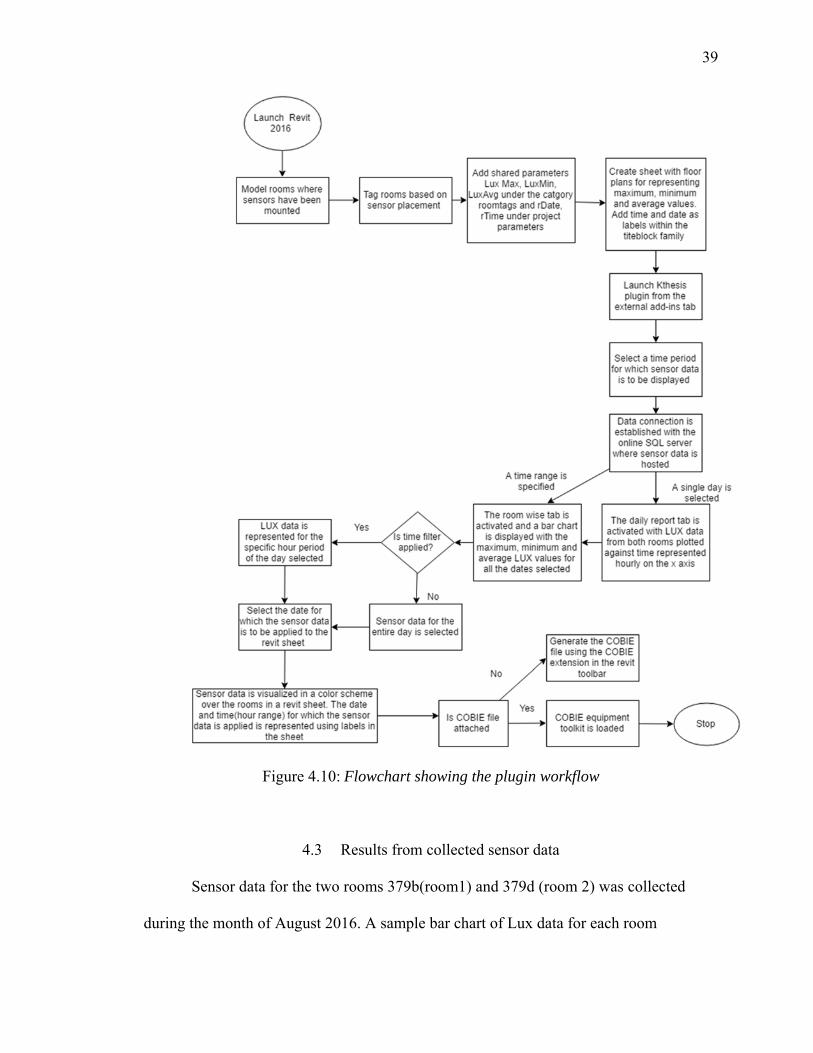
Figure 4.10: Flowchart showing the plugin workflow
4.3 Results from collected sensor data
Sensor data for the two rooms 379b(room1) and 379d (room 2) was collected
during the month of August 2016. A sample bar chart of Lux data for each room

40
collected for a period of 1 week is shown in the figure below. A straight line chart with
Lux data for a single day is also shown in the figure below.
Figure 4.11: Bar chart with sensor data.
Figure 4.12: Straight line graph of sensor data.
41
4.4 Discussions
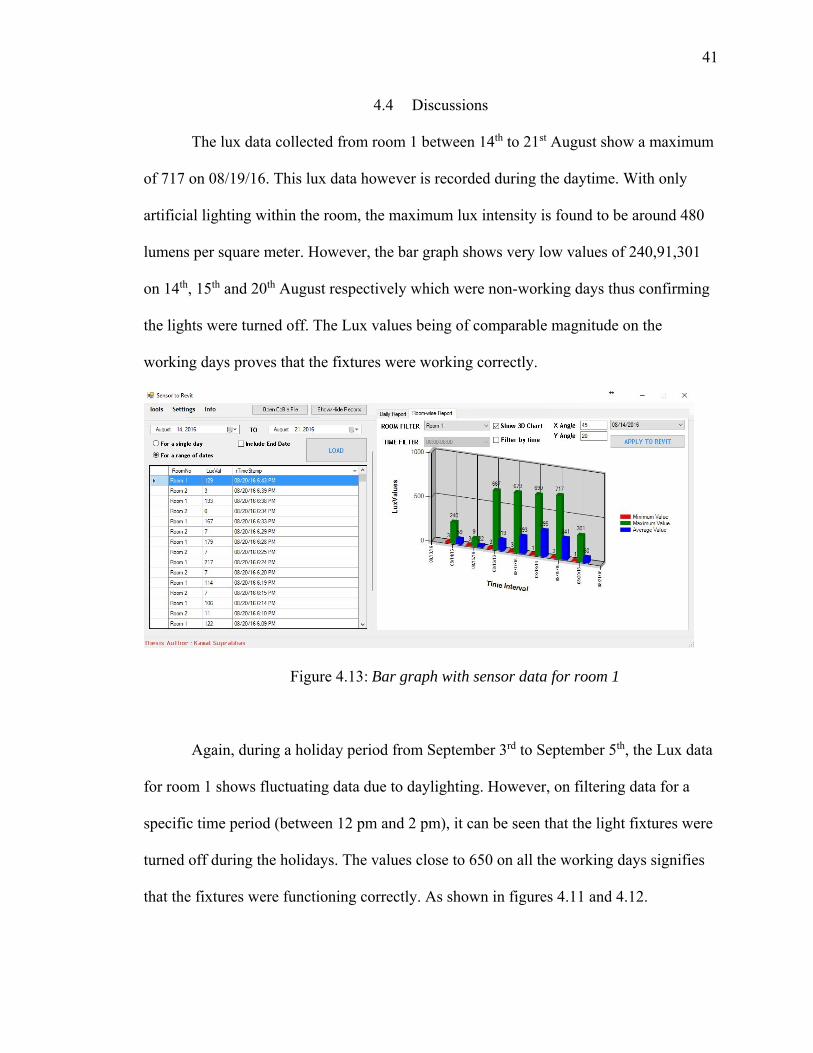
The lux data collected from room 1 between 14th to 21st August show a maximum
of 717 on 08/19/16. This lux data however is recorded during the daytime. With only
artificial lighting within the room, the maximum lux intensity is found to be around 480
lumens per square meter. However, the bar graph shows very low values of 240,91,301
on 14th, 15th and 20th August respectively which were non-working days thus confirming
the lights were turned off. The Lux values being of comparable magnitude on the
working days proves that the fixtures were working correctly.
Figure 4.13: Bar graph with sensor data for room 1
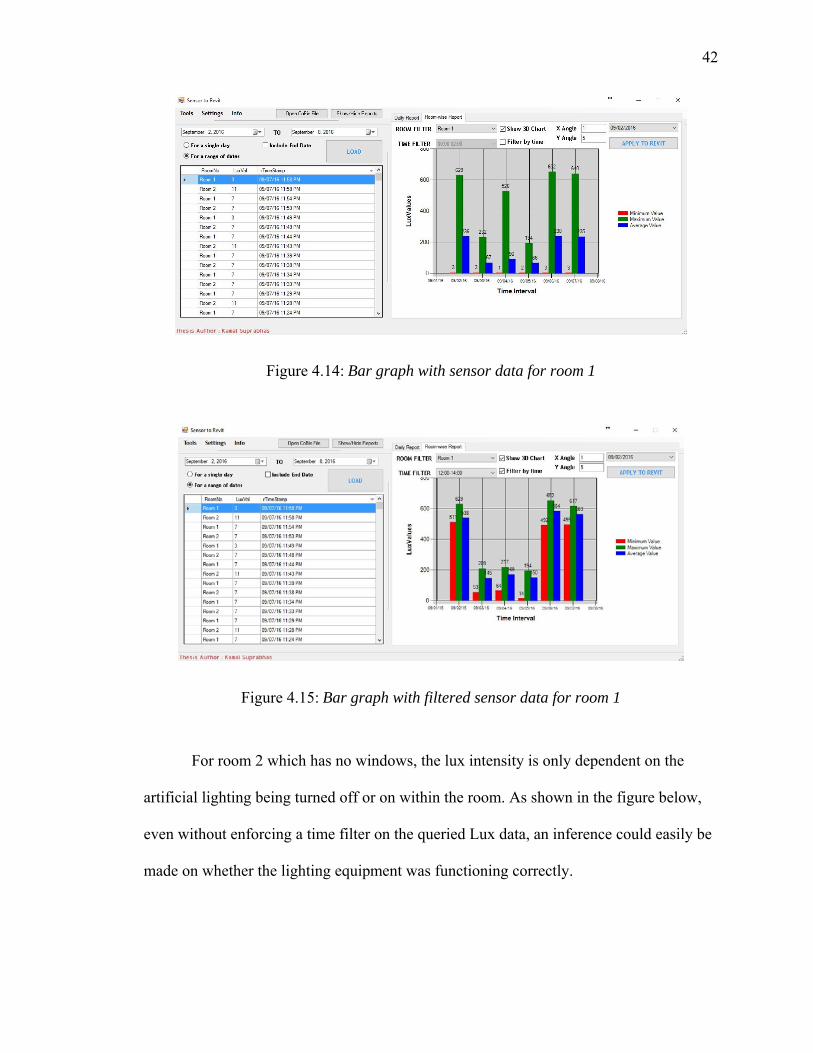
Again, during a holiday period from September 3rd to September 5th, the Lux data
for room 1 shows fluctuating data due to daylighting. However, on filtering data for a
specific time period (between 12 pm and 2 pm), it can be seen that the light fixtures were
turned off during the holidays. The values close to 650 on all the working days signifies
that the fixtures were functioning correctly. As shown in figures 4.11 and 4.12.
42
Figure 4.14: Bar graph with sensor data for room 1
Figure 4.15: Bar graph with filtered sensor data for room 1
For room 2 which has no windows, the lux intensity is only dependent on the
artificial lighting being turned off or on within the room. As shown in the figure below,
even without enforcing a time filter on the queried Lux data, an inference could easily be
made on whether the lighting equipment was functioning correctly.
43
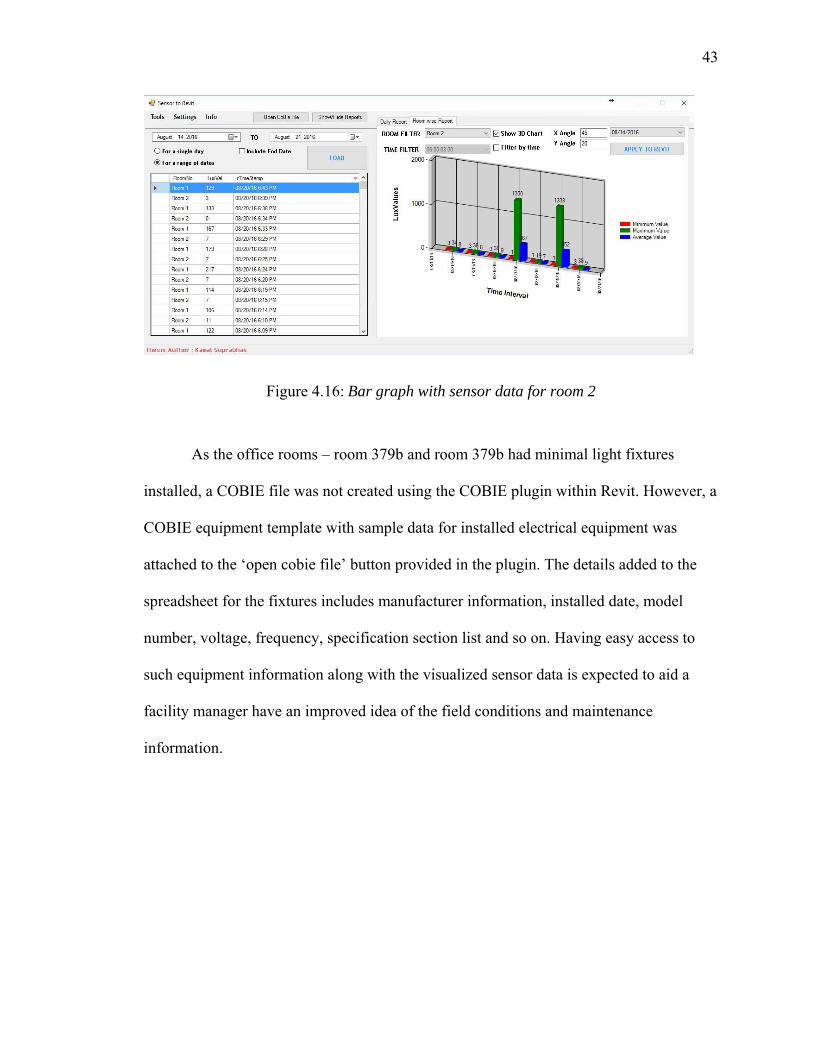
Figure 4.16: Bar graph with sensor data for room 2
As the office rooms – room 379b and room 379b had minimal light fixtures
installed, a COBIE file was not created using the COBIE plugin within Revit. However, a
COBIE equipment template with sample data for installed electrical equipment was
attached to the ‘open cobie file’ button provided in the plugin. The details added to the
spreadsheet for the fixtures includes manufacturer information, installed date, model
number, voltage, frequency, specification section list and so on. Having easy access to
such equipment information along with the visualized sensor data is expected to aid a
facility manager have an improved idea of the field conditions and maintenance
information.

44
CHAPTER 5. CONCLUSION AND FUTURE WORK
5.1 Conclusion
The prototype plugin created was developed with an aim to visualize and utilize
sensor data, collected by means of a wireless sensor network, within a virtual
model(Revit) of a building facility. By making use of shared parameters within Revit,
illuminance or Lux data was able to be visualized within the model by applying a color
pattern to each room being experimented with. Furthermore, for specific hours of the day,
the Lux data could further be analyzed and visualized both within the virtual model and
by means of a bar graph in the plugin developed. Having a COBIE equipment sheet
attached within the plugin allows for simpler access to product specific information
which further aids a facility manager during maintenance checks.
5.2 Conclusions from the collected data
It was seen that the lighting illuminance collected by means of the sensor and
visualized within the virtual model was fairly accurate when predicting if the fixtures
were turned on or off. Placement of the sensors with respect to the light source
determines the threshold lux value that has to be determined in advance to recognize
issues. It can be inferred that the lux data, if filtered over specific working hours,
45
could be utilized to detect malfunctioning light fixtures within the rooms by
comparing the threshold lux value to the collected real time data.
5.3 Recommendations and future work
This research did not look into the application of having the sensor data applied
directly into a COBIE sheet. A provision could be implemented to have rooms with
malfunctioning equipment or illuminance lux data less than the critical lux value,
highlighted within the COBIE spreadsheet. This could help filter relevant information
associated with fixtures that are malfunctioning.
In addition to measuring the illuminance for each room, the telosb also has
inbuilt temperature sensors which were not used during this research. In the color scheme
setup to help visualize the rooms with lower light intensity, there is a category called
HVAC zones which could be exploited for visualizing temperature data across a zone.
There also exists a possibility to add shared parameters of temperature to each element in
a heating ventilation and air conditioning system. This includes the air terminals,
dampers, air handling units, ductwork and so on. With more extensive programming
using the Revit api, these parameters values could be altered with the temperature sensor
data to depict a color code that reflects their improper functioning. This could further
help a facility manager visualize and identify faults within the virtual model.
For rooms with critical lighting requirements like hospitals, there exists a
possibility of having the real time data sent as immediate alerts to a facility manager. This
could be done by creating an application extension of the plugin supported by mobile
devices.

LIST OF REFERENCES

46
LIST OF REFERENCES
Akcamete, A., Akinci, B., and Garrett, J. H., Jr. (2010) “Potential utilization of building information models for planning maintenance activities,” Proceedings from The International Conference on Computing in Civil and Building Engineering Nottingham, UK, June 30-July 2, 2010.
Andonovic I. (2009). Evolution and applications of wireless sensor networks, Proceedings of the International Conference on Communications and Mobile Computing, 4-5.
Arditi, D., & Nawakorawit, M. (1999). Issues in Building Maintenance: Property Managers' Perspective. Journal of Architectural Engineering J. Archit. Eng., 5(4), 117-132. doi:10.1061/(asce)1076-0431(1999)5:4(117)
Attar, R., E. Hailemariam, M. Glueck, A. Tessier, J. McCrae, A. Khan, (2010a), BIM-based Building Performance Monitoring, Proceedings of the SimAUD, Orlando, Florida, p.32.
Autodesk, Inc. (2008). Improving building industry results through integrated project delivery and building information modeling. White Paper, Available online at www.autodesk.com.
Azevedo, S., Prata, P., & Fazendeiro, P. (2014). The role of radio frequency identification (RFID) technologies in improving process management and product tracking in the textiles and fashion supply chain. Fashion Supply Chain Management Using Radio Frequency Identification (Rfid) Technologies, 42-69.
Azhar, S., & Brown, J. (2009). BIM for Sustainability Analyses. International Journal of Construction Education and Research, 5(4), 276-292.
Azhar, S., Brown, J., & Farooqui, R. (2009) BIM-based Sustainability Analysis: An Evaluation of Building Performance Analysis Software, Proceedings of the 45th Annual ASC Conference, Gainesville, FL, April 1-4, 2009Azhar, S., Khalfan, M., & Maqsood, T. (2012). Building information modelling (BIM): Now and beyond. AJCEB Australasian Journal of Construction Economics and Building, 12(4), 15.

47
Becerik-Gerber, B., Jazizadeh, F., Li, N., & Calis, G. (2012). Application Areas and Data Requirements for BIM-Enabled Facilities Management. Journal of Construction Engineering and Management J. Constr. Eng. Manage., 138(3), 431-442.
Cahill, B., Menzel, K., & Flynn, D. (2012). BIM as a centre piece for optimised building operation. EWork and EBusiness in Architecture, Engineering and Construction ECPPM 2012, 549-555.
Clayton, M.J., Johnson, R.E., Song, Y. and Al-Qawasmi, J. (1998), A Study of Information Content of As-built Drawing for USAA, Retrieved from
http://archone.tamu.edu/crs//documents/publications/asbuilt.pdf 1
Crossbow, TelosB, Retrieved from http://www.willow.co.uk/TelosB_Datasheet.pdf/ 2013 (accessed on 15th September 2015).
Crossbow,TelosB, Retrieved from http://www.memsic.com/userfiles/files/Datasheets/WSN/telosb_datasheet.pdf, (accessed on 6th March 2016)
D. A. Jordani, “BIM and FM: The Portal to Lifecycle Facility Management,” Journal of Building Information Modeling (JBIM), 13 – 16.
Dogan, R., & Erdem, E. (2015). Temperature and humidity control of the tunnels in the dam using wireless sensor networks. 2015 IEEE 19th International Conference on Intelligent Engineering Systems (INES).
Eastman, C. (1999). Building Product Models: Computer Environments Supporting Design and Construction, CRC Press LLC, Florida
Edgar, A. (2000). Facility Data Commissioning, Graphic Systems, Inc., Wichita, KS, retrieved from www.graphicsystems.biz
Ergen, E., Akinci, B., & Sacks, R. (2007). Life-cycle data management of engineered-to-order components using radio frequency identification. Advanced Engineering Informatics, 21(4), 356-366.
Estrin, D., Culler, D., Pister, K., & Sukhatme, G. (2002). Connecting the physical world with pervasive networks. IEEE Pervasive Comput. IEEE Pervasive Computing, 1(1), 59-69.
Forns-Samso D.F. (2010). Perceived value of building information modeling in facilities operations and maintenance (Master’s Thesis) Available from ProQuest Dissertations and Theses database.

48
Gallaher, M. P., O'connor, A. C., Dettbarn, J. J., & Gilday, L. T. (2004). Cost Analysis of Inadequate Interoperability in the U.S. Capital Facilities Industry. doi:10.6028/nist.gcr.04-867
Grilo, A., & Jardim-Goncalves, R. (2010). Value proposition on interoperability of BIM and collaborative working environments. Automation in Construction, 19(5), 522-530.
GSA n.d., The National 3D-4D-BIM Program. GSA BIM Guide Series 1, pg 3, retrieved from http://www.gsa.gov/gsa/cm_attachments/GSA_DOCUMENT/GSA_BIM_Guide_v0_60‐
_Series01_Overview_05‐14‐07_R2C‐a3‐l_0Z5RDZ‐i34KpR.pdf
Guinard, A., Mcgibney, A., & Pesch, D. (2009). A wireless sensor network design tool to support building energy management. Proceedings of the First ACM Workshop on Embedded Sensing Systems for Energy-Efficiency in Buildings - BuildSys '09
Jain, P. C., & Vijaygopalan, K. P. (2010). RFID and wireless sensor networks (pp. 1–11). Noida, India. Proceedings of ASCNT-10, CDAC.
Jawadekar, S. (2012). A case study of the use of BIM and Construction Operations Building Information Exchange (COBie) for Facility Management
Keady, R. (2009). Financial Impact and Analysis of Equipment Inventories. Facilities Engineering Journal.
Khemlani, L (2004), The IFC Building Model: A Look Under the Hood, AECbytes Feature, March 30, 2004. Retrieved from http://www.aecbytes.com/feature/2004/IFCmodel.html
Krukowski, A., & Arsenijevic, D. (2010). RFID-based positioning for building management systems. Proceedings of 2010 IEEE International Symposium on Circuits and Systems.
Kumar, Sumedha,(2008). Interoperability between building information models (BIM) and energy analysis programs (Master’s thesis). Available from ProQuest Dissertations and Theses database. (UMI No.1489678)
Lavy, S., & Jawadekar, S. (2014). A Case Study of Using BIM and COBie for Facility Management. International Journal of Facility Management, 5(2).
Lee, K. (2007). Sensor standards harmonization-path to achieving sensor interoperability, IEEE Autotestcon.

49
Liu, X., & Akinci, B. (2009). Requirements and Evaluation of Standards for Integration of Sensor Data with Building Information Models. Computing in Civil Engineering (2009).
M. Arslan, Z. Riaz, A.K. Kiani, S. Azhar(2014) Real-time environmental monitoring, visualization and notification system for construction H&S management, Journal of Information Technology in Construction, 19, 72–91.
Meadati P., Irizarry J. and Akhnoukh A.K. (2010), BIM and RFID Integration: A pilot study, Proceedings of the 2nd International Conference on Construction in Developing Countries, Cario, Egypt, 570-578.
Othman M. F. and Shazali K. (2012). Wireless sensor network applications: A study in environment monitoring system, Procedia Engineering, Vol. 41, 1204-1210.
Sardroud, J. M. (2012). Influence of RFID technology on automated management of construction materials and components. Scientia Iranica, 19(3), 381-392.
Succar, B. (2009). Building information modelling framework: A research and delivery foundation for industry stakeholders. Automation in Construction, 18(3), 357-375.
Sullivan, G. P., Pugh, R., Melendez, A. P., & Hunt, W. D. (2004). O&M Best Practices - A Guide to Achieving Operational Efficiency, doi: 10.2172/947512
Thomas‐Mobley, L., & Khuncumchoo, N. (2006). A facility manager's approach to
standardized construction contracts. Journal of Facilities Management J of Facilities Management, 4(4), 234-244. doi:10.1108/14725960610702929
Wielens S., Galetzka M. and Schneider P. (2008). Design support for wireless sensor networks based on the IEEE 802.15.4 standard, Proceedings of the IEEE 19th International Symposium on Personal, Indoor and Mobile Radio Communications PIMRC, 1-5.
Woo J.H., Diggelman C. and Abushakra B. (2011). BIM-based energy monitoring with XML parsing engine, Proceedings of the 28th ISARC, Seoul Korea, 544-545.
Yang B., Luo J. and Liu Q. (2014). A novel low-cost and small-size human tracking system with pyro electric infrared sensor mesh network, Infrared Physics & Technology, Vol. 63, 147-156.
Zhang Y., Zhang D. and Huang C. (2007). Proceedings of the International Conference on the Construction and Maintenance of Virtual Backbone for Wireless Sensor Networks, 1813-1817.

50
Zhang, J., Seet, B., & Lie, T. (2015). Building Information Modelling for Smart Built Environments. Buildings, 5(1), 100-115.

APPENDICES

51
APPENDIX A: Code for Programming the Sink and Parent Nodes
#include<stdio.h>
#include<Timer.h>
#include<string.h>
#include"TempTest.h"
module TempTestC{
uses //General Interface
{
interface Boot;
interface Leds;
}
uses //Radio
{
interface Packet;
interface AMPacket;
interface SplitControl as AMControl;
interface Receive;
}
}
52
implementation{
uint16_t data;
message_t packet;
event void Boot.booted()
{
call AMControl.start();
// TODO Auto-generated method stub
}
event void AMControl.stopDone(error_t error){
// TODO Auto-generated method stub
}
event message_t * Receive.receive(message_t *msg, void *payload, uint8_t len)
{uint16_t centigrade;
if(len == sizeof(TempTestMsg_t))

53
{
TempTestMsg_t* incomingPacket;
incomingPacket =(TempTestMsg_t*) payload;
centigrade = incomingPacket->Data;
data = ((centigrade)/4096.0 * 15625.0);
if (incomingPacket->NodeId == 2)
{call Leds.led2Toggle();
printf("LUX 1: %d \r\n", data);
}
if (incomingPacket->NodeId == 3)
{call Leds.led0Toggle();
printf("LUX 2: %d \r\n", data);
}
}
return msg;
// TODO Auto-generated method stub
}
event void AMControl.startDone(error_t error)

54
{
if (error == SUCCESS)
{
call Leds.led1On();
}
else
{
call AMControl.start();
}
// TODO Auto-generated method stub
}
}
configuration TempTestAppC{
}
implementation{
components TempTestC as App;
components MainC;
components LedsC;
App.Boot->MainC;

55
App.Leds->LedsC;
//For writing into serial port
components SerialPrintfC;
//Temperature component
components ActiveMessageC;
components new AMReceiverC(AM_RADIO );
App.AMControl->ActiveMessageC;
App.Receive->AMReceiverC;
}
56
APPENDIX B: Code for Reading Serial Data from the Gateway Mote
using System;
using System.Collections.Generic;
using System.ComponentModel;
using System.Data;
using System.Drawing;
using System.Linq;
using System.Text;
using System.Threading.Tasks;
using System.Windows.Forms;
using MySql.Data.MySqlClient;
namespace Light_Test
{
public partial class Form1 : Form
{
public Form1()
{
InitializeComponent();
if (!mySerialPort.IsOpen)
{
mySerialPort.Open();
tbTX.Text = "port opened";
57
}
else
tbTX.Text = "port busy";
}
private string rxString;
private string lux2, lux1;
private int a;
private void mySerialPort_DataReceived(object sender,
System.IO.Ports.SerialDataReceivedEventArgs e)
{
rxString = null;
string name = null;
rxString = mySerialPort.ReadExisting();
if (rxString.Length >= 7)
{
this.Invoke(new EventHandler(displayText));
int index = rxString.IndexOf(":");
name = rxString.Substring(4, 1);
if (name == "1")
{
lux1 = rxString.Substring(index + 2);

58
a = 1;
this.Invoke(new EventHandler(sqlText));
}
if (name == "2")
{
lux2 = rxString.Substring(index + 2);
a = 2;
this.Invoke(new EventHandler(sqlText));
}
}
}
private void displayText(object o, EventArgs e)
{
tbTX.AppendText(rxString);

59
}
private void tbTX_TextChanged(object sender, EventArgs e)
{
}
private void Form1_FormClosed(object sender, FormClosedEventArgs e)
{
mySerialPort.Close();
}
private void sqlText(object o, EventArgs e)
{
MySqlConnection rconn;
MySqlConnectionStringBuilder rconstrbuild;
rconstrbuild = new MySqlConnectionStringBuilder();
rconstrbuild.Server = "*******.hostedresource.com";
rconstrbuild.Database = "*********";
rconstrbuild.UserID = "********";
rconstrbuild.Password = "*******";
rconstrbuild.Pooling = false;
MySqlCommand command;

60
rconn = new MySqlConnection();
rconn.ConnectionString = rconstrbuild.ConnectionString;
using (rconn)
{
rconn.Open();
if (a == 1)
{
command = new MySqlCommand("INSERT INTO LuxValues(RoomNo,
LuxVal) values (@room, @l1)", rconn);
command.Parameters.AddWithValue("@room", "Room 1");
command.Parameters.AddWithValue("@l1", lux1);
command.ExecuteNonQuery();
}
if (a == 2)
{
command = new MySqlCommand("INSERT INTO LuxValues(RoomNo,
LuxVal) values (@room, @l2)", rconn);

61
command.Parameters.AddWithValue("@room", "Room 2");
command.Parameters.AddWithValue("@l2", lux2);
command.ExecuteNonQuery();
}
rconn.Close();
}
}
}
}

62
APPENDIX C: Code for the Plugin Creation
Please contact the author for further access to the code for plugin creation.