Integration Costs of Variable Renewable Energy Sources · Renewable Energy Sources Final Report of...
51
Integration Costs of Variable Renewable Energy Sources Final Report of a GJETC Working Group Authors Yuhji Matsuo, Institute of Energy Economics, Japan Stefan Thomas, Wuppertal Institute for Climate, Environment and Energy (Co-Author) With contributions by Andreas Löschel, University of Münster and Margaret Jackson, Visiting Researcher, Institute of Energy Economics, Japan Tokyo / Wuppertal, January 2020
Transcript of Integration Costs of Variable Renewable Energy Sources · Renewable Energy Sources Final Report of...

Integration Costs of Variable Renewable Energy Sources
Final Report of a GJETC Working Group
Authors
Yuhji Matsuo, Institute of Energy Economics, Japan
Stefan Thomas, Wuppertal Institute for Climate, Environment and Energy (Co-Author)
With contributions by Andreas Löschel, University of Münster and Margaret Jackson, Visiting Researcher, Institute of Energy Economics, Japan
Tokyo / Wuppertal, January 2020

Imprint
PublisherWuppertalInstituteforClimate,EnvironmentandEnergyDöppersberg1942103WuppertalGermanywww.wupperinst.orgInstituteofEnergyEconomicsJapanInuiBldg.Kachidoki,10th,11thFloor13-1,Kachidoki1-chome,Chuo-ku,Tokyo104-0054Japanhttps://eneken.ieej.or.jp/en/
[email protected]:+492022492-184Fax:+492022492-108
ThisGJETCWorkingGroupreceivedfinancialsupportfromtheGermanFederalEnvironmentalFoundation(DBU)andtheMinistryofEconomy,TradeandIndustry(METI).
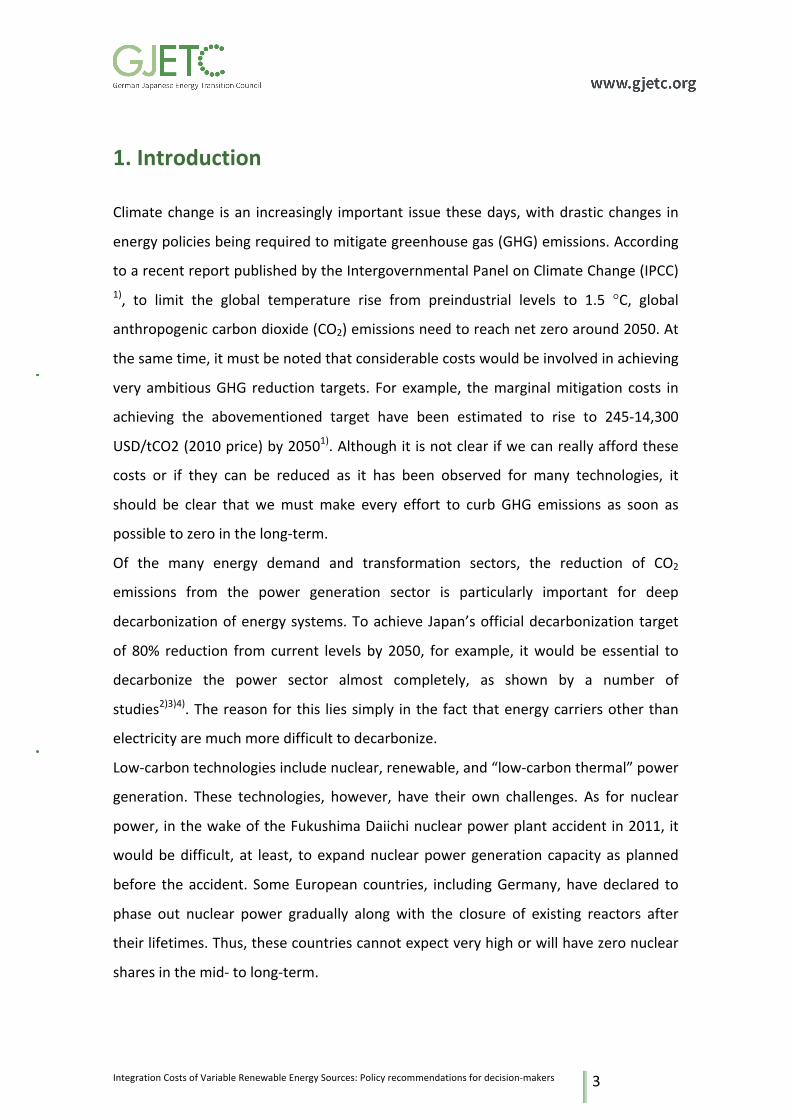
Content
ListofFigures.........................................................................................................1
ListofTables..........................................................................................................2
1.Introduction.......................................................................................................3
2.CaseofJapan:IEEJmodelling............................................................................5
2.1FutureprojectionoftheLCOEsofsolarPVandwindinJapan....................5
2.2Estimationoftheeconomicsofcompletedecarbonizationofthepower
sector–Methodology.......................................................................................9
2.3Calculationresults:integrationcostsunderhighpenetrationofVRE.......12
2.4Effectsofchangesinmeteorologicalconditions.......................................18
2.5Discussion..................................................................................................24
3.CaseofGermany:ReviewofThreeScenarioModellingStudies.....................26
3.1ComparisonofBaselineStudies................................................................26
3.2Results:RecommendationstomeetGermany’sclimatetargets..............28
3.3Discussion..................................................................................................38
4.Comparativediscussionandconclusions........................................................40
References...........................................................................................................45

IntegrationCostsofVariableRenewableEnergySources:Policyrecommendationsfordecision-makers
1
ListofFigures
Figure1:InitialinvestmentcostsforsolarPVandwind-aninternational
comparison................................................................................................................6
Figure2:Historicaltrendintheinitialcost:ResidentialsolarPV..............................6
Figure3:ExplorationofhistoricaltrendsintheinitialcostofsolarPVandonshore
windpowerinJapan..................................................................................................8
Figure4:Regionaldivisions........................................................................................9
Figure5:Optimalgenerationmixresultingfrommodellingninecostcasesfor
renewables&batteriesandhydrogen,allowingfor25GWofnuclearenergy........13
Figure6:Powergenerationmixwithdifferentlevelsofhydrogenpoweroutput..14
Figure7:Changeintheunitsystemcostanditscomponents(M/Mcase).............15
Figure8:Unitpowergenerationcostfordifferentcostcases.................................16
Figure9:"Cannibalization"effect............................................................................17
Figure10:Unitsystemcostfordifferentmeteorologicalconditions......................19
Figure11:Totalstoredpowerforthe28meteorologicalconditions(CaseA)........20
Figure12:ElectricitydemandandsupplyduringSep.1to15(CaseA,2000data,
totalofthenineregions).........................................................................................21
Figure13:AnillustrativediagramofthecumulativeresidualloadQ......................21
Figure14:Capacityofstoragesystems:ComparisonoftheCRLandtheLPresults23
Figure15:GHGemissionsbysectorunder95%climatetarget(dena)....................29
Figure16:GHGemissionsbysectorunder80%climatetarget(dena)....................30
Figure17:ExpectedwindandsolarPVcapacities...................................................31
Figure18:AveragesystemcostsforhighVREpenetrationscenarios.....................32
Figure19:Cumulativeinvestmentsforelectricitygridsuntil2050..........................33
Figure20:Overviewofcomponentsdiscussedunder"integrationcosts"..............34
Figure21:Representativegridandbalancingcostsforwindandsolarpower.......34
Figure22:DispatchablepowergenerationinGermany2050.................................36

IntegrationCostsofVariableRenewableEnergySources:Policyrecommendationsfordecision-makers
2
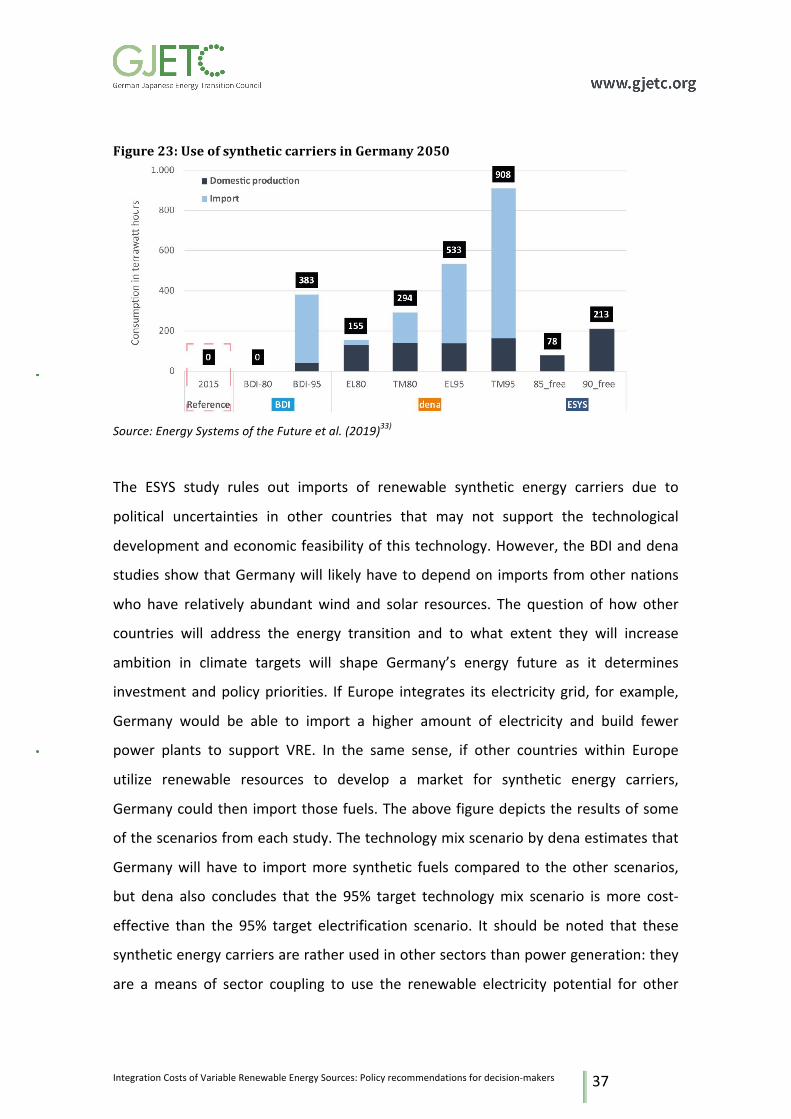
Figure23:UseofsyntheticcarriersinGermany2050.............................................37
Figure24:Powergenerationmixfordifferentscenarios........................................39
ListofTablesTable1:Observedlearningrates(BOS).....................................................................7
Table2:VREcapacitiesassumedforprojectingLCOEsin2050.................................8
Table3:SolarandwindpotentialsinJapan.............................................................11
Table4:Majorcostassumptions.............................................................................11
Table5:Majorcostassumptions.............................................................................24
IntegrationCostsofVariableRenewableEnergySources:Policyrecommendationsfordecision-makers
3
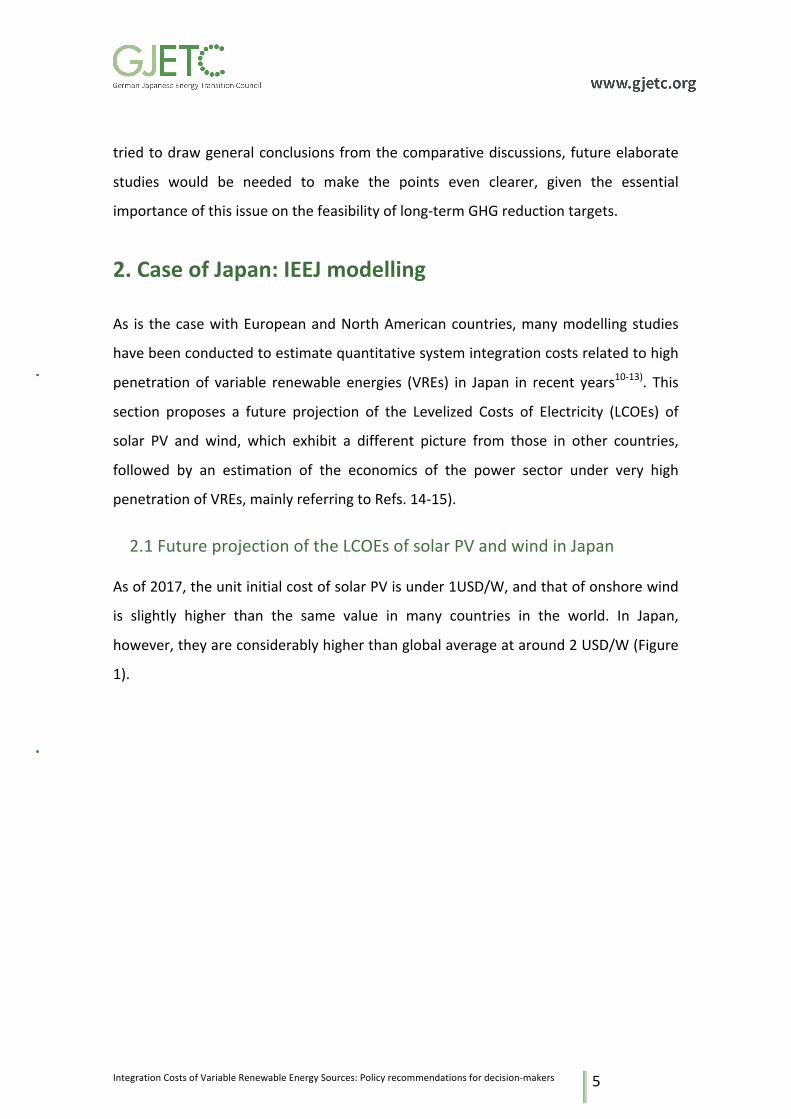
1.Introduction
Climatechange isan increasingly important issuethesedays,withdrasticchanges in
energypoliciesbeingrequiredtomitigategreenhousegas(GHG)emissions.According
toarecentreportpublishedbytheIntergovernmentalPanelonClimateChange(IPCC)
1), to limit the global temperature rise from preindustrial levels to 1.5 °C, global
anthropogeniccarbondioxide(CO2)emissionsneedtoreachnetzeroaround2050.At
thesametime,itmustbenotedthatconsiderablecostswouldbeinvolvedinachieving
veryambitiousGHG reduction targets. Forexample, themarginalmitigation costs in
achieving the abovementioned target have been estimated to rise to 245-14,300
USD/tCO2(2010price)by20501).Althoughitisnotclearifwecanreallyaffordthese
costs or if they can be reduced as it has been observed for many technologies, it
should be clear that wemustmake every effort to curb GHG emissions as soon as
possibletozerointhelong-term.
Of the many energy demand and transformation sectors, the reduction of CO2
emissions from the power generation sector is particularly important for deep
decarbonizationofenergysystems.ToachieveJapan’sofficialdecarbonizationtarget
of 80% reduction from current levels by 2050, for example, itwouldbe essential to
decarbonize the power sector almost completely, as shown by a number of
studies2)3)4).Thereasonforthis liessimply inthefactthatenergycarriersotherthan
electricityaremuchmoredifficulttodecarbonize.
Low-carbontechnologiesincludenuclear,renewable,and“low-carbonthermal”power
generation. These technologies, however, have their own challenges. As for nuclear
power,inthewakeoftheFukushimaDaiichinuclearpowerplantaccidentin2011,it
wouldbedifficult, at least, toexpandnuclearpowergenerationcapacityasplanned
before theaccident. SomeEuropeancountries, includingGermany,havedeclared to
phase out nuclear power gradually along with the closure of existing reactors after
theirlifetimes.Thus,thesecountriescannotexpectveryhighorwillhavezeronuclear
sharesinthemid-tolong-term.

IntegrationCostsofVariableRenewableEnergySources:Policyrecommendationsfordecision-makers
4
The costs of renewable power generation, especially those of solar PV, have been
declining rapidly,and theyareexpected todecline further in the future.However,a
majorbarrier to theuseofbothwindand solarPV is their recognizedvariability, or
intermittency, with fluctuating power outputs depending on weather and climate
conditions. Therefore, a massive introduction of these technologies would require
additional costs for flexibility technologies to support their system integration,
affectingtheeconomicsofthepowersector.
Low-carbon thermal power generation includes not only conventional systems with
the addition of CCS technology but also nearly CO2-free hydrogen-fired power
generationtechnology.AlthoughtheCCStechnologyhaslongbeenstudiedworldwide,
andseveralstudiessuggestthatthetechnologycouldbedeployedwithrelativelylow
costs5)6), existing CCS power projects exhibit quite high costs around 13-14 USD
thousand/kW7)8). In this regard, CCS could play an important role as a low-carbon
technologyonlyifthecostscanbereducedsignificantlyinthefutureandwecanmake
fulluseoftheundergroundaquifers.Otherwise,wemustrelyonothertechnologies.
AnotheroptionispowergenerationbyCO2-freesyntheticfuels.Syntheticfuelscanbe
generatedviaelectrolysis,usingrenewableelectricitytosplitwaterintohydrogenand
oxygen.Thegaseoushydrogencanbefurtherprocessedinadditionalsynthesissteps
tothegaseousenergycarriermethaneortoliquidfuelssuchasliquefiednaturalgas
(LNG) and synthetic gasoline, diesel and kerosene. Other methods for producing
hydrogenincludesteamreformingoffossil fuels,andthermochemicalwatersplitting
processesbyhigh-temperaturegas-coolednuclear reactors.Althoughhydrogendoes
notemitCO2duringuse,itemitsCO2duringtheproductionprocess,dependingonthe
primary energy source. If the primary energy is from a non-fossil source, or from a
fossil fuel sourcewith CCS, the hydrogen is said to be produced (and used) by low-
carbonprocesses.
This output paper investigates the economic feasibility of (almost) complete
decarbonization of the power sector, comparing related studies for Japan and
Germany. As shown in the following subsections, there are similarities and
dissimilarities, probably depending on country-specific characteristics. Although we
IntegrationCostsofVariableRenewableEnergySources:Policyrecommendationsfordecision-makers
5
triedtodrawgeneralconclusionsfromthecomparativediscussions,futureelaborate
studies would be needed to make the points even clearer, given the essential
importanceofthisissueonthefeasibilityoflong-termGHGreductiontargets.
2.CaseofJapan:IEEJmodelling
As is thecasewithEuropeanandNorthAmericancountries,manymodellingstudies
havebeenconductedtoestimatequantitativesystemintegrationcostsrelatedtohigh
penetrationof variable renewable energies (VREs) in Japan in recent years10-13). This
section proposes a future projection of the Levelized Costs of Electricity (LCOEs) of
solar PV and wind, which exhibit a different picture from those in other countries,
followed by an estimation of the economics of the power sector under very high
penetrationofVREs,mainlyreferringtoRefs.14-15).
2.1FutureprojectionoftheLCOEsofsolarPVandwindinJapan
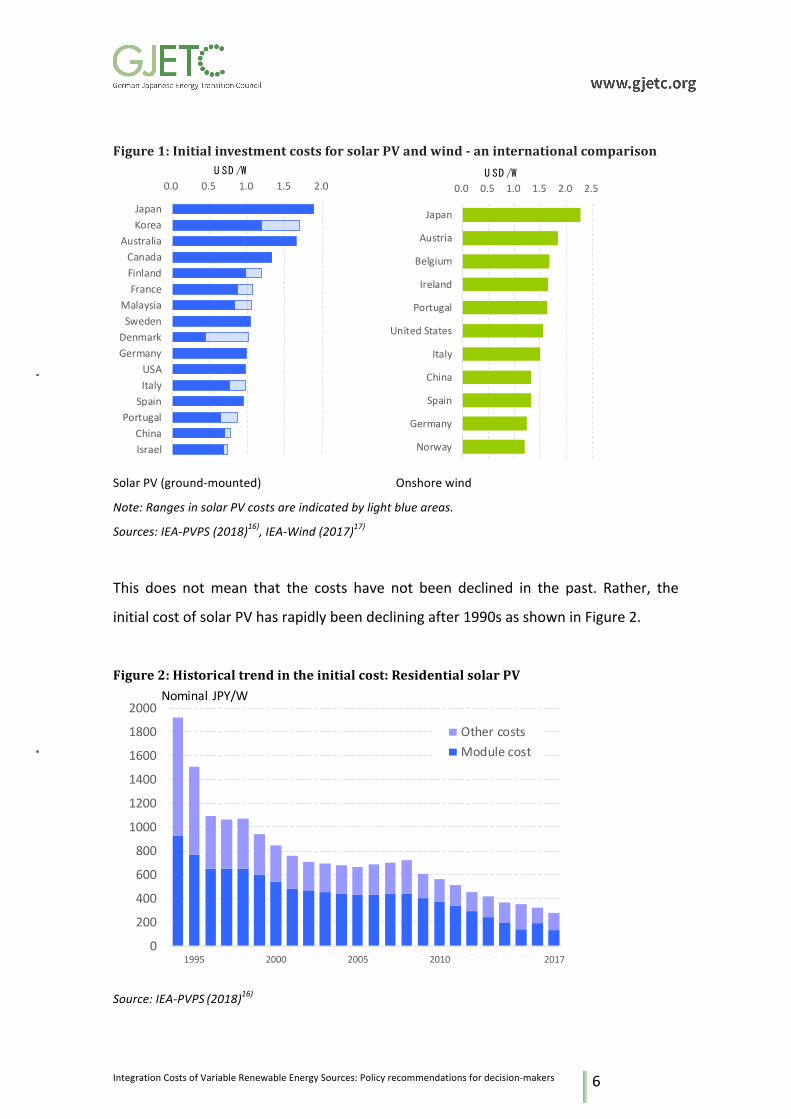
Asof2017,theunitinitialcostofsolarPVisunder1USD/W,andthatofonshorewind
is slightly higher than the same value in many countries in the world. In Japan,
however,theyareconsiderablyhigherthanglobalaverageataround2USD/W(Figure
1).
IntegrationCostsofVariableRenewableEnergySources:Policyrecommendationsfordecision-makers
6
Figure1:InitialinvestmentcostsforsolarPVandwind-aninternationalcomparison
SolarPV(ground-mounted) Onshorewind
Note:RangesinsolarPVcostsareindicatedbylightblueareas.
Sources:IEA-PVPS(2018)16),IEA-Wind(2017)17)
This does notmean that the costs have not been declined in the past. Rather, the
initialcostofsolarPVhasrapidlybeendecliningafter1990sasshowninFigure2.
Figure2:Historicaltrendintheinitialcost:ResidentialsolarPV
Source:IEA-PVPS(2018)16)
0.0 0.5 1.0 1.5 2.0
IsraelChina
PortugalSpainItalyUSA
GermanyDenmarkSwedenMalaysiaFranceFinlandCanada
AustraliaKoreaJapan
U SD /W
0.0 0.5 1.0 1.5 2.0 2.5
Norway
Germany
Spain
China
Italy
UnitedStates
Portugal
Ireland
Belgium
Austria
Japan
U SD /W
0
200
400
600
800
1000
1200
1400
1600
1800
2000
1995 2000 2005 2010 2017
OthercostsModulecost
Nominal JPY/W

IntegrationCostsofVariableRenewableEnergySources:Policyrecommendationsfordecision-makers
7
The “Learning rate” refers to the decline rate of the unit cost of a product,with a
doublingofthecumulativeproduction.InthecaseofsolarPVsystems,theratecanbe
obtainedby linearregressionof therelationshipbetweenthe logarithmof the initial
costdividedbythecapacity,versusthatofthecumulativeinstalledcapacity.Inmany
cases, the initial cost of solar PV can be divided into two parts, i.e. the cost of the
moduleandthatoftheremainingpart,referredtoas“balanceofsystems(BOS)”.For
themodulepart,wecanusethecostdatabyIEA16)toestimatethelearningrateofthe
global average module price, which is found to be around 20%, using the global
cumulative installed solar PV capacity. For BOS,we can obtain the learning rates as
showninTable1,usingthecumulativeinstalledcapacity inthecountry.Asshownin
this table, the learning rate is smaller for residential than for large-scale ground
mountedandissmallerindevelopedcountriesthanindevelopingcountries.Theyare
roughlyatsamelevelsinJapanandinGermany.
Table1:Observedlearningrates(BOS) Residential Large-scale
groundmounted
UnitedStates 12.9% 17.6%
Germany 14.3% 20.9%
UnitedKingdom 12.6% 17.5%
Japan 14.3% 19.8%
China 19.8% 20.4%
Malaysia 16.3% 20.3%
Source:IEEJestimate
Asforwindpower,long-termdataareavailableforonlyafewcountries.Weusethe
learningratesobservedfortheU.S.data,whichstandconsiderablysmallerthansolar
PVat8.2%forturbinesand6.7%fortheremainingpart.
Using these learning rates, as well as an assumption for future installed capacities
showninTable2,wecancalculateexpecteddeclinesinthecostsofonshorewindand
solarPV(residentialand large-scalegroundmounted)asdepicted inFigure3,where

IntegrationCostsofVariableRenewableEnergySources:Policyrecommendationsfordecision-makers
8
Case1assumescostlearningfromthecurrentlevelsinJapan,andCase2assumesthat
thecostsof solarmodulesandwind turbinesare reducedmore rapidly so that they
takeglobalaveragevaluesin2050.Asshowninthesecharts,pasttrendsindicatethat
theLCOEofsolarPVwilldeclinetoaround10JPY/kWh(CaseA),whichisroughlythe
samelevelasthecostsofconventionalpowergeneratingtechnologies,andtoaround
7JPY/kWh(CaseB).TheyalsoimplythattheLCOEofonshorewindwillalsodeclineto
10JPY/kWhby2050.
Weshouldnoteherethatthecostreductiontargetssetbythegovernmentstandat7
JPY/kWhby2025forsolarPV,andat8to9JPY/kWhby2030foronshorewind19),thus
wecouldexpectevenmorerapidcostdeclinesthanthatshowninFigure3.
Table2:VREcapacitiesassumedforprojectingLCOEsin2050 2018 2030 2050
SolarPV 44.6 64.0 130.4
Onshorewind 3.8 9.2 35.0
Unit:GW
Source:IEEJestimate
Figure3:ExplorationofhistoricaltrendsintheinitialcostofsolarPVandonshorewindpowerinJapan
SolarPV Onshorewind
Source:IEEJestimate
0
5
10
15
20
2010 2020 2030 2040 2050
Res id ential(C ase1)
Res id ential(C ase2)
Ground-mounted (Case1)
Ground-mounted (Case2)
2016JPY/kWh
0
5
10
15
20
2010 2020 2030 2040 2050
Onshorewind(Case1)
Onshorewind(Case2)
2016 JPY/kWh
IntegrationCostsofVariableRenewableEnergySources:Policyrecommendationsfordecision-makers
9
2.2Estimationoftheeconomicsofcompletedecarbonizationofthe
powersector–Methodology
(1) Optimal power generation mix (OPGM) model assuming completedecarbonizationofthepowersector
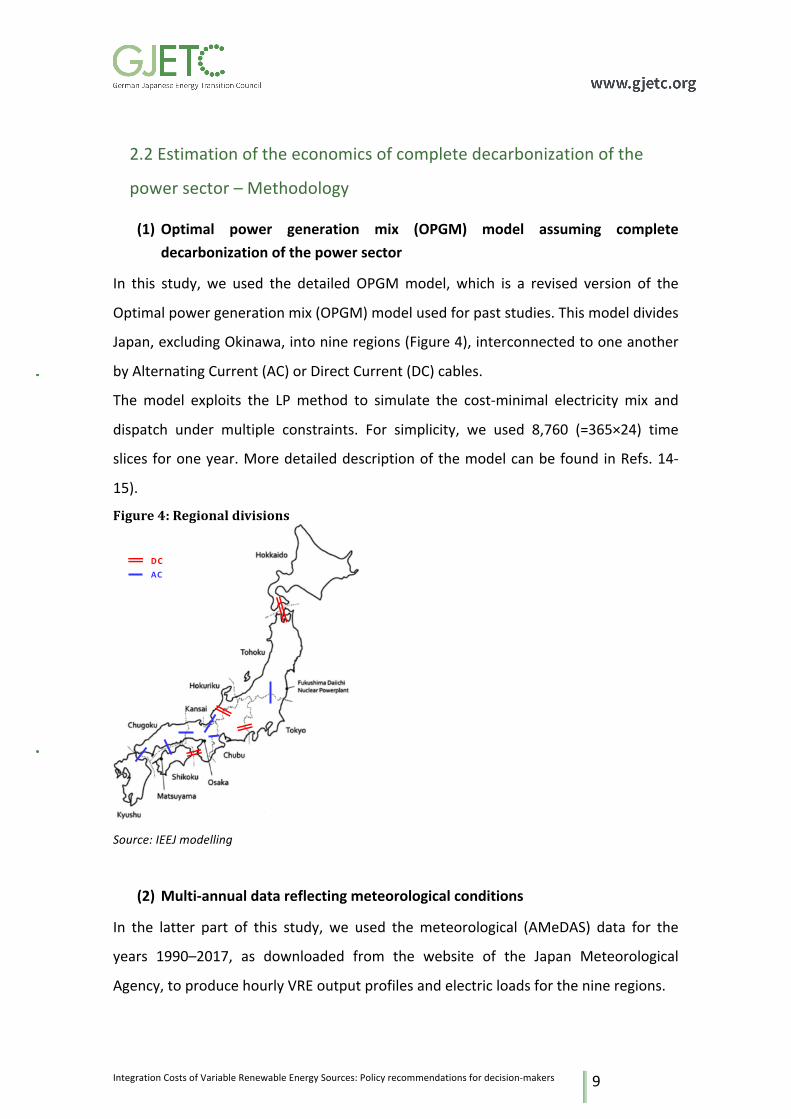
In this study, we used the detailed OPGMmodel, which is a revised version of the
Optimalpowergenerationmix(OPGM)modelusedforpaststudies.Thismodeldivides
Japan,excludingOkinawa,intonineregions(Figure4),interconnectedtooneanother
byAlternatingCurrent(AC)orDirectCurrent(DC)cables.
Themodel exploits the LPmethod to simulate the cost-minimal electricity mix and
dispatch under multiple constraints. For simplicity, we used 8,760 (=365×24) time
slicesforoneyear.MoredetaileddescriptionofthemodelcanbefoundinRefs.14-
15).
Figure4:Regionaldivisions
Source:IEEJmodelling
(2) Multi-annualdatareflectingmeteorologicalconditions
In the latter part of this study, we used themeteorological (AMeDAS) data for the
years 1990–2017, as downloaded from the website of the Japan Meteorological
Agency,toproducehourlyVREoutputprofilesandelectricloadsforthenineregions.
DCAC

IntegrationCostsofVariableRenewableEnergySources:Policyrecommendationsfordecision-makers
10
FortheVREoutput,wefollowedRefs20-21).Wenotethatelectricloadalsochanges
alongwiththechangesinweatherconditions,andthatacertainlevelofcorrelationis
supposed toexistbetweenelectric loadsandVREoutputs. Forexample,ona sunny
summer day in Japan, when the output from solar PV facilities is relatively large,
electricloadalsobecomeslargeduetoaircoolingdemands.Toaddressthisissue,we
used the artificial neural network (ANN)method22) to reproduce electric loads from
meteorologicaldata.
(3) Otherassumptions
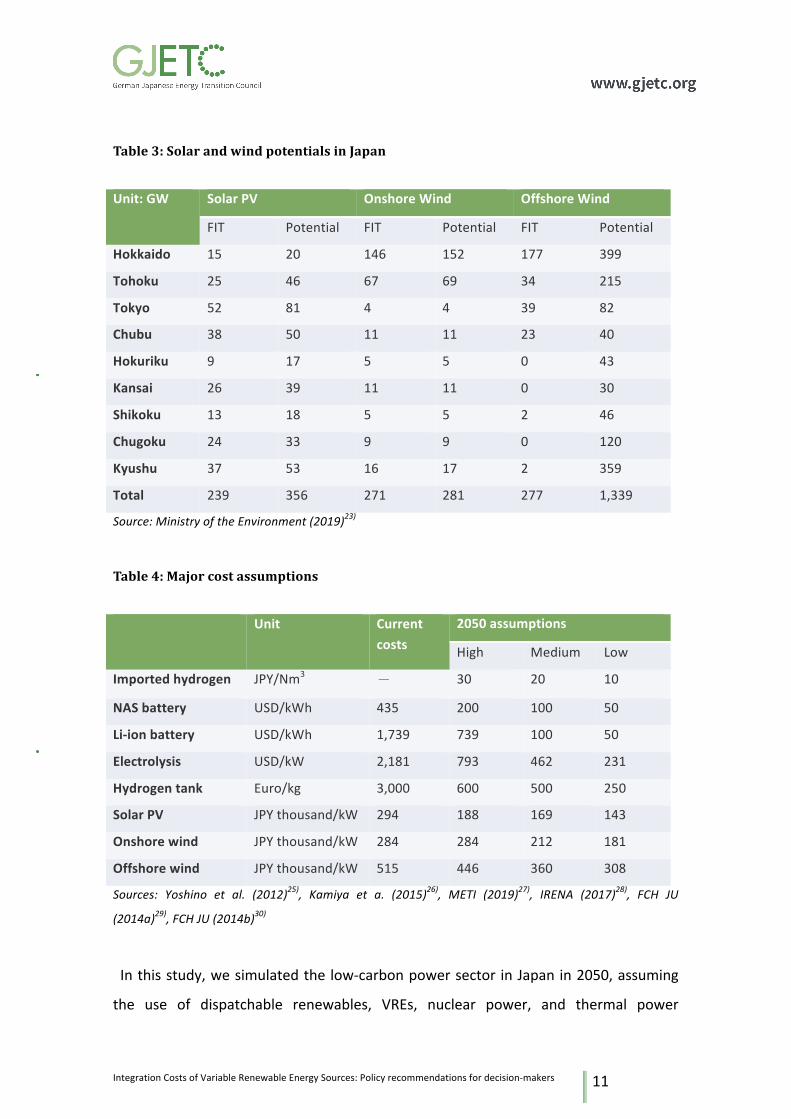
According to an estimation of VRE potentials in Japan by the Ministry of the
Environment23), VRE (solar PV, onshore wind, and offshore wind) can meet all the
electricitydemands in Japan in2050,at least in termsofelectricitygenerated. “FIT”
and “Potential” in Table 3 represents the economic and theoretical potentials,
respectively.Weusedthe“FIT”figuresforthisstudy.
For cost assumptions,we referred to an estimation by the Japanese government24),
assuming that the VRE costs continue to decline until 2050, in line with the trends
shownbythecalculationinthelastchapter.
Othercostassumptionsweremade,asinTable4,basedontheliterature.Wesetthe
high-cost assumptions as those generally expected in the future,while themedium-
cost assumptions reflect the most ambitious targets found in the literature. We
referredtoMETIYoshinoetal.25)andKamiyaetal.26)forthehighassumptionandto
METI27) for the medium assumption on the cost of imported hydrogen. We also
referred to IRENA28) for batteries, to FCH JU29) for electrolysis, and FCH JU30) for
hydrogentanks.NotethattheassumptionsforthecostsofsolarPVandonshorewind
roughlycorrespondwiththeextrapolationofobservedhistorical trends,asshown in
theprevioussubsection.Additionally,wesetlow-costassumptions,justforreference,
whichstandathalfofthemedium-costassumptions.
The pumped hydro storage capacity is assumed at the current level of 163 GWh,
withoutanyadditionalinitialinvestments.
IntegrationCostsofVariableRenewableEnergySources:Policyrecommendationsfordecision-makers
11
Table3:SolarandwindpotentialsinJapan
Unit:GW SolarPV OnshoreWind OffshoreWind
FIT Potential FIT Potential FIT Potential
Hokkaido 15 20 146 152 177 399
Tohoku 25 46 67 69 34 215
Tokyo 52 81 4 4 39 82
Chubu 38 50 11 11 23 40
Hokuriku 9 17 5 5 0 43
Kansai 26 39 11 11 0 30
Shikoku 13 18 5 5 2 46
Chugoku 24 33 9 9 0 120
Kyushu 37 53 16 17 2 359
Total 239 356 271 281 277 1,339
Source:MinistryoftheEnvironment(2019)23)
Table4:Majorcostassumptions
Unit Currentcosts
2050assumptions
High Medium Low
Importedhydrogen JPY/Nm3 - 30 20 10
NASbattery USD/kWh 435 200 100 50
Li-ionbattery USD/kWh 1,739 739 100 50
Electrolysis USD/kW 2,181 793 462 231
Hydrogentank Euro/kg 3,000 600 500 250
SolarPV JPYthousand/kW 294 188 169 143
Onshorewind JPYthousand/kW 284 284 212 181
Offshorewind JPYthousand/kW 515 446 360 308
Sources: Yoshino et al. (2012)25), Kamiya et a. (2015)26), METI (2019)27), IRENA (2017)28), FCH JU
(2014a)29),FCHJU(2014b)30)
Inthisstudy,wesimulatedthelow-carbonpowersector inJapanin2050,assuming
the use of dispatchable renewables, VREs, nuclear power, and thermal power

IntegrationCostsofVariableRenewableEnergySources:Policyrecommendationsfordecision-makers
12
generationby importedhydrogen.Aswehavefixedarelativelysmallupper limit for
nuclearpowergeneratingcapacity,low-carbonthermalpowerandrenewableenergies
competewitheachotherinthepowergenerationmixin2050.Fromthisperspective,
wesetninecostcases,withthreecases(high,medium,andlowcases)forthecostof
importedhydrogen,eachwith three cases for the renewables’ and storage costs, as
showninTable3.Foreachoftheninecasesweassumedtwosubcases,withtheupper
boundsofnuclearpowercapacityat0GWand25GW,respectively.
2.3Calculationresults:integrationcostsunderhighpenetrationofVRE
Figure 5 shows the results of cost optimization for the nine cost cases, with the
maximumnuclearpowercapacityat25GW.Inthecaseswiththelowhydrogencost
assumption, hydrogen-fired power generation accounts for almost all of the power
supply, except for hydro, geothermal, and biomass, whose outputs are fixed in the
model. In other cases, nuclear power is used to the upper limit, whereaswind and
solar PV are used depending on the assumption for the costs of renewables and
storage systems. In theM/Mcase (mediumcostof importedhydrogenandmedium
costsof renewables and storage systems), the shareof intermittent renewables, i.e.
the sum of wind and solar PV, stands at 12%, while the largest penetration of
intermittentrenewables isachieved in theH/Lcaseallowingthesaleofhydrogento
othersectors,wherethesharerisesto44%.

IntegrationCostsofVariableRenewableEnergySources:Policyrecommendationsfordecision-makers
13
Figure 5: Optimal generation mix resulting from modelling nine cost cases forrenewables&batteriesandhydrogen,allowingfor25GWofnuclearenergy
Low,medium,high:costcasesforrenewableenergiesandbatteries
Source:Matsuoetal.(2018)14)
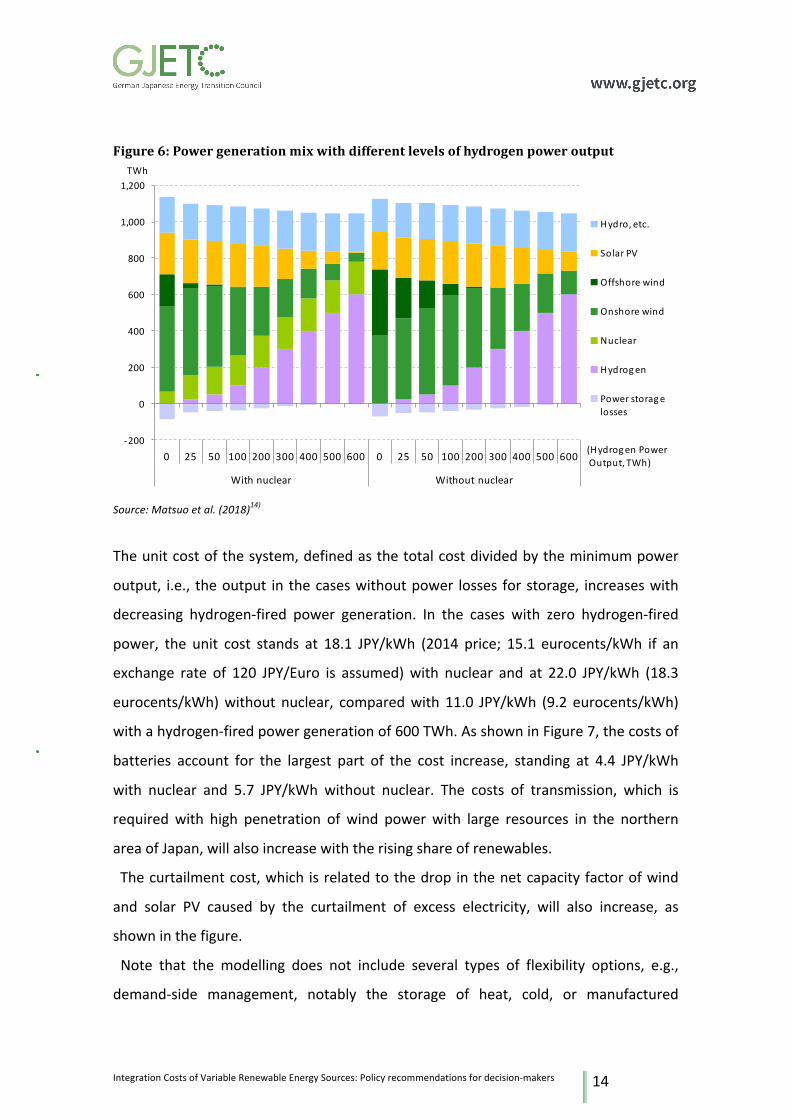
Figures 6 and 7 show the results of the M/M case, without allowing the sale of
hydrogen, with fixed hydrogen-fired power generation from 0 TWh to 600 TWh.
Renewablespenetrationbecomeslargerforsmallerhydrogen-firedpowergeneration.
Offshorewind is introducedmassively,whenhydrogenpowergeneration isassumed
tobebelow25TWhwithnuclearand100TWhwithoutnuclear.Intheextremecase,
withzerohydrogen-firedandzeronuclearpowergeneration,offshorewindaccounts
for34%,whichisalmostthesameastheshareofonshorewind.Inthecaseswithvery
little hydrogen-fired power generation, total power output becomes larger than in
other cases, due to the power losses caused by frequent power charges and
discharges.
-200
0
200
400
600
800
1,000
1,200
Low Medium High Low Medium High Low Medium High
Hydrogen:Low Hydrogen:Medium Hydrogen:High
Hydro,etc.
SolarPV
Offshorewind
Onshorewind
Nuclear
Hydrogen
Powerstoragelosses
TWh
0% 0% 0% 25% 12% 0% 44% PV+wind share32% 21%
IntegrationCostsofVariableRenewableEnergySources:Policyrecommendationsfordecision-makers
14
Figure6:Powergenerationmixwithdifferentlevelsofhydrogenpoweroutput
Source:Matsuoetal.(2018)14)
Theunitcostofthesystem,definedasthetotalcostdividedbytheminimumpower
output, i.e., theoutput in thecaseswithoutpower losses forstorage, increaseswith
decreasing hydrogen-fired power generation. In the cases with zero hydrogen-fired
power, the unit cost stands at 18.1 JPY/kWh (2014 price; 15.1 eurocents/kWh if an
exchange rate of 120 JPY/Euro is assumed)with nuclear and at 22.0 JPY/kWh (18.3
eurocents/kWh)without nuclear, comparedwith 11.0 JPY/kWh (9.2 eurocents/kWh)
withahydrogen-firedpowergenerationof600TWh.AsshowninFigure7,thecostsof
batteries account for the largest part of the cost increase, standing at 4.4 JPY/kWh
with nuclear and 5.7 JPY/kWh without nuclear. The costs of transmission, which is
requiredwith high penetration of wind powerwith large resources in the northern
areaofJapan,willalsoincreasewiththerisingshareofrenewables.
Thecurtailmentcost,whichisrelatedtothedropinthenetcapacityfactorofwind
and solar PV caused by the curtailment of excess electricity, will also increase, as
showninthefigure.
Note that the modelling does not include several types of flexibility options, e.g.,
demand-side management, notably the storage of heat, cold, or manufactured
-200
0
200
400
600
800
1,000
1,200
0 25 50 100 200 300 400 500 600 0 25 50 100 200 300 400 500 600
Withnuclear Withoutnuclear
Hydro,etc.
SolarPV
Offshorewind
Onshorewind
Nuclear
Hydrogen
Powerstoragelosses
TWh
(Hydrogen PowerOutput,TWh)

IntegrationCostsofVariableRenewableEnergySources:Policyrecommendationsfordecision-makers
15
products,batteryelectricvehicleswithvehicle-to-gridtechnology,andaflexibleuseof
biomasspowergenerationfacilities,becausepreliminaryanalyseshadsuggestedthat
theseoptionswouldexertonly limited influenceon theresultsof thecalculations in
theJapanesecontext14).Nonetheless,explicitconsiderationoftheseoptionscouldbe
usefulforfuturestudies..Notealsothatthe“hydrogenpoweroutput”includesthatof
“greenhydrogen”,thathasbeenproducedfromexcesselectricityandhasbeenstored
in hydrogen tanks. Thus the “0 TWh” case in this chart actually prohibits theuseof
hydrogenstoragesystems.
Figure7:Changeintheunitsystemcostanditscomponents(M/Mcase)
Source:Matsuoetal.(2018)14)
Figure8showstheunitsystemcostfortheM/McaseandtheH/M,L/M,M/H,and
M/Lcases.Inthecasewithnuclear,theunitcostwithzerohydrogenis14.9JPY/kWh
forM/L, 18.1 JPY/kWh forM/M, and 24.5 JPY/kWh forM/H, respectively.Without
nuclear,theunitcostsriseto17.4JPY/kWh,22.0JPY/kWh,and29.3JPY/kWhforM/L,
M/M,andM/H,respectively,respectively.
Inthecaseswiththehighhydrogencosts(H/M),theunitsystemcostisthesameas
inthemediumcostcase(M/M)withzerohydrogenpowergeneration;however,asthe
0
5
10
15
20
0 25 50 100 200 300 400 500 600 0 25 50 100 200 300 400 500 600
W ithnuclear W ithoutnuclear
Transm ission
Storage
system s
Storage
losses
C urtailm ent
LC O E
2014 JPY/kWh
(Hydrogen powergeneratinon, TWh) (Hydrogen powergeneratinon, TWh)

IntegrationCostsofVariableRenewableEnergySources:Policyrecommendationsfordecision-makers
16
hydrogen-firedpowergenerationincreasesthegapbetweenH/MandM/Mincreases,
showingaconvexcurve.Theminimalpointof this curvecorresponds to theoptimal
solutionshowninFigure5.Ifhydrogen-firedpowergenerationissetat600TWh,with
nuclearat25GW,theunitcostsare8.2JPY/kWh,11.0JPY/kWh,and13.8JPY/kWhfor
theL/M,M/M,andH/Mcases,respectively.
These results showthat the total cost risesvery sharplywithhydrogen-firedpower
generationbelow100TWh.Thissuggeststheextremedifficultyofsupplyingelectricity
onlywithnon-flexiblepowersources,suchasnuclearandrenewables,even in2050,
whenJapanaimstoachievezeroemissionsinthepowersector.Ontheotherhand,in
thecasewithnuclear,forexample,theresultsshowmoderatechangesintheunitcost
with hydrogen-fired power generation larger than 200 TWh, indicating that a
considerably high share of intermittent renewables could be economically feasible
undertheconditionthattheircostswillbereducedgreatly,asassumedinthisstudy.
Another observation is that, with zero hydrogen, the difference between the unit
costs with and without nuclear amounts to 2.5 JPY/kWh, 3.9 JPY/kWh, and 4.8
JPY/kWh, for theM/L,M/M, andM/H cases, respectively. This implies that nuclear
power is effective in suppressing the surge in the total system costwith very small
flexiblepowergeneration.
Figure8:Unitpowergenerationcostfordifferentcostcases
Withnuclear Withoutnuclear
Source:Matsuoetal.(2018)14)
0
5
10
15
20
25
30
0 100 200 300 400 500 600
JPY/kWh
Hydrogen powergeneration, TWh
0
5
10
15
20
25
30
0 100 200 300 400 500 600
JPY/kWh
Hydrogen powergeneartion, TWh

IntegrationCostsofVariableRenewableEnergySources:Policyrecommendationsfordecision-makers
17
Aswindandsolaroutputareweather-dependent,theytendtoproduceelectricityat
thesametime.Theconsequencesofthisstrongauto-correlationofpoweroutputare
referredtoasthe“cannibalizationeffect”31-32).Theverylow(orzero)priceswhenthe
outputofwindandsolarpower is large leadtodecliningmarketvalueofVREpower
generationwithhighpenetrations.Ref.31)arguedthatthesubsidytoVREmaynever
end, as the value of the energy produced may decrease faster than the cost as
renewablecapacityincreases.
Figure9showsthevaluefactor,definedastheweightedaverageoftheshadowprice
with regard toPV/windoutput,normalizedby theaverage shadowprice,depending
onVRE sharesof totalpowergeneration.Wecanobserve significantdeclines in the
value factors, which could make additional deployment of VRE facilities more and
moredifficultwithincreasingsharesofVREs.
Figure9:"Cannibalization"effect
Sources:IEEJmodelling
0
0.2
0.4
0.6
0.8
1
1.2
0% 20% 40% 60%
Valuefactor
SolarPV Wind
ShareofPV/windpowergeneration
IntegrationCostsofVariableRenewableEnergySources:Policyrecommendationsfordecision-makers
18
2.4Effectsofchangesinmeteorologicalconditions
Weusedthe28meteorologicalconditionscorrespondingtothe1990–2017dataand
performedLPsimulationsfortheM/Mcase(Figure10).
Case A assumes use of batteries and pumped hydro power generation for power
storage,whileCaseB assumesonlyhydrogen storage systems, inwhichhydrogen is
produced by excess electricity, stored in tanks, and is used for power generation
during periods with small VRE output. Note that, as the assumed fixed capacity of
pumped hydro storage is rather small at 163 GWh, Case A actually represents the
expandeduseof batteries.Alsonote that CaseB,which assumesnopumpedhydro
systems,shouldnotberegardedasarealisticcase,giventhatpumpedhydrofacilities
andbatterieshavealreadybeendeployedtoacertainextentinJapan.
CasesC-0andC-Nx(x=0,100,and200)utilizebatteriesandpumpedhydrofacilities,
in addition to hydrogen storage systems. Cases C-Nx set the upper limit of nuclear
powergeneratingcapacityat25GW,whichisequivalenttothesumofthecapacities
of the existing plants that started operation after 1990 and of the three plants
currentlyunderconstruction.Thesecasesalsoassumetheuseof importedhydrogen
powergenerationatxTWh(fixed).Asthetotalannualelectricitydemandisassumed
tobeapproximately1,000TWh,whichvariesslightlydependingonthemeteorological
conditions, Case C-N200 assumes that thermal power generation accounts for
approximately 20% of the power generation mix. Although the calculations in the
previous subsection also assumed the use of hydrogen storage systems, the 0 TWh
cases in Figures 7 and 8 correspond to Case A in Figure 10, because they actually
prohibittheuseofhydrogenstoragebysettingthetotalhydrogenpowergeneration
at0TWh,asdescribedabove.
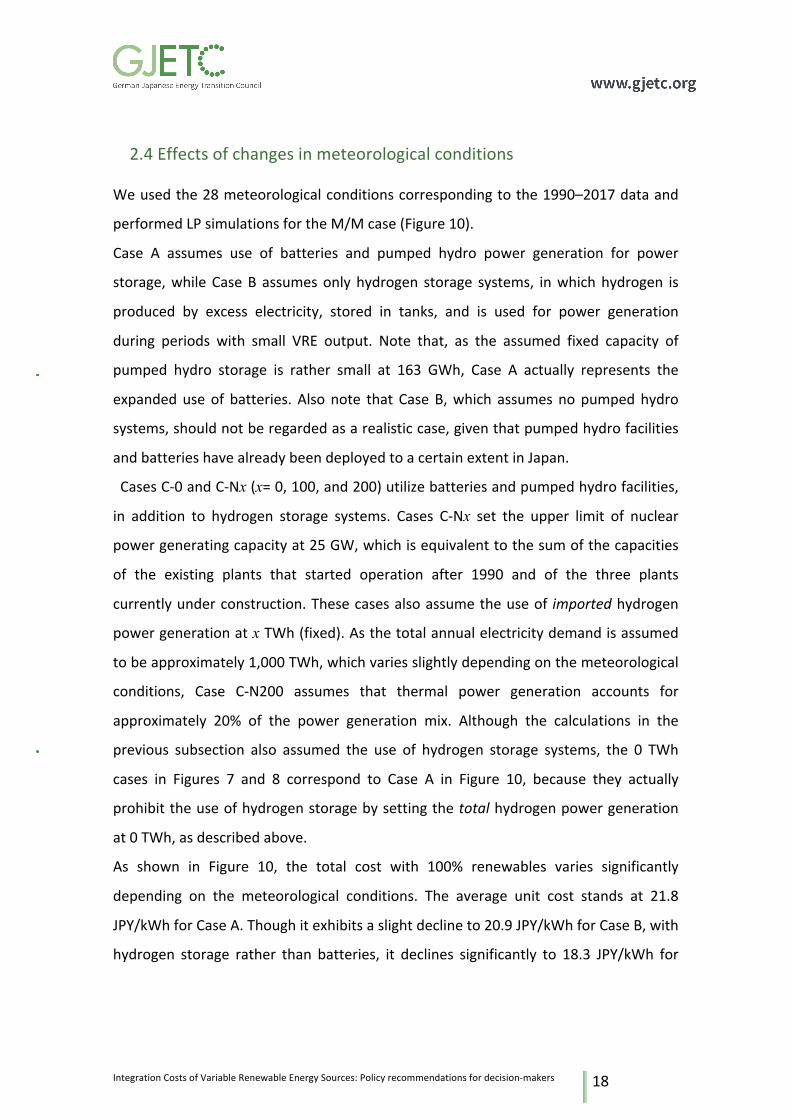
As shown in Figure 10, the total cost with 100% renewables varies significantly
depending on the meteorological conditions. The average unit cost stands at 21.8
JPY/kWhforCaseA.Thoughitexhibitsaslightdeclineto20.9JPY/kWhforCaseB,with
hydrogen storage rather than batteries, it declines significantly to 18.3 JPY/kWh for
IntegrationCostsofVariableRenewableEnergySources:Policyrecommendationsfordecision-makers
19
CaseC-0,whichassumesbothhydrogenandbatteries.Thestandarddeviation is1.2
JPY/kWh,0.7JPY/kWh,and0.6JPY/kWh,forCasesA,B,andC-0,respectively.
The unit cost declines further when nuclear and/or imported hydrogen power
generationareavailable,standingat15.6JPY/kWh,12.8JPY/kWh,and11.8JPY/kWh
forCasesC-N0,C-N100,andC-N200,respectively.Thestandarddeviationalsodeclines
to 0.38 JPY/kWh, 0.10 JPY/kWh, and 0.07 JPY/kWh on average, respectively. As
expected,differentmeteorologicalconditionsresult insignificantchanges in theunit
cost,particularlyforthecaseswith100%renewablepenetration.
Figure10:Unitsystemcostfordifferentmeteorologicalconditions
Source:Matsuoetal.(2020)15)
Figure11presents thestoredenergy inCaseA for the28meteorologicalconditions.
Although maximum storage takes place on different days depending on the
meteorological conditions, we can say roughly that windless and sunless periods
appearinsummer(AugusttoSeptember)andwinter(DecembertoFebruary).Tomeet
the storage requirements during these periods, large amounts of energy are stored
duringJulytoAugustandNovembertoJanuary.
0
5
10
15
20
25
1990 1995 2000 2005 2010 2015
A B C- 0
C-N0 C-N100 C-N200
2014JPYkWh

IntegrationCostsofVariableRenewableEnergySources:Policyrecommendationsfordecision-makers
20
Figure11:Totalstoredpowerforthe28meteorologicalconditions(CaseA)
Source:Matsuoetal.(2020)15)
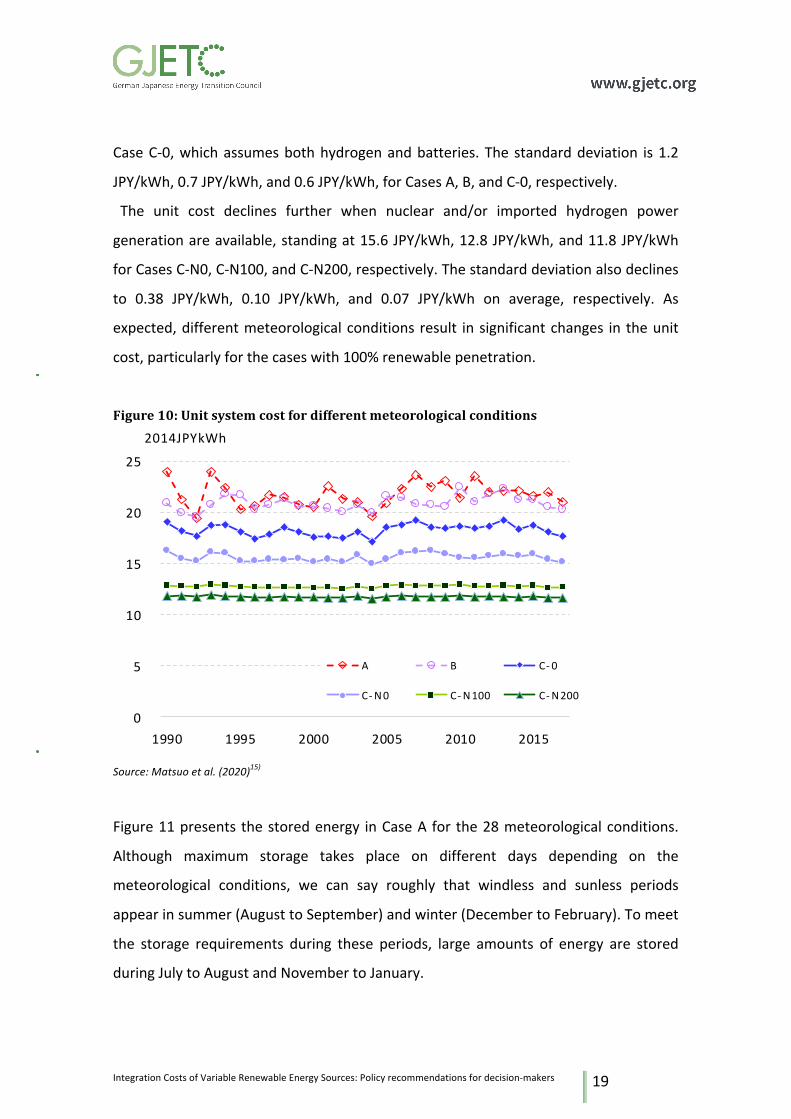
To illustrate what is happening on the days with large stored electricity, Figure 12
showsthepowerdemandandsupplyfromSep.1to15(CaseA,2000data,totalofthe
nineregions).WecanseethatthewindpoweroutputisextremelysmallfromSep.6
to14andthatpowerdischarge,showninpinkinthechart,accountsforalargepartof
powersupply.Thesesituations imply that the totalamountof theresidual load, i.e.,
theelectricitydemandminusthepoweroutputduringwindlessandsunlessperiodsin
which VRE power output remains very small, determines the requirement of power
storage systems. Although this is true both for batteries and for hydrogen storage
systems,thelatterrequirelargercapacitiesandlongerperiodsforbuildingupstored
energy,becauseofthelowercycleefficiency.Asdescribedlater,wecanverifythatthis
“windlessandsunless”factoractuallydeterminesthestoragerequirementsforallthe
meteorologicalconditions.These“windlessandsunless”periodsarealsoreferredtoas
“dark doldrums,” which represent one of the largest risks of electricity supply
disruptionunderveryhighpenetrationofVREs.
0
1,000
2,000
3,000
4,000
5,000
6,000
Jan Feb Mar Apr May Jun Jul Aug Sep Oct Nov Dec
GWh
IntegrationCostsofVariableRenewableEnergySources:Policyrecommendationsfordecision-makers
21
Figure12:ElectricitydemandandsupplyduringSep.1to15(CaseA,2000data,totalofthenineregions)
Source:Matsuoetal.(2020)15)
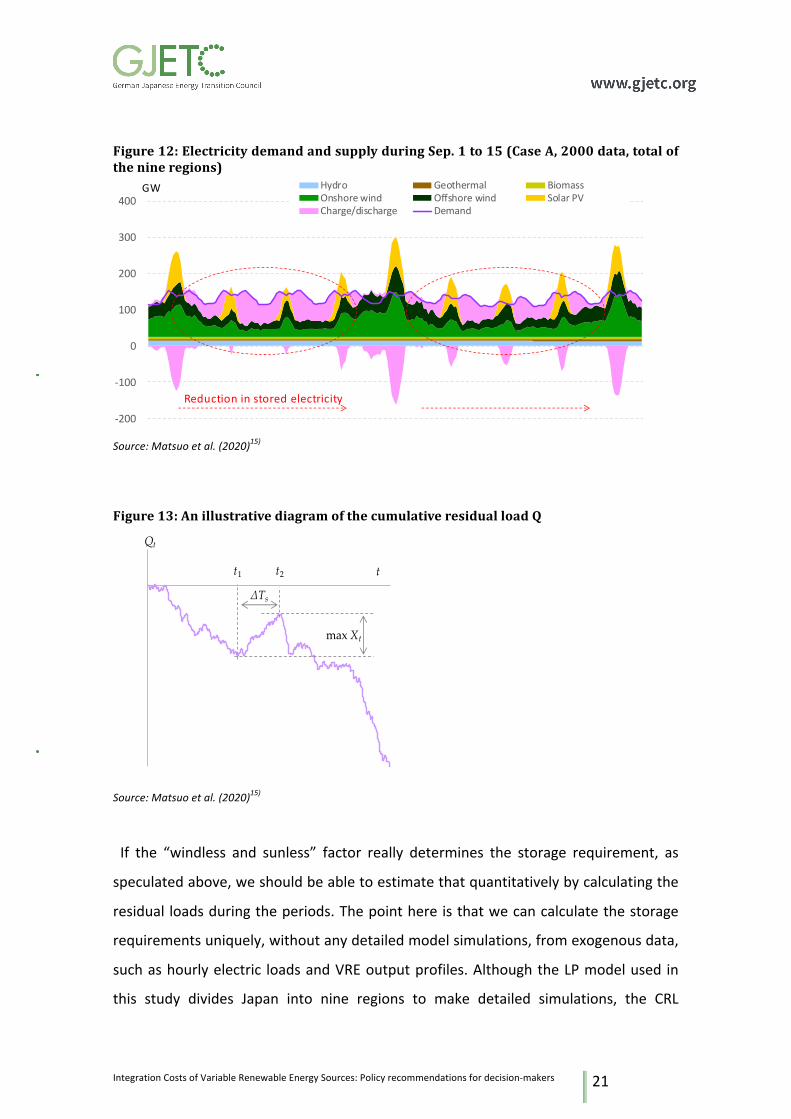
Figure13:AnillustrativediagramofthecumulativeresidualloadQ
Source:Matsuoetal.(2020)15)
If the “windless and sunless” factor really determines the storage requirement, as
speculatedabove,weshouldbeabletoestimatethatquantitativelybycalculatingthe
residual loadsduringtheperiods.Thepointhereisthatwecancalculatethestorage
requirementsuniquely,withoutanydetailedmodelsimulations,fromexogenousdata,
suchashourlyelectric loadsandVREoutputprofiles.AlthoughtheLPmodelused in
this study divides Japan into nine regions to make detailed simulations, the CRL
-200
-100
0
100
200
300
400Hydro Geothermal BiomassOnshorewind Offshorewind SolarPVCharge/discharge Demand
GW
Reductioninstoredelectricity
-25000
-20000
-15000
-10000
-5000
0
5000Qt
tt1 t2
max Xt
ΔTs

IntegrationCostsofVariableRenewableEnergySources:Policyrecommendationsfordecision-makers
22
method described here uses only the total data of the nine regions and is able to
simulate the changes in power demand and supply situation with high VRE
penetrationsunderdifferentmeteorologicalconditions.
Wedenoteelectricitydemand(totalofnineregions)attimet (t∈[1,8760])asDt,VRE
outputattasFt,andotherpoweroutputfromhydroandothersourcesasattHt.The
residualload Rtiscalculatedby
𝑅! = 𝐷! − 𝐹! − 𝐻! (1)
andthesituation-correctedresidualloadR’t isdefinedas
𝑅′! =
𝑅!𝑒!
𝑖𝑓 𝑅! ≥ 0
𝑒! 𝑅! 𝑖𝑓 𝑅! < 0
(2)
where eC and eD denote the efficiencies during the processes of power charge and
discharge,respectively.Inthisstudy,weassumeacycleefficiencyof0.85foreCand1
for eD for batteries. For hydrogen storage systems, we assume the efficiency of
electrolysis at 0.9 and that of hydrogen thermal power generation at 0.57 (gross
calorific value) for eC and eD, respectively. These different efficiencies define the
differentrolesofthepowerstoragesystems,asdescribedintheprevioussubsection.
ThecumulativecorrectedresidualloadQtisdefinedas
𝑄! = 𝑅′!
!
!!!
(3)
Figure13illustratestherelationshipbetweenQtandt.Asourcalculationsinthisstudy
featureveryhighVREpenetration,R’tisusuallynegativeandQtdecreasesovertime.
However, during the windless and sunless period, R’t takes positive values, andQt

IntegrationCostsofVariableRenewableEnergySources:Policyrecommendationsfordecision-makers
23
continues to increase temporarily. The total amount of this temporary increase
correspondstothestoragerequirement.
LetXtbethelocalcumulativestoragerequirement,i.e.,
𝑋! = 𝑄! −min!!!𝑄! (4)
and themaximum value ofXt is the requirement of storage systems. Thus, we can
calculatetherequiredstoragecapacityLintheunitofGWhby
𝐿 = max!𝑋! ÷ 𝑟 ÷ 𝑙! (5)
where lS is the load factorof thestoragesystems,andr is theauto-discharge factor
relatedtothetimespanfromchargetodischarge.Wecanestimaterapproximately
usingΔTs in Figure 13, which is the distance between the time t1, whenQt takes a
minimalvalue,andt2,whenXttakesthemaximumvalue:
𝑟 = 𝑒𝑥𝑝 −𝑟!∆𝑇! , ∆𝑇! = 𝑡! − 𝑡! (6)
whererhdenotestheself-dischargerateperhour.
Figure14:Capacityofstoragesystems:ComparisonoftheCRLandtheLPresults
CaseA–Batteries CaseB–HydrogenStorage
Source:Matsuoetal.(2020)15)
100
1,000
10,000
100 1,000 10,000
Simpleestim
ationresultsbyCR
L,GWh
A A-N0
A-N100 A-N200
A-N300 A-N400
LPsimulationresults,GWh
10
100
1,000
10,000
100,000
10 100 1,000 10,000 100,000
Simpleestim
ationresultsbyCR
L,GWh
B B-N0
B-N100 B-N200
B-N300 B-N400
LPsimulationresults,GWh
IntegrationCostsofVariableRenewableEnergySources:Policyrecommendationsfordecision-makers
24
Figure 14 shows the capacity of the storage systems calculated by Eq. 5, plotted
against the results of the LP model calculations for Cases A, B, A-Nx, and B-Nx,
assumingalsonuclear (25GW)andthermalpowergeneration(xTWh).Notethat, in
theLPsimulationsforCaseA,theminimumcapacityofstoragesystemsissetat163
GWh,correspondingtotheexistingpumpedhydrofacilities.Themuchlargerstorage
capacitiesforCaseBthanforCaseAreflectthelargecostdifferencesintheassumed
typesofstoragefacilities(i.e.hydrogentanksandbatteries).Intermsofthecostsfor
providing these facilities, thebothcasesare roughlycomparable. Inaddition,due to
theefficiencies for charginganddischargingassumed,hydrogen storagewill anyway
need higher capacities for the same effect as batteries, by a factor of 1.65. These
charts show clearly that the “windless and sunless” factor determines the storage
requirementsnotonlyin100%renewablecasesbutalsoinanycasewithnuclearand
thermalpowergeneration.
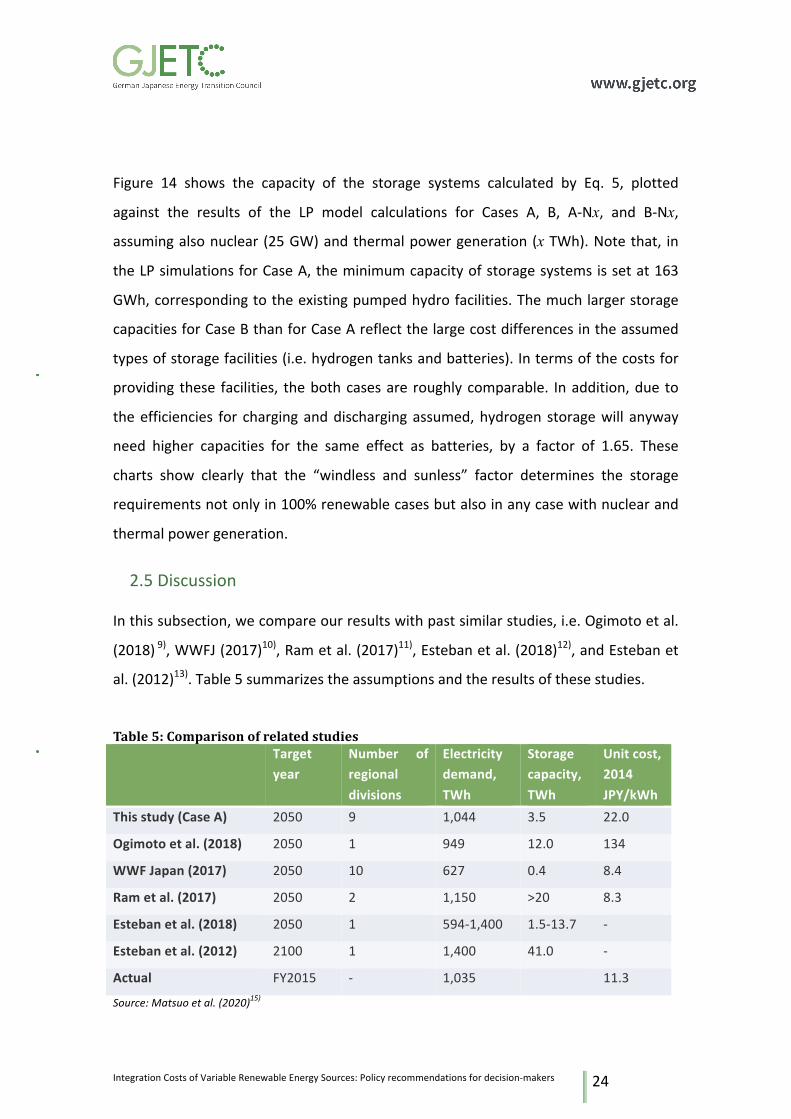
2.5Discussion
Inthissubsection,wecompareourresultswithpastsimilarstudies,i.e.Ogimotoetal.
(2018)9),WWFJ(2017)10),Rametal.(2017)11),Estebanetal.(2018)12),andEstebanet
al.(2012)13).Table5summarizestheassumptionsandtheresultsofthesestudies.
Table5:Comparisonofrelatedstudies Target
yearNumber ofregionaldivisions
Electricitydemand,TWh
Storagecapacity,TWh
Unitcost,2014JPY/kWh
Thisstudy(CaseA) 2050 9 1,044 3.5 22.0
Ogimotoetal.(2018) 2050 1 949 12.0 134
WWFJapan(2017) 2050 10 627 0.4 8.4
Rametal.(2017) 2050 2 1,150 >20 8.3
Estebanetal.(2018) 2050 1 594-1,400 1.5-13.7 -
Estebanetal.(2012) 2100 1 1,400 41.0 -
Actual FY2015 - 1,035 11.3
Source:Matsuoetal.(2020)15)

IntegrationCostsofVariableRenewableEnergySources:Policyrecommendationsfordecision-makers
25
As shown in this table, the required storage capacity and the unit cost differ
significantly across studies. As for the storage capacity, the result of Ogimoto et al.
(2018) ismuch largerthanthisstudy,whereasthatofWWFJ(2017) ismuchsmaller.
WeshouldnoteherethatOgimotoetal.(2018)estimatethestoragecapacityandunit
cost for a “100% VRE” case, rather than a 100% renewables case, which can be a
reason for the large storage capacity. The small storage capacity by WWFJ (2017)
seemstoresultfromthefactthatthisstudydoesnotusehourlydemandandsupply
data throughout a year, but exploits statistical methods for the simulation. For
Ogimotoetal. (2018)andWWFJ (2017), thevery largedifference in theunit system
costapparentlyresultfromthedifferenceintherequiredstoragecapacity.
Rametal.(2017)assumemethanestorage,ratherthanbatteries,whichiscomparable
withCaseC-0thatassumeshydrogenstorage.Wecanseethatthestoragecapacityby
Ram et al. (2017) (20 TWh) lies within the range of Case C-0 (11.2-25.4 TWh). The
reason of the small unit cost by Ram et al. (2017) (7.4 JPY/kWh) is unknown. One
reasoncouldbethenumberofregionaldivisions;asRametal.(2017)divideJapaninto
two regionswith50HZand60HZACpower frequencies,Hokkaido island, the largest
VREproducer, and Tokyo, the largest energy consumer, are assumed to exist in the
same node. This may result in underestimation of the required capacity of
transmissionlines.ItmayalsobeduetolowercostassumptionsforsolarPVandwind.
More detailed discussion of the reasons behind different unit costs is considered
importantfuturework.
Estebanetal. (2018),thatassumebatteriesforpowerstorage,concludewiderrange
ofthestoragecapacity,becauseofawiderrangeofthetotalelectricitydemand.The
grounds for the large storage capacity by Esteban et al. (2012) are unknown. The
results shown in Table 5 suggest at the same time that the results of thiswork are
roughlyconsistentwiththosefoundintheliterature,andthatfurtherdetailedstudies
arerequiredastheunitcostsvarysignificantlydependingonvariousassumptions.
IntegrationCostsofVariableRenewableEnergySources:Policyrecommendationsfordecision-makers
26
3.CaseofGermany:ReviewofThreeScenarioModelling
Studies
Germany’s “Climate Action Plan for 2050” calls for the country to be extensively
greenhouse-gas (GHG) neutral by 2050. This section will highlight three studies by
GermaninstitutionsthatassessedthefeasibilityofachievingthetargettoreduceGHG
emissionsby80%to95%by2050fromthe1990baseline33-35).TheGermanAcademies
ofSciences'joint"EnergySystemsoftheFuture"initiative,theFederationofGerman
Industries and theGermanEnergyAgency conclude that the scenarios theypropose
aretechnicallyfeasiblewithinthetimeconstraintofyear2050butrequireimmediate
policyaction.Tomeettheseambitioustargets,Germanywillhavetorapidlyscaleup
VREcapacityandmakesignificantchangestotheexistingpowersystem.Suchchanges
are challenging and require policy and structural reforms but will also present
opportunities for employment, trade, and technological development. The studies
estimatethatthecostsassociatedwiththechangestotheenergysystemwillamount
toapproximatelyonetotwopercentofGermanGDPandhaveminimalimpactonthe
economy;however,thelongerthegovernmentwaitstoact,thehigherthecostswill
be.
3.1ComparisonofBaselineStudies
(1) "EnergySystemsoftheFuture"Initiative
The"EnergySystemsoftheFuture"(ESYS)WorkingGroupundertheGermanAcademy
ofSciencesdevelopedastudytodeterminehowtoacceleratetheenergytransitionin
Germany and achieve a “climate-friendly” energy supply by the year 2050. The
researchers used both quantitative and qualitative evaluation to identify the
challenges of the current approach to the energy transition, including not only
technological limitations, but also economic and social barriers. This study provided
possibledevelopmentpaths, and the key technologies, projected costs, andpolitical
actionnecessarytoachievethem.

IntegrationCostsofVariableRenewableEnergySources:Policyrecommendationsfordecision-makers
27
The timeframe of the study spanned June 2015 through November 2017 and
employedexpertdiscussions,scenariocomparisons,andmodelcalculationsusingthe
simulationandoptimizationmodelREMod-DdevelopedbytheFraunhoferInstitutefor
SolarEnergySystems.Theyusedareferencescenarioandsevenmodelcalculationsto
examine what impact the respective GHG emissions reductions would have on the
overall energy system. The first fourmodel calculations set emissions reductions to
60%,75%,85%,and90%respectivelyby2050.Thesecondroundofmodelcalculations
analyzed the influenceofhydrogen, synthetic combustibles and fuels, and increased
energy savingmeasureseachwithinan85%emission reduction scenario.Unlike the
two subsequent studies, ESYS rules out the import of synthetic energy carriers and
insteadproposeshigherpenetrationofVREanddomesticproduction.
(2)FederationofGermanIndustries
The Federation of German Industries’ (BDI) study addressed what conditions are
necessary toachieveGerman’s climate targetof80%to95%emissions reductionby
the year 2050. The research identifies the existing shortfalls of current policies and
providescost-efficientpathsformeetingtherespectivegoals.Thepowersectorisone
of five areas where they focus attention, and where they identify the emerging
technologiesthathavenotyetreachedmaturity,butwillplayanimportantroleinthe
futureofclimateprotection,suchascarbon-captureutilizationandstorage,hydrogen,
and power-to-X. These new technologies, coupled with the expansion of solar and
windpower,willprovideGermanyincreasedopportunitiesfortradeanddevelopment.
The BDI study lasted from January 2017 until January 2018 and conducted scenario
and reference analysis based on a bottom-up process. Using the Prognos energy
systemandelectricitymarketmodels,theresearchersanalyzedareferencescenario,
80%and95%GHGemissionreductionscenariosbasedonnationalinitiatives,and80%
and 95% GHG emission reduction scenarios based on global climate protection
initiatives. The comparison between paths under national initiatives and within a
global context allowed the researchers to identify the challenges if Germany

IntegrationCostsofVariableRenewableEnergySources:Policyrecommendationsfordecision-makers
28
significantlyincreasesambitionforclimateprotectionandothernationsdonotfollow
suit.
(3)GermanEnergyAgency
ThestudybytheGermanEnergyAgency(dena)developedaframeworkforrealizinga
sustainable energy system in Germany by the year 2050. The final report includes
realistic solutions and investment recommendations for the German government to
integrate the energy system in an efficient and cost-effective way to meet the
challengingtimerestraints.Thisresearchprovidespathwaysfortheenergytransition
in the context of macroeconomic trends and determines what influence the
developmentandadoptionofnewtechnologieswillhaveontheGermaneconomyand
thesecurityofenergysupply.
ThedenastudyranfromJanuary2017throughJune2018,andthereforeisthemost
recent of the three studies included in this section. The research used the ER&S
DIMENSION+ energymarketmodel to run five scenarios. In addition to a reference
scenariobasedoncurrentenergypolicies,thestudyincludedelectrificationscenarios
with80%and95%GHGemissionreductiontargets,andtwotechnologymixscenarios
with 80% and 95% GHG emission reduction targets. The differentiation between a
pathway with higher rates of electrification verses a broader mix of technologies
allowed the researchers to make cost comparisons and determine the most
economicallyefficientwayforward.
3.2Results:RecommendationstomeetGermany’sclimatetargets
Although the studies discussed above use differentmodeling approaches to analyze
potentialpathsforGermany’senergytransition,theydrawsimilarconclusionsinmany
respects.Thestudiesagreethatinthereferencescenario,Germanywillfailtomeetits
climatetargetsby2050,andasexplained intheBDIstudy,will fallshortby19to34
percentage points. According to the dena study, GHG emissions must decrease by
about19milliontonsGHGCO2eq.or24milliontCO2eq.peryeartomeetthe80%
and 95% climate targets respectively. The 95% climate target requires zero carbon

IntegrationCostsofVariableRenewableEnergySources:Policyrecommendationsfordecision-makers
29
emissionsfromthetransportation,building,andpowersectorsby2050.Therefore,the
governmentmusttakesubstantialactioninatimelymannertoaddressthisgap.Policy
control is crucial to achieving these targets because it will provide a regulatory
framework and increased certainty for investment cycles. The common proposed
approaches in thethreestudies identify twoverydifferentpaths; the95%emissions
reductionpathisnotmerelyanextensionofthe80%emissionsreductionpath.Each
path requires a dedicated effort to the investment and prioritization of specific
technologies that will replace conventional fuels. The following sections discuss the
recommendations and conclusions of these three studies to promote the energy
transitionaway from fossil fuels and towards renewableenergy in thepower sector
andtheassociatedcosttoachievetheclimatetargets.
Figure15:GHGemissionsbysectorunder95%climatetarget(dena)
Source:dena(2018)35)

IntegrationCostsofVariableRenewableEnergySources:Policyrecommendationsfordecision-makers
30
Figure16:GHGemissionsbysectorunder80%climatetarget(dena)
Source:dena(2018)35)
(1)Expandingrenewableenergycapacityandintegrationcosts
The expansion of VRE technology is critical to reaching a nearly emissions-neutral
power energy system by 2050. The current rate of expansion of wind and solar in
Germanyisinsufficienttoreachthistargetandmustrapidlyaccelerate.Attheendof
2018, Germany had 105 GW of wind and solar photovoltaic capacity, with plans to
increaseata rateofabout4GWperyearper theRenewableEnergySourcesActof
2017. The three studies present development approaches that include expansion of
windandsolarphotovoltaiccapacityrangingfrom249to601GW,dependingonthe
scenario,whichmeansthestatutoryexpansioncorridormustincreasetoatleast6GW
peryear.Theresultsofthesestudiesvaryduetothedifferingassumptionsaboutthe
amountofelectrification,useofrenewablesyntheticenergyfuels,andprojectionsfor
technologyadvancement.However,theyallclearlydemonstratethenecessityforVRE
asacentralpillarofthefutureenergysystem.
IntegrationCostsofVariableRenewableEnergySources:Policyrecommendationsfordecision-makers
31
Figure17:ExpectedwindandsolarPVcapacities
Source:EnergySystemsoftheFutureetal.(2019)33)
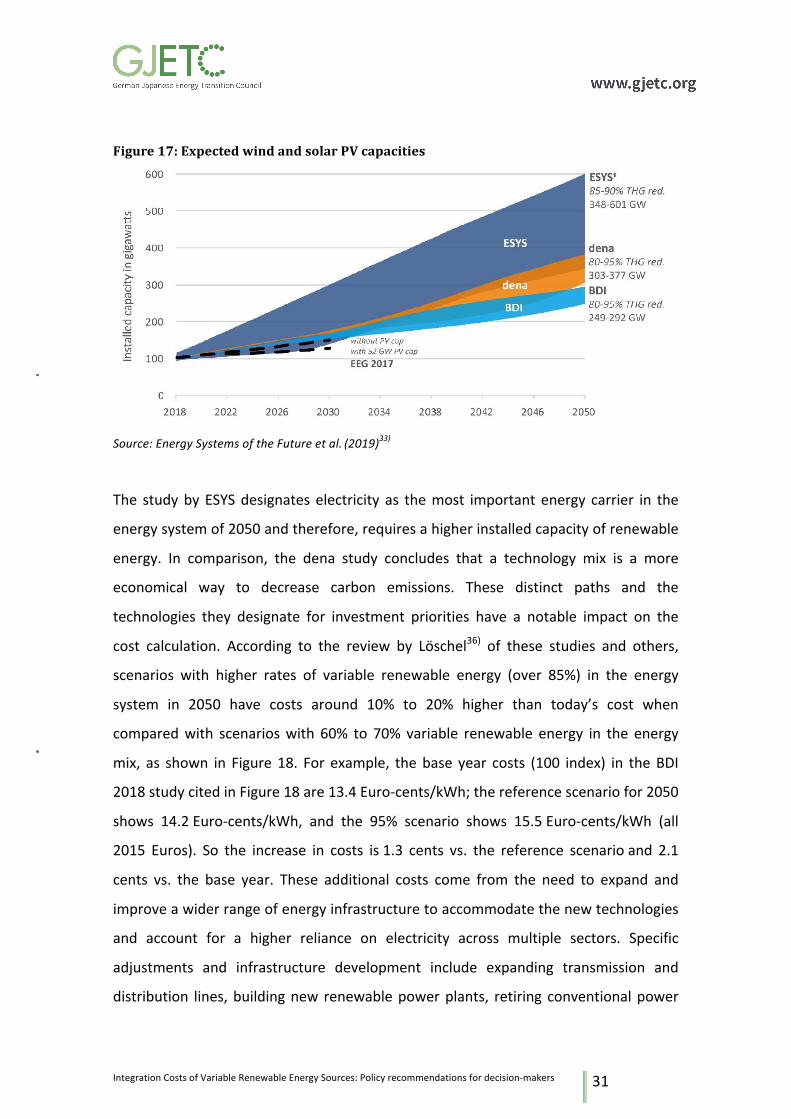
The studybyESYSdesignateselectricity as themost importantenergy carrier in the
energysystemof2050andtherefore,requiresahigherinstalledcapacityofrenewable
energy. In comparison, the dena study concludes that a technology mix is a more
economical way to decrease carbon emissions. These distinct paths and the
technologies they designate for investment priorities have a notable impact on the
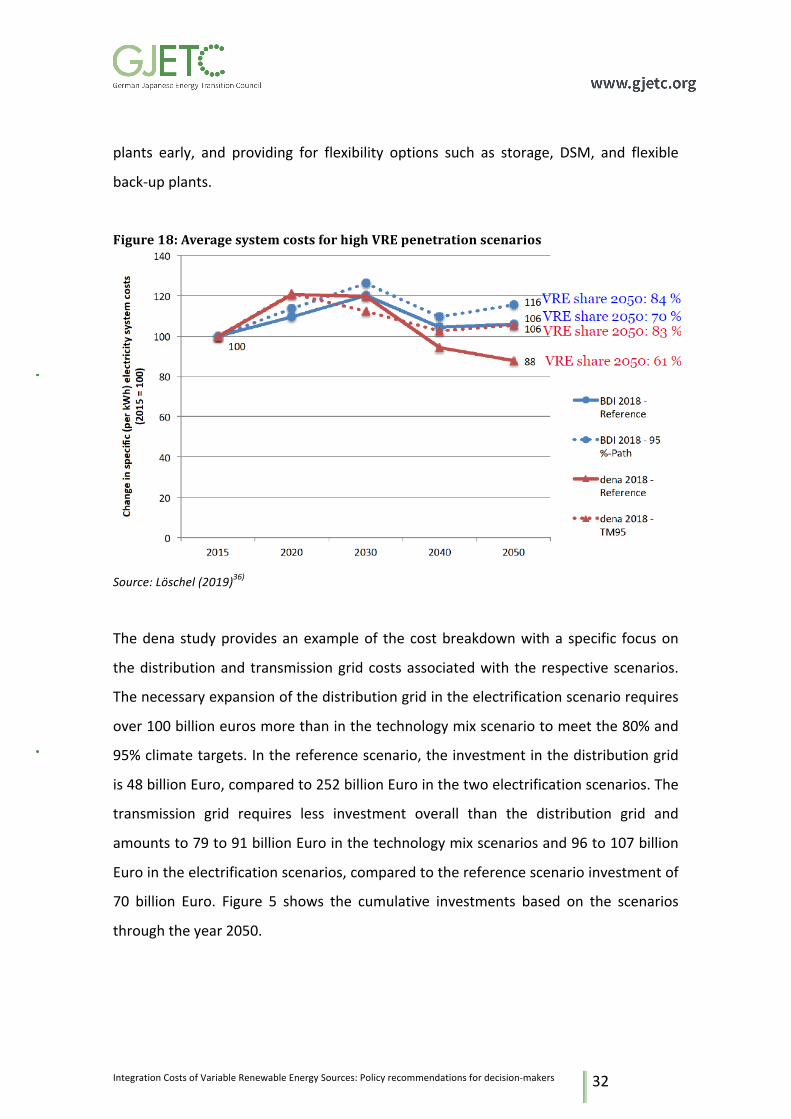
cost calculation. According to the review by Löschel36) of these studies and others,
scenarios with higher rates of variable renewable energy (over 85%) in the energy
system in 2050 have costs around 10% to 20% higher than today’s cost when
comparedwith scenarioswith 60% to 70% variable renewable energy in the energy
mix, as shown in Figure18. For example, thebase year costs (100 index) in theBDI
2018studycitedinFigure18are13.4Euro-cents/kWh;thereferencescenariofor2050
shows 14.2Euro-cents/kWh, and the 95% scenario shows 15.5Euro-cents/kWh (all
2015 Euros). So the increase in costs is1.3 cents vs. the reference scenarioand 2.1
cents vs. the base year. These additional costs come from the need to expand and
improveawiderrangeofenergyinfrastructuretoaccommodatethenewtechnologies
and account for a higher reliance on electricity across multiple sectors. Specific
adjustments and infrastructure development include expanding transmission and
distribution lines,buildingnewrenewablepowerplants, retiringconventionalpower
IntegrationCostsofVariableRenewableEnergySources:Policyrecommendationsfordecision-makers
32
plants early, and providing for flexibility options such as storage, DSM, and flexible
back-upplants.
Figure18:AveragesystemcostsforhighVREpenetrationscenarios
Source:Löschel(2019)36)
Thedenastudyprovidesanexampleof thecostbreakdownwitha specific focuson
thedistributionand transmissiongridcostsassociatedwith the respectivescenarios.
Thenecessaryexpansionofthedistributiongridintheelectrificationscenariorequires
over100billioneurosmorethaninthetechnologymixscenariotomeetthe80%and
95%climatetargets.Inthereferencescenario,theinvestmentinthedistributiongrid
is48billionEuro,comparedto252billionEurointhetwoelectrificationscenarios.The
transmission grid requires less investment overall than the distribution grid and
amountsto79to91billionEurointhetechnologymixscenariosand96to107billion
Eurointheelectrificationscenarios,comparedtothereferencescenarioinvestmentof
70 billion Euro. Figure 5 shows the cumulative investments based on the scenarios
throughtheyear2050.

IntegrationCostsofVariableRenewableEnergySources:Policyrecommendationsfordecision-makers
33
Figure19:Cumulativeinvestmentsforelectricitygridsuntil2050
Source:dena(2018)35)
However,accordingtoastudybyAgoraEnergiewendefortheGJETC39),thegridcosts
for integrating onshore wind and PV in Germany are relatively low despite these
investments, between 0.4 and 1.1 Euro-Cents/kWh (Figure 6 and 7). Grid costs for
offshore wind power are higher. Even lower than grid costs are balancing costs to
compensate for the variable nature of the renewable energies compared to system
load.Thisisduetoanintelligentcombinationofflexiblegeneration,sectorintegration,
andspecificflexibilityoptions.Thetotalof integrationcosthasbeenestimatedtobe
0.5to1.3Euro-Cents/kWh,exceptforoffshorewindpower.

IntegrationCostsofVariableRenewableEnergySources:Policyrecommendationsfordecision-makers
34
Figure20:Overviewofcomponentsdiscussedunder"integrationcosts"
Source:AgoraEnergiewende(2017a)39)
Figure21:Representativegridandbalancingcostsforwindandsolarpower
Source:AgoraEnergiewende(2017b)40),citedinAgoraEnergiewende(2017a)
(2) Ensuring security of supply
HigherratesofelectrificationandgrowthofVREwillnotonlyrequirechangestothe
electrical grid, but also require a broader array of energy storage technologies and
dispatchablepowerplants.ThevariablenatureofwindandsolarPVtechnologymeans
thatthesystemmustmitigatetherisksassociatedwiththe“darkdoldrums”through
IntegrationCostsofVariableRenewableEnergySources:Policyrecommendationsfordecision-makers
35
improved short-term flexibility. Therefore,Germanymust invest in the research and
developmenttoimproveandscaleupstorageandflexibletechnologies.Powerplants,
on theotherhand,will serveas abackuppower sourceandwill have relatively low
operating hours in the future. Policies must be set in place to ensure that the
dispatchablepowerplantsareabletoremainprofitable,whichrequiresrestructuring
of the current tax and fee structure, and that processes such as power-to-x are
economicallyviabletoreplacefossilfuels.
The amount of generating capacity Germany will need in 2050 will depend on the
degree of electrification and the extent that Europe integrates the electrical grid,
among other factors. The three studies estimate that Germany will require
dispatchablepowerplantsbetween60and130GWby2050,comparedto100GWin
2018and105GWin2015.Theconventionalelectricitygeneration inthesescenarios
are primarily gas-fired power plants. Germany is already phasing out nuclear power
andplanstoendcoal-firedpowerplantgenerationby2038.Therefore,naturalgasis
replacingnuclearandcoalpower.However, the95%climate target scenarios,which
require zero-emissions in the power sector, will only be possible if these backup
generation plants are fueled by power-to-gas (hydrogen or methane). As their
operatinghoursarelow,sowillbetheircontributiontopowergenerationoverall.For
example in the BDI study, it is less than 50 TWh/yr or around 8% of total power
generation.

IntegrationCostsofVariableRenewableEnergySources:Policyrecommendationsfordecision-makers
36
Figure22:DispatchablepowergenerationinGermany2050
Source:EnergySystemsoftheFutureetal.(2019)33)
(3)Developingnewtechnologies:renewablesyntheticenergycarriers
AllthreestudiesemphasizethenecessitytodevelopVREineveryscenario;however,
they do not discount the role that synthetic energy carriers and power-to-x
technologieswill play, particularly in later phases of the energy transition. The 95%
climatetargetisnotpossiblewithouttheemploymentofsyntheticenergycarriersthat
willprovideareplacementforfossilfuelsasadirectenergysourceandserveasalong-
termstoragemechanismforexcesswindandsolarcapacity.Theseenergycarrierswill
complement electrification and the development of VRE because they will require
energy to complete electrolysis and the other chemicals processes needed for
production. To achieve carbon-neutral emissions, these processes must rely on
renewableenergyratherthanconventionalfuels.
IntegrationCostsofVariableRenewableEnergySources:Policyrecommendationsfordecision-makers
37
Figure23:UseofsyntheticcarriersinGermany2050
Source:EnergySystemsoftheFutureetal.(2019)33)
The ESYS study rules out imports of renewable synthetic energy carriers due to
political uncertainties in other countries that may not support the technological
developmentandeconomicfeasibilityofthistechnology.However,theBDIanddena
studiesshowthatGermanywill likelyhavetodependon imports fromothernations
who have relatively abundantwind and solar resources. The question of how other
countries will address the energy transition and to what extent they will increase
ambition in climate targets will shape Germany’s energy future as it determines
investmentandpolicypriorities. If Europe integrates itselectricity grid, forexample,
Germany would be able to import a higher amount of electricity and build fewer
power plants to support VRE. In the same sense, if other countries within Europe
utilize renewable resources to develop a market for synthetic energy carriers,
Germanycouldthenimportthosefuels.Theabovefiguredepictstheresultsofsome
ofthescenariosfromeachstudy.Thetechnologymixscenariobydenaestimatesthat
Germanywill have to importmore synthetic fuels compared to theother scenarios,
but dena also concludes that the 95% target technologymix scenario ismore cost-
effective than the 95% target electrification scenario. It should be noted that these
syntheticenergycarriersareratherusedinothersectorsthanpowergeneration:they
are ameans of sector coupling to use the renewable electricity potential for other

IntegrationCostsofVariableRenewableEnergySources:Policyrecommendationsfordecision-makers
38
sectors.Therefore,theirlinktoVREsystemintegrationcostsisratherindirect:onthe
onehand, theywill increase theneededVREgeneration capacity, dependingon the
shareof imported vs. domestically produced synthetic energy carriers.On theother
hand, the electrolysis needed for their domestic production is providing ameans of
storageforelectricityintheformofhydrogen,therebyreducingtheintegrationcost.
3.3Discussion
The ESYS, BDI, and dena studies present potential paths for Germany to realize the
transition to a carbon-neutral energy system by 2050. Each study takes a slightly
different approach and the results are based on the differences in assumptions of
factors such as the degree of cross-sectoral coupling, the global climate policy
environment,andthelikelihoodofasyntheticenergycarriermarket.However,theyall
concludethatGermanywillrequireahigherrateofelectrificationandmuchbroader
deployment of VRE. The findings by Löschel36) based on a review of the same and
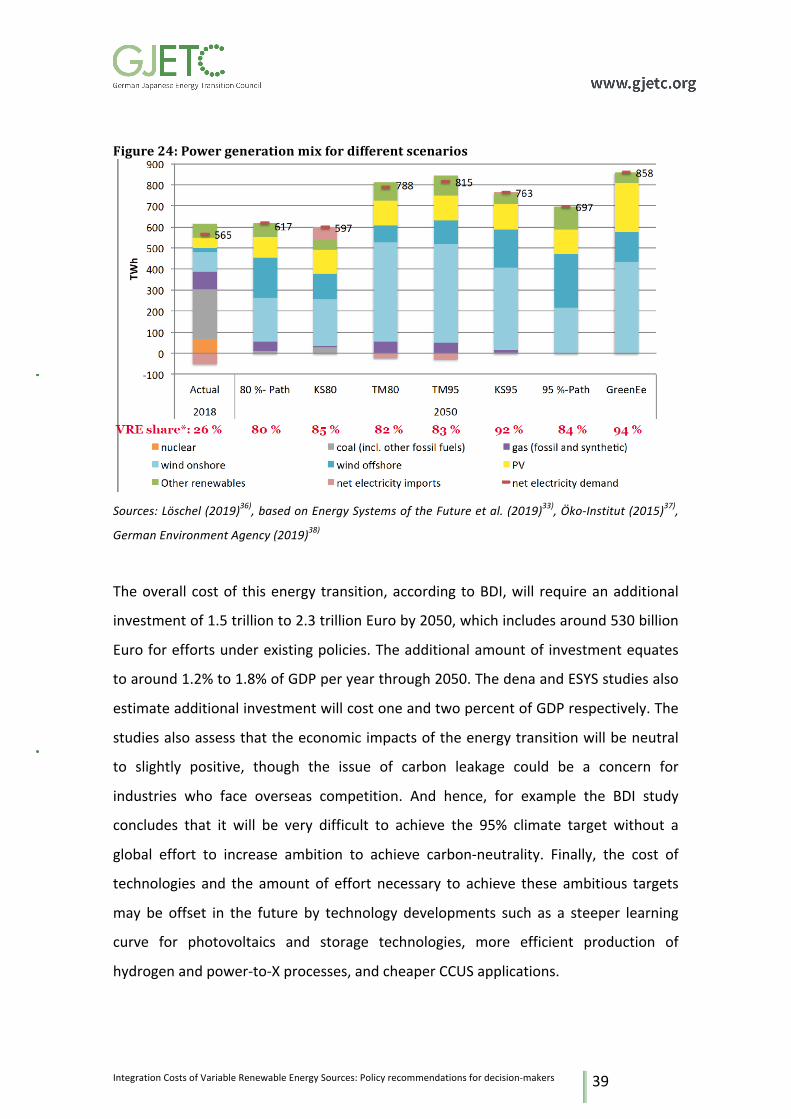
similar studies, as shown in Figure 24 below, depict the projected high penetration
rates of VRE in comparison to other technologies. They determine that VRE
penetrationmustbeover80%toreachthe80%and95%climatetargets,andthatthe
remaining energy carrierswill be other renewables and gas, and in some scenarios,
supplementsfromelectricityimports.Asnotedearlier,nuclearenergyandcoalwillnot
be apart ofGermany’s future energymixdue to theplans for phase-out already in
place.
IntegrationCostsofVariableRenewableEnergySources:Policyrecommendationsfordecision-makers
39
Figure24:Powergenerationmixfordifferentscenarios
Sources:Löschel(2019)36),basedonEnergySystemsoftheFutureetal.(2019)33),Öko-Institut(2015)37),
GermanEnvironmentAgency(2019)38)
Theoverall costof thisenergy transition,according toBDI,will requireanadditional
investmentof1.5trillionto2.3trillionEuroby2050,whichincludesaround530billion
Euroforeffortsunderexistingpolicies.Theadditionalamountof investmentequates
toaround1.2%to1.8%ofGDPperyearthrough2050.ThedenaandESYSstudiesalso
estimateadditionalinvestmentwillcostoneandtwopercentofGDPrespectively.The
studiesalsoassessthattheeconomicimpactsoftheenergytransitionwillbeneutral
to slightly positive, though the issue of carbon leakage could be a concern for
industries who face overseas competition. And hence, for example the BDI study
concludes that it will be very difficult to achieve the 95% climate target without a
global effort to increase ambition to achieve carbon-neutrality. Finally, the cost of
technologies and the amount of effort necessary to achieve these ambitious targets
may be offset in the future by technology developments such as a steeper learning
curve for photovoltaics and storage technologies, more efficient production of
hydrogenandpower-to-Xprocesses,andcheaperCCUSapplications.

IntegrationCostsofVariableRenewableEnergySources:Policyrecommendationsfordecision-makers
40
4.Comparativediscussionandconclusions
Wecan findmany similarities anddissimilaritiesbetween the Japanese andGerman
studies as described above. The largest dissimilarity would be the assumptions for
nuclearpower.TheGermanstudiesdonottakeintoaccounttheuseofnuclearpower
inthelong-term,whichisanaturalassumptiongiventhenuclearphase-outpolicyof
the country,whereas the Japanese studyconcludes thatnuclearpower canmitigate
thecosthikesrelatedtoveryhighpenetrationofVREs.
Anotherpointofdisaccordmaybetheroleoflow-carbonthermalpowergeneration;
the Japanese studies imply that imported hydrogen can play an important role to
reducethecostofthedecarbonizationofthepowersector,whereasGermanstudies
assume relatively small shares of green hydrogen or synthetic fuels from renewable
powerasbackuppoweronly,withmuchhighersharesofdirectVREpowergeneration
over 80%. This difference may arise due to different assumptions on the future
generationandsystemintegrationcostsofVREvs.hydrogenpower.
We should note various natural and socioeconomic differences between Germany
and Japan. One major difference is related to meteorological conditions and VRE
potentials;forexample,somestudiespointoutthattherealisticpotentialofonshore
windinJapan,takingpublicacceptanceandlegislativeaspectsintoaccount,shouldbe
muchsmallerthanthatestimatedbytheMinistryoftheEnvironment41).TheJapanese
studiesshowninthispaperconcludedthattheunitsystemcostrisessignificantlywith
veryhighVREshares,evenifthemaximumdeploymentofonshorewindaccordingto
theestimatesbytheMOEisassumed.Ifwetakemore“realistic”potentialestimation
into account, the difference between the German and the Japanese studies will be
evenlarger.
WeshouldalsonotethedifferencesintheLCOEsofVRE.AsdescribedinSection1.1.1,
theLCOEsofwindandsolarPVareatmuchhigherlevelsinJapanthaninEurope.As
thedifference lienotonly in thecostsofPVmodulesandwind turbines,butalso in
otherparts intrinsic to the country, thegapcannotbedissolvedat least in thenear
future.However,ifweassumethattheLCOEsofVREsinJapanwillbecomeaslowas

IntegrationCostsofVariableRenewableEnergySources:Policyrecommendationsfordecision-makers
41
those inEurope inthe long-term,thediscrepancybetweentheresultsofthestudies
mayalsobesmaller.
There is also a possibility that othermajor assumptions are different; for example,
heatstorage isregardedasoneofthemostpromisingtechnologiesthatcanprovide
flexibility of energy supply in Europe, while it has not been assumed in Japanese
studies,aslarge-scaledeploymentofheatstorageinJapanisnotregardedasrealistic,
althoughtheremayexistsomepotentialforexampleinindustry.Thismaybeapartof
the difference in climatic conditions. In addition, demand side management and
vehicles-to-grid(V2G)technologieshavenotbeentakenintoaccountintheJapanese
studies. Although explicit consideration of these technologies is not supposed to
change the picture significantly, as explained in Ref. 14), it may reduce the cost of
intermittency at least to some extent. At the same time, taking into account other
aspects,suchasrotationalinertia42),mayboostthecosthikes.
We can observe multiple similarities. For example, the dena study concluded that
cumulativeinvestmentof230-348billionEurowillberequiredonpowergridsforVRE
80%scenarios,ascomparedwith118billionEuroforthereferencescenario,whereas
the Japanese study estimates the cumulative additional investment for the 100%
renewables case at 40 trillion yen (330billion Euro). The large required investments
resultfromthefactthatlargewindpotentialsexistinremoteareasfromlargeenergy
consumersinbothcountries.
The“cannibalization”effect,aspointoutinRefs.31-32),canalsobeamajorchallenge
inthemid-to long-term,bothinJapanandinEurope.Germanstudiesconcludethat
thetotaleconomic impactsbyachievingdecarbonizedenergysystemsarepractically
negligible,ifany.Atthesametime,weshouldbeawarethateconomicequilibriumis
always determined by marginal costs, rather than by average costs, and that the
“cannibalization effect” refers to anticipated rise in themarginal costs of renewable
sources.Thiswouldhighlightthenecessityofcontinuouspolicysupports inthe long-
term, even if the LCOEs of VREs decline dramatically along with the rapid global
deployment.

IntegrationCostsofVariableRenewableEnergySources:Policyrecommendationsfordecision-makers
42
Anothercommonconclusionisrelatedtothenecessityoftheuseofsyntheticgasor
hydrogen.Hydrogen,oranyotherformof“low-carbongases”,shouldberegardedasa
promising option to achieve a carbon neutral energy system in the future, although
somepeople stilldoubt the feasibilityof the technology,duemainly to the required
largeinvestmentsontheinfrastructure,whichhavenotbeenrealizedsofar.
Theimportanceoftheeffectsof“darkdoldrums”,or“windlessandsunless”periods,
onenergysecurityunderhighpenetrationofVREhasalsobeenemphasized inboth
studies.IntheJapanesestudies,thecostsofpowerstoragesystemstoavoidelectricity
disruptionduringtheseperiodsaccountforalargepartoftheadditionalcostsrelated
to thedecarbonizationof thepower sector. InGermany, thedena reportpointsout
thatthisissuehasledtoverycontroversialdiscussions,andconcludesthat“afurther
study should investigatewhat contribution is required to secure capacity for a long,
colddarkdoldrumsperiodandwhetherelectricityimportscanachievethis.”
InJapan,whereelectricityimportfromoverseasispoliticallyverydifficult,thisexerts
muchlargereffectsontheeconomicsofthepowersectorthaninEurope.However,as
pointed out in the dena report, “dark doldrums” can take place simultaneously in
whole Europe. Thus this constitutes a major challenge for very high penetration of
VRE, not only in Japan, but also in Europe and probably in any other countries and
regions.Itishighlylikelythattherewillremaintheneedforsomebackuppowerplants
usinghydrogenorotherlow-carbonsyntheticgas;forenergyefficiencyreasons,using
CHPplants,e.g.inindustryorinGermanyalsoindistrictheating,wouldbetheoptimal
solution.ThisisshowninmostGermanscenariostudies,particularlythosewithlower
additional costs such as the BDI study or dena’s technology mix (Figure 24 in the
chapteronGermanyabove).ItcanalsobederivedfromthesteepincreaseintheIEEJ’s
modellingwhendecreasingtheshareofhydrogenpowerfrom200or100TWh/yrto
zero(Figure7and8inthepartonJapan).
A difference is that the IEEJ has directlymodelled the system costs of the Japanese
electricity system under a larger number of different cost assumptions, while the
Germanstudiesallowtocomparetheoverallpowersystemcostsofselectedverylow-
carbonscenarioswithreferencescenarios,asdoneinFigure18above.UnderGerman

IntegrationCostsofVariableRenewableEnergySources:Policyrecommendationsfordecision-makers
43
conditionsandtheParisAgreement,evenreferencescenarioshaveahighshareofVRE
in2050(60to70%).Still,asFigure18shows,thedifferencebetweenminus95%GHG
scenarios and the reference scenarios is only 10 to 20 % of total electricity system
costs,whichcanbeinterpretedastheintegrationcostsofveryhighsharesofVRE.For
example,theincreaseincostsforthe95%scenariointheBDI2018studyis1.3cents
vs. the reference scenarioand2.1 cents vs. thebase year2015, andalmost zero vs.
2020.
Inthesamedirection,therehasbeenathoughtexperimentbyÖko-InstitutforAgora
Energiewende43), which modelled the system costs for a hypothetical fossil fuel
electricitysystemfor2050(i.e., replacingexistingpowerplantswithnewcoalorgas
plants)andaRES-basedsystemin2050.Inhalfofthecostcaseseach,oneortheother
system was more expensive than the other, so the costs are more or less on par:
meaningnonetincreaseinsystemcosts.
AlikelyreasonforthelowincreaseinsystemcostsforveryhighsharesofVREisthat
allofthesestudiesonGermanyuseafullcombinationofavailableflexibilityandgrid
integration options for VRE. These range from demand-sidemanagement, batteries
includingBEV,heatstorageandheatpumps,tosmartgridsandgridrestructuring,to
other storage and the existing pumped storage hydro (which is much less than in
Japan), and to electrolysis and gas-fired back-up power with ‚green‘ hydrogen or
methane.ThesecaneitherbeproducedfromsurplusVREpowerinGermanyorEurope
or imported as hydrogen or synthetic fuels. In minus 95% scenarios with lower
additional costs, synthetic gas from PtG providessome 5 to 10% of the power
generationin 2050. This is the main long-term (weeks/months) storage option. Of
course there may be other factors explaining differences, like the integration of
Germanyintothegridofitsneighboursthatmayreducecosts.
IncontrasttotheseGermanstudies,IEEJ’sCaseC-0inFigure10seesanaveragecost
of 18 JPY/kWh, considerably higher than the optimal level of 11 JPY/kWh. This case
assumes flexible pumpedhydro power and hydrogen storage aswell,with 50 to 90
TWh/yr of power generated from this hydrogen, but no imported hydrogen. As
describedabove,thesedifferencesbetweenGermanandJapanesestudiesforsimilar
IntegrationCostsofVariableRenewableEnergySources:Policyrecommendationsfordecision-makers
44
casesmayresult,at leastpartly,fromdifferences incostassumptionsparticularlyfor
windandsolarpower,aswellasweatherconditions.Weshouldnote,however,that
with the use of a reasonable amount of nuclear power and/or imported hydrogen
(around100to200TWh/yrofelectricityproduction),thecosthikecanbereducedto
lessthan3JPY/kWh(2.5Euro-cents/kWh)eveninthecaseofJapan,asisobviousfrom
Figure8.
Wemayconcludethat1)thepotentialofachievingahighshareofvariablerenewable
energies inpowergenerationwill highlydependon the futuredevelopmentof their
generation costs in relation to hydrogen and nuclear power plants, and 2) itwill be
necessary to optimise the grid integration, flexibility, and sector integration
technologiesandtheirmix,aswellasenergyefficiency, inordertominimisespecific
andoverallpowersystemcostswithgrowingsharesofVRE.Thestudiesreviewedhere
indicate that itwill bepossible to limit additional power systemcosts to reasonable
levelsevenwithhighsharesofVRE, ifwecanaddressseveralanticipatedchallenges
properly,andoptimiseoureffortsinachievingambitiousGHGreductiontargets.
The GJETC therefore recommends (1) further analysis and simulation to better
understandtheopportunitiesofdifferenttechnologiesandtheircombination,aswell
asthedifferencesincostsfoundbetweenGermanyandJapan(cf.chapter4.6),taking
experiencesinothercountriesonboard,suchasUSfederalstatesorDenmark;(2)to
implement jointGerman-Japanesedemonstrationandpilotprojectstotestadvanced
technologiesandbusinessmodelsforflexibility,similare.g.totheSINTEGprogramin
Germany;and(3)todevelopaprioritylistformarketreadinessandimplementationof
differentflexibilityoptions,withthetimingofimplementationrelatedtotheshareof
VREinthesystem.Obviously,suchaprioritylistwouldalsobeadaptedtothesituation
ineachofbothcountries,GermanyandJapan.
IntegrationCostsofVariableRenewableEnergySources:Policyrecommendationsfordecision-makers
45
References
1. Intergovernmental Panel on Climate Change (IPCC), (2018). Global warming of 1.5 °C. https://www.ipcc.ch/sr15/
2. Masui T., Oshiro K. and Kainuma M, (2016). Eighty percent reduction scenario in Japan. In: Nishioka S, editor. Enabling Asia to stabilize the climate, Singapore: Springer.
3. Ashina S., Fujino J., Masui T., Ehara T. and Hibino G., (2012). A roadmap towards a lowcarbon society in Japan using backcasting methodology: feasible pathways for achieving an 80% reduction in CO2 emissions by 2050, Energy Pol., 41, 584-598.
4. Akimoto K. and Sano F., (2017). Analyses on Japan's GHG emission reduction target for 2050 in light of the 2C target stipulated in the Paris Agreement, J. Jpn. Soc. Energy Resour., 38, 1-9.
5. Intergovernmental Panel on Climate Change (IPCC), (2005). IPCC special report on carbon capture and storage. https://www.ipcc.ch/pdf/special-reports/srccs/srccs_wholereport.pdf
6. Global CCS Institute, (2017). Global costs of carbon capture and storage 2017 update; 2017. https://hub.globalccsinstitute.com/sites/default/files/publications/201688/global-ccs-cost-updatev4.pdf
7. U.S. Energy Information Administration (EIA), (2017). Petra Nova is one of two carbon capture and sequestration power plants in the world. https://www.eia.gov/todayinenergy/detail.php?id=33552
8. Carbon Capture and Sequestration Technologies program at MIT, (20016). Boundary Dam Fact Sheet. https://sequestration.mit.edu/tools/projects/boundary_dam.html
9. Ogimoto K., Urabe C. T. and Saito T, (2018). Possibilities and issues of renewable energy 100% in a future. Proc. Conf. Energy Econ. Environ., 34. [in Japanese]
10. World Wide Fund for Nature, Japan (WWF Japan), (2017). A long-term scenario towards a low-carbon society. https://www.wwf.or.jp/activities/2017/02/1356316.html [in Japanese]
11. Ram M., Bogdanov D., Aghahosseini A., Oyewo A. S., Gulagi A., Child M., Fell H.-J. and Breyer C., (2017). Global energy system based on 100% renewable energy – power sector. http://energywatchgroup.org/wp-content/uploads/2017/11/Full-Study-100-Renewable-Energy-Worldwide-Power-Sector.pdf
12. Esteban M., Zhang Q. and Utama A., (2012). Estimation of the energy storage requirement of a future 100% renewable energy system in Japan, Energy Pol., 47, 22-31.

IntegrationCostsofVariableRenewableEnergySources:Policyrecommendationsfordecision-makers
46
13. Esteban M., Portugal-Pereira J., Mclellan B. C., Bricker J., Farzaneh H., Djalilova N., Ishihara K. N., Takagi H. and Roeber V., (2018). 100% renewable energy system in Japan: Smoothening and ancillary services, Appl. Energy, 224, 698-707.
14. Matsuo Y., Endo S., Nagatomi Y., Shibata Y., Komiyama R. and Fujii Y., (2018). A quantitative analysis of Japan's optimal power generation mix in 2050 and the role of CO2-free hydrogen, Energy, 165, 1200-1219.
15. Matsuo Y., Endo S., Nagatomi Y., Shibata Y., Komiyama R. and Fujii Y., (2020). Investigating the economics of the power sector under high penetration of variable renewable energies. Appl. Energy, 267, 113956.
16. International Energy Agency Photovoltaic Power Systems Programme (IEA-PVPS), (2018). Trends 2018 in photovoltaic applications. http://www.iea-pvps.org/fileadmin/dam/public/report/statistics/2018_iea-pvps_report_2018.pdf
17. International Energy Agency Wind Technology Collaboration Programme (IEA Wind TCP), (2017). Annual report. https://community.ieawind.org/home
18. Institute of Energy Economics, Japan (IEEJ), (2019). IEEJ outlook 2020. https://eneken.ieej.or.jp/en/whatsnew/433.html
19. Ministry of Economy, Trade and Industry (METI), (2019). Taiyoukou-hatsuden Furyoku-hatsuden ni tsuite. https://www.meti.go.jp/shingikai/santeii/pdf/049_01_00.pdf [in Japanese]
20. Shibata Y, (2012). Analysis on the cost effectiveness of the residential distributed energy system composed of fuel cell, photovoltaics and battery, IEEJ Energy J., 7, 68-88.
21. Shibata Y, (2013). Optimum locational allocation of wind turbine capacity based on smoothing effect. IEEJ Energy J., 8, 20-29.
22. Kuster C., Rezgui Y. and Mourshed M, (2017). Electrical load forecasting models: A critical systematic review, Sustain. Cities Soc., 35, 254-270.
23. Ministry of the Environment (MOE), (2019) Saisei kanou enerugi ni kansuru zoningu kiso jouhou. https://www.env.go.jp/earth/zoning/index.html [in Japanese]
24. Power Generation Cost Analysis Working Group, (2015). Report on analysis of generation costs, etc. for subcommittee on long-term energy supply-demand outlook. http://www.meti.go.jp/english/press/2015/pdf/0716_01b.pdf
25. Yoshino Y., Harada E., Inoue K., Yoshimura K., Yamashita S. and Hakamada K., (2012). Feasibility study of “CO2 free hydrogen chain” utilizing Australian brown coal linked with CCS, Energy Proc., 29, 701-709.
26. Kamiya S., Nishimura M. and Harada E., (2015). Study on introduction of CO2 free energy to Japan with liquid hydrogen, Phys. Proc., 67, 11-19.
27. Ministry of Economy, Trade and Industry (METI), (2019). The strategic roadmap for hydrogen and fuel cells. https://www.meti.go.jp/english/press/2019/pdf/0312_002a.pdf
28. International Renewable Energy Agency (IRENA), (2017). Electricity storage and renewables: Costs and markets to 2030.

IntegrationCostsofVariableRenewableEnergySources:Policyrecommendationsfordecision-makers
47
https://www.irena.org/publications/2017/Oct/Electricity-storage-and-renewables-costs-and-markets
29. Fuel Cells and Hydrogen Joint Undertaking (FCH JU), (2014). Development of Water Electrolysis in the European Union Final Report. http://www.fch.europa.eu/node/783
30. Fuel Cells and Hydrogen Joint Undertaking (FCH JU), (2014). Multi-annual work plan 2014 – 2020. http://www.fch.europa.eu/sites/default/files/documents/FCH2%20JU%20-%20Multi%20Annual%20Work%20Plan%20-%20MAWP_en_0.pdf>
31. Green R.J. and Léautier T-O., (2015). Do costs fall faster than revenues? Dynamics of renewables entry into electricity markets, TSE Working Papers 2015, 15-591.
32. Hirth L., (2013). The market value of variable renewables: The effect of solar and wind power variability on their relative price, Energy Econ., 38, 218-236.
33. Energy Systems of the Future, (2019). Focusing expertise, shaping policy – Energy transition now! https://www.dena.de/fileadmin/dena/Dokumente/Themen_und_Projekte/Energiesysteme/dena-Leitstudie/2019-08-28_Studienvergleich_ENG.pdf
34. Federation of German Industries (BDI) (2018). Klimapfade für Deutschland. https://bdi.eu/publikation/news/klimapfade-fuer-deutschland/
35. German Energy Agency (dena) (2018). Integrated energy transition – Impulses to shape the energy system up to 2050. https://www.dena.de/fileadmin/dena/Dokumente/Pdf/9283_dena_Study_Integrated_Energy_Transition.PDF
36. Löschel A. (2019). Presentation at the GJETC meeting in Tokyo, 23 September 2019
37. Öko-Institut (2015): Klimaschutzszenario 2050. 2. Endbericht. Studie im Auftrag des Bundesministeriums für Umwelt, Naturschutz, Bau und Reaktorsicherheit. Berlin. https://www.oeko.de/oekodoc/2451/2015-608-de.pdf
38. German Environment Agency (ed.) (2019): Wege in eine ressourcenschonende Treibhausgasneutralität – RESCUE-Studie. Climate Change 36/2019. Dessau-Roßlau. https://www.umweltbundesamt.de/sites/default/files/medien/376/publikationen/rescue_studie_cc_36-2019_wege_in_eine_ressourcenschonende_treibhausgasneutralitaet.pdf
39. Agora Energiewende (2017a). The costs of integrating variable renewables in a transforming power system. A methodological review. http://www.gjetc.org/wp-content/uploads/2017/06/GJETC_Inputpaper_GRAICHEN.pdf
40. Agora Energiewende (2017b). Renewables versus fossil fuels – comparing the costs of electricity systems. https://www.agora-energiewende.de/fileadmin2/Projekte/2016/Stromwelten_2050/Agora_Gesamtkosten-Stromwelten-EN_WEB.pdf
IntegrationCostsofVariableRenewableEnergySources:Policyrecommendationsfordecision-makers
48
41. Hamagata S., Nagai Y., Inamura T., Asano K. and Tagashira N., (2019). 2050 nen no CO2 daikibo sakugen wo jitsugen suru tameno keizai oyobi enerugi denryoku jukyu no teiryou bunseki, Central Research Institute of Electric Power Industry Report Y19501. [in Japanese]
42. Kaya Y., Yamaguchi M. and O. Geden, (2019). Towards net zero CO2 emissions without relying on massive carbon dioxide removal, Sustain. Sci., 14(6), 1739-1743.