Embedded Fuzzy Logic Controllers in Electric Railway Transportation Systems
Integration both PI and PD Type Fuzzy Controllers for a Scanning Probe Microscope System Design
JIUM-MING LIN and PO-KUANG CHANG
Dept. of Communication Engineering and Ph.D. program in the Institute of Engineering Science Chung-Hua University
707, Sec. 2 Wu-Fu Rd. Hsin-Chu 30012 TAIWAN
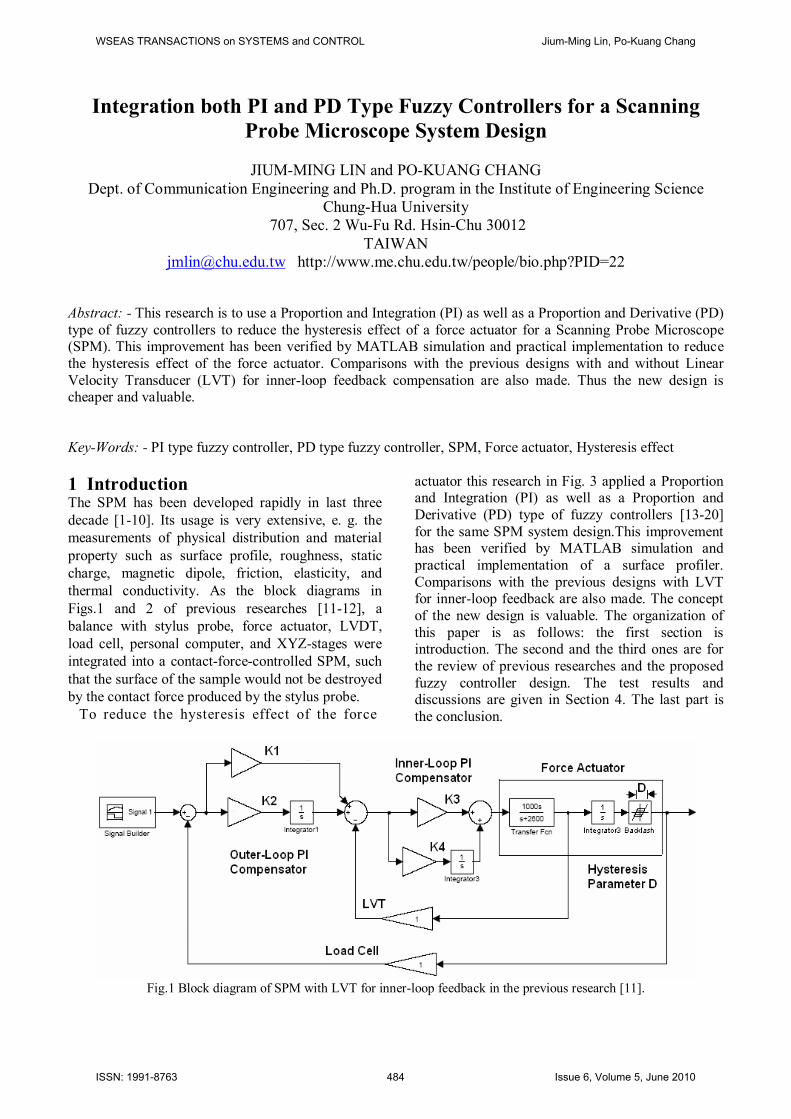
[email protected] http://www.me.chu.edu.tw/people/bio.php?PID=22 Abstract: - This research is to use a Proportion and Integration (PI) as well as a Proportion and Derivative (PD) type of fuzzy controllers to reduce the hysteresis effect of a force actuator for a Scanning Probe Microscope (SPM). This improvement has been verified by MATLAB simulation and practical implementation to reduce the hysteresis effect of the force actuator. Comparisons with the previous designs with and without Linear Velocity Transducer (LVT) for inner-loop feedback compensation are also made. Thus the new design is cheaper and valuable. Key-Words: - PI type fuzzy controller, PD type fuzzy controller, SPM, Force actuator, Hysteresis effect 1 Introduction The SPM has been developed rapidly in last three decade [1-10]. Its usage is very extensive, e. g. the measurements of physical distribution and material property such as surface profile, roughness, static charge, magnetic dipole, friction, elasticity, and thermal conductivity. As the block diagrams in Figs.1 and 2 of previous researches [11-12], a balance with stylus probe, force actuator, LVDT, load cell, personal computer, and XYZ-stages were integrated into a contact-force-controlled SPM, such that the surface of the sample would not be destroyed by the contact force produced by the stylus probe. To reduce the hysteresis effect of the force
actuator this research in Fig. 3 applied a Proportion and Integration (PI) as well as a Proportion and Derivative (PD) type of fuzzy controllers [13-20] for the same SPM system design.This improvement has been verified by MATLAB simulation and practical implementation of a surface profiler. Comparisons with the previous designs with LVT for inner-loop feedback are also made. The concept of the new design is valuable. The organization of this paper is as follows: the first section is introduction. The second and the third ones are for the review of previous researches and the proposed fuzzy controller design. The test results and discussions are given in Section 4. The last part is the conclusion.
Fig.1 Block diagram of SPM with LVT for inner-loop feedback in the previous research [11].
WSEAS TRANSACTIONS on SYSTEMS and CONTROL Jium-Ming Lin, Po-Kuang Chang
ISSN: 1991-8763 484 Issue 6, Volume 5, June 2010
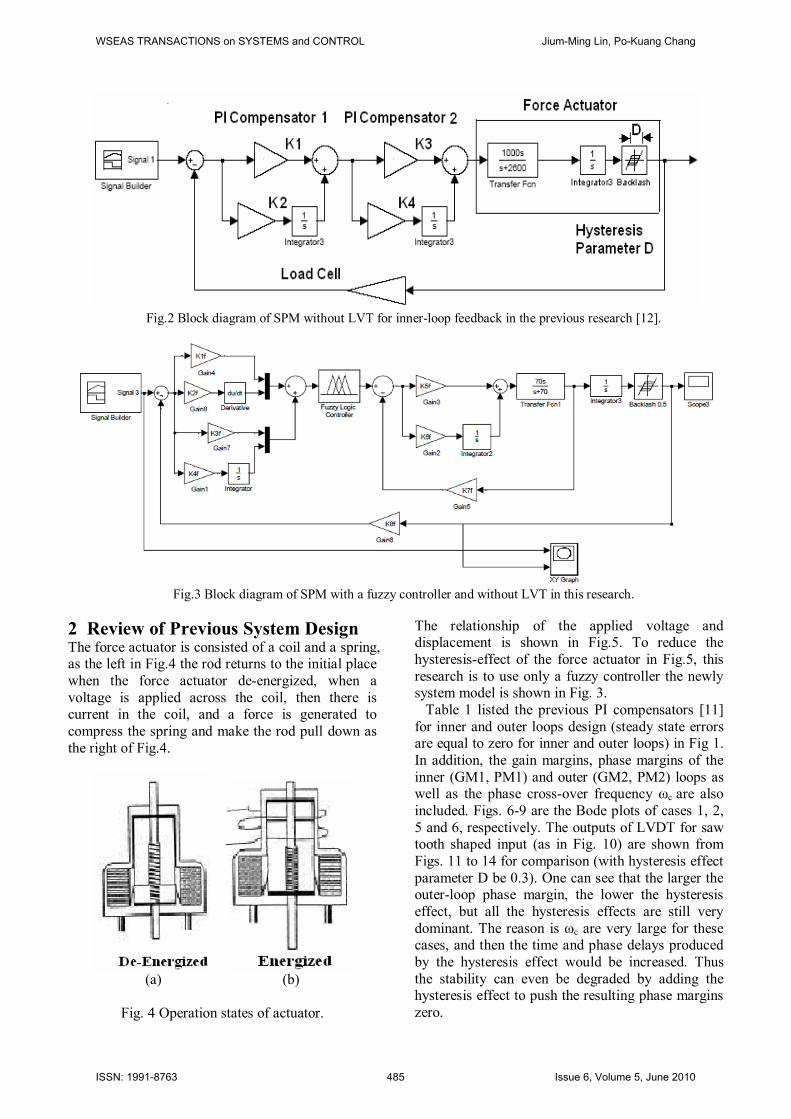
Fig.2 Block diagram of SPM without LVT for inner-loop feedback in the previous research [12].
Fig.3 Block diagram of SPM with a fuzzy controller and without LVT in this research.
2 Review of Previous System Design The force actuator is consisted of a coil and a spring, as the left in Fig.4 the rod returns to the initial place when the force actuator de-energized, when a voltage is applied across the coil, then there is current in the coil, and a force is generated to compress the spring and make the rod pull down as the right of Fig.4.
(a) (b)
Fig. 4 Operation states of actuator.
The relationship of the applied voltage and displacement is shown in Fig.5. To reduce the hysteresis-effect of the force actuator in Fig.5, this research is to use only a fuzzy controller the newly system model is shown in Fig. 3. Table 1 listed the previous PI compensators [11] for inner and outer loops design (steady state errors are equal to zero for inner and outer loops) in Fig 1. In addition, the gain margins, phase margins of the inner (GM1, PM1) and outer (GM2, PM2) loops as well as the phase cross-over frequency ωc are also included. Figs. 6-9 are the Bode plots of cases 1, 2, 5 and 6, respectively. The outputs of LVDT for saw tooth shaped input (as in Fig. 10) are shown from Figs. 11 to 14 for comparison (with hysteresis effect parameter D be 0.3). One can see that the larger the outer-loop phase margin, the lower the hysteresis effect, but all the hysteresis effects are still very dominant. The reason is ωc are very large for these cases, and then the time and phase delays produced by the hysteresis effect would be increased. Thus the stability can even be degraded by adding the hysteresis effect to push the resulting phase margins zero.
WSEAS TRANSACTIONS on SYSTEMS and CONTROL Jium-Ming Lin, Po-Kuang Chang
ISSN: 1991-8763 485 Issue 6, Volume 5, June 2010
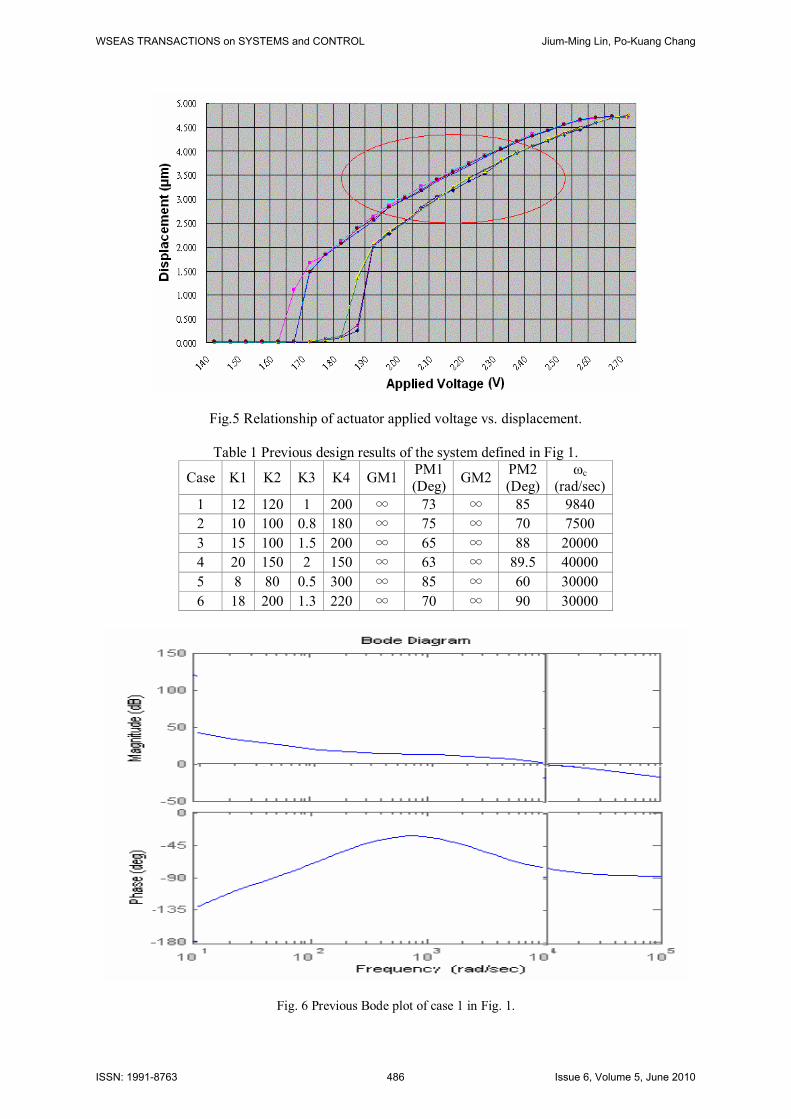
Fig.5 Relationship of actuator applied voltage vs. displacement.
Table 1 Previous design results of the system defined in Fig 1.
Case K1 K2 K3 K4 GM1 PM1 (Deg) GM2 PM2
(Deg) ωc
(rad/sec)
1 12 120 1 200 ∞ 73 ∞ 85 9840 2 10 100 0.8 180 ∞ 75 ∞ 70 7500 3 15 100 1.5 200 ∞ 65 ∞ 88 20000 4 20 150 2 150 ∞ 63 ∞ 89.5 40000 5 8 80 0.5 300 ∞ 85 ∞ 60 30000 6 18 200 1.3 220 ∞ 70 ∞ 90 30000
Fig. 6 Previous Bode plot of case 1 in Fig. 1.
WSEAS TRANSACTIONS on SYSTEMS and CONTROL Jium-Ming Lin, Po-Kuang Chang
ISSN: 1991-8763 486 Issue 6, Volume 5, June 2010
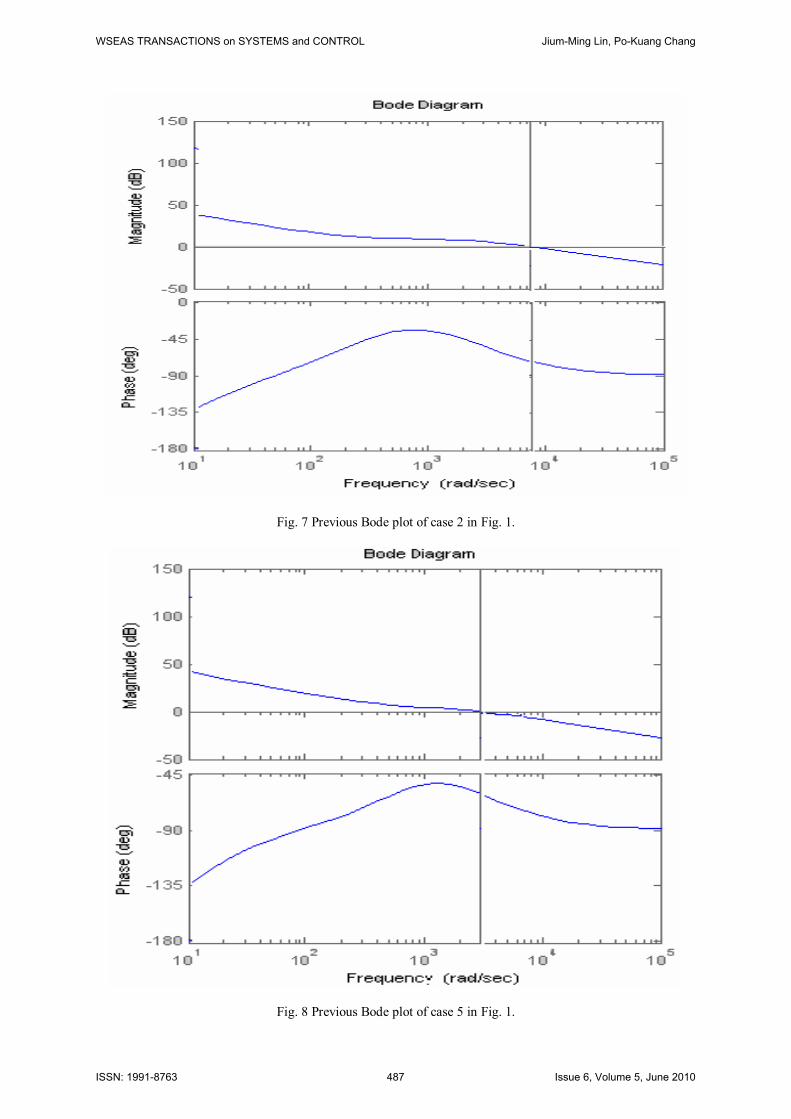
Fig. 7 Previous Bode plot of case 2 in Fig. 1.
Fig. 8 Previous Bode plot of case 5 in Fig. 1.
WSEAS TRANSACTIONS on SYSTEMS and CONTROL Jium-Ming Lin, Po-Kuang Chang
ISSN: 1991-8763 487 Issue 6, Volume 5, June 2010
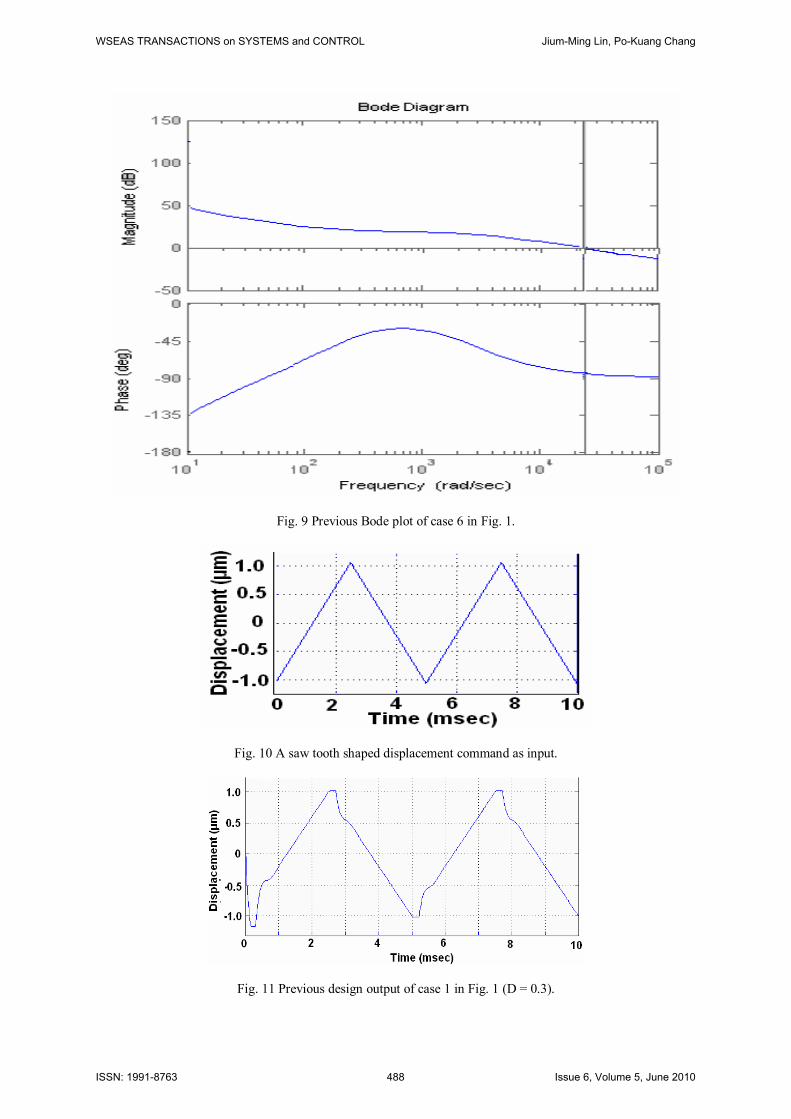
Fig. 9 Previous Bode plot of case 6 in Fig. 1.
Fig. 10 A saw tooth shaped displacement command as input.
Fig. 11 Previous design output of case 1 in Fig. 1 (D = 0.3).
WSEAS TRANSACTIONS on SYSTEMS and CONTROL Jium-Ming Lin, Po-Kuang Chang
ISSN: 1991-8763 488 Issue 6, Volume 5, June 2010
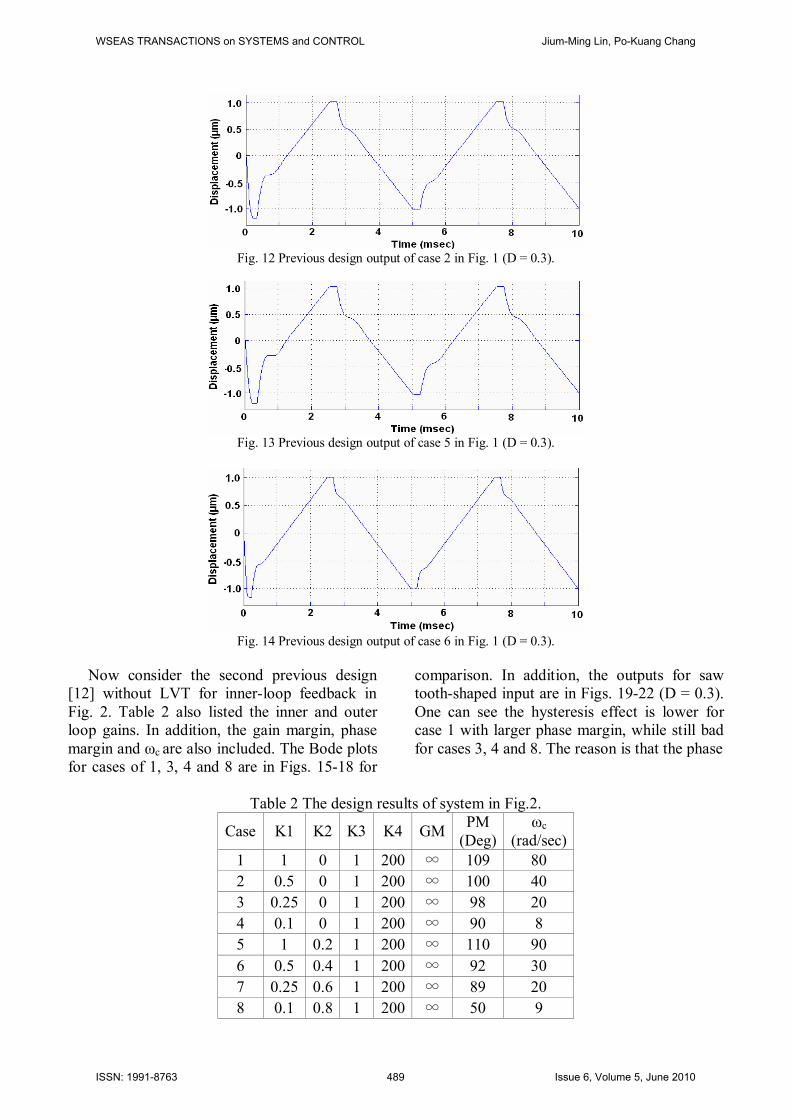
Fig. 12 Previous design output of case 2 in Fig. 1 (D = 0.3).
Fig. 13 Previous design output of case 5 in Fig. 1 (D = 0.3).
Fig. 14 Previous design output of case 6 in Fig. 1 (D = 0.3).
Now consider the second previous design [12] without LVT for inner-loop feedback in Fig. 2. Table 2 also listed the inner and outer loop gains. In addition, the gain margin, phase margin and ωc are also included. The Bode plots for cases of 1, 3, 4 and 8 are in Figs. 15-18 for
comparison. In addition, the outputs for saw tooth-shaped input are in Figs. 19-22 (D = 0.3). One can see the hysteresis effect is lower for case 1 with larger phase margin, while still bad for cases 3, 4 and 8. The reason is that the phase
Table 2 The design results of system in Fig.2.
Case K1 K2 K3 K4 GM PM (Deg)
ωc (rad/sec)
1 1 0 1 200 ∞ 109 80 2 0.5 0 1 200 ∞ 100 40 3 0.25 0 1 200 ∞ 98 20 4 0.1 0 1 200 ∞ 90 8 5 1 0.2 1 200 ∞ 110 90 6 0.5 0.4 1 200 ∞ 92 30 7 0.25 0.6 1 200 ∞ 89 20 8 0.1 0.8 1 200 ∞ 50 9
WSEAS TRANSACTIONS on SYSTEMS and CONTROL Jium-Ming Lin, Po-Kuang Chang
ISSN: 1991-8763 489 Issue 6, Volume 5, June 2010
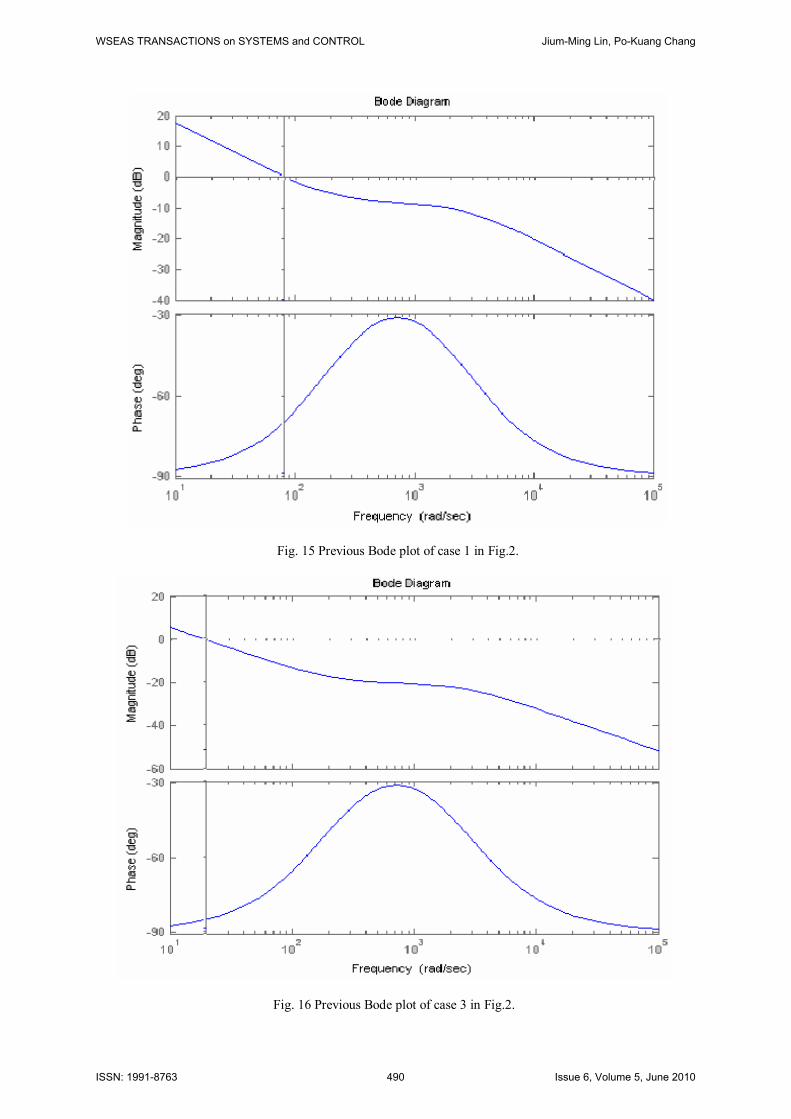
Fig. 15 Previous Bode plot of case 1 in Fig.2.
Fig. 16 Previous Bode plot of case 3 in Fig.2.
WSEAS TRANSACTIONS on SYSTEMS and CONTROL Jium-Ming Lin, Po-Kuang Chang
ISSN: 1991-8763 490 Issue 6, Volume 5, June 2010
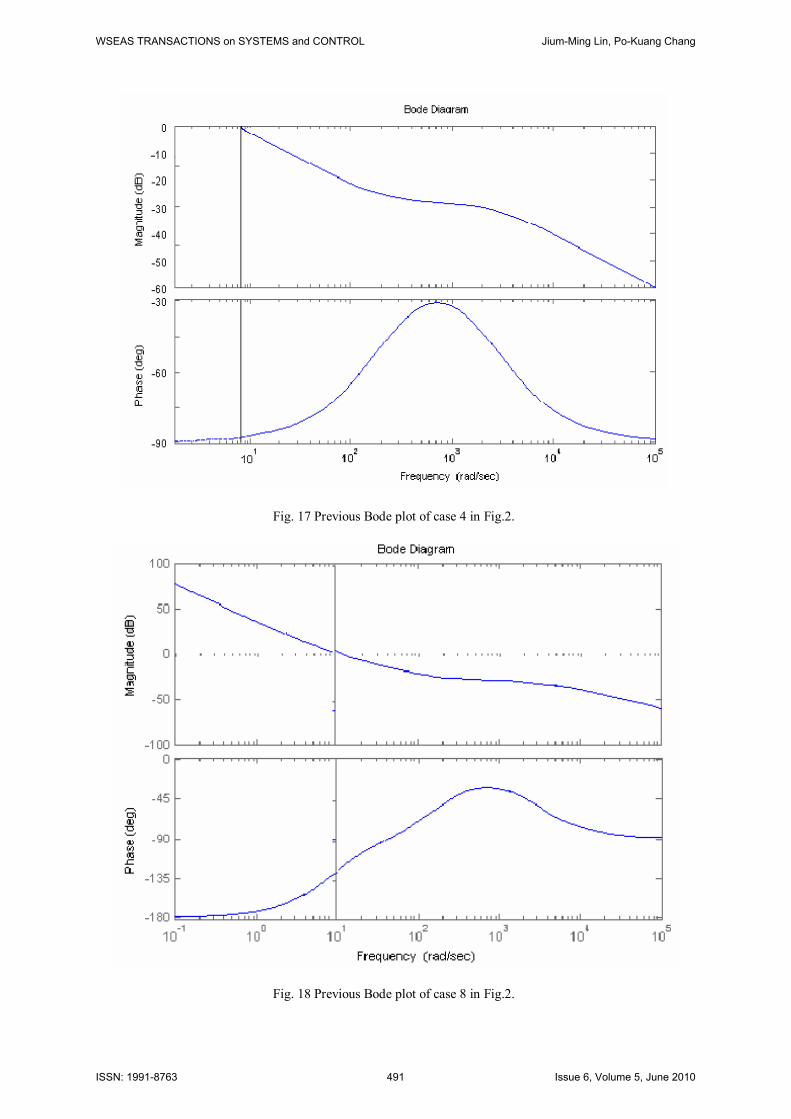
Fig. 17 Previous Bode plot of case 4 in Fig.2.
Fig. 18 Previous Bode plot of case 8 in Fig.2.
WSEAS TRANSACTIONS on SYSTEMS and CONTROL Jium-Ming Lin, Po-Kuang Chang
ISSN: 1991-8763 491 Issue 6, Volume 5, June 2010
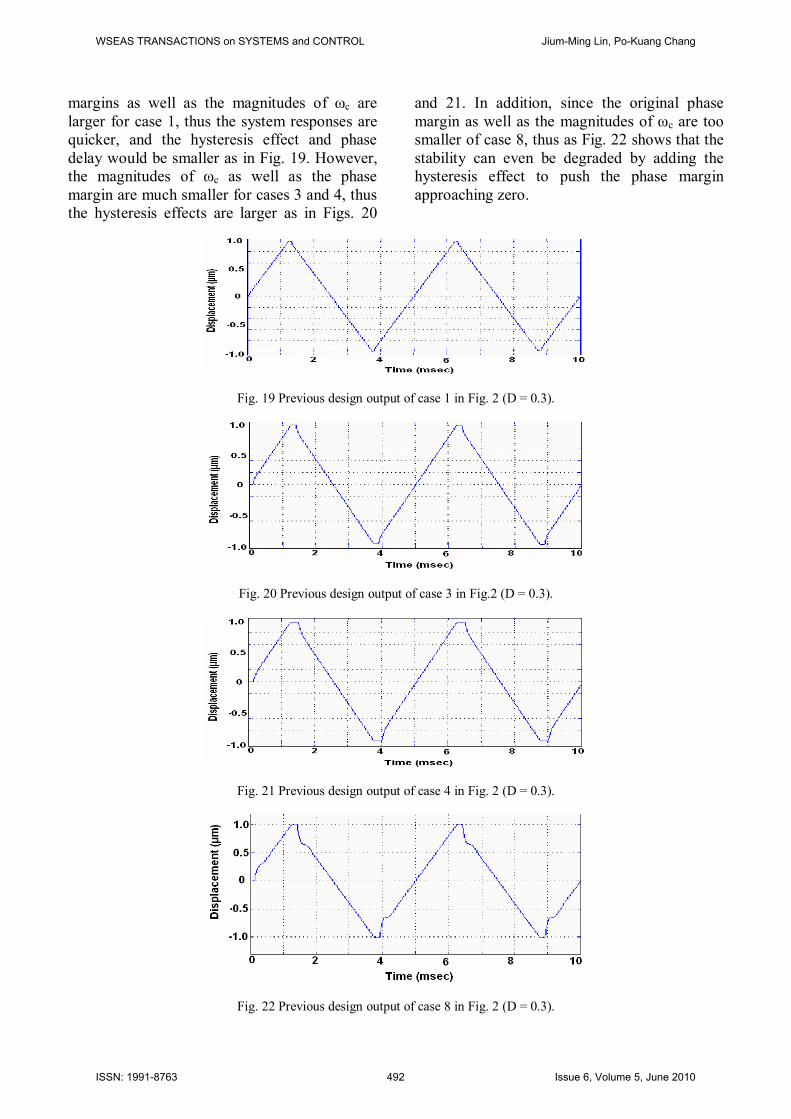
margins as well as the magnitudes of ωc are larger for case 1, thus the system responses are quicker, and the hysteresis effect and phase delay would be smaller as in Fig. 19. However, the magnitudes of ωc as well as the phase margin are much smaller for cases 3 and 4, thus the hysteresis effects are larger as in Figs. 20
and 21. In addition, since the original phase margin as well as the magnitudes of ωc are too smaller of case 8, thus as Fig. 22 shows that the stability can even be degraded by adding the hysteresis effect to push the phase margin approaching zero.
Fig. 19 Previous design output of case 1 in Fig. 2 (D = 0.3).
Fig. 20 Previous design output of case 3 in Fig.2 (D = 0.3).
Fig. 21 Previous design output of case 4 in Fig. 2 (D = 0.3).
Fig. 22 Previous design output of case 8 in Fig. 2 (D = 0.3).
WSEAS TRANSACTIONS on SYSTEMS and CONTROL Jium-Ming Lin, Po-Kuang Chang
ISSN: 1991-8763 492 Issue 6, Volume 5, June 2010
3 Fuzzy Controller Design 3.1 Relationship Functions Design In this section both PI and PD type fuzzy controllers [13-20] are applied in the forward loop as in Fig.3. It is well-known that fuzzy controller is based on the IF-THEN RULE as follows:
R1: IF E is NB AND ΔE is NB THEN U is NB, R2: IF E is NB AND ΔE is ZE THEN U is NM, R3: IF E is NB AND ΔE is PB THEN U is ZE, R4: IF E is ZE AND ΔE is NB THEN U is NM, R5: IF E is ZE AND ΔE is ZE THEN U is ZE, R6: IF E is ZE AND ΔE is PB THEN U is PM, R7: IF E is PB AND ΔE is NB THEN U is ZE, R8: IF E is PB AND ΔE is ZE THEN U is PM, R9: IF E is PB AND ΔE is PB THEN U is PB,
where NB, NM, NS, ZE, PS, PM, and PB respectively stand for negative big, negative middle, negative small, zero, positive small, positive middle, and positive big.
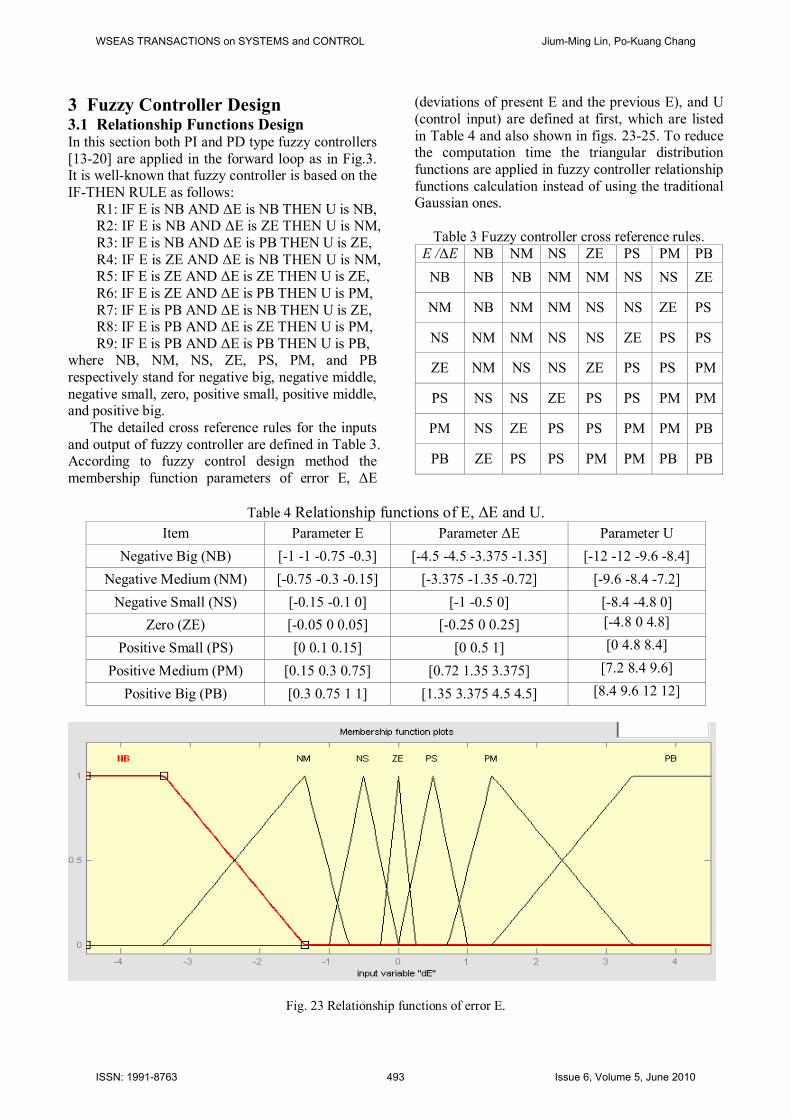
The detailed cross reference rules for the inputs and output of fuzzy controller are defined in Table 3. According to fuzzy control design method the membership function parameters of error E, ΔE
(deviations of present E and the previous E), and U (control input) are defined at first, which are listed in Table 4 and also shown in figs. 23-25. To reduce the computation time the triangular distribution functions are applied in fuzzy controller relationship functions calculation instead of using the traditional Gaussian ones.
Table 3 Fuzzy controller cross reference rules. E /ΔE NB NM NS ZE PS PM PB
NB NB NB NM NM NS NS ZE
NM NB NM NM NS NS ZE PS
NS NM NM NS NS ZE PS PS
ZE NM NS NS ZE PS PS PM
PS NS NS ZE PS PS PM PM
PM NS ZE PS PS PM PM PB
PB ZE PS PS PM PM PB PB
Table 4 Relationship functions of E, ΔE and U.
Item Parameter E Parameter ΔE Parameter U Negative Big (NB) [-1 -1 -0.75 -0.3] [-4.5 -4.5 -3.375 -1.35] [-12 -12 -9.6 -8.4]
Negative Medium (NM) [-0.75 -0.3 -0.15] [-3.375 -1.35 -0.72] [-9.6 -8.4 -7.2] Negative Small (NS) [-0.15 -0.1 0] [-1 -0.5 0] [-8.4 -4.8 0]
Zero (ZE) [-0.05 0 0.05] [-0.25 0 0.25] [-4.8 0 4.8]
Positive Small (PS) [0 0.1 0.15] [0 0.5 1] [0 4.8 8.4]
Positive Medium (PM) [0.15 0.3 0.75] [0.72 1.35 3.375] [7.2 8.4 9.6]
Positive Big (PB) [0.3 0.75 1 1] [1.35 3.375 4.5 4.5] [8.4 9.6 12 12]
Fig. 23 Relationship functions of error E.
WSEAS TRANSACTIONS on SYSTEMS and CONTROL Jium-Ming Lin, Po-Kuang Chang
ISSN: 1991-8763 493 Issue 6, Volume 5, June 2010
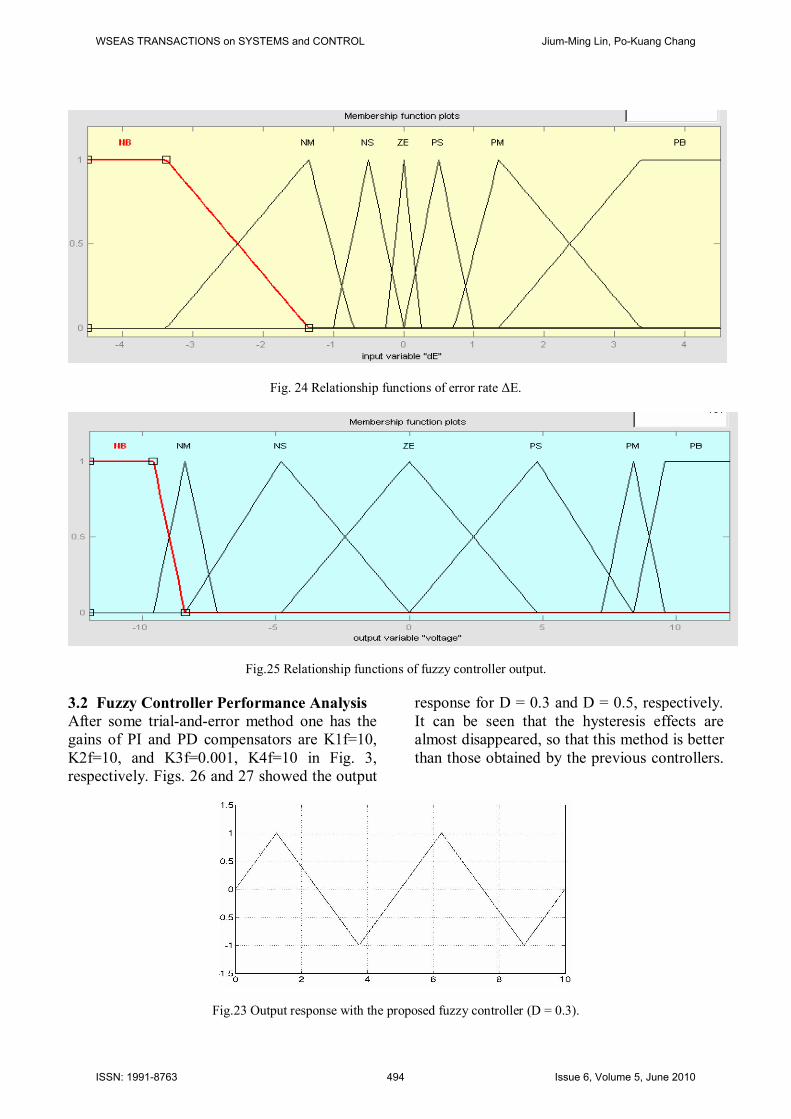
Fig. 24 Relationship functions of error rate ΔE.
Fig.25 Relationship functions of fuzzy controller output.
3.2 Fuzzy Controller Performance Analysis After some trial-and-error method one has the gains of PI and PD compensators are K1f=10, K2f=10, and K3f=0.001, K4f=10 in Fig. 3, respectively. Figs. 26 and 27 showed the output
response for D = 0.3 and D = 0.5, respectively. It can be seen that the hysteresis effects are almost disappeared, so that this method is better than those obtained by the previous controllers.
Fig.23 Output response with the proposed fuzzy controller (D = 0.3).
WSEAS TRANSACTIONS on SYSTEMS and CONTROL Jium-Ming Lin, Po-Kuang Chang
ISSN: 1991-8763 494 Issue 6, Volume 5, June 2010
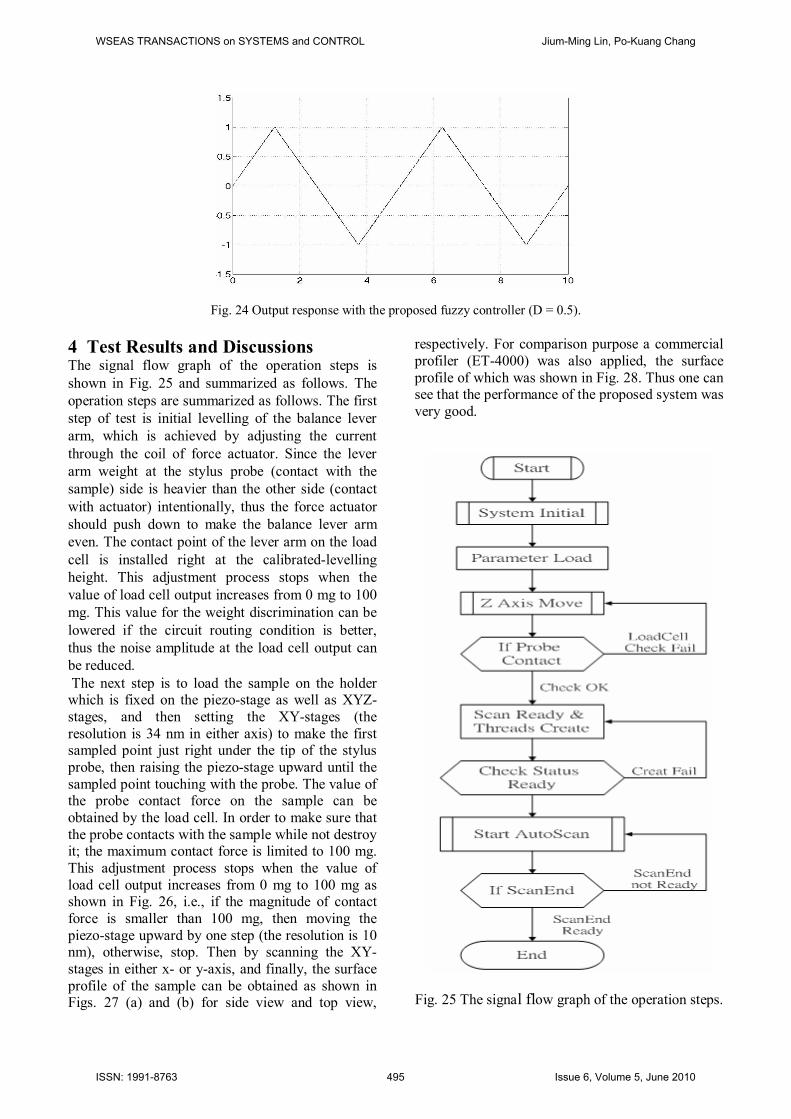
Fig. 24 Output response with the proposed fuzzy controller (D = 0.5).
4 Test Results and Discussions The signal flow graph of the operation steps is shown in Fig. 25 and summarized as follows. The operation steps are summarized as follows. The first step of test is initial levelling of the balance lever arm, which is achieved by adjusting the current through the coil of force actuator. Since the lever arm weight at the stylus probe (contact with the sample) side is heavier than the other side (contact with actuator) intentionally, thus the force actuator should push down to make the balance lever arm even. The contact point of the lever arm on the load cell is installed right at the calibrated-levelling height. This adjustment process stops when the value of load cell output increases from 0 mg to 100 mg. This value for the weight discrimination can be lowered if the circuit routing condition is better, thus the noise amplitude at the load cell output can be reduced. The next step is to load the sample on the holder which is fixed on the piezo-stage as well as XYZ-stages, and then setting the XY-stages (the resolution is 34 nm in either axis) to make the first sampled point just right under the tip of the stylus probe, then raising the piezo-stage upward until the sampled point touching with the probe. The value of the probe contact force on the sample can be obtained by the load cell. In order to make sure that the probe contacts with the sample while not destroy it; the maximum contact force is limited to 100 mg. This adjustment process stops when the value of load cell output increases from 0 mg to 100 mg as shown in Fig. 26, i.e., if the magnitude of contact force is smaller than 100 mg, then moving the piezo-stage upward by one step (the resolution is 10 nm), otherwise, stop. Then by scanning the XY-stages in either x- or y-axis, and finally, the surface profile of the sample can be obtained as shown in Figs. 27 (a) and (b) for side view and top view,
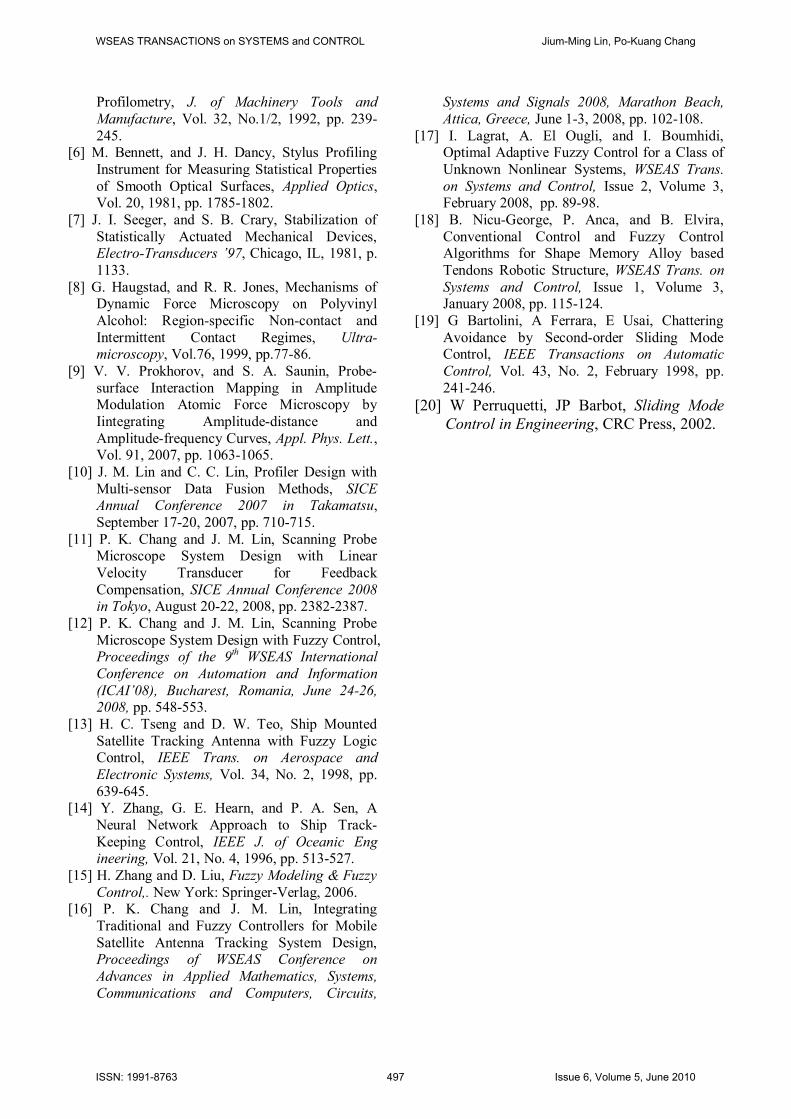
respectively. For comparison purpose a commercial profiler (ET-4000) was also applied, the surface profile of which was shown in Fig. 28. Thus one can see that the performance of the proposed system was very good.
Fig. 25 The signal flow graph of the operation steps.
WSEAS TRANSACTIONS on SYSTEMS and CONTROL Jium-Ming Lin, Po-Kuang Chang
ISSN: 1991-8763 495 Issue 6, Volume 5, June 2010
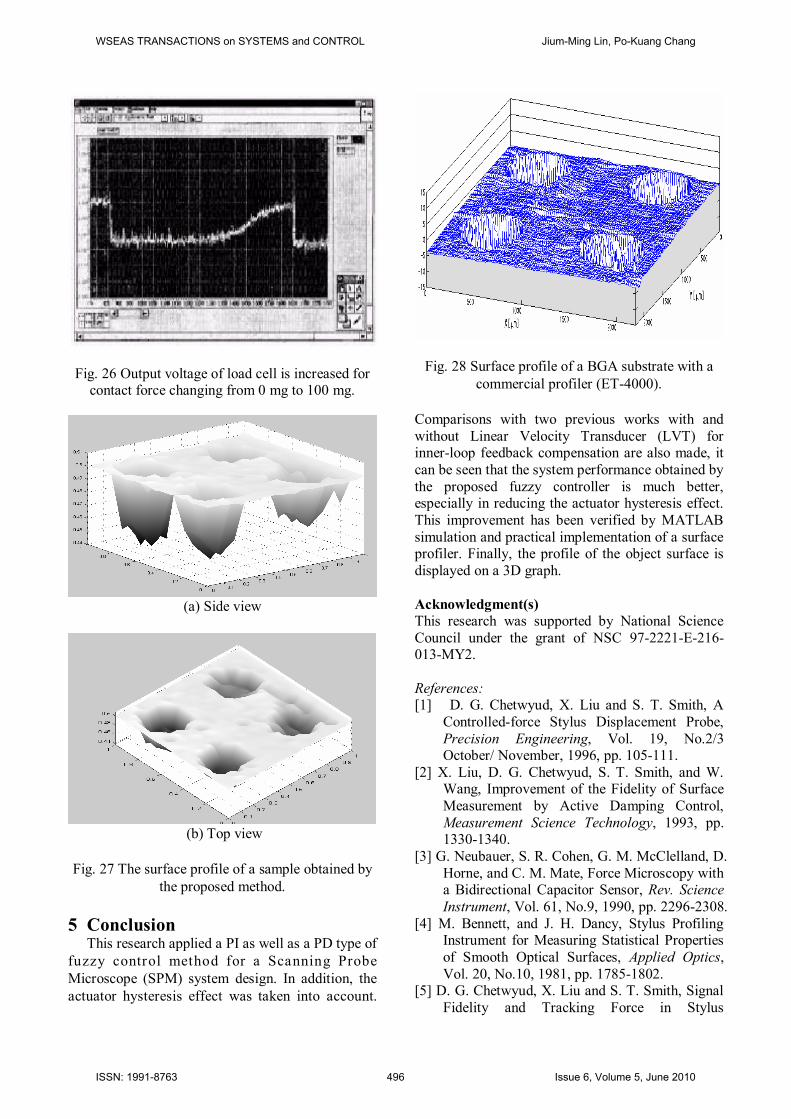
Fig. 26 Output voltage of load cell is increased for contact force changing from 0 mg to 100 mg.
(a) Side view
(b) Top view
Fig. 27 The surface profile of a sample obtained by
the proposed method.
5 Conclusion This research applied a PI as well as a PD type of
fuzzy control method for a Scanning Probe Microscope (SPM) system design. In addition, the actuator hysteresis effect was taken into account.
Fig. 28 Surface profile of a BGA substrate with a commercial profiler (ET-4000).
Comparisons with two previous works with and without Linear Velocity Transducer (LVT) for inner-loop feedback compensation are also made, it can be seen that the system performance obtained by the proposed fuzzy controller is much better, especially in reducing the actuator hysteresis effect. This improvement has been verified by MATLAB simulation and practical implementation of a surface profiler. Finally, the profile of the object surface is displayed on a 3D graph. Acknowledgment(s) This research was supported by National Science Council under the grant of NSC 97-2221-E-216- 013-MY2. References: [1] D. G. Chetwyud, X. Liu and S. T. Smith, A
Controlled-force Stylus Displacement Probe, Precision Engineering, Vol. 19, No.2/3 October/ November, 1996, pp. 105-111.
[2] X. Liu, D. G. Chetwyud, S. T. Smith, and W. Wang, Improvement of the Fidelity of Surface Measurement by Active Damping Control, Measurement Science Technology, 1993, pp. 1330-1340.
[3] G. Neubauer, S. R. Cohen, G. M. McClelland, D. Horne, and C. M. Mate, Force Microscopy with a Bidirectional Capacitor Sensor, Rev. Science Instrument, Vol. 61, No.9, 1990, pp. 2296-2308.
[4] M. Bennett, and J. H. Dancy, Stylus Profiling Instrument for Measuring Statistical Properties of Smooth Optical Surfaces, Applied Optics, Vol. 20, No.10, 1981, pp. 1785-1802.
[5] D. G. Chetwyud, X. Liu and S. T. Smith, Signal Fidelity and Tracking Force in Stylus
WSEAS TRANSACTIONS on SYSTEMS and CONTROL Jium-Ming Lin, Po-Kuang Chang
ISSN: 1991-8763 496 Issue 6, Volume 5, June 2010
Profilometry, J. of Machinery Tools and Manufacture, Vol. 32, No.1/2, 1992, pp. 239-245.
[6] M. Bennett, and J. H. Dancy, Stylus Profiling Instrument for Measuring Statistical Properties of Smooth Optical Surfaces, Applied Optics, Vol. 20, 1981, pp. 1785-1802.
[7] J. I. Seeger, and S. B. Crary, Stabilization of Statistically Actuated Mechanical Devices, Electro-Transducers ’97, Chicago, IL, 1981, p. 1133.
[8] G. Haugstad, and R. R. Jones, Mechanisms of Dynamic Force Microscopy on Polyvinyl Alcohol: Region-specific Non-contact and Intermittent Contact Regimes, Ultra-microscopy, Vol.76, 1999, pp.77-86.
[9] V. V. Prokhorov, and S. A. Saunin, Probe-surface Interaction Mapping in Amplitude Modulation Atomic Force Microscopy by Iintegrating Amplitude-distance and Amplitude-frequency Curves, Appl. Phys. Lett., Vol. 91, 2007, pp. 1063-1065.
[10] J. M. Lin and C. C. Lin, Profiler Design with Multi-sensor Data Fusion Methods, SICE Annual Conference 2007 in Takamatsu, September 17-20, 2007, pp. 710-715.
[11] P. K. Chang and J. M. Lin, Scanning Probe Microscope System Design with Linear Velocity Transducer for Feedback Compensation, SICE Annual Conference 2008 in Tokyo, August 20-22, 2008, pp. 2382-2387.
[12] P. K. Chang and J. M. Lin, Scanning Probe Microscope System Design with Fuzzy Control, Proceedings of the 9th WSEAS International Conference on Automation and Information (ICAI’08), Bucharest, Romania, June 24-26, 2008, pp. 548-553.
[13] H. C. Tseng and D. W. Teo, Ship Mounted Satellite Tracking Antenna with Fuzzy Logic Control, IEEE Trans. on Aerospace and Electronic Systems, Vol. 34, No. 2, 1998, pp. 639-645.
[14] Y. Zhang, G. E. Hearn, and P. A. Sen, A Neural Network Approach to Ship Track- Keeping Control, IEEE J. of Oceanic Eng ineering, Vol. 21, No. 4, 1996, pp. 513-527.
[15] H. Zhang and D. Liu, Fuzzy Modeling & Fuzzy Control,. New York: Springer-Verlag, 2006.
[16] P. K. Chang and J. M. Lin, Integrating Traditional and Fuzzy Controllers for Mobile Satellite Antenna Tracking System Design, Proceedings of WSEAS Conference on Advances in Applied Mathematics, Systems, Communications and Computers, Circuits,
Systems and Signals 2008, Marathon Beach, Attica, Greece, June 1-3, 2008, pp. 102-108.
[17] I. Lagrat, A. El Ougli, and I. Boumhidi, Optimal Adaptive Fuzzy Control for a Class of Unknown Nonlinear Systems, WSEAS Trans. on Systems and Control, Issue 2, Volume 3, February 2008, pp. 89-98.
[18] B. Nicu-George, P. Anca, and B. Elvira, Conventional Control and Fuzzy Control Algorithms for Shape Memory Alloy based Tendons Robotic Structure, WSEAS Trans. on Systems and Control, Issue 1, Volume 3, January 2008, pp. 115-124.
[19] G Bartolini, A Ferrara, E Usai, Chattering Avoidance by Second-order Sliding Mode Control, IEEE Transactions on Automatic Control, Vol. 43, No. 2, February 1998, pp. 241-246.
[20] W Perruquetti, JP Barbot, Sliding Mode Control in Engineering, CRC Press, 2002.
WSEAS TRANSACTIONS on SYSTEMS and CONTROL Jium-Ming Lin, Po-Kuang Chang
ISSN: 1991-8763 497 Issue 6, Volume 5, June 2010