Integrating field data and remote sensing to study secondary forests in Amazonian rural settlements...
19
Integrating field data and remote sensing to study secondary forests in Amazonian rural settlements Mateus Batistella ([email protected]) Embrapa Satellite Monitoring/ Indiana University- ACT LBA LC-09
-
Upload
clarence-french -
Category
Documents
-
view
215 -
download
0
Transcript of Integrating field data and remote sensing to study secondary forests in Amazonian rural settlements...

Integrating field data and remote sensing to study
secondary forests in Amazonian rural settlements
Mateus Batistella ([email protected])
Embrapa Satellite Monitoring/ Indiana University-ACT
LBA LC-09

LC-09 Study Sites

Machadinho d’Oeste and Vale do Anari in the State of Rondônia
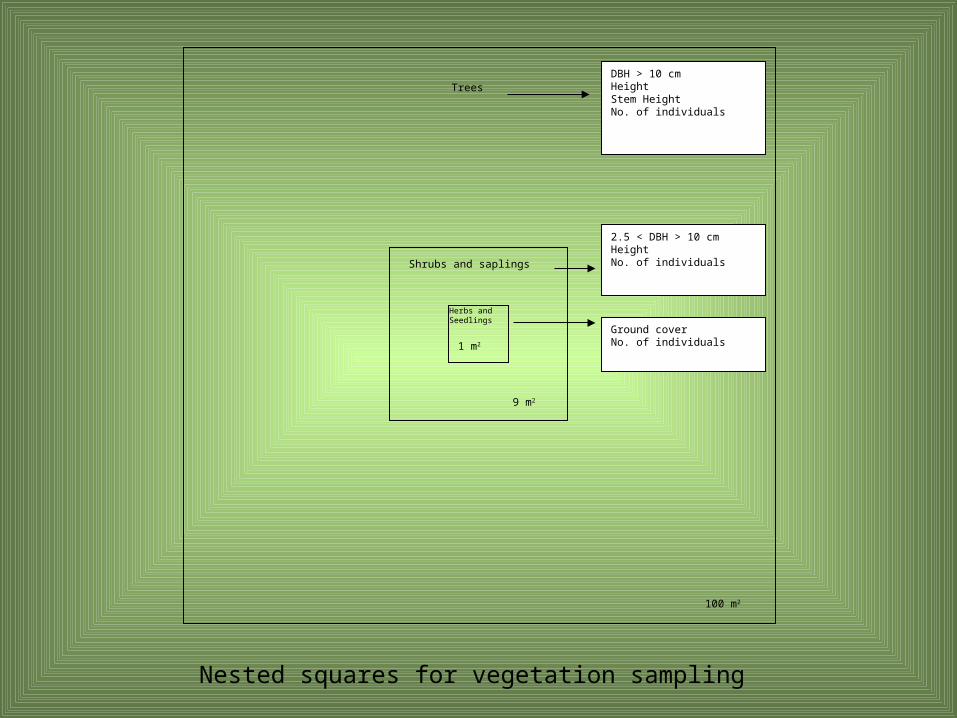
1 m2
9 m2
100 m2
Herbs andSeedlings
Shrubs and saplings
TreesDBH > 10 cmHeightStem HeightNo. of individuals
2.5 < DBH > 10 cmHeightNo. of individuals
Ground coverNo. of individuals
Nested squares for vegetation sampling

Analytical Criteria
Vegetation sampling Spectral data extraction
DBH Height Stem height
Number of individuals
Basal area
Density Biomass
Spectral curves
Separability Contingency
Statistical Analysis
Database
Plot samples
Vegetation structure analysis Spectral analysis
Integration of vegetation structure and spectral data analysis

Relationships between database tables


Mean S.D. Min. Max.
Density of trees (individuals/ha) 266.7 231.9 33.3 533.3
Density of saplings (individuals/ha) 7460.3 2022.1 4074.1 10000.0
Density of saplings / density of trees 88.8 110.7 7.6 300.0
DBH of trees (cm) 11.4 0.8 10.0 12.4
DBH of saplings (cm) 4.3 0.3 3.7 4.6
Basal area of trees (m2/ha) 2.7 1.3 0.0 4.0
Basal area of saplings (m2/ha) 5.1 1.3 2.4 6.3
Total basal area (m2/ha) 7.8 2.1 4.6 9.8
Percent tree contribution to total basal area 33.5 15.6 0.0 47.7
Percent sapling contribution to total basal area 66.5 15.6 52.3 100. 0
Total height of trees (m) 7.8 1.4 5.5 9.6
Total height of saplings (m) 4.8 0.5 4.3 5.8
Stem height of trees (m) 5.4 1.4 3.5 7.0
Biomass of trees (t/ha) 28.3 14.2 0.0 38.0
Biomass of saplings (t/ha) 0.9 0.1 0.7 1.1
Total biomass (t/ha) 29.2 14.3 0.9 39.1


Mean S.D. Min. Max.
Density of trees (individuals/ha) 763.3 283.0 300.0 1233.3
Density of saplings (individuals/ha) 4814.8 1719.5 1481.5 7037.0
Density of saplings / density of trees 7.8 5.2 1.2 19.7
DBH of trees (cm) 13.8 1.2 12.1 15.3
DBH of saplings (cm) 4.7 0.6 4.0 5.7
Basal area of trees (m2/ha) 5.0 0.8 3.9 6.2
Basal area of saplings (m2/ha) 6.4 1.6 4.7 9.5
Total basal area (m2/ha) 11.5 1.8 9.4 15.7
Percent tree contribution to total basal area 44.4 7.3 33.9 55.2
Percent sapling contribution to total basal area 55.6 7.3 33.9 55.2
Total height of trees (m) 10.1 0.6 8.7 10.7
Total height of saplings (m) 5.1 0.4 4.4 5.6
Stem height of trees (m) 6.6 0.9 5.2 8.0
Biomass of trees (t/ha) 63.6 13.4 44.6 80.7
Biomass of saplings (t/ha) 1.1 0.2 0.9 1.5
Total biomass (t/ha) 64.7 13.4 45.7 82.2

Mean S.D. Min. Max.
Density of trees (individuals/ha) 920.8 276.0 666.7 1333.3
Density of saplings (individuals/ha) 3750.0 1392.0 2222.2 6666.7
Density of saplings / density of trees 4.5 2.4 1. 7 9.1
DBH of trees (cm) 17.1 1.1 15.2 18.6
DBH of saplings (cm) 5.0 0.7 3. 9 6.1
Basal area of trees (m2/ha) 6.9 1.5 4.5 9.1
Basal area of saplings (m2/ha) 6.7 2.2 3.8 10.8
Total basal area (m2/ha) 13.6 2.9 8.9 17.4
Percent tree contribution to total basal area 51.1 9.0 37.9 64.2
Percent sapling contribution to total basal area 48.9 9.0 35.8 62.1
Total height of trees (m) 13.0 1.1 11.3 14.8
Total height of saplings (m) 5.7 0.8 4.4 6.9
Stem height of trees (m) 9.8 1.9 7.6 12.9
Biomass of trees (t/ha) 124.1 20.8 94.5 151.3
Biomass of saplings (t/ha) 1.3 0.3 0.8 1.7
Total biomass (t/ha) 125.4 20.7 95.7 152.4

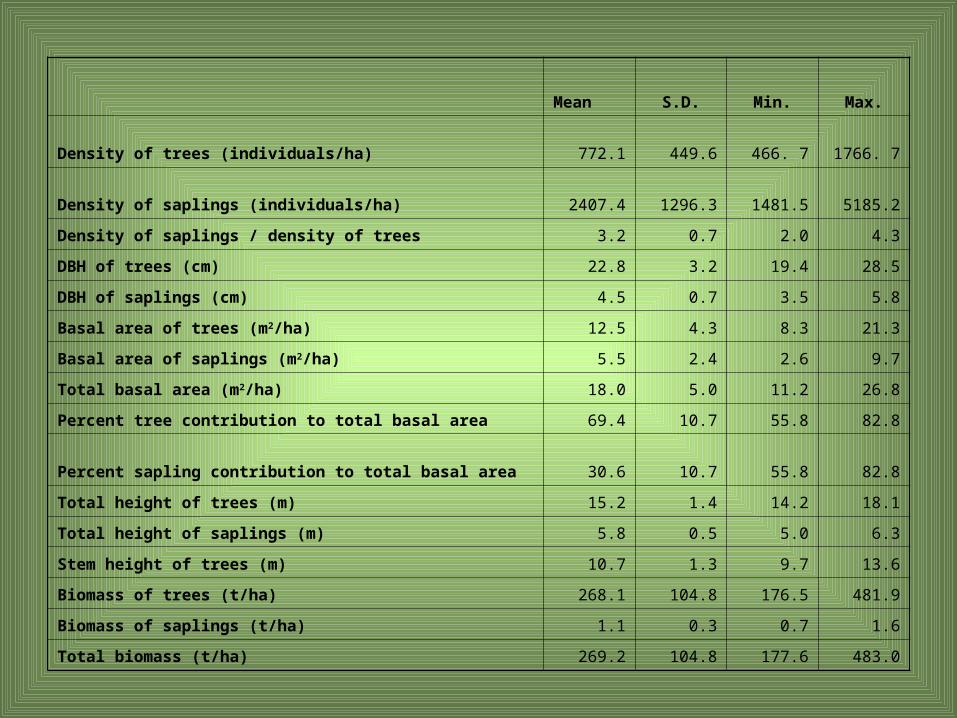
Mean S.D. Min. Max.
Density of trees (individuals/ha) 772.1 449.6 466. 7 1766. 7
Density of saplings (individuals/ha) 2407.4 1296.3 1481.5 5185.2
Density of saplings / density of trees 3.2 0.7 2.0 4.3
DBH of trees (cm) 22.8 3.2 19.4 28.5
DBH of saplings (cm) 4.5 0.7 3.5 5.8
Basal area of trees (m2/ha) 12.5 4.3 8.3 21.3
Basal area of saplings (m2/ha) 5.5 2.4 2.6 9.7
Total basal area (m2/ha) 18.0 5.0 11.2 26.8
Percent tree contribution to total basal area 69.4 10.7 55.8 82.8
Percent sapling contribution to total basal area 30.6 10.7 55.8 82.8
Total height of trees (m) 15.2 1.4 14.2 18.1
Total height of saplings (m) 5.8 0.5 5.0 6.3
Stem height of trees (m) 10.7 1.3 9.7 13.6
Biomass of trees (t/ha) 268.1 104.8 176.5 481.9
Biomass of saplings (t/ha) 1.1 0.3 0.7 1.6
Total biomass (t/ha) 269.2 104.8 177.6 483.0

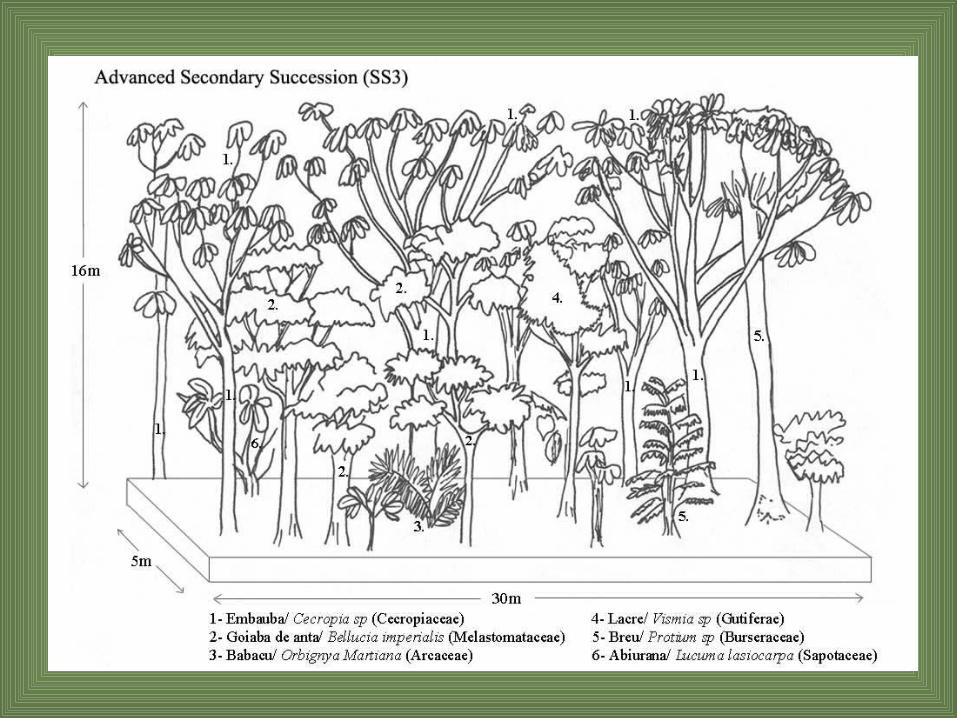
Findings for vegetation parameters
• DBH, basal area, height, and biomass of trees and saplings increase from SS1 up to forest. As also expected, there are overlaps between minimum and maximum values
• The density of trees increases from SS1 to SS3, but decreases at forest sites. Dominant species at SS3 (e.g., Cecropia sp.) die off during the transition to forest. Also, at the forest community, trees continue to grow in DBH and height but the number of individuals decrease. The trend for density of saplings is the opposite. It constantly decreases from initial stages of regrowth up to forest indicating the importance of trees in more advanced recovery stages

Spectral curves for each group of plot samples

Vegetation Structure Spectral Responses

Conclusions
• SS1, SS2, SS3, and forest plots were well separated when using solely the data for vegetation structure (p<0.001)
• Analyses of reflectance on selected TM bands allowed the separation of only three of these classes (SS1 and SS2 mixed together, SS3, and forest).
• Vegetation structure is a better indicator than age for the discrimination of secondary succession stages

Ground cover data can provide useful information for secondary forest
classification, particularly as a support for spectral mixture analysis
Hypothesis to be tested
Dar, what do you think?