Integrated Status and Effectiveness Monitoring Program- Entiat River … · 2018-04-11 ·...
88
Integrated Status and Effectiveness Monitoring Program- Entiat River Intensively Monitored Watershed Study, 2012. January 2012- January 2013 Prepared by: Hayley Potter Tom Desgroseillier Cal Yonce Jordan Sanford RD Nelle U.S. Fish and Wildlife Service Mid-Columbia River Fishery Resource Office 7501 Icicle Rd. Leavenworth, WA 98826 Funded by U.S. Department of Energy Bonneville Power Administration Division of Fish and Wildlife Portland, OR. 97208-3621 Project No. 2003-017-00 Contract No. 41045 February 11, 2013
Transcript of Integrated Status and Effectiveness Monitoring Program- Entiat River … · 2018-04-11 ·...

Integrated Status and Effectiveness
Monitoring Program- Entiat River
Intensively Monitored Watershed Study,
2012.
January 2012- January 2013
Prepared by:
Hayley Potter
Tom Desgroseillier
Cal Yonce
Jordan Sanford
RD Nelle
U.S. Fish and Wildlife Service
Mid-Columbia River Fishery Resource Office
7501 Icicle Rd.
Leavenworth, WA 98826
Funded by
U.S. Department of Energy
Bonneville Power Administration
Division of Fish and Wildlife
Portland, OR. 97208-3621
Project No. 2003-017-00
Contract No. 41045
February 11, 2013

2
Abstract
During 2012, the Mid-Columbia Fishery Resource Office operated two rotary screw traps,
conducted two mark-recapture studies in the mainstem Entiat River, conducted three mark-
recapture studies within off-channel habitats, operated and maintained six stream-width Passive
Integrated Transponder tag interrogation sites and conducted steelhead redd surveys on the Entiat
River as part of the Integrated Status and Effectiveness Monitoring Program’s Entiat River
Intensively Monitored Watershed study. Screw trap operations were conducted between March
and November and caught a total of 19,295 fish. The Entiat River mark-recapture study collected
12,636 juvenile fish species at 26 locations along the main stem Entiat and Mad Rivers. The off-
channel habitat study resulted in the capture of 6,795 juvenile fish. In 2012, a total of 38,754 fish
were captured and 25,170 wild salmonids were marked with Passive Integrated Transponder
tags. Six Passive Integrated Transponder tag interrogation sites were operated within the Entiat
River throughout this reporting period resulting in a total of 2,510 unique detections. Six Passive
Integrated Transponder tag antennas were used to monitor juvenile fish use in three off-channel
habitats and a total of 1,238 unique detections were recorded. Steelhead redd surveys were
conducted from February 4 to May 10, 2012. The first redd was observed on March 22, 2012. A
total of 77 redds were observed in the lower 45 km of the river.

3
Table of Contents List of Figures ..................................................................................................................... 4
List of Tables ...................................................................................................................... 6
List of Appendices .............................................................................................................. 9
Introduction ....................................................................................................................... 10
Study Area ........................................................................................................................ 12
Methods-Rotary Screw Trap ............................................................................................. 13
Results-Rotary Screw Trap ............................................................................................... 17
Discussion-Rotary Screw Trap ......................................................................................... 23
Methods- Mark-Recapture Sampling ................................................................................ 24
Results – Mark-Recapture Sampling ................................................................................ 29
Discussion- Mark-Recapture Sampling ............................................................................ 36
Methods- Off-Channel Habitat Study ............................................................................... 38
Results- Off-Channel Habitat Study ................................................................................. 41
Discussion- Off-Channel Habitat Study ........................................................................... 48
Methods- PIT Tag Interrogation Site Monitoring ............................................................. 50
Results- PIT Tag Interrogation Site Monitoring ............................................................... 52
Discussion- PIT Tag Interrogation Site Monitoring ......................................................... 55
Methods- Steelhead Redd Surveys ................................................................................... 56
Results- Steelhead Redd Surveys...................................................................................... 58
Discussion- Steelhead Redd Surveys ................................................................................ 66
Acknowledgements ........................................................................................................... 69
References ......................................................................................................................... 70
Appendix ........................................................................................................................... 72

4
List of Figures
Figure 1. Map of the Entiat River from its mouth to Entiat Falls at river kilometer 54. ............ 13
Figure 2. Map of the rotary screw trap locations in the Entiat River, 2012. ............................... 14
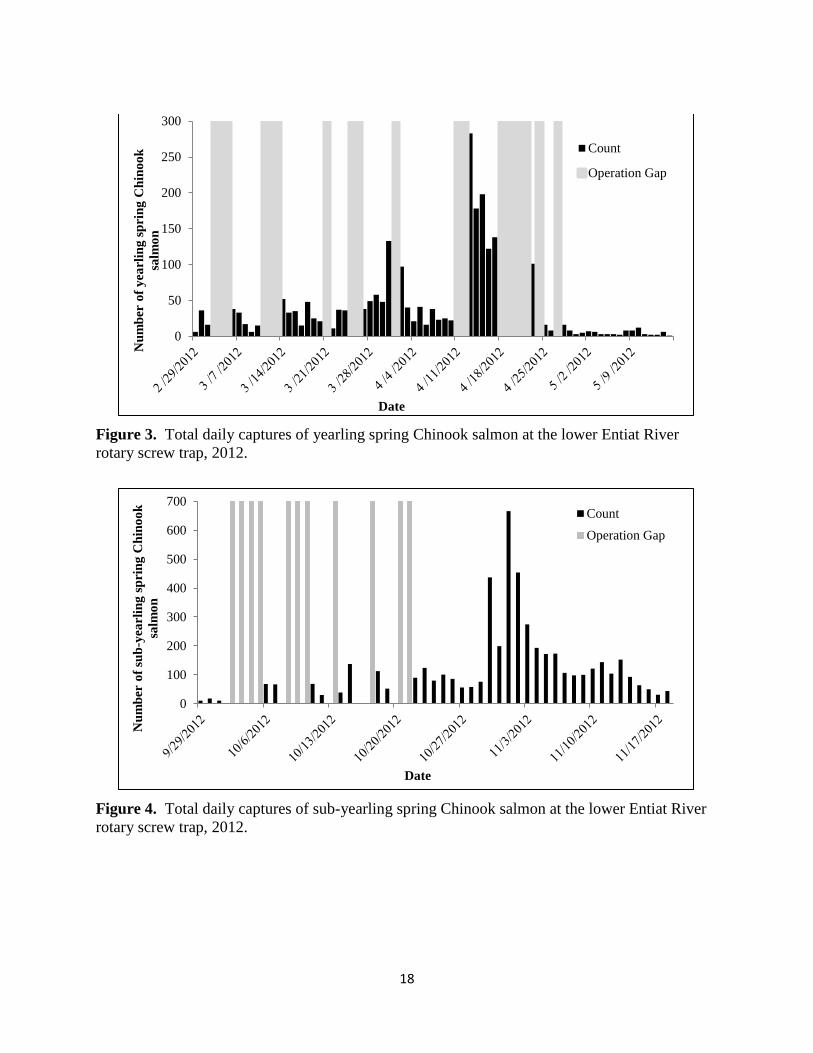
Figure 3. Total daily captures of yearling spring Chinook salmon at the lower Entiat River
rotary screw trap, 2012. ................................................................................................................ 18
Figure 4. Total daily captures of sub-yearling spring Chinook salmon at the lower Entiat River
rotary screw trap, 2012. ................................................................................................................ 18
Figure 5. Total daily captures of summer Chinook salmon at lower Entiat River rotary screw
trap, 2012. ..................................................................................................................................... 19
Figure 6. Total daily captures of steelhead at the lower Entiat River rotary screw trap, 2012. .. 19
Figure 7. Average daily flow (m3/s) and temperature (˚C) for the lower Entiat River rotary
screw trap, 2012. ........................................................................................................................... 23
Figure 8. Map of the mark-recapture sites sampled during the winter period in the Entiat River,
2012............................................................................................................................................... 25
Figure 9. Map of the mark-recapture sites sampled during the summer period in the Entiat
River, 2012. ................................................................................................................................... 26
Figure 10. Entiat River average daily flow (m3/s) during winter period mark-recapture
sampling, 2012. ............................................................................................................................. 30
Figure 11. Entiat River average daily flow (m3/s) during summer period mark-recapture
sampling, 2012. ............................................................................................................................. 32
Figure 12. Map of the Entiat River watershed defining locations of the three off-channel study
sites sampled, 2012. ...................................................................................................................... 39
Figure 13. Mean fork lengths (mm) for Chinook salmon and steelhead at PUD canal (PUD),
SanRay (SAN) and Wilson Side Channel (WLS), 2012. Note: PUD canal was not sampled
during the winter survey. .............................................................................................................. 42
Figure 14. Mean condition factor (K) for Chinook salmon and steelhead at PUD canal (PUD),
SanRay (SAN) and Wilson Side Channel (WLS), 2012. Note: PUD canal was not sampled
during the winter survey. .............................................................................................................. 43
Figure 15. Temperature (oC) and dissolved oxygen (mg/L) in the PUD side channel, 2012. .... 47

5
Figure 16. Temperature (oC) and dissolved oxygen (mg/L) in the SanRay side channel, 2012. 47
Figure 17. Temperature (oC) and dissolved oxygen (mg/L) in Wilson side channel, 2012. ....... 48
Figure 18. Map of the locations of PIT tag interrogation sites in the Entiat River, 2012. .......... 51
Figure 19. The four reaches of steelhead redd surveys on the Entiat River, 2012. .................... 57
Figure 20. Diagram showing Lateral Secchi Disk visibility measurement................................. 58
Figure 21. The numbers of steelhead redds observed by month in the Entiat River from 2006 to
2012............................................................................................................................................... 61
Figure 22. Locations of steelhead redds observed in Reach A during surveys conducted by
USFWS on the Entiat River, 2012. ............................................................................................... 62
Figure 23. Locations of steelhead redds observed in Reach B during surveys conducted by the
USFWS on the Entiat River, 2012. ............................................................................................... 63
Figure 24. Locations of steelhead redds observed in Reach C during surveys conducted by the
USFWS on the Entiat River, 2012. ............................................................................................... 64
Figure 25. No steelhead redds were observed in Reach D during surveys conducted by the
USFWS on the Entiat River, 2012. ............................................................................................... 65
6
List of Tables
Table 1. Number of fish captured and PIT tagged at Entiat River rotary screw trap locations,
2012............................................................................................................................................... 17
Table 2. Mean fork lengths (mm), weights (g), and body condition factor (K) for spring
Chinook salmon captured at the lower Entiat River rotary screw trap, 2012. .............................. 20
Table 3. Mean fork lengths (mm), weights (g), and body condition factor (K) for summer
Chinook salmon and steelhead captured at the lower Entiat River rotary screw trap, 2012. ....... 20
Table 4. Estimated capture efficiency of PIT tagged yearling spring Chinook salmon at the
lower Entiat River rotary screw trap with average (sunrise to sunset) flow from the USGS
Keystone gauging station, 2012. ................................................................................................... 20
Table 5. Estimated capture efficiency of PIT tagged sub-yearling spring Chinook salmon at the
lower Entiat River rotary screw trap with average (sunrise to sunset) flow from the USGS
Keystone gauging station, 2012. ................................................................................................... 21
Table 6. Estimated capture efficiency of PIT tagged summer Chinook salmon at the lower
Entiat River rotary screw trap with average (sunrise to sunset) flow from the USGS Keystone
gauging station, 2012. ................................................................................................................... 21
Table 7. Estimated capture efficiency of PIT tagged steelhead at the lower Entiat River rotary
screw trap with average (sunrise to sunset) flow from the USGS Keystone gauging station, 2012.
....................................................................................................................................................... 22
Table 8. Estimated capture efficiency of dye marked summer Chinook salmon at the lower
Entiat River rotary screw trap with average (sunrise to sunset) flow from the USGS Keystone
gauging station, 2012. ................................................................................................................... 22
Table 9. Number of fish captured and PIT tagged from the winter mark-recapture sample
period, 2012. ................................................................................................................................. 30
Table 10. Mean fork lengths (mm), weights (g), and body condition factor (K) for spring
Chinook salmon and steelhead captured in the winter mark-recapture sample period, 2012. ...... 31
Table 11. Number of fish captured and PIT tagged from the summer mark-recapture sample
period, 2012. ................................................................................................................................. 32
Table 12. Mean fork lengths (mm), weights (g), and body condition factor (K) for Chinook
salmon (unknown run) and steelhead captured in the summer mark-recapture sample period,
2012............................................................................................................................................... 33
Table 13. Point estimates of abundance for Chinook salmon and steelhead captured at mark-
recapture sites sampled during the winter period, 2012. .............................................................. 34

7
Table 14. Point estimates of abundance for Chinook salmon and steelhead captured at mark-
recapture sites sampled during the summer period, 2012. ............................................................ 35
Table 15. Estimated specific growth rates (mm/day) and SD for juvenile Chinook salmon and
steelhead captured during mark-recapture sampling per residence river and growth period, 2012.
....................................................................................................................................................... 36
Table 16. Total number of fish captured at PUD canal (PUD), SanRay (SAN) and Wilson Side
Channel (WLS), 2012. .................................................................................................................. 41
Table 17. Capture related mortality during the off-channel study at PUD canal (PUD), SanRay
(SAN) and Wilson Side Channel (WLS), 2012. ........................................................................... 43
Table 18. PIT tagging mortality at PUD canal (PUD), SanRay (SAN) and Wilson Side Channel
(WLS), 2012 ................................................................................................................................. 44
Table 19. Point estimates of abundance for Chinook salmon and steelhead captured in PUD
canal (PUD), SanRay (SAN) and Wilson Side Channel (WLS), 2012. ....................................... 44
Table 20. Totals of unique PIT tag detections by species for the PUD side-channel, 2012. ...... 45
Table 21. Totals of unique PIT tag detections by species for the SanRay side-channel, 2012. .. 45
Table 22. Totals of unique PIT tag detections by species for Wilson side-channel, 2012. ........ 46
Table 23. Combined unique detections from all interrogation sites within the Entiat watershed,
2012. PTAGIS naming convention used to indicate species, run and rear type. .......................... 53
Table 24. Origin of juvenile fish detected at interrogation sites within the Entiat River, 2012.
PTAGIS naming convention used to indicate species, run and rear type. .................................... 54
Table 25. Origin of adult fish detected at interrogation sites within the Entiat River, 2012.
PTAGIS naming convention used to indicate species, run and rear type. .................................... 55
Table 26. Steelhead spawning ground reaches on the Entiat River in 2012. .............................. 57
Table 27. Ranges and means of temperature (°C), Secchi disk lateral visibility (m), turbidity
(NTU), and water clarity of the Entiat River during steelhead redd surveys, 2012. .................... 59
Table 28. The numbers of new steelhead redds counted each week and cumulative totals in the
survey reaches on the Entiat River, 2012...................................................................................... 60
Table 29. The total number of steelhead redds by reach on the Entiat River from 2006 to 2012.
....................................................................................................................................................... 61

8
Table 30. Number of redds observed in close proximity to restoration sites in reach A of the
Entiat River, 2006 through 2012. .................................................................................................. 66

9
List of Appendices
Appendix Table 1. Summary of nonoperational days for the lower Entiat River rotary screw
trap, 2012. ..................................................................................................................................... 72
Appendix Table 2. Summary of fish species captured in the Entiat River rotary screw trap,
2012............................................................................................................................................... 75
Appendix Table 3. Annual dates of inclusion for yearling and sub-yearling Chinook species
used in rotary screw trap based Entiat River production estimates, capture years 2003 to 2012. 76
Appendix Table 4. Mark-recapture site locations, dates sampled, average flow (m3/s),
maximum water temperature (˚C) and sampling notes during the winter 2012 sampling period. 77
Appendix Table 5. Number of fish captured and mortalities during the winter 2012 mark
recapture study in the Entiat and Mad rivers. ............................................................................... 78
Appendix Table 6. Mark-recapture site locations, dates sampled, average flow (m3/s),
maximum water temperature (˚C) and sampling notes during the summer 2012 sampling period.
....................................................................................................................................................... 79
Appendix Table 7. Number of fish captured and mortalities during the summer 2012 mark
recapture study in the Entiat and Mad rivers. ............................................................................... 80
Appendix Table 8. Site operational summary for the lower Entiat River interrogation site
(ENL) during the 2012 monitoring period. ................................................................................... 81
Appendix Table 9. Site operational summary for the Entiat River interrogation site at
Ardenvoir (ENA) during the 2012 monitoring period. ................................................................. 82
Appendix Table 10. Site operational summary for the middle Entiat River interrogation site
(ENM) during the 2012 monitoring period. .................................................................................. 84
Appendix Table 11. Site operational summary for the Entiat River interrogation site near
Stormy Creek (ENS) during the 2012 monitoring period ............................................................. 86
Appendix Table 12. Site operational summary for the Entiat River Forest Service boundary
interrogation site (ENF) during the 2012 monitoring period. ....................................................... 87
Appendix Table 13. Site operational summary for the Mad River interrogation site (MAD)
during the 2012 monitoring period. .............................................................................................. 88

10
Introduction
The Integrated Status and Effectiveness Monitoring Program (ISEMP – BPA project #2003-
0017) was created as a cost effective means of developing protocols and new technologies, novel
indicators, sample designs, analytical, data management and communication tools and skills, and
restoration experiments. ISEMP activities support the development of region-wide Research,
Monitoring and Evaluation (RME) programs to assess the status of anadromous salmonid
populations, their tributary habitat and restoration and management actions.
The intent of the ISEMP project is to design monitoring programs that can efficiently collect
information to address multiple management objectives over a broad range of scales. As well as
status and trends monitoring, ISEMP is evaluating the benefits of habitat restoration actions to
fish populations across the Columbia River Basin by implementing Intensively Monitored
Watershed (IMW) studies. IMWs have been established in three pilot subbasins: Entiat River,
WA; Bridge Creek, John Day River, OR; and Lemhi River, ID.
An IMW is a watershed-scale coordinated restoration effort with an associated effectiveness
monitoring program (Bilby et al. 2004, PNAMP 2005) implemented in an experimental fashion
to maximize the ability to detect fish responses to changes in their habitat (Bilby et al. 2005;
Roni et al. 2005; Reeve et al. 2006). In addition, intensive monitoring is used to identify
mechanisms by which habitat manipulations impact fish, so that these strategies can be
extrapolated to other systems (Carpenter et al. 1995). An IMW is a powerful approach to answer
cause-and-effect questions at the scale relevant to management (i.e., at the watershed or
population scale). IMWs are designed to address key questions in a disciplined scientific manner,
reduce the complications associated with effectiveness monitoring, increase the
comprehensiveness of monitoring and increase efficiencies through shared responsibilities.
The restoration of the Entiat River subbasin under an IMW study design offers an opportunity to
quantitatively evaluate the effectiveness of habitat restoration actions with regard to improving
salmonid productivity in the Entiat River subbasin. This subbasin meets the prerequisites for an
IMW, such as the feasibility of obtaining quantitative estimates of smolt production, the record
of smolt monitoring, fish species present, and influence of hatchery-produced fish. In addition,
the 2008 Federal Columbia River Power System (FCRPS) Biological Opinion (BiOp) identifies
the Entiat River subbasin as an IMW (RPA 57.1) and the Upper Columbia Spring Chinook
Salmon and Steelhead Recovery Plan (UCSRB 2007) calls for effectiveness monitoring coupled
with adaptive management to assess the effects of habitat actions and recover these listed species
in the Entiat River subbasin.
The work presented in this report is a component of the overall ISEMP, and while it stands alone
as an important contribution to the management of anadromous salmonids and their habitat, it
also plays a key role within ISEMP. Each component of work within ISEMP is reported both
individually and in annual summary reports that present the overall project components in their
programmatic context and shows how the data and tools can be applied to the development of
regionally consistent, efficient and effective RME.
Juvenile outmigration study
The primary goals of this study are to provide long-term monitoring information and to detect
changes due to habitat restoration actions on the juvenile life history characteristics and
11
productivity of spring Chinook salmon Oncorhynchus tshawytscha and steelhead O. mykiss
gairdneri in the Entiat River basin. The study uses rotary screw traps to capture juveniles in
order to quantify abundance, measure physical characteristics, and tag individuals to assess
migration timing and survival throughout the Entiat River and Columbia basin. These data are
incorporated into a regional database that is utilized by area resource managers to compare
attributes both within and between populations located in the Upper Columbia River basin. The
ultimate goal of this study is to guide scientifically sound decisions regarding the future
management of these species.
Entiat River IMW study
The primary goal of the Entiat IMW study is to identify and quantify the effects of habitat
restoration upon response variables for ESA listed spring Chinook salmon and steelhead in the
Entiat River basin. The measured response variables are productivity (emigrant per redd),
emigrant age structure, egg-to-parr survival, parr-to-emigrant survival, annual and seasonal
growth of parr, and alterations in site specific fish density or observed movement of tagged
individuals. The study uses mark-recapture methodologies to quantify and assess each response
variable. The Entiat River IMW study is structured upon previous studies in the subbasin
conducted by the U.S. Fish and Wildlife Service’s Mid-Columbia River Fishery Resource Office
(MCRFRO) which included snorkel surveys and remote fish capture and tagging at the
watershed scale.
Off-Channel Habitat study
The goal of the Entiat River off-channel habitat study is to provide quantitative evaluations of
the effects of existing and proposed off-channel habitats for fish populations. Evaluations include
seasonal assessments of species composition, abundance, site use patterns, species age
composition, growth, and survival. The study utilizes mark-recapture methodologies and Passive
Integrated Transponder (PIT) tag antenna monitoring to quantify the evaluations. Study findings
will be made available to the habitat restoration community in order to increase current
knowledge and better design future off-channel habitat projects within the Entiat watershed.
PIT Tag Interrogation Site monitoring
The goal of PIT tag interrogation site monitoring is to increase the amount of quantifiable data
on PIT tagged adult and juvenile fish species within the Entiat subbasin. This is facilitated
through remote detections, or resightings of PIT tagged fish at six independent interrogation sites
within the Entiat subbasin. Interrogation site monitoring at these sites compliments a multitude
of other projects occurring within the Upper Columbia basin as resighting data from these sites
are made available to resource managers through a regional database. Interrogation data
collected within the Entiat subbasin bolster estimates of juvenile survival and abundance while
providing opportunities to verify key assumptions associated with mark-recapture
methodologies.
Steelhead redd surveys
Steelhead redd surveys serve to track the annual spawning success of adults returning to the
Entiat River. These surveys map the distribution of steelhead redds and allow evaluation of
historic spawning areas and habitat restoration actions. Additionally, total redd counts play a
vital role in calculating annual estimates of juvenile productivity.

12
Study Area
The Entiat River watershed originates from 11 glaciers and snowfields in the Cascade Mountains
and flows southeast approximately 69 km to join the Columbia River at river kilometer (rkm)
778 (CCCD 2004, Mullan et al. 1992). The Entiat watershed is bordered by the Entiat Mountains
to the southwest and the Chelan Mountains to the northeast and drains approximately 1,085 km2.
The topography is steep with unstable erodible soils and vegetation types varying from semi-arid
shrub steppe near the confluence with the Columbia River to temperate forests and alpine
meadows in the headwaters.
Past glacial activity has shaped the Entiat River valley by creating a U-shaped valley upstream of
terminal moraine at rkm 26.1 and V shaped valley downstream (Mullan et al. 1992). The present
upstream limit to anadromy is at Entiat Falls (rkm 54.4) (Figure 1).
The Entiat River watershed supports eight salmonid species including spring and summer
Chinook salmon Oncorhynchus tshawytscha, steelhead and resident rainbow trout O. mykiss
gairdneri, sockeye salmon O. nerka, westslope cutthroat trout O. clarki lewisi, coho salmon O.
kisutch, mountain whitefish Prosopium williamsoni, bull trout Salvelinus confluentus, and
introduced eastern brook trout S. fontinalis. Other fish species include, chiselmouth Acrocheilus
alutaceus, northern pikeminnow Ptychocheilus oregonensis, largescale sucker Catostomus
macrocheilus, bridgelip sucker C. columbianus, speckled dace Rhinichthys osculus, longnose
dace R. cataractae, redside shiner Richardsonius balteatus, sculpin Cottus spp., three-spined
stickleback Gasterosteus aculeatus and Pacific lamprey Entosphenus tridentatus. (Mullan et al
1992, CCCD 2004,).

13
Figure 1. Map of the Entiat River from its mouth to Entiat Falls at river kilometer 54.
Methods-Rotary Screw Trap
Rotary screw trap locations MCRFRO has been operating a rotary screw trap in the Entiat River at rkm 11 near the Entiat
National Fish Hatchery (ENFH) since 2003. Juvenile fish have been captured at other sites within the
Entiat subbasin for PIT tagging since 2005. In addition to these legacy collection sites, MCRFRO
added another rotary screw trap at rkm 2 during the 2007 field season (Figure 2).

14
Figure 2. Map of the rotary screw trap locations in the Entiat River, 2012.
Rotary screw trap operation
Two modified 5 ft. diameter rotary screw traps (EG Solutions Inc.) were used to capture
downstream migrating salmonids. The traps were retrofitted with pontoons from 8 ft. style screw
traps to increase floatation and safety during higher flow. Traps were further modified to include
an access door on the cone of each trap and a high pressure spray system to minimize algal
accumulation upon the screen of the cone. Trap operations followed operational permit
guidelines as per Chelan County Shoreline Management Act (file# SE 06-016 US Fish and
Wildlife Service Fish Enhancement letter dated August 16, 2006), WDFW Temporary Use
Permit (dated 11/27/07), and two Hydraulic Project Approval Permits (log#ST-F8213-01, upper
trap dated 3/18/08 and control#125868-1, lower trap, dated February 06, 2012). Assembled traps
were lowered into the river via a boom truck, attached to one quarter inch aircraft cable, and
anchored upstream to the bases of large cottonwood trees. A concrete road bridge at the upper

15
trap site and a cross- river cable at the lower trap site suspended the anchor cable above the
stream from the anchor point to the trap. A system of winches and pulleys were used to maintain
the traps in fixed positions as flows changed throughout the trapping season. The traps were
operated seven days a week from March through November with allowances for some events. If
possible, traps were operated 24 hours a day; however, during spring high flows and periods of
increased debris loads the traps were operated from sunset to sunrise.
Fish handling
Fish handling procedures were conducted in accordance with WDFW Scientific Collection
Permit #12-117 and #12-178 (annual permits - start date April 3, 2012, expires April 3, 2013);
NOAA Permit 1119 (dated April 10, 2008, expires December 31, 2012); and USFWS sub permit
No. MCRFO-13 (dated Aug 5, 2010, expires December 31, 2013) under Regional Blanket
Permit TE-702631.
At least once a day, juvenile fish were removed from the trap live box and transported within 5
gallon buckets for PIT tagging and biological sampling. The buckets were equipped with aerators
and a light salt solution (1 tbs/gal.) was added to minimize stress during transport and holding.
The fish were transported to Entiat National Fish Hatchery (ENFH) and processed at a
permanent fish handling/tagging station.
Fish collected for biological sampling were anesthetized in a water bath with a measured amount
of tricaine (MS-222) and buffered with sodium bicarbonate. Small groups of fish were
anesthetized at any one time to reduce the chance of incidental mortality from anesthetic
overdose. All fish were identified to species with the exception of sculpin, dace, and suckers. All
salmonids were ascribed a life history stage as either fry (<60 mm), parr (>60 mm and distinctive
parr marks), transitional (>60 mm silver sheen, faint parr marks) or smolt (>60 mm silver sheen
with absent parr marks with possible black tipped caudal). For all other species, a daily minimum
of 30 fish per species and life stage were measured to the nearest mm of fork length and weighed
to the nearest tenth of a gram. All Chinook salmon, steelhead, coho salmon, sockeye salmon, bull
trout, and cutthroat trout were measured to the nearest millimeter of fork length and weighed to
the nearest tenth of a gram. Fulton-type condition factor was calculated for all Chinook and
steelhead as described by Anderson and Gutreuter (1983) using the following calculation:
where K is the Fulton-type condition factor, W is the individual fish weight and L is the
individual fish length.
After handling, all species were allowed to fully recover prior to release. Non-tagged individuals
were released approximately 400 meters downstream from the trap of capture after a minimum
of one hour recovery time.
PIT tagging of juvenile fish followed the procedures and file submission requirements outlined
by Pacific State Marine Fisheries Commission PIT Tag Information System (PTAGIS). Fish
were tagged using a disinfected hollow needle to insert the PIT tag into the abdominal cavity.
Individuals measuring between 50 and 60 mm in fork length were tagged with a 9 mm PIT tag
16
(ISO tag model TX148511B operating at 134.2 kHz and weighing 0.065 g) and individuals
greater than 60 mm were tagged with a 12.5 mm PIT tag (ISO tag model TX1411SST operating
at 134.2 kHz and weighing 0.102 g). In 2012, Fish Passage Center provided limited PIT tags for
spring Chinook salmon and steelhead as a part of the Comparative Survival Study. Tags for the
remaining Chinook salmon and steelhead were supplied by ISEMP, while Chelan County PUD
provided tags for bull trout, and USFWS supplied PIT tags for cutthroat trout and coho salmon.
Any injuries or abnormalities were noted and juveniles were not PIT tagged if determined to
have had a recent or substantial injury that could be aggravated by tagging. PIT tagged juveniles
were generally held 24 hours to monitor survival and tag retention. A maximum of 72 hours hold
time was instituted on all tagged fish.
Data entry
All fish data were entered into the P3 program from PTAGIS. P3 is a data entry application used
to collect and submit information about marked or recaptured PIT tagged fish in the Columbia
River Basin. USFWS used this program to enter all fish information whether or not the fish was
marked with a PIT tag. P3 serves as a Microsoft Access™ overlay which allows communication
with peripheral devices. USFWS peripheral devices included a Destron Fearing FS2001-ISO
transceiver/antenna for reading PIT tags, a GTCO Calcomp DrawSlate VI digitizing board and a
GSE 350 electronic balance for automating data entry into a laptop computer. Data files
generated from P3 were parsed into a custom Microsoft Access™ database constructed by
MCRFRO staff for the purpose of preparing data for analytical use and various reports. The
original P3 file was left intact and subsequently uploaded to PTAGIS where it is available to
researchers throughout the Columbia River Basin.
Genetic and scale sampling
Throughout the sampling period, a subset of captured bull trout, cutthroat trout, Chinook salmon,
and steelhead juveniles were sampled for genetic and age analysis as suggested within the Upper
Columbia Monitoring Strategy (Hillman 2006). Genetic material was collected by taking a small
clip of tissue was taken from either the ventral fin (steelhead, cutthroat trout & Chinook salmon)
or caudal fin (bull trout). Tissue samples from Chinook salmon, cutthroat trout, steelhead and
bull trout were sent to the Region 1 USFWS genetics lab for archiving and analysis. Scales were
only collected from steelhead and were cataloged and stored on site for future analysis.
Screw trap efficiency
A portion of the collected Chinook salmon and steelhead were used to estimate trap capture
efficiency. Fish from several collection events were pooled and held for up-to 72 hours before
release upstream of the capture location. All fish used for efficiency trials were either PIT tagged
(>50 mm FL) or dye marked (<50 mm FL) with Bismarck Brown Y dye. All marked fish were
placed in a live box for holding (<72 hrs.) prior to release. These fish were then transported to
release sites using 5 gallon buckets with aerators to minimize stress. Juvenile fish used for
efficiency trials were released after twilight upstream of the trap at rkm 2.3 (Keystone Ranch
private bridge). Monitoring of the efficiency trials was limited to the three days following each
release in order to minimize potential affects related to river flow. Recaptured fish were re-
measured, released, and not included in subsequent efficiency testing.

17
Water temperature and flow
Hourly water temperature data was collected at the lower trapping site using HOBO U22 Water
Temp Pro (version 2) data loggers (Onset Computer Corporation, Bourne, Massachusetts). Flow
was monitored by USGS station number 12452990, located at rkm 2.3.
Results-Rotary Screw Trap
Trap operation period Rotary screw trap operation at the lower and upper sites began on February 28th, 2012 and March
29th, 2012, respectively. The upper trap was operated intermittently and primarily during periods of
low emigration to supplement the number of tagged individuals available for efficiency modeling at
the lower trap location. The lower trap was operated on a seven day per week schedule through
November 16th, 2012. Of the 265 trapping days available within the season, the lower trap operated
166 (62.6%) complete days (uninterrupted sampling from sunset to sunrise), 18 (6.8%) incomplete
days (interrupted sampling from sunset to sunrise), and was not operated for 82 days (30.94%). Total
daily capture numbers for Chinook salmon and steelhead are presented in Figures 3 through 6.
Detailed operational summaries are included as Appendix Table 1.
Rotary screw trap target species capture summary
In 2012 a total of 19,295 fish were captured by the rotary screw traps (Table 1). Total juvenile
fish capture consisted of 7,672 spring Chinook salmon (39.8%), 6,316 summer Chinook salmon
(32.7%), 1,691 steelhead trout (8.8%), 99 coho salmon (0.5%), 69 sockeye salmon (0.4%), 32
cutthroat trout (0.2%), 95 bull trout (0.5%), and 3,321 non-target species (17.2%). A total of
12,460 wild salmonids were implanted with PIT tags. Total daily captures for yearling spring
Chinook salmon, sub-yearling spring Chinook salmon, summer Chinook salmon, and steelhead
at the lower trap location are presented in figures 3 through 6. Detailed capture summaries
including adult species and total mortality are included as Appendix Table 2.
Table 1. Number of fish captured and PIT tagged at Entiat River rotary screw trap locations,
2012.
Species and Life Stage Total Number of fish
caught
Total PIT
tagged
Wild sub-yearling spring Chinook salmon 5,212 4,900
Wild yearling spring Chinook salmon 2,456 2,239
Wild summer Chinook salmon 6,316 3,583
Wild coho salmon 104 95
Wild steelhead 1,691 1,525
Wild sockeye salmon 69 0
Bull trout 95 90
Wild cutthroat trout 32 28
Non-target species 3,321 0
Grand total 19,295 12,460
18
Figure 3. Total daily captures of yearling spring Chinook salmon at the lower Entiat River
rotary screw trap, 2012.
Figure 4. Total daily captures of sub-yearling spring Chinook salmon at the lower Entiat River
rotary screw trap, 2012.
0
50
100
150
200
250
300
Nu
mb
er o
f y
earl
ing
sp
rin
g C
hin
oo
k
salm
on
Date
Count
Operation Gap
0
100
200
300
400
500
600
700
Nu
mb
er o
f su
b-y
earl
ing
sp
rin
g C
hin
oo
k
salm
on
Date
Count
Operation Gap

19
Figure 5. Total daily captures of summer Chinook salmon at lower Entiat River rotary screw
trap, 2012.
Figure 6. Total daily captures of steelhead at the lower Entiat River rotary screw trap, 2012.
Mean fork length (SD) of spring Chinook was 96.79 (8.11) mm and 83.20 (9.50) mm, for
yearling and sub-yearling species respectively (Table 2). Summer Chinook had a mean fork
length of 65.86 (13.31) mm and steelhead 143.98 (44.38) mm (Table 3).
0
50
100
150
200
250
300
350
400
450
Nu
mb
er o
f su
mm
er C
hin
oo
k s
alm
on
Date
Count
Operation Gap
0
50
100
150
200
250
Nu
mb
er o
f st
eelh
ead
Date
Count
Operation Gap

20
Table 2. Mean fork lengths (mm), weights (g), and body condition factor (K) for spring
Chinook salmon captured at the lower Entiat River rotary screw trap, 2012.
Yearling spring Chinook Sub-yearling spring Chinook
Mean SD N Mean SD N
Fork Length 96.79 8.11 2,446 83.20 9.50 5,319
Weight 9.55 2.92 2,440 6.41 2.57 5,322
K 1.03 0.07 2,440 1.07 0.12 5,315
Table 3. Mean fork lengths (mm), weights (g), and body condition factor (K) for summer
Chinook salmon and steelhead captured at the lower Entiat River rotary screw trap, 2012.
Summer Chinook Steelhead
Mean SD N Mean SD N
Fork Length 65.86 13.31 4,218 143.98 44.38 1,538
Weight 3.45 2.28 4,183 36.79 25.74 1,531
K 1.04 0.15 4,218 0.98 0.11 1,531
Trap efficiencies
At the lower Entiat River rotary screw trap, 7 viable efficiency trials using PIT tags were
conducted for yearling spring Chinook salmon, 10 trials for sub-yearling spring Chinook salmon,
8 trials for summer Chinook salmon and 9 trials for steelhead. An additional dye-mark trial was
conducted for summer Chinook salmon measuring less than 50mm FL. PIT tag trials for yearling
spring Chinook salmon efficiency averaged 29.91% (Table 4), sub-yearling spring Chinook
19.26% (Table 5), summer Chinook 22.39% (Table 6) and steelhead 13.34% (Table 7). The
summer Chinook dye mark efficiency was 4.55% (Table 8).
Table 4. Estimated capture efficiency of PIT tagged yearling spring Chinook salmon at the
lower Entiat River rotary screw trap with average (sunrise to sunset) flow from the USGS
Keystone gauging station, 2012.
Trial Date Flow (m3/s) Release Size (n) Efficiency
03/08/2012 4.24 62 48.39%
03/15/2012 4.43 44 36.36%
03/29/2012 5.56 82 34.15%
04/03/2012 6.43 94 27.66%
04/14/2012 8.53 267 23.97%
04/23/2012 14.74 68 14.71%
05/01/2012 34.99 29 24.14%

21
Table 5. Estimated capture efficiency of PIT tagged sub-yearling spring Chinook salmon at the
lower Entiat River rotary screw trap with average (sunrise to sunset) flow from the USGS
Keystone gauging station, 2012.
Trial Date Flow (m3/s) Release Size (n) Efficiency
10/12/2012 3.12 49 20.41%
10/23/2012 4.89 175 19.43%
10/30/2012 9.52 71 29.58%
11/01/2012 13.80 193 10.36%
11/03/2012 11.86 431 16.94%
11/05/2012 11.74 438 19.63%
11/06/2012 14.01 162 12.96%
11/08/2012 12.79 101 13.86%
11/11/2012 10.14 302 25.83%
11/15/2012 8.56 89 23.60%
Table 6. Estimated capture efficiency of PIT tagged summer Chinook salmon at the lower
Entiat River rotary screw trap with average (sunrise to sunset) flow from the USGS Keystone
gauging station, 2012.
Trial Date Flow (m3/s) Release Size (n) Efficiency
07/09/2012 47.11 107 5.61%
08/03/2012 11.70 77 14.29%
08/09/2012 10.26 124 22.58%
08/10/2012 9.79 131 15.27%
08/31/2012 5.04 213 40.38%
09/07/2012 4.16 223 30.49%
09/12/2012 4.18 106 25.47%
09/19/2012 3.68 144 25.00%

22
Table 7. Estimated capture efficiency of PIT tagged steelhead at the lower Entiat River rotary
screw trap with average (sunrise to sunset) flow from the USGS Keystone gauging station, 2012.
Trial Date Flow (m3/s) Release Size (n) Efficiency
04/14/2012 8.53 32 12.50%
05/01/2012 34.99 100 4.00%
05/04/2012 28.33 51 11.76%
05/08/2012 24.36 36 13.89%
05/11/2012 31.64 47 8.51%
08/31/2012 5.04 22 18.18%
09/07/2012 4.16 27 18.52%
11/02/2012 13.41 86 17.44%
11/05/2012 11.74 59 15.25%
Table 8. Estimated capture efficiency of dye marked summer Chinook salmon at the lower
Entiat River rotary screw trap with average (sunrise to sunset) flow from the USGS Keystone
gauging station, 2012.
Trial Date Flow (m3/s) Release Size (n) Efficiency
08/10/2012 9.79 88 4.55%
Water temperature and flow
Water temperature measurements averaged 9.66 ˚C throughout the study period. Water
temperatures peaked at 21.03 ˚C on August 14th
, and were lowest on February 28th
when
temperatures were 0.02˚C. Flow peaked in the spring on June 3
rd, 2012 at 74.42 m
3/s. High water
levels gradually declined through July, allowing rotary screw trap operations to resume (Figure
7).

23
Figure 7. Average daily flow (m3/s) and temperature (˚C) for the lower Entiat River rotary
screw trap, 2012.
Data dissemination
All final data corrections were completed on December 19th, 2012 and submitted to PTAGIS.
Electronic data was submitted to ISEMP (via Theo Burgoon) on December 20th
, 2012.
Discussion-Rotary Screw Trap
Rotary screw trap operation
The day to day operation of rotary screw traps can be time consuming and difficult. Seasonally
high discharge and weather events often increase the amount of debris present within the river
leading to higher frequencies of missed trapping periods due to trap failure. These periods
require more staff to maintain the traps in an operational condition. The high flows and debris
can create a hazardous work environment for the crew, increase the trap related mortality of
captured fish, and cause damage to equipment. To minimize these hazards, the trap was removed
from operation when necessary. In 2012, the majority of non-operational days were due to snow
melt resulting in a high spring flow event and wind storms inundating the trap with leaves and
other debris in late October and November. To a lesser extent, the staffing requirements of mark-
recapture sampling resulted in a reduction of rotary screw trap operation during the associated
field sampling periods.
Summer vs. spring Chinook salmon
Both spring and summer Chinook salmon spawn in the Entiat basin. Early in the season, distinct
morphological differences between summer sub-yearlings and spring Chinook salmon yearlings
make identification easy: spring Chinook salmon yearlings are much larger in size (75-100 mm)
than newly emergent summer Chinook fry (32-45 mm). Identification is more difficult during
summer and early fall as both spring and summer Chinook sub-yearlings are similar sizes.
0.00
10.00
20.00
30.00
40.00
50.00
60.00
70.00
80.00
0.00
10.00
20.00
30.00
40.00
50.00
60.00
70.00
80.00
Tem
per
atu
re
Av
era
ge
Flo
w
Date
Average Flow
Temperature

24
Currently there is no definitive method to apportion these two runs of sub-yearlings, so to
determine if the difference in migration timing could be used to assign the proper run, total catch
was monitored and plotted by day. When catch decreased and a relative nadir was reached in
early October, all Chinook salmon captured onward were assigned a run based on any detectable
break in fork length distributions. Annual dates of inclusion for spring Chinook are presented
within Appendix Table 3. Undoubtedly, the run classification of some Chinook salmon is
improperly assigned using this method. Utilizing the data from the Entiat River PIT tag
interrogation sites and the emigration timing of PIT tagged Chinook salmon it is clear that
delineation of the two runs of sub-yearling Chinook salmon used in previous years was
inadequate.
The MCRFRO is attempting to address this issue through a combination of PIT tag monitoring
and genetic analysis. In 2010, we began PIT tagging all Chinook species regardless of run
designation. By monitoring the timing of juvenile outmigration and adult returns a better
understanding of the accuracy and precision of the nadir-based identification method will be
obtained. In 2011 genetic samples were collected from a proportion of all juvenile Chinook
regardless of run designation throughout the trapping season. MCRFRO has secured funding and
these samples will be analyzed by the USFWS Abernathy Genetics Lab in 2013. This will
provide a definitive run classification for each sample when compared to base line genetic data.
Production estimates
Calculations of production estimates using rotary screw traps are standardized between
monitoring agencies within the Upper Columbia basin to increase the consistency and usefulness
of these annual estimates. A past common consensus among researchers in the Upper Columbia
was that a fundamental problem existed with the equation used to estimate variance of point
estimates. In 2012, these calculations were reviewed and corrected. MCRFRO is currently in the
process of recalculating all production estimates and will include a comprehensive description of
how the calculations have changed along with updated production estimates in the 2013 annual
report.
Project goals
Project goals were met during the 2012 field season. In 2013, we will continue out-migrant
monitoring at rotary screw trap locations to evaluate the success of wild steelhead and spring
Chinook salmon recovery actions. This is especially relevant in order to monitor the effects of
the discontinuation of the spring Chinook salmon program and the start of a summer Chinook
program at the ENFH. In 2013, MCRFRO staff will continue efforts to review parameters and
validate key assumptions associated with spring Chinook and steelhead productivity estimates.
Methods- Mark-Recapture Sampling
Sample site selection
The mark-recapture study was designed around a framework of a rotating panel of sites within
defined geomorphic reaches of the Entiat River. Sample sites were selected at random from each
reach. If a site was unavailable to be sampled, the next upstream site was then selected. A total of
14 sites are sampled annually in both the summer and winter months with new sample sites

25
selected following the winter sampling period. Sample site locations for winter and summer
sample periods in 2012 are presented in Figures 8 and 9 respectively.
Figure 8. Map of the mark-recapture sites sampled during the winter period in the Entiat River,
2012.

26
Figure 9. Map of the mark-recapture sites sampled during the summer period in the Entiat
River, 2012.
Sample periods
Mark-recapture sampling was conducted twice annually. Winter surveys were conducted within
the Entiat and Mad Rivers during March of 2012, prior to the beginning of the spring emigration
period. Summer surveys were conducted during August and September when river discharge fell
below 9.9 m3/s.
Fish collection
Mark-recapture methods were used to estimate capture probability and population size for
Chinook salmon and steelhead at discrete sites within the Entiat subbasin. Fish were captured
using backpack electrofishing, snorkel-herding, hand-netting, beach seining, and angling.

27
Sampling methods were based upon specific sampling conditions within each site and were often
used in combination. All methods relied on the assumption that a population within a site can be
treated as effectively closed and that immigration, emigration, or mortality during the sampling
period was zero or negligible.
Sampling was conducted at each site over a period of two consecutive days. During the winter
period all sites were sampled following sunset to maximize fish capture numbers. During the
summer period daytime effort provided adequate captures but in order to avoid high afternoon
water temperatures, all sampling began no later than 7:00 am and usually was complete by 2:00
pm. One to three capture crews, each consisting of a minimum of six personnel, sampled sites
independently of one another. Within each crew, four personnel were assigned to fish capture
and the remaining two to fish handling and PIT tagging. Prior to sampling, all sites were
surveyed to determine a primary sampling method. Pre-sampling surveys included recording
visual observations of available habitats and when necessary incorporated snorkeling
observations at sites where age and species composition was unknown. A primary sampling
method of either backpack electrofishing or snorkel-seining was chosen based upon site specific
conditions such as water depth, expected flow at time of sampling, the expected age and species
composition, and the overall complexity of habitat types present. All sampling was conducted in
an upstream direction with crews beginning at the lowermost point and methodically working
upstream until the site was completely sampled. In some cases the site or specific habitat was
sampled a second time using an alternative method if it was deemed more suitable to the specific
conditions. Electrofishing was conducted with either a Smith-Root model 12 or LR-24 backpack
electrofisher. Electrofisher operation followed the guidelines of the manufacturer and the
National Marine Fisheries Service (NOAA 2000).
Fish handling
Fish were handled in accordance with WDFW Scientific Collection Permit #11-154 and #11-157
(annual permits - start date April 3, 2012, expires April 3, 2013), NOAA Permit 1119 (dated
April 10, 2008, expires December 31, 2012) and USFWS Sub permit No. MCRFO-13 (dated
Aug 5, 2010, expires December 31, 2013) under Regional Blanket Permit TE-702631.
Fish were transported within 5 gallon aerated buckets from the point of capture to 25 gallon
plastic live boxes located on the river margins within the site. Water temperatures and fish
condition were closely monitored during transportation and holding. All individuals that
exhibited signs of injury or excessive stress were scanned for a pre-existing PIT tag and released.
Fish were periodically transported from live boxes to a stationary fish handling and tagging
station.
Collected species were anesthetized in a water bath with a measured amount of tricaine (MS-
222) buffered with sodium bicarbonate. Small groups of fish were anesthetized at any one time
during daily handling to reduce the chance of incidental mortality from anesthetic overdose. Fish
were identified to species with the exception of sculpin, dace and suckers. Chinook salmon run
designation was classified as unknown when captured during the summer period due to the
inability to distinguish between spring and summer run characteristics. All salmonids were
ascribed to a life history stage as either fry (<60 mm), parr (>60mm and distinctive parr marks),

28
transitional (>60 mm silver sheen, faint parr marks, and deciduous scales) or smolt (>60 mm
silver sheen, absent parr marks, deciduous scales, and with possible black tipped caudal fins).
All Chinook salmon, steelhead, coho salmon, sockeye salmon, bull trout, and cutthroat trout
were measured to the nearest millimeter of fork length and weighed to the nearest tenth of a
gram. Fulton-type condition factor was calculated for all Chinook and steelhead as described
previously. Non-target species were either measured or counted and released within the site
dependent upon time restrictions. All individuals were allowed full recovery prior to release.
Non-marked individuals were released within the site in close proximity to their point of capture.
PIT tagging of juvenile Chinook salmon, steelhead, coho salmon, and bull trout followed the
procedures outlined under rotary screw trap operations. ISEMP supplied PIT tags for Chinook
salmon and steelhead, Chelan County PUD provided tags for bull trout and USFWS supplied
PIT tags for cutthroat trout, coho and sockeye salmon. Any injuries or abnormalities were noted
and juveniles were not PIT tagged if determined it had a recent or substantial injury that could be
aggravated by tagging. Marked juveniles were held for a minimum of one hour to ensure full
recovery prior to being released in close proximity to their capture origin.
Mortality rates were tracked for Chinook salmon and steelhead during mark-recapture sampling
and categorized as the result of capture, handling, or PIT. In 2013, tagged individuals were not
held to assess delayed mortality or tag shed rates.
Site level point estimates
Point estimates of abundance and 95% confidence intervals were generated for wild Chinook
salmon and steelhead at each of the sample sites for winter and summer periods. Estimates were
generated using the Chapman modification of the Peterson equation as presented in Van Den
Avyle and Hayward (1999). All estimates were further tested and considered valid when the data
met the validity test conditions proposed by Robson and Regier (1964). The Chapman
modification of the Peterson equation is as follows:
with variance:
where N is the population estimate; M is the number of fish captured, marked, and released in the
first sample; C is the total number of fish caught in the second sample including recaptures; and
R is the number of recaptures caught in the second sampling event.

29
The Robson and Regier equation to test the amount of bias present within the estimate is as
follows:
Negligible bias if
Growth per day estimates
Estimates of specific growth rate (SGR) were obtained through the recapture of PIT tagged
Chinook salmon and steelhead for winter, summer, and annual periods. SGR estimates were
calculated by determining the temporal change in mean fork-length between mark-recapture
sampling periods. Total growth rate was determined for each recaptured fish and was then
applied to the date intermediate between sampling periods to achieve SGR in growth per day.
Estimates were limited to recaptures of fish occurring within the sample site they were originally
tagged in. Recaptures were further limited to exclude fish that were PIT tagged within 20 days of
the recapture event to avoid the negative short-term effect of PIT tagging on growth rates
(Bateman and Gresswell 2006).
Data entry
During the 2012 winter sampling period data entry utilized the P3 program from PTAGIS. These
data files generated from the P3 program were then parsed into a database maintained by
MCRFRO staff. The summer sampling period utilized an Allegro MX field computer (Juniper
Systems) and a new program developed by Quantitative Consultants, Inc. This program, QC_PIT
Tagging, is designed for fish capture and PIT tagging in remote settings. Data files created by
QC_PIT Tagging were then entered into a custom MS Access® database also developed by
Quantitative Consultants, Inc., where a quality check was performed and a P3 file is created. All
data files were provided to ISEMP and the original P3 file uploaded to PTAGIS where it is
available to researchers throughout the Columbia River Basin.
Genetic sampling
Throughout the summer sampling period genetic samples were taken from a subset of PIT tagged
Chinook salmon. Tissue was obtained from a small portion of the ventral fin, preserved in
alcohol and sent to the Region 1 USFWS genetics lab for storage.
Scale sampling
Throughout the sampling period, scales were taken from a subset of juvenile steelhead and
archived for future age analysis.
Results – Mark-Recapture Sampling
Winter sampling period fish capture summary
Fish sampling began on March 5, 2012 when river surface ice had receded allowing safe access
to sample sites. All sampling activities were completed on March 16. Average daily flow (m3/s)
during the sampling period is summarized in Figure 10. Detailed locations and sampling notes
are presented as Appendix Table 4.

30
Figure 10. Entiat River average daily flow (m3/s) during winter period mark-recapture
sampling, 2012.
A total of 2,863 fish were captured at 14 sites throughout the Entiat and Mad rivers during the
2012 winter sampling period (Table 9). Species composition included 863 wild spring Chinook
salmon (30.1%), 1,978 wild steelhead (69.1%), 11 wild Coho salmon, (0.4%), and two bull trout
(0.1%). A total of 2,810 wild salmonids (98.2%) were implanted with PIT tags. Detailed capture
summaries are included as Appendix Table 5. Mean fork length (SD) of juvenile spring Chinook
and steelhead was 90.37 (8.03) mm and 106.36 (42.33) mm, respectively (Table 10).
Table 9. Number of fish captured and PIT tagged from the winter mark-recapture sample
period, 2012.
Species and Life Stage Total number of Fish Caught Total PIT Tagged
Wild spring Chinook salmon 863 853
Wild steelhead 1,978 1,944
Wild Coho salmon 11 11
Bull trout 2 2
Grand total 2,863 2,810
0.00
1.00
2.00
3.00
4.00
5.00
6.00
7.00
8.00A
ver
ag
e F
low
Date

31
Table 10. Mean fork lengths (mm), weights (g), and body condition factor (K) for spring
Chinook salmon and steelhead captured in the winter mark-recapture sample period, 2012.
Spring Chinook Steelhead
Mean SD N Mean SD N
Fork Length 90.37 8.03 854 106.36 42.33 1973
Weight 7.52 1.99 854 17.73 22.41 1973
K 1.0 0.09 854 0.97 0.21 1973
During the 2012 winter sample period, instantaneous mortality was attributed to a total of one
Chinook salmon (< 0.01%) as a result of PIT tagging. Capture related mortality was limited to
three cases for Chinook salmon (< 0.01%) as a result of predation. A total of 25 wild Chinook
salmon and 123 steelhead were retained from a total of two sample sites throughout the Entiat
and Mad Rivers for assessing delayed mortality and shed rates. There were no cases of delayed
tagging mortality for Chinook salmon and steelhead. Shed tag recoveries were limited to one
steelhead (< 0.01% shed rate).
Summer period fish capture summary
Fish sampling began on August 13, 2012 when flows within the Entiat River had dropped below
8.5 m3/s. Above average snow accumulation coupled with a cool spring temperatures resulted in
an extended period of high flow conditions within the Entiat River and forced the delay of
sampling. Daily average flow (m3/s) during the sampling period is summarized in Figure 11.
Initial sampling efforts focused on the uppermost Entiat River sites in attempt to complete
sampling before the peak of spring Chinook spawning activity. All sampling activities were
completed on August 24, 2012. Detailed locations and sampling notes are presented as Appendix
Table 6.

32
Figure 11. Entiat River average daily flow (m3/s) during summer period mark-recapture
sampling, 2012.
A total of 9,773 fish were captured at 14 sites throughout the Entiat and Mad rivers during the
2012 summer sampling period (Table 11). Species composition included 3,532 wild Chinook
salmon (36.1%), 2,727 wild steelhead (27.9%), 125 wild coho salmon (1.3%), 13 bull trout
(0.1%), 15 cutthroat trout (0.2%), and 3,361 non-target species (34.4%). A total of 4,751 wild
salmonids (48.6%) were implanted with PIT tags. Detailed capture summaries are included as
Appendix Table 7. Mean fork length (SD) of Chinook salmon and steelhead was 68.51 (11.38)
mm and 84.01 (42.01) mm respectively (Table 12).
Table 11. Number of fish captured and PIT tagged from the summer mark-recapture sample
period, 2012.
Species and Life Stage Total number of Fish Caught Total PIT Tagged
Chinook salmon 3,532 2,984
Wild steelhead 2,727 1,618
Coho salmon 125 123
Bull trout 13 12
Wild cutthroat trout 15 14
Non-target species 3,361 0
Grand total 9,773 4,751
0.00
2.00
4.00
6.00
8.00
10.00
12.00
Av
era
ge
Flo
w
Date

33
Table 12. Mean fork lengths (mm), weights (g), and body condition factor (K) for Chinook
salmon (unknown run) and steelhead captured in the summer mark-recapture sample period,
2012.
Chinook (unknown run) Steelhead
Mean SD N Mean SD N
Fork Length 68.51 11.38 3,202 84.01 42.01 1,882
Weight 4.00 2.25 3,202 12.10 21.24 1,882
K 1.13 0.12 3,202 1.05 0.11 1,882
During the 2012 summer sample period, instantaneous mortality was attributed to a total of one
Chinook salmon (< 0.01%) as a result of PIT tagging. Capture related activities attributed to a
total of 122 Chinook salmon (3.5%), 46 steelhead (1.7%), and one coho salmon (0.01%). Of the
169 mortalities, 76 (46.75%) were the result of overcrowding holding buckets.
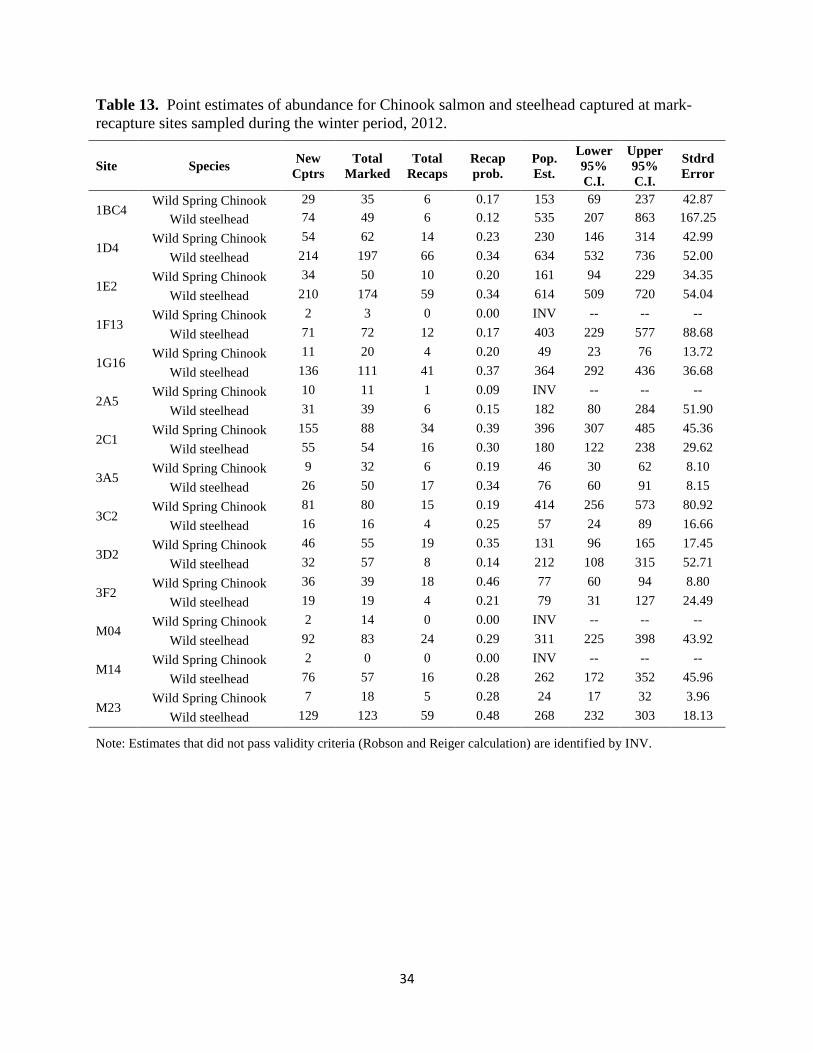
Site level point estimates
Point estimates of abundance and 95% confidence intervals were generated for wild Chinook and
steelhead at each of the sample sites for winter (Table 13) and summer (Table 14) periods.
Winter mark-recapture sampling produced a total of 10 valid point estimates of Chinook and 14
for steelhead of the 14 possible for each species. Of the 14 possible point estimates in the
summer period 10 were valid for Chinook and five were valid for steelhead.
34
Table 13. Point estimates of abundance for Chinook salmon and steelhead captured at mark-
recapture sites sampled during the winter period, 2012.
Site Species New
Cptrs
Total
Marked
Total
Recaps
Recap
prob.
Pop.
Est.
Lower
95%
C.I.
Upper
95%
C.I.
Stdrd
Error
1BC4 Wild Spring Chinook 29 35 6 0.17 153 69 237 42.87
Wild steelhead 74 49 6 0.12 535 207 863 167.25
1D4 Wild Spring Chinook 54 62 14 0.23 230 146 314 42.99
Wild steelhead 214 197 66 0.34 634 532 736 52.00
1E2 Wild Spring Chinook 34 50 10 0.20 161 94 229 34.35
Wild steelhead 210 174 59 0.34 614 509 720 54.04
1F13 Wild Spring Chinook 2 3 0 0.00 INV -- -- --
Wild steelhead 71 72 12 0.17 403 229 577 88.68
1G16 Wild Spring Chinook 11 20 4 0.20 49 23 76 13.72
Wild steelhead 136 111 41 0.37 364 292 436 36.68
2A5 Wild Spring Chinook 10 11 1 0.09 INV -- -- --
Wild steelhead 31 39 6 0.15 182 80 284 51.90
2C1 Wild Spring Chinook 155 88 34 0.39 396 307 485 45.36
Wild steelhead 55 54 16 0.30 180 122 238 29.62
3A5 Wild Spring Chinook 9 32 6 0.19 46 30 62 8.10
Wild steelhead 26 50 17 0.34 76 60 91 8.15
3C2 Wild Spring Chinook 81 80 15 0.19 414 256 573 80.92
Wild steelhead 16 16 4 0.25 57 24 89 16.66
3D2 Wild Spring Chinook 46 55 19 0.35 131 96 165 17.45
Wild steelhead 32 57 8 0.14 212 108 315 52.71
3F2 Wild Spring Chinook 36 39 18 0.46 77 60 94 8.80
Wild steelhead 19 19 4 0.21 79 31 127 24.49
M04 Wild Spring Chinook 2 14 0 0.00 INV -- -- --
Wild steelhead 92 83 24 0.29 311 225 398 43.92
M14 Wild Spring Chinook 2 0 0 0.00 INV -- -- --
Wild steelhead 76 57 16 0.28 262 172 352 45.96
M23 Wild Spring Chinook 7 18 5 0.28 24 17 32 3.96
Wild steelhead 129 123 59 0.48 268 232 303 18.13
Note: Estimates that did not pass validity criteria (Robson and Reiger calculation) are identified by INV.

35
Table 14. Point estimates of abundance for Chinook salmon and steelhead captured at mark-
recapture sites sampled during the summer period, 2012.
Site Species New
Cptrs
Total
Marked
Total
Recaps
Recap
prob.
Pop.
Est.
Lower
95%
C.I.
Upper
95%
C.I.
Stdrd
Error
1BC11 Wild Chinook 85 128 4 0.03 INV -- -- --
Wild steelhead 44 60 3 0.05 INV -- -- --
1D4 Wild Chinook 568 415 62 0.15 3,756 2,957 4,556 407.98
Wild steelhead 195 222 36 0.16 1,180 871 1,489 157.63
1E3 Wild Chinook 157 169 23 0.14 1,118 744 1,493 191.03
Wild steelhead 231 209 40 0.19 1,187 895 1,480 149.25
1F13 Wild Chinook 45 50 8 0.16 260 128 391 67.09
Wild steelhead 31 33 3 0.09 INV -- -- --
1G19 Wild Chinook 55 75 2 0.03 INV -- -- --
Wild steelhead 68 29 2 0.07 INV -- -- --
2A5 Wild Chinook 165 67 6 0.09 1,612 576 2,647 528.48
Wild steelhead 6 12 0 0.00 INV -- -- --
2C4 Wild Chinook 111 102 21 0.21 523 353 694 86.92
Wild steelhead 9 11 0 0.00 INV -- -- --
3A3 Wild Chinook 102 122 17 0.14 703 437 968 135.53
Wild steelhead 8 8 0 0.00 INV -- -- --
3C1 Wild Chinook 229 180 67 0.37 611 515 707 48.87
Wild steelhead 8 19 1 0.05 INV -- -- --
3D5 Wild Chinook 54 68 19 0.28 189 134 243 27.84
Wild steelhead 3 19 1 0.05 INV -- -- --
3F2 Wild Chinook 104 96 35 0.36 282 223 341 29.90
Wild steelhead 4 2 0 0.00 INV -- -- --
M04 Wild Chinook 26 58 25 0.43 60 57 64 1.70
Wild steelhead 116 110 28 0.25 447 327 566 60.95
M14 Wild Chinook 5 3 0 0.00 INV -- -- --
Wild steelhead 51 72 11 0.15 317 178 456 70.81
M23 Wild Chinook 12 13 3 0.23 INV -- -- --
Wild steelhead 91 103 37 0.36 251 203 299 24.61
Note: Estimates that did not pass validity criteria (Robson and Reiger calculation) are identified by INV.
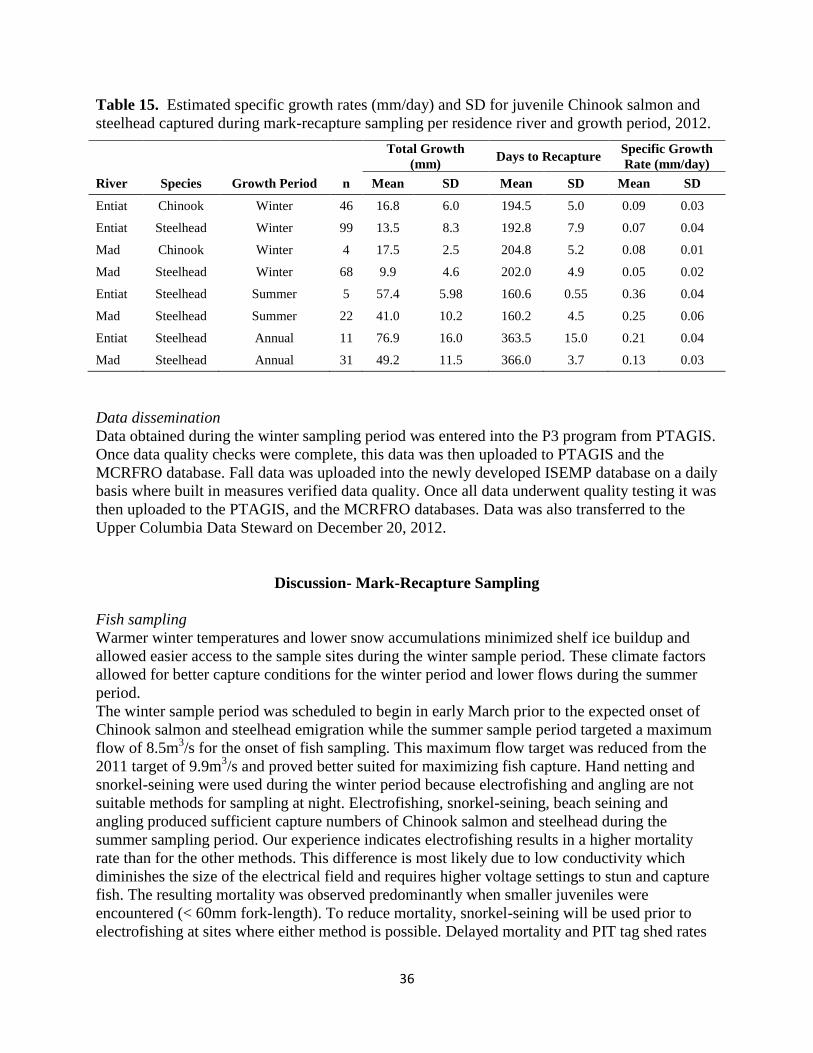
Growth per day estimates
In 2012, a total of 286 recaptures were used to generate SGR estimates. These recaptures
consisted of 50 Chinook salmon (17.5%) and 236 steelhead (82.5%). The majority of recaptures
occurred during the summer sampling period of 2012. Estimates of SGR for steelhead varied
between growth period and river location. Fish from the Mad River exhibited lower growth rates
than fish from the Entiat River (Table 15).
36
Table 15. Estimated specific growth rates (mm/day) and SD for juvenile Chinook salmon and
steelhead captured during mark-recapture sampling per residence river and growth period, 2012.
Total Growth
(mm) Days to Recapture
Specific Growth
Rate (mm/day)
River Species Growth Period n Mean SD Mean SD Mean SD
Entiat Chinook Winter 46 16.8 6.0 194.5 5.0 0.09 0.03
Entiat Steelhead Winter 99 13.5 8.3 192.8 7.9 0.07 0.04
Mad Chinook Winter 4 17.5 2.5 204.8 5.2 0.08 0.01
Mad Steelhead Winter 68 9.9 4.6 202.0 4.9 0.05 0.02
Entiat Steelhead Summer 5 57.4 5.98 160.6 0.55 0.36 0.04
Mad Steelhead Summer 22 41.0 10.2 160.2 4.5 0.25 0.06
Entiat Steelhead Annual 11 76.9 16.0 363.5 15.0 0.21 0.04
Mad Steelhead Annual 31 49.2 11.5 366.0 3.7 0.13 0.03
Data dissemination
Data obtained during the winter sampling period was entered into the P3 program from PTAGIS.
Once data quality checks were complete, this data was then uploaded to PTAGIS and the
MCRFRO database. Fall data was uploaded into the newly developed ISEMP database on a daily
basis where built in measures verified data quality. Once all data underwent quality testing it was
then uploaded to the PTAGIS, and the MCRFRO databases. Data was also transferred to the
Upper Columbia Data Steward on December 20, 2012.
Discussion- Mark-Recapture Sampling
Fish sampling
Warmer winter temperatures and lower snow accumulations minimized shelf ice buildup and
allowed easier access to the sample sites during the winter sample period. These climate factors
allowed for better capture conditions for the winter period and lower flows during the summer
period.
The winter sample period was scheduled to begin in early March prior to the expected onset of
Chinook salmon and steelhead emigration while the summer sample period targeted a maximum
flow of 8.5m3/s for the onset of fish sampling. This maximum flow target was reduced from the
2011 target of 9.9m3/s and proved better suited for maximizing fish capture. Hand netting and
snorkel-seining were used during the winter period because electrofishing and angling are not
suitable methods for sampling at night. Electrofishing, snorkel-seining, beach seining and
angling produced sufficient capture numbers of Chinook salmon and steelhead during the
summer sampling period. Our experience indicates electrofishing results in a higher mortality
rate than for the other methods. This difference is most likely due to low conductivity which
diminishes the size of the electrical field and requires higher voltage settings to stun and capture
fish. The resulting mortality was observed predominantly when smaller juveniles were
encountered (< 60mm fork-length). To reduce mortality, snorkel-seining will be used prior to
electrofishing at sites where either method is possible. Delayed mortality and PIT tag shed rates

37
were not assessed during the 2012 mark-recapture sampling. This was primarily due to extensive
evaluations during prior sampling rounds as well as daily assessments of tagged fish from the
rotary screw trap.
Summer vs. spring Chinook salmon
The Entiat watershed supports populations of both spring and summer run Chinook salmon. Late
summer identification of juvenile Chinook salmon at the rotary screw trap located in the lower
Entiat River is hindered by the inability to visually distinguish between spring and summer run
Chinook. A relative nadir (based on catch frequency) has been used at rotary screw trap locations
to differentiate between Chinook run types. The summer sampling period for the Entiat IMW
currently lacks such a method to differentiate between run types of Chinook and as a result all
Chinook were classified as ‘wild Chinook (unknown run).’ Through continued monitoring of the
emigration timing of juvenile PIT tagged Chinook we hope to detect trends that will enable
classification of run type at time of capture. USFWS collects and archives genetic samples from
juvenile Chinook salmon throughout their emigration period. Currently the MCRFRO is
analyzing a subset of these samples. The results from this analysis will be used to better partition
Chinook run in future sampling efforts.
Site level point estimates
Estimates of site level abundance were calculated for all sample sites using the Chapman
modification of the Petersen estimate. Several assumptions were made concerning the validity of
these estimates: 1) the sample population remained closed to immigration and emigration during
the study or rates were negligible; 2) marked and unmarked fish had the same mortality rates; 3)
marked and unmarked fish were equally available for capture; 4) all marks were retained during
the sample period and all marks on recaptured fish were recognized; 5) marked fish randomly
mixed with the unmarked population following release. We are confident that our current study
design accounts for these assumptions with exception to ensuring a closed sample population.
Due to the high discharge and width of the Entiat and Mad rivers block netting is not feasible. By
leaving the sample populations physically open to immigration and emigration during the study
period, we were not able to meet the assumption of a closed population. The MCRFRO staff
tested the assumption of population closure at three fish capture sites using portable antennas
during the summer 2012 sample period. These data show a violation of population closure and
indicate that current estimates of abundance likely overestimate the actual populations.
MCRFRO will replicate this effort during the winter 2013 sample period to better determine the
validity of abundance estimates generated during winter sampling periods. MCRFRO is currently
working with the ISEMP on potential solutions to this issue.
The effects of PIT tagging, specific to tag related mortality and shed rates, have recently been
brought to question in a publication by Knudsen et. al. (2009). The authors suggest that delayed
mortality and shed rates for hatchery reared spring Chinook in the upper Yakima River can
exceed previous estimates. Assuming that these finding are applicable to wild populations of
Chinook and steelhead in the Entiat watershed a number of problems arise in consideration to the
goals of the Entiat River IMW study. We will continue to monitor rates of mortality and mark
retention in order to limit bias in juvenile abundance estimates; however, we are currently unable

38
to account for long-term tag related mortality and retention rates that could bias estimates of
seasonal survival and adult recruitment.
Theoretical bias within the Petersen estimator of population abundance has been well
documented (Baily, 1951; Chapman, 1948). According to Robson and Regier (1964), bias in
abundance estimates produced by the Chapman modification of the Petersen estimate are
negligible (less than 2%) when the product of marked fish (M) and the total number of fish
examined for marks (C) exceeds the population size (N) by a factor of 4 (M×C > N×4). Of the
52 abundance estimates generated, all but 16 were determined to be valid estimates. The bias
within these estimates is most likely attributed to low fish densities leading to insufficient
numbers of marked fish available for recapture.
Invalid point estimates for both wild Chinook salmon and steelhead at site 1BC11 was a result of
a failure to release all marked fish between mark and recapture sampling. Fish were subsequently
released and allowed to recover for three hours before sampling commenced. Although it is
suggested a recovery time of three hours is adequate for mark-recapture sampling (Temple and
Pearsons, 2006) the recapture rates associated with these estimates indicated that this shortened
recovery time was inadequate.
Growth per day estimates
A comparison of specific growth estimates between steelhead Entiat and the Mad Rivers was
possible in 2012 and a higher growth rate within the Entiat River was observed. This difference
may be attributed to a number of factors such as temperature and habitat functions. In order to
adequately address this difference future analysis incorporating these variables is needed.
Project goals
Project goals were met during 2012. Fish sampling through the Entiat IMW study provides
additional data on non-target species and this information is needed for the long-term monitoring
of species native to the Entiat watershed. In 2013, MCRFRO staff will further test the
assumption of population closure and work towards a solution to the violation of this
assumption. Efforts to model juvenile growth and survival estimates for the IMW study area will
continue in 2013.
Methods- Off-Channel Habitat Study
Sample site selection
Sample sites considered for the off-channel habitat study were limited to habitats distinctly
separate from the main river channel where flow was perennial, the site was accessible year
round, and physical site conditions supported the PIT tag antenna monitoring requirements of the
study. In addition to the two sites sampled in 2011, a third site was included in monitoring efforts
for 2012 (Figure 12).

39
Figure 12. Map of the Entiat River watershed defining locations of the three off-channel study
sites sampled, 2012.
Site Descriptions
The Public Utility District (PUD) canal site is located at rkm 5.0 and consists of a 230m long
reconnecting perennial channel that includes both a man-made, concrete-lined canal and a
naturalized riffle-run habitat. The lower portion of the canal is deep (>1m) and has sparse in-
stream habitat, whereas the upper section is complex, with habitat including undercut banks,
riprap, log structures, and large boulders.
The SanRay side-channel (SAN), located at rkm 7.0, consists of a 117 m long perennial side-
channel that reconnects to the main river. The side-channel is composed primarily of riffle-run
habitat with few pools and complex wood structure.
The Wilson side-channel (WLS), at rkm 11.0 near the ENFH, consists of a 286 m long
reconnecting perennial side-channel. Habitat within the side-channel is complex. The lower

40
portion of the site is comprised of downed trees and a series of beaver dams and pools. Where-as
the upper portion is a cobble riffle with thick riparian cover.
Sampling periods
Fish sampling was conducted at two sites in the winter and three sites in the summer and fall.
SanRay and Wilson side-channels were sampled three times in 2012. Sampling occurred on
March 26-29 (winter sampling period), July 30-31 (summer sampling period), and October 2-5
(fall sampling period). In April 2012 the PUD canal was added and sampling occurred on August
7-8 (summer sampling period), and October 9-10 (fall sampling period).
Fish Collection
Fish collection utilized mark-recapture methods similar to the Entiat River mark-recapture study.
Fish sampling methods included backpack electrofishing, seining and hand-netting. Since fish
capture during daytime hours provided sufficient numbers of fish for marking and recapture, a
night sampling period was not necessary. Fish sampling was conducted at each site over two
consecutive days. Block nets were utilized at the top and bottom of each site and maintained for
the duration of the mark-recapture period. One capture crew consisting of six personnel sampled
each site. Four personnel were assigned fish capture responsibilities and two to data recording
and PIT tagging. Sampling was conducted in an upstream direction with crews beginning at the
lowermost point and methodically working upstream until the site was completely sampled.
Electrofishing was conducted with a Smith-Root model LR-24 backpack electrofishing unit.
Electrofishing operations followed the guidelines of the manufacturer and the National Marine
Fisheries Service (NOAA 2000). Fish handling and marking methods followed those outlined in
the Entiat River mark-recapture study.
Data Entry
Data entry during the winter period utilized the P3 program from PTAGIS. Files were parsed
into a database maintained by MCRFRO staff. The summer and fall sampling periods utilized a
new program developed by Quantitative Consultants, Inc. This program, QC_PIT Tagging, was
designed for fish capture and PIT tagging in remote settings. Data files created by QC_PIT
Tagging were then entered into a custom MS Access® database also developed by Quantitative
Consultants, Inc., where a quality check was performed and a P3 file is created. All data files
were provided to ISEMP and the original P3 file uploaded to PTAGIS where they are available
to researchers throughout the Columbia River Basin.
PIT tag antenna monitoring
A single channel spanning antenna was used at the inlet and outlet of each off-channel study site.
Antennas were configured in a pass-through orientation and were anchored to the stream bed
using steel fence posts. Antenna systems were comprised of an antenna, transceiver, data logger
and a power source. Individual antennas were constructed of multiple coils of 20 gauge solid
core copper wire sealed within schedule 80 PVC pipe and connected to an Allflex transceiver
(RM310 Reader Module) capable of decoding both full and half duplex PIT tags. Individual tag
detections were recorded with an Acumen Data Bridge (SDR2-CF) serial data logger which
stored tag data on a removable 2 GB compact flash card. The system was powered by two six
volt sealed lead-acid DC batteries stored in a waterproof locking worksite storage box.
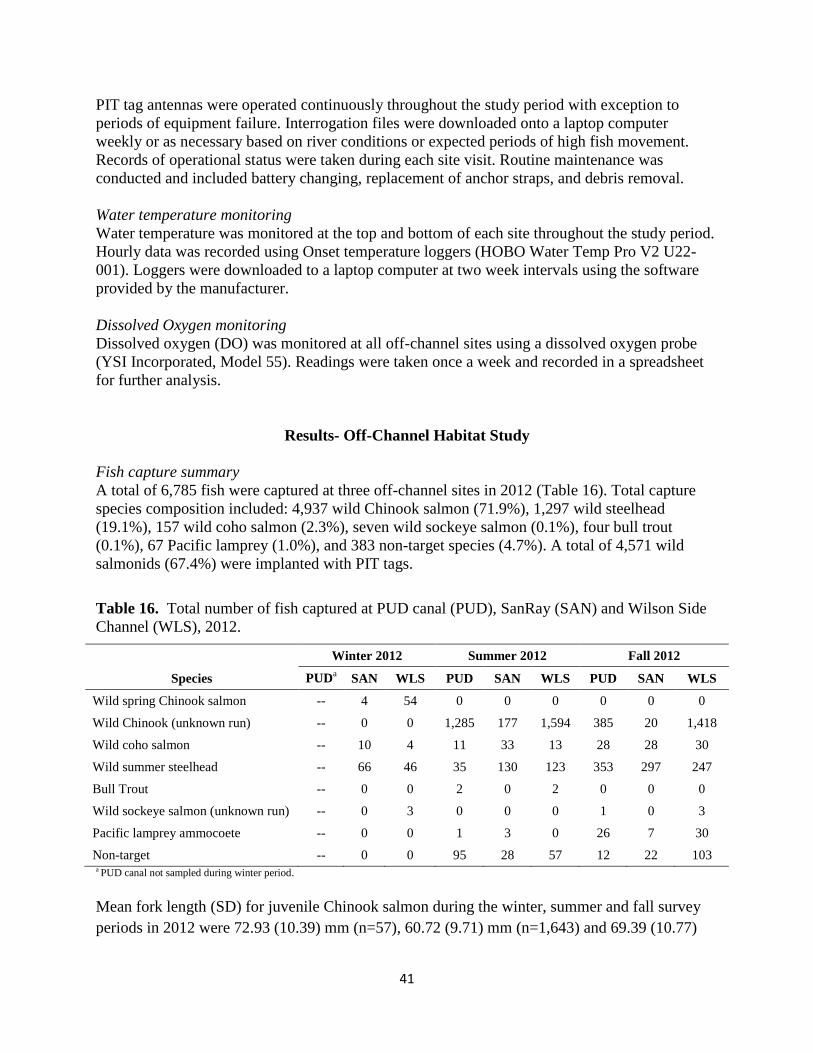
41
PIT tag antennas were operated continuously throughout the study period with exception to
periods of equipment failure. Interrogation files were downloaded onto a laptop computer
weekly or as necessary based on river conditions or expected periods of high fish movement.
Records of operational status were taken during each site visit. Routine maintenance was
conducted and included battery changing, replacement of anchor straps, and debris removal.
Water temperature monitoring
Water temperature was monitored at the top and bottom of each site throughout the study period.
Hourly data was recorded using Onset temperature loggers (HOBO Water Temp Pro V2 U22-
001). Loggers were downloaded to a laptop computer at two week intervals using the software
provided by the manufacturer.
Dissolved Oxygen monitoring
Dissolved oxygen (DO) was monitored at all off-channel sites using a dissolved oxygen probe
(YSI Incorporated, Model 55). Readings were taken once a week and recorded in a spreadsheet
for further analysis.
Results- Off-Channel Habitat Study
Fish capture summary
A total of 6,785 fish were captured at three off-channel sites in 2012 (Table 16). Total capture
species composition included: 4,937 wild Chinook salmon (71.9%), 1,297 wild steelhead
(19.1%), 157 wild coho salmon (2.3%), seven wild sockeye salmon (0.1%), four bull trout
(0.1%), 67 Pacific lamprey (1.0%), and 383 non-target species (4.7%). A total of 4,571 wild
salmonids (67.4%) were implanted with PIT tags.
Table 16. Total number of fish captured at PUD canal (PUD), SanRay (SAN) and Wilson Side
Channel (WLS), 2012.
Winter 2012 Summer 2012 Fall 2012
Species PUDa
SAN WLS PUD SAN WLS PUD SAN WLS
Wild spring Chinook salmon -- 4 54 0 0 0 0 0 0
Wild Chinook (unknown run) -- 0 0 1,285 177 1,594 385 20 1,418
Wild coho salmon -- 10 4 11 33 13 28 28 30
Wild summer steelhead -- 66 46 35 130 123 353 297 247
Bull Trout -- 0 0 2 0 2 0 0 0
Wild sockeye salmon (unknown run) -- 0 3 0 0 0 1 0 3
Pacific lamprey ammocoete -- 0 0 1 3 0 26 7 30
Non-target -- 0 0 95 28 57 12 22 103 a PUD canal not sampled during winter period.
Mean fork length (SD) for juvenile Chinook salmon during the winter, summer and fall survey
periods in 2012 were 72.93 (10.39) mm (n=57), 60.72 (9.71) mm (n=1,643) and 69.39 (10.77)

42
mm (n=1,813), respectively. Mean fork lengths (SD) for steelhead during the same sampling
periods were 72.22 (11.38) mm (n=88), 60.22 (24.03) mm (n=81) and 66.42 (12.04) mm
(n=768), respectively. Mean fork lengths for juvenile Chinook and steelhead are presented by
site and sample period in Figure 13. Mean condition factor (K) for all sampling periods for
Chinook salmon and steelhead was 1.07 and 1.08, respectively. Figure 14 displays mean
condition factors of juvenile Chinook and steelhead by site and sample period.
Figure 13. Mean fork lengths (mm) for Chinook salmon and steelhead at PUD canal (PUD),
SanRay (SAN) and Wilson Side Channel (WLS), 2012. Note: PUD canal was not sampled
during the winter survey.
0
20
40
60
80
100
120
PUD SAN WLS PUD SAN WLS PUD SAN WLS
Winter 2012 Summer 2012 Fall 2012
Mea
n F
ork
Len
gth
Site and Sample Period
Chinook
Steelhead

43
Figure 14. Mean condition factor (K) for Chinook salmon and steelhead at PUD canal (PUD),
SanRay (SAN) and Wilson Side Channel (WLS), 2012. Note: PUD canal was not sampled
during the winter survey.
Mortality rates were tracked for all species throughout the study.
Capture related mortality in 2012 accounted for a total of 169 fish. This included 123 wild
Chinook salmon (71.0%), 28 steelhead (16.6%), 15 mountain whitefish (8.9%), two unknown
dace species (1.2%) and one Pacific lamprey (0.6%) (Table 17). Tagging-related mortality
totaled five fish. This included four wild Chinook (80%) and one wild coho salmon (20%)
(Table. 18).
Table 17. Capture related mortality during the off-channel study at PUD canal (PUD), SanRay
(SAN) and Wilson Side Channel (WLS), 2012.
Species Winter 2012 Summer 2012 Fall 2012
PUDa SAN WLS PUD SAN WLS PUD SAN WLS
Wild spring Chinook salmon -- 0 3 0 0 0 0 0 0
Wild Chinook salmon (unknown run) -- 0 0 12 7 37 10 0 54
Wild coho salmon -- 0 0 0 0 0 0 0 0
Wild summer steelhead -- 4 0 0 2 4 9 3 6
Pacific lamprey ammocoete -- 0 0 0 0 0 0 0 1
Non-target species -- 0 0 6 0 9 0 1 2 a PUD canal not sampled
0
0.2
0.4
0.6
0.8
1
1.2
PUD SAN WLS PUD SAN WLS PUD SAN WLS
Winter 2012 Summer 2012 Fall 2012
Mea
n C
on
dit
ion
Fa
cto
r
Site and Sample Period
Chinook
Steelhead

44
Table 18. PIT tagging mortality at PUD canal (PUD), SanRay (SAN) and Wilson Side Channel
(WLS), 2012
Species Winter 2012 Summer 2012 Fall 2012
PUDa SAN WLS PUD SAN WLS PUD SAN WLS
Wild spring Chinook salmon -- 0 2 0 0 0 0 0 0
Wild Chinook salmon (unknown run) -- 0 0 0 1 0 0 0 1
Wild coho salmon -- 0 0 0 0 1 0 0 0 a PUD canal not sampled
Site Level Point Estimates
Point estimates of abundance and 95% confidence intervals were generated for wild Chinook and
steelhead at each of the sample sites (Table 19). Winter sampling produced a total of one valid
point estimate for Chinook salmon and two for steelhead of the two possible for each species.
Summer and fall sampling produced a total of 5 valid point estimates of Chinook and 5 for
steelhead of the 6 possible for each species.
Table 19. Point estimates of abundance for wild Chinook salmon and steelhead captured in
PUD canal (PUD), SanRay (SAN) and Wilson Side Channel (WLS), 2012.
Site Sample
Period Species
New
Cptrs
Total
Marked
Total
Recap
Recap
prob.
Pop.
Est.
Lower
95%
C.I.
Upper
95%
C.I.
Stdrd
Error
PUD
Summer Chinook 428 265 36 0.14 3,083 2,213 3,953 443.75
Steelhead 19 3 2 0.67 INV -- -- --
Fall Chinook 223 287 133 0.46 480 443 518 19.21
Steelhead 229 198 95 0.48 476 424 528 26.58
SAN
Winter Chinook 3 4 3 0.75 INV -- -- --
Steelhead 42 53 30 0.57 74 65 83 4.57
Summer Chinook 35 69 7 0.10 314 143 485 87.15
Steelhead 23 32 9 0.28 78 48 108 15.23
Fall Chinook 5 18 3 0.17 INV -- -- --
Steelhead 196 202 115 0.57 344 318 370 13.38
WLS
Winter Chinook 39 25 13 0.52 73 53 94 10.51
Steelhead 26 27 7 0.26 94 50 137 22.33
Summer Chinook 437 387 81 0.21 2,071 1,715 2,428 182.13
Steelhead 48 36 4 0.11 362 106 617 130.45
Fall Chinook 1,020 933 617 0.66 1,542 1,498 1,586 22.66
Steelhead 169 149 80 0.54 314 280 347 17.06
Note: Estimates that did not pass validity criteria (Robson and Reiger calculation) are identified by INV. PUD not sampled during winter period of 2012.
PIT tag antenna monitoring
Operation of PIT tag antennas at the upper and lower end of the PUD canal yielded a total of
1,238 unique detections in 2012 (Table 20). Species composition included 15 wild spring
Chinook (1.2%), two wild summer Chinook (0.2%),515 wild Chinook (unknown run) (41.6%),

45
150 wild summer steelhead (12.1%), 14 wild coho (1.1%),one wild cutthroat trout (0.1%) and
541 hatchery or unknown species (43.7%).
Table 20. Totals of unique PIT tag detections by species for the PUD side-channel, 2012.
Species Lower Upper Total
Wild spring Chinook salmon 3 12 15
Wild summer Chinook salmon 1 1 2
Wild Chinook salmon (unknown run) 321 194 515
Hatchery summer Chinook salmon 29 487 516
Wild summer steelhead 51 99 150
Hatchery summer steelhead 1 5 6
Wild coho salmon 6 8 14
Hatchery coho salmon 2 0 2
Hatchery summer sockeye salmon 1 0 1
Wild cutthroat trout 1 0 1
Unknown Species and Rear 5 11 16
Operation of PIT tag antennas at the upper and lower end of SanRay side-channel yielded a total
of 606 unique detections in 2012 (Table 21). Species composition included four wild spring
Chinook (0.7%), two wild summer Chinook (0.3%), 183 wild Chinook (unknown run) (30.2%),
333 wild summer steelhead (55.0%), 62 wild coho (10.2%) and 22 hatchery or unknown species
(3.6%).
Table 21. Totals of unique PIT tag detections by species for the SanRay side-channel, 2012.
Species Lower Upper Total
Wild spring Chinook salmon 2 2 4
Wild summer Chinook salmon 2 0 2
Wild Chinook salmon (unknown run) 152 31 183
Hatchery spring Chinook salmon 0 1 1
Hatchery Chinook salmon (unknown run) 0 1 1
Wild summer steelhead 197 136 333
Hatchery summer steelhead 1 2 3
Wild coho salmon 42 20 62
Unknown Species and Rear 7 10 17
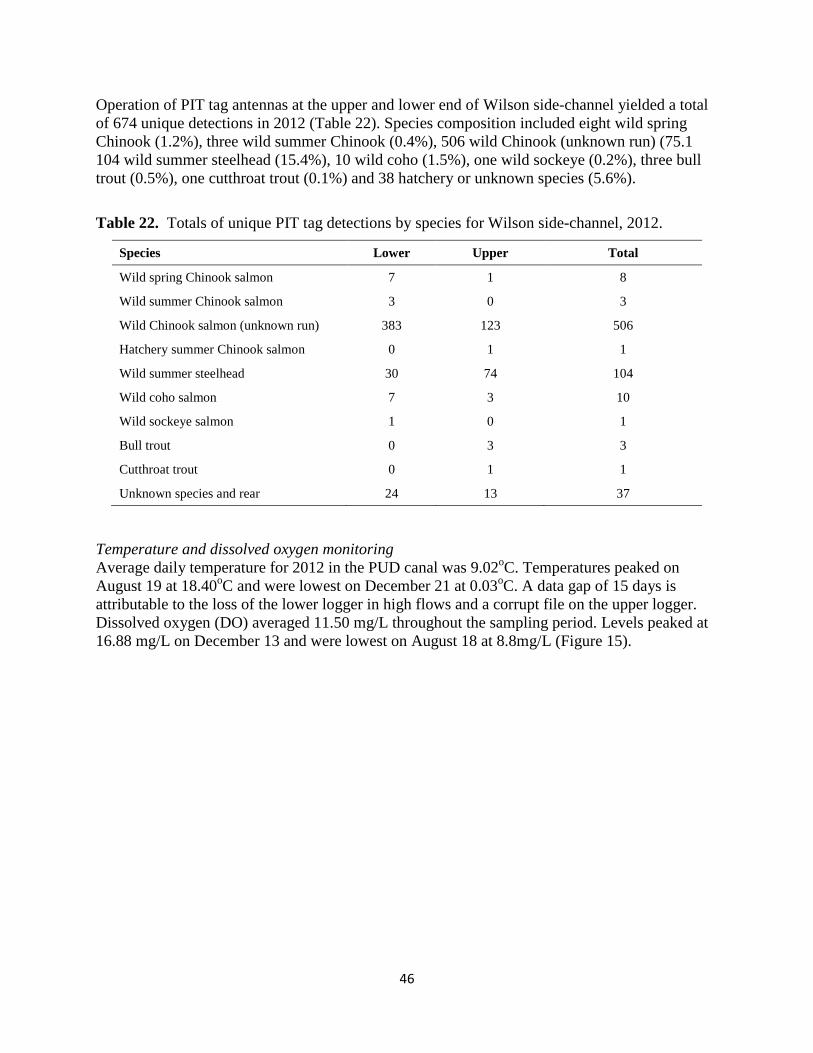
46
Operation of PIT tag antennas at the upper and lower end of Wilson side-channel yielded a total
of 674 unique detections in 2012 (Table 22). Species composition included eight wild spring
Chinook (1.2%), three wild summer Chinook (0.4%), 506 wild Chinook (unknown run) (75.1
104 wild summer steelhead (15.4%), 10 wild coho (1.5%), one wild sockeye (0.2%), three bull
trout (0.5%), one cutthroat trout (0.1%) and 38 hatchery or unknown species (5.6%).
Table 22. Totals of unique PIT tag detections by species for Wilson side-channel, 2012.
Species Lower Upper Total
Wild spring Chinook salmon 7 1 8
Wild summer Chinook salmon 3 0 3
Wild Chinook salmon (unknown run) 383 123 506
Hatchery summer Chinook salmon 0 1 1
Wild summer steelhead 30 74 104
Wild coho salmon 7 3 10
Wild sockeye salmon 1 0 1
Bull trout 0 3 3
Cutthroat trout 0 1 1
Unknown species and rear 24 13 37
Temperature and dissolved oxygen monitoring
Average daily temperature for 2012 in the PUD canal was 9.02oC. Temperatures peaked on
August 19 at 18.40oC and were lowest on December 21 at 0.03
oC. A data gap of 15 days is
attributable to the loss of the lower logger in high flows and a corrupt file on the upper logger.
Dissolved oxygen (DO) averaged 11.50 mg/L throughout the sampling period. Levels peaked at
16.88 mg/L on December 13 and were lowest on August 18 at 8.8mg/L (Figure 15).

47
Figure 15. Temperature (oC) and dissolved oxygen (mg/L) in the PUD side channel, 2012.
Average daily temperature for 2012 in the SanRay side-channel was 7.79oC. Temperatures
peaked on August 19 at 18.0oC and were lowest in January and February at 0.0
oC. Dissolved
oxygen (DO) average was 10.48mg/L throughout the sampling period. Levels peaked at
12.18mg/L on January 19 and were lowest on August 9 at 8.8mg/L (Figure 16).
Figure 16. Temperature (oC) and dissolved oxygen (mg/L) in the SanRay side channel, 2012.
0
2
4
6
8
10
12
14
16
18
0.00
2.00
4.00
6.00
8.00
10.00
12.00
14.00
16.00
18.00
20.00
Dis
solv
ed O
xy
gen
Tem
per
atu
re
Date
Average Daily Temperature
ICE
Dissolved Oxygen
0
2
4
6
8
10
12
14
16
0.00
2.00
4.00
6.00
8.00
10.00
12.00
14.00
16.00
18.00
20.00
Dis
solv
ed O
xy
gen
Tem
per
atu
re
Date
Average Daily Temperature
Ice
Dissolved Oxygen

48
Average daily temperature for 2012 in Wilson side-channel was 7.79oC. Temperatures peaked on
August 19 at 18.0oC and were lowest in January and February at 0.0
oC. Dissolved oxygen (DO)
average was 10.48mg/L throughout the sampling period. Levels peaked at 12.18mg/L on January
19 and were lowest on August 9 at 8.8mg/L (Figure 17).
Figure 17. Temperature (oC) and dissolved oxygen (mg/L) in Wilson side channel, 2012.
Data dissemination
Data obtained during the winter and summer sampling periods was entered into the P3 program
from PTAGIS. Once data quality checks were complete, this data was then uploaded to PTAGIS
and the MCRFRO database. During the fall sampling period MCRFRO staff collected data on a
handheld data logger using the QC_PIT Tagging program. Fall data was uploaded into the newly
developed ISEMP database on a daily basis where built in measures verified data quality. Once
all data underwent quality testing it was then uploaded to the PTAGIS, and the MCRFRO
databases. Data was also transferred to the Upper Columbia Data Steward on December 20,
2012.
Discussion- Off-Channel Habitat Study
Fish sampling
Although full implementation of fish capture efforts within the off-channel study will not be
completed until 2013, with the addition of more sites, 2012 was the first year SanRay and Wilson
side-channels were sampled in the winter and summer periods. Off-channel fish capture methods
used electrofishing as a primary capture method with the exception of the concrete lined portion
of the PUD canal. In this section, depth is a limiting factor for effective electrofishing and
therefore crews used snorkel-herding methods for fish capture. In our experience, electrofishing
has resulted in higher numbers of capture related mortalities when compared to other methods.
0
2
4
6
8
10
12
14
0.00
2.00
4.00
6.00
8.00
10.00
12.00
14.00
16.00
18.00
20.00
Dis
solv
ed O
xy
gen
Tm
eper
atu
re
Date
Temperature
Ice
Dissolved Oxygen

49
Low water depth and high turbidity inhibits the use of hand-netting and snorkel-seining as a
capture method at most of the off-channel sites. These methods are preferable due to the lower
occurrence of capture related mortality and will be utilized in the future as site conditions allow.
Delayed mortality and tag shed rates were not assessed during off-channel sampling as these
rates have been well documented in past mark-recapture efforts.
The MCRFRO attempted to sample a fourth off-channel site, the Don Jean side-channel (rkm
30.6), during the spring and summer sampling periods. Although this area appeared to have
adequate habitat for salmonids, relatively few were found within the site. In addition, high water
velocities limited the extent of monitoring that could be performed throughout much of the year.
As it appears that salmonids currently do not utilize this habitat MCRFRO opted to focus efforts
on the PUD irrigation canal although periodic sampling at the Don Jean site will occur in the
future.
Summer vs. spring Chinook salmon
The problem of accurately assigning a run designation to Chinook salmon encountered in the late
summer months was managed using the same criteria as was applied in the Entiat River mark-
recapture study. Juvenile Chinook salmon encountered in the summer and fall sampling periods
were classified as ‘wild Chinook (unknown run)’. In future sampling, the fall and summer
periods will be the only times this classification will be applied as run classification of Chinook
encountered during spring period is known.
Site level point estimates
The difference in abundance estimates between the off-channel sites during the fall period has
raised concern. Habitat complexity may explain the differences in species composition; however,
high abundance of juvenile salmonids within Wilson’s side-channel during the fall sampling
period is concerning. MCRFRO is closely monitoring over winter conditions within the Wilson
side-channel and expects that survival and growth estimates will be completed in 2013.
Modifications were made to Wilson’s side-channel through a project sponsored by Trout
Unlimited in 2004 and included an inlet pipe, the placement of wood and boulders within the
channel, and riparian plantings. Since the completion of this project the side-channel has been
impounded through beaver activity which has increased annually. Currently the site exists as a
series of ponds which may act as a barrier to passage during normal fall and winter flow
conditions resulting in the overwinter stranding of juveniles. Furthermore, the site experiences
significant ice cover during the winter months. Through continued monitoring of this and other
sites, MCRFRO is hopeful that the information obtained may be used to better maintain current
off-channel habitats and be insightful for improving designs and maintenance considerations of
future sites.
Antenna monitoring
Incorporating PIT tag antenna monitoring into the Off-Channel Habitat Study will provide
significant insight into when these habitats are being utilized by wild Chinook and steelhead.
Furthermore, data generated from PIT tag antennas will serve to bolster future estimates of
survival within these habitats. In 2012, a number of operational issues arose early in the
monitoring year which resulted in numerous data gaps. Most of these issues were resulting from
equipment failure although staff inexperience with operating and maintaining the monitoring
equipment played a role to a lesser extent. Spring time high river flow further limited our ability

50
to adequately monitor at a number of locations. New operational procedures, staff training and
equipment modifications greatly decreased the periods of downtime later in the monitoring
period.
Habitat monitoring
In 2012, physical habitat measurements were recorded by staff from Terraqua Inc. As this work
was not conducted within the contractual scope of MCRFRO it is not included within this report.
Project goals
MCRFRO will be adding two new sites during the winter/spring of 2013. By adding these sites
we will be able to continue monitoring various habitat types at different locations. As more data
is acquired, a quantitative assessment of the biological importance of these habitats to juvenile
spring Chinook and steelhead will be accomplished. MCRFRO is hopeful that this study will
provide valuable insight into the design of future off-channel habitat restoration projects.
Additionally, we will per sue upgrading antenna monitoring equipment to include solar battery
charging capabilities. This upgrade would further limit data loss by ensuring a steady supply of
power with less physical maintenance requirements.
Methods- PIT Tag Interrogation Site Monitoring
Interrogation site locations
MCRFRO operated six PIT tag interrogation sites within the Entiat watershed in 2012. The
lower Entiat River interrogation site (ENL) has been operational since 2007 and is located below
the rotary screw trap at rkm 2. The interrogation site near the town of Ardenvoir (ENA) was
installed in May of 2011 and is located at rkm 17.1. The middle Entiat River interrogation site
(ENM) has been operational since 2008 and is located below the McKenzie diversion dam at
rkm 26. The interrogation site near Stormy Creek (ENS) was installed in April of 2011 and is
located at rkm 35.7. The Entiat River Forest Service boundary (ENF) site became operational in
2010 and is located at rkm 40.6. The Mad River (MAD) site has been operational since 2008 and
is located on the Mad River at rkm 1. Locations of current interrogation sites within the Entiat
watershed are shown in Figure 18.

51
Figure 18. Map of the locations of PIT tag interrogation sites in the Entiat River, 2012.
Interrogation site operation
Interrogation sites were equipped with a multiplexing transceiver (Destron-Fearing Digital Angel
model # FS1001M) capable of reading full duplex PIT tags (134.2 kHz). Six antennas, each
ranging from 3.0 to 6.1 m, spanned the width of the river at each site. Antenna power and
communication was provided by a coax cable connected to the transceiver. External AC power
was used to charge DC batteries in a weatherproof housing.
Antenna size was dependent upon the width of the river and thus varied between individual sites.
Antennas were configured within the river in rows to determine the direction of fish movement
and increase site efficiency through redundancy. At main-stem Entiat River interrogation sites
(ENL, ENA, ENM, ENS and ENF) antennas were configured as two rows of three while at the
Mad River interrogation site (MAD) three rows of two antennas were used.

52
Interrogation sites were operated continuously throughout the year with exception to brief
periods of equipment failure. All sites were downloaded weekly or as necessary based on river
conditions or expected periods of high fish movement. Records of operational status were taken
during each site visit. Transceiver data files were either transmitted via a cellular modem located
at the site or by manually downloading the file onto a laptop computer. Site operational status
and data files were uploaded to the PTAGIS website on a weekly basis.
Proportions of Entiat River origin, stray, and unknown origin fish were calculated using PTAGIS
based web queries of all detections logged within the Entiat basin. Data generated from web
queries was validated through the MCRFRO database to ensure its completeness. Juvenile versus
adult classification was based on a combination of comments made by tagging agencies at time
of initial capture and the time period between the initial tagging date and last interrogation date.
Interrogation site maintenance
Routine maintenance was conducted by MCRFRO and included cable reconnection, replacement
of anchor straps, debris removal, and antenna tuning. Repairs in the event of equipment failure
were beyond the contractual scope of work for MCRFRO as defined in 2012. In these events the
Upper Columbia ISEMP coordinator (Pamela Nelle) and subsequently Washington Department
of Fish and Wildlife (WDFW) staff were contacted to schedule repairs.
Results- PIT Tag Interrogation Site Monitoring
Monitoring periods
PIT tag interrogation sites were considered fully operational if all antennas were functioning
properly and the site was logging data as expected. During the 366 day monitoring period, the
ENL site operated for 366 days (100%), ENM for 363 days (99.05%), ENF for 354 days (96.86),
MAD for 366 days (100%), ENA for 305 (83.42%), and the ENS site operated 241 (65.85%).
Specific details pertaining to site inactivity or failure are outlined in Appendices 8 through 13.
Detection summary
In 2012, a combined total of 2,510 unique PIT tag detections were recorded between all sites
(Table 23). Unique detections were determined by pooling detections from all sites during the
monitoring period and removing any duplicate values. Juvenile fish accounted for a total of
2,168 (86.4%) of all unique detections, adult detections accounted for 342 (13.6%). Of the
juvenile detections a total of 2,161 (99.7%) were determined to be of Entiat River origin and 7
(0.3%) were apparent strays (Table 24). A total of 118 (34.5%) adults were of Entiat River
origin, 197 (57.6%) were apparent strays, and 27 (7.9%) were of unknown origin (Table 25). In
general, adults of an unknown origin were tagged as adults at collection facilities within the
Columbia hydro system.

53
Table 23. Combined unique detections from all interrogation sites within the Entiat watershed,
2012. PTAGIS naming convention used to indicate species, run and rear type.
Species (indicating rear and run type) Juvenile Adult Total Detected
Hatchery spring Chinook salmon 1 11 12
Wild spring Chinook salmon 487 44 531
Spring Chinook salmon (unknown rear type) 0 1 1
Hatchery summer Chinook salmon 110 24 134
Wild summer Chinook salmon 301 15 316
Hatchery fall Chinook salmon 0 3 3
Fall Chinook salmon (unknown rear type) 0 4 4
Chinook salmon (unknown run and rear type) 0 13 13
Hatchery Chinook salmon (unknown rear type) 0 8 8
Wild Chinook salmon (unknown run) 633 6 639
Hatchery coho salmon (unknown run) 1 4 5
Wild coho salmon (unknown run) 11 0 11
Hatchery summer steelhead 4 32 36
Summer steelhead (unknown rear type) 0 4 4
Wild summer steelhead 588 131 601
Hatchery summer sockeye salmon 0 5 5
Wild sockeye salmon (unknown run) 0 1 1
Hatchery sockeye salmon (unknown run) 0 3 3
Sockeye salmon (unknown run and rear type) 0 3 3
Bull trout 15 28 43
Wild resident cutthroat trout 17 2 19
Mountain whitefish 0 1 1
Grand totals 2,168
342 2,510

54
Table 24. Origin of juvenile fish detected at interrogation sites within the Entiat River, 2012.
PTAGIS naming convention used to indicate species, run and rear type.
Species (indicating rear and run type) Entiat Origin Stray Total
Hatchery spring Chinook salmon 0 1 1
Wild spring Chinook salmon 487 0 487
Hatchery summer Chinook salmon 110 0 110
Wild summer Chinook salmon 301 0 301
Wild Chinook salmon (unknown run) 0 0 0
Hatchery coho salmon (unknown run) 0 1 1
Wild coho salmon (unknown run) 11 0 11
Hatchery summer steelhead 0 4 4
Wild summer steelhead 587 1 588
Hatchery sockeye salmon (unknown run) 0 0 0
Bull trout 15 0 15
Wild resident cutthroat trout 17 0 17
Grand totals 2,161 7 2,168

55
Table 25. Origin of adult fish detected at interrogation sites within the Entiat River, 2012.
PTAGIS naming convention used to indicate species, run and rear type.
Species (indicating rear and run type) Entiat Origin Stray Unknown
Origin Total
Hatchery spring Chinook salmon 0 11 0 11
Spring Chinook (unknown run) 0 0 1 1
Wild spring Chinook salmon 41 0 3 44
Hatchery summer Chinook salmon 0 24 0 24
Wild summer Chinook salmon 1 14 0 15
Hatchery fall Chinook salmon 0 3 0 3
Fall Chinook salmon (unknown rear type) 0 0 4 4
Chinook salmon (unknown run and rear type) 0 0 13 13
Hatchery Chinook Salmon (unknown run) 0 8 0 8
Wild Chinook salmon (unknown run) 6 0 0 6
Hatchery coho salmon (unknown run) 0 4 0 4
Wild coho salmon (unknown run) 0 0 0 0
Hatchery summer steelhead 0 32 0 32
Summer steelhead (unknown rear type) 0 0 4 4
Wild summer steelhead 42 89 0 131
Hatchery summer sockeye salmon 0 5 0 5
Hatchery sockeye salmon (unknown run) 0 3 0 3
Sockeye salmon (unknown run and rear type) 0 0 2 2
Wild sockeye salmon (unknown run) 0 1 0 1
Bull trout 26 2 0 28
Wild resident cutthroat trout 2 0 0 2
Mountain whitefish 0 1 0 1
Grand totals 118 197 27 342
Discussion- PIT Tag Interrogation Site Monitoring
Interrogation site operation
Instream interrogation sites are often subjected to a multitude of harsh conditions that can result
in equipment loss or damage. As this typically occurs during high water events, there are periods
of time in which they cannot be safely accessed for repair. This occurs most frequently at the
ENL site due to its location within the drainage and the higher flow associated with it. In 2012,
only minor repairs were required following peak spring river flow.

56
Project goals
Project goals were met during 2012. In the coming year we will upgrade the capacity of
interrogation site monitoring. We will continue to explore various methods to determine site
detection efficiency. We will also explore new anchoring techniques and materials in attempt to
maintain interrogation sites in an operable status through normal high river discharge condition
Methods- Steelhead Redd Surveys
Surveys to count steelhead redds were conducted using methods described in Nelle and Moberg
(2008). The main-stem Entiat River was surveyed from Fox Creek Campground (river kilometer
(rkm) 45) to the Entiat information kiosk (rkm 1.1). The survey area was divided into four
reaches based on river access points and distances that could be surveyed in a work day (Figure
19, Table 26). A two person crew each using a 10’ cataraft, conducted redd surveys in a
downstream manner. Surveyors walked areas that were inaccessible or unsafe to raft. All four
reaches were surveyed on a weekly basis as long as the weather and stream conditions permitted.

57
Figure 19. The four reaches of steelhead redd surveys on the Entiat River, 2012.
Table 26. Steelhead spawning ground reaches on the Entiat River in 2012.
Reach Start (Landmark) End Length (km)
D rkm 45.0 (Fox Cr. Campground) rkm 37.7 7.3
C rkm 37.7 (Brief Bridge) rkm 25.9 11.8
B rkm 25.9 (McKenzie Diversion) rkm 10.6 15.3
A rkm 10.6 (Entiat NFH) rkm 1.1 9.5
Three separate methods were used to describe water clarity. First, a Secchi disk method of
calculating lateral water visibility that we first used in 2011 was further developed. This

58
technique used a weighted Secchi disk attached to a cord 1.5m in length and a fifty meter
measuring tape. The downstream surveyor rested the Secchi disk on the bottom at a depth of
0.5meters with the face oriented parallel to the water surface. A second observer waded upstream
unreeling the measuring tape until the disk’s color patterns are no longer discernible. The
distance was recorded (Figure 20). The second method categorized water clarity by visual
estimation. Water clarity was recorded as 1 (very clear), 2 (somewhat turbid), or 3 (too turbid to
see through) by the observers; a category 3 precludes the survey for the day. Finally, water
samples were taken to measure stream turbidity by light scatter due to suspended particles. In the
office samples were transferred into clear glass vials, placed in a Hach 2100P Portable Turbid
meter, and NTUs were recorded. All three water visibility measurements were recorded at the
start and end of each survey reach.
Weather conditions were recorded at the beginning of each survey. Changes in weather
conditions taking place throughout the duration of the survey were recorded.
Water temperatures were recorded at the beginning and end of each survey reach. Temperatures
(°C) were taken with calibrated thermometers accurate to +/- 0.04 - 0.07°.
Figure 20. Diagram showing Lateral Secchi Disk visibility measurement.
Results- Steelhead Redd Surveys
Steelhead redd surveys began on February 14, 2012 and continued through May 10, 2012.
During the week of April 25, we were unable to complete any surveys due to high discharge and
low water clarity. One additional survey was done on reach A, B and C the week of June 13.
These final surveys were done to remove flagging and to determine if spawning had continued
throughout the high flow period. During the survey season water temperatures ranged from
0.0°C at the beginning to 9.5° C at the end. Turbidity averaged 0.97 NTU, lateral Secchi disk
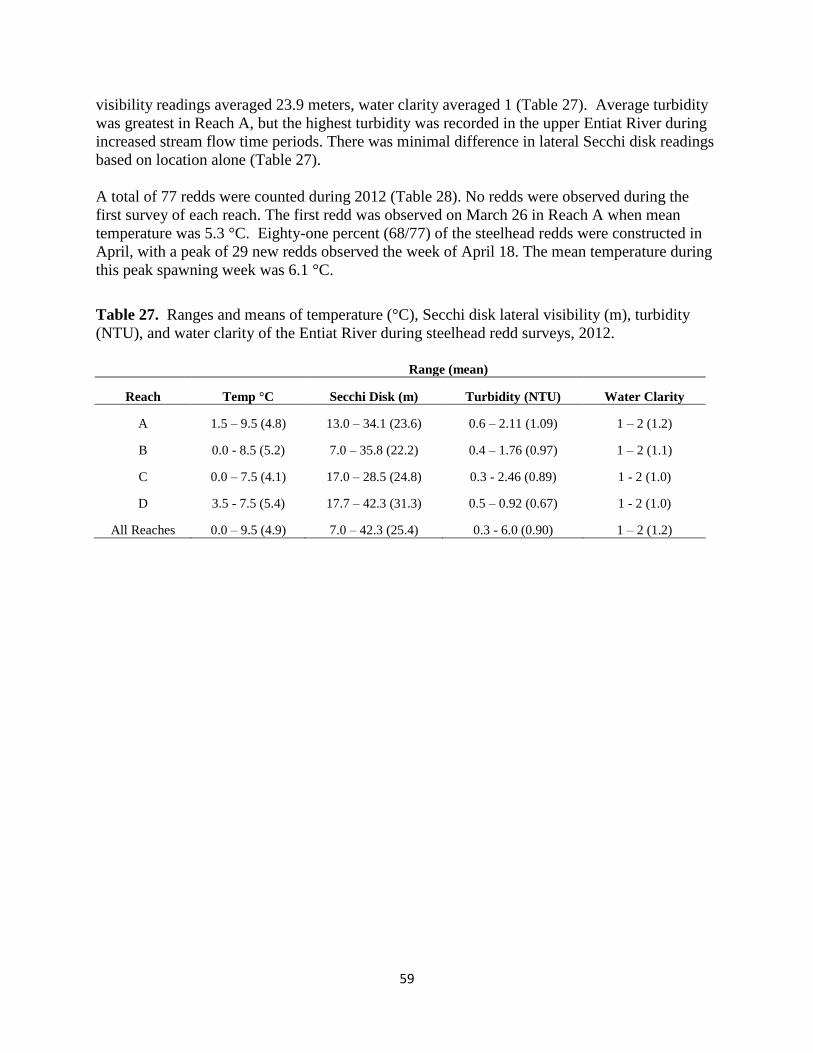
59
visibility readings averaged 23.9 meters, water clarity averaged 1 (Table 27). Average turbidity
was greatest in Reach A, but the highest turbidity was recorded in the upper Entiat River during
increased stream flow time periods. There was minimal difference in lateral Secchi disk readings
based on location alone (Table 27).
A total of 77 redds were counted during 2012 (Table 28). No redds were observed during the
first survey of each reach. The first redd was observed on March 26 in Reach A when mean
temperature was 5.3 °C. Eighty-one percent (68/77) of the steelhead redds were constructed in
April, with a peak of 29 new redds observed the week of April 18. The mean temperature during
this peak spawning week was 6.1 °C.
Table 27. Ranges and means of temperature (°C), Secchi disk lateral visibility (m), turbidity
(NTU), and water clarity of the Entiat River during steelhead redd surveys, 2012.
Range (mean)
Reach Temp °C Secchi Disk (m) Turbidity (NTU) Water Clarity
A 1.5 – 9.5 (4.8) 13.0 – 34.1 (23.6) 0.6 – 2.11 (1.09) 1 – 2 (1.2)
B 0.0 - 8.5 (5.2) 7.0 – 35.8 (22.2) 0.4 – 1.76 (0.97) 1 – 2 (1.1)
C 0.0 – 7.5 (4.1) 17.0 – 28.5 (24.8) 0.3 - 2.46 (0.89) 1 - 2 (1.0)
D 3.5 - 7.5 (5.4) 17.7 – 42.3 (31.3) 0.5 – 0.92 (0.67) 1 - 2 (1.0)
All Reaches 0.0 – 9.5 (4.9) 7.0 – 42.3 (25.4) 0.3 - 6.0 (0.90) 1 – 2 (1.2)

60
Table 28. The numbers of new steelhead redds counted each week and cumulative totals in the
survey reaches on the Entiat River, 2012.
Number of steelhead redds
Midweek
Date
A B C D All Reaches
New Total New Total New Total New Total New Total
02/15/12 0 0
-- --
-- --
-- --
0 0
02/22/12 0 0
0 0
-- --
-- --
0 0
02/29/12 0 0
0 0
0 0
-- --
0 0
03/07/12 0 0
0 0
0 0
-- --
0 0
03/14/12 0 0
0 0
0 0
-- --
0 0
03/21/12 0 0
0 0
0 0
-- --
0 0
03/28/12 1 1
0 0
0 0
-- --
1 1
04/04/12 4 5
1 1
2 2
-- --
7 8
04/11/12 9 14
9 10
9 11
-- --
27 35
04/18/12 7 21
9 19
13 24
0 0
29 64
04/25/12 -- 21
-- 19
-- 24
-- 0
64
05/02/12 3 24
1 20
3 27
-- 0
7 71
05/09/12 5 29
0 20
1 28
0 0
6 77
5/16/2012 -- 29
-- 20
-- 28
-- --
0 77
5/23/2012 -- 29
-- 20
-- 28
-- --
0 77
5/30/2012 -- 29
-- 20
-- 28
-- --
0 77
6/6/2012 -- 29
-- 20
-- 28
-- --
0 77
6/13/2012 0 29 0 20 0 28 -- -- 0 77 Note: Cells containing -- indicate a survey was not conducted in that reach during the survey week. Midweek dates appearing in italics denote that no surveys were attempted due to stream conditions.
The number of steelhead redds counted in each reach during 2006 to 2012 are shown in Table
29. Figure 21 shows the number of redds by month from 2006 to 2012. The location of
individual redds within the survey reaches are shown in Figures 22 through 25. In 2012, 38% of
the steelhead redds were found in Reach A, 26% in Reach B, 36% in Reach C and 0% in Reach
D. We documented the onset of spawning in all reaches except D, where surveys started as
scheduled on April 18, but stream flows did not allow for the next survey until May 9. At this
time no redds were observed in reach D and no additional surveys were attempted due to stream
conditions. This resulted in a count of zero for reach D. This year Reach A had the lowest
number of redds recorded to date.
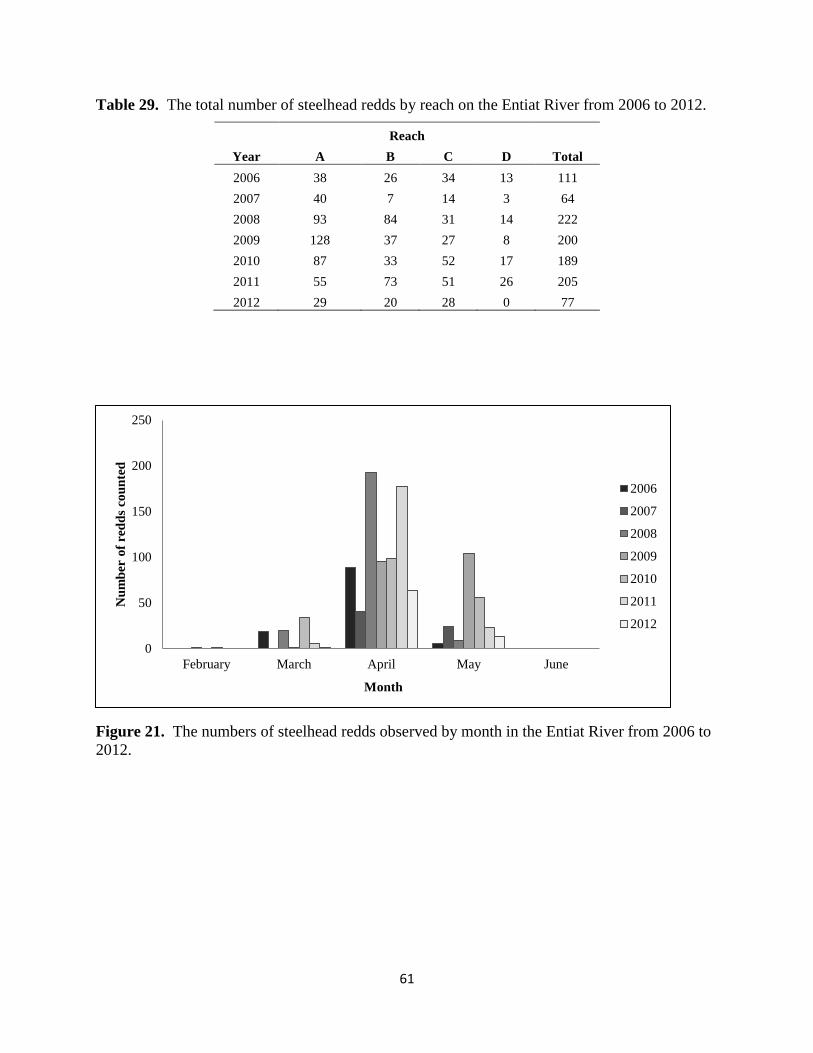
61
Table 29. The total number of steelhead redds by reach on the Entiat River from 2006 to 2012.
Reach
Year A B C D Total
2006 38 26 34 13 111
2007 40 7 14 3 64
2008 93 84 31 14 222
2009 128 37 27 8 200
2010 87 33 52 17 189
2011 55 73 51 26 205
2012 29 20 28 0 77
Figure 21. The numbers of steelhead redds observed by month in the Entiat River from 2006 to
2012.
0
50
100
150
200
250
February March April May June
Nu
mb
er o
f re
dd
s co
un
ted
Month
2006
2007
2008
2009
2010
2011
2012

62
Figure 22. Locations of steelhead redds observed in Reach A during surveys conducted by
USFWS on the Entiat River, 2012.

63
Figure 23. Locations of steelhead redds observed in Reach B during surveys conducted by the
USFWS on the Entiat River, 2012.

64
Figure 24. Locations of steelhead redds observed in Reach C during surveys conducted by the
USFWS on the Entiat River, 2012.

65
Figure 25. No steelhead redds were observed in Reach D during surveys conducted by the
USFWS on the Entiat River, 2012.
Four redds in reach A (14% of reach total) were associated with restoration sites. This is lower
than last years’ count (20 redds or 36% of the reach A total) and is the fewest redds counted
within restoration areas since 2007. All restoration sites have seen a gradual decline in redd
construction over the past seven seasons (Table 30).

66
Table 30. Number of redds observed in close proximity to restoration sites in reach A of the
Entiat River, 2006 through 2012.
Survey Year 2012 2011 2010 2009 2008 2007 2006
Total Redds Observed 77 205 189 200 222 64 111
Redds above reach A 48 150 102 72 129 24 73
Redds in reach A 29 55 87 128 93 40 38
Hatchery to Dinkelman Canyon Rd.
John Small Barbs (pre 2006) 0 0 0 0 0 0 0
Hanan/Detwiler Cross Vane (2007) 0 0 1 5 9 9 2
Rest of the Section 14 14 23 32 31 18 5
Total Redds 14 14 24 37 40 27 7
Dinkelman Canyon Rd. to Fire Station
Dinkelman Canyon. Rd. Cross Vane (2001) 0 1 1 2 3 0 0
PUD Irrigation Ditch 0 0 6 2 4 0 7
Whitehall Cross Vane (2006) 0 1 7 1 4 0 1
Rest of the Section 4 5 10 17 6 0 6
Total Redds 4 7 24 22 17 0 14
Fire Station to U.S.G.S.
Fire Station Cross Vanes (2001) 1 3 2 6 1 0
Milne Irrigation Diversion (2007) 0 8 6 15 24 3 4
Rest of the Section 2 3 0 10 2 4 2
Total Redds 3 14 8 31 27 7 6
U.S.G.S. to Columbia River Confluence
Keystone (2009) 3 7 11 6 0 0 1
Rest of the Section 5 13 20 33 9 6 10
Total Redds 8 20 31 39 9 6 11
Discussion- Steelhead Redd Surveys
Steelhead spawning ground surveys on the Entiat River were conducted within the required time
frame. Surveys were initiated in mid-February to provide zero counts and to avoid missing the
initiation of spawning activity. Conditions did not allow for surveys during the week of April 25
which most likely affected the total numbers of redds. In previous years on the Entiat River,

67
surveyors observed more redds during April than any other month and particularly in late April.
We were able to determine the onset of the spawning season this year, but the end of spawning
was not well defined. In order to better determine when spawning season ceases surveyors
attempted to do several surveys after high water had begun to recede. No redds were found
during this final week of surveys. We documented the onset of spawning in all reaches except D.
Only two surveys were attempted in this reach due to unexpected increases in discharge. This
resulted in a count of zero for reach D. Reach D has generally contributed to the total redd count
in previous years, (8% from 2006-2012). Similar to previous years, the majority of new redds
(99% in 2012) were observed during April and May.
The new method for estimating redd visibility in relation to line of sight has proved difficult to
reliably replicate. Many factors affect the measurement, including the amount of sunlight in the
sky, the water surface (glassy versus rippled), shadows over the water’s surface and the
subjectivity of the individual estimating the point at which the Secchi disk is no longer visible.
However, this method seems to be a better estimator of real world survey conditions despite the
environmental factors taken into account.
The Hanan-Detwiler irrigation diversion located at rkm 5 was not opened this year. In previous
years this diversion was used for construction of a few redds. In 2011 the Hanan-Detwiler
irrigation diversion was mechanically plugged with soil and large boulders at the location of the
existing diversion head gate and has since been abandoned (BOR, 2012). The fish return
channel was dry and prevented any spawning from occurring in the channel during 2012.
However, the channel has never produced a large number of redds and the lack of water has little
impact on the total number of redds in reach A.
The primary purpose of the surveys is to monitor the spawning steelhead population in the Entiat
River. Annually surveying areas where habitat restoration projects have been implemented may
make it possible to determine if these sites have a long term effect on the numbers and
distribution of spawning steelhead. Existing restoration projects were intended to improve
limiting factors for ESA listed species populations within the Entiat River system (BOR, 2012).
The idea was to introduce more diverse habitat to the lower river, which was lacking
heterogeneity (BOR, 2012). Although the original addition of several restoration sites was not
intended to enhance spawning habitat, some side effects have been noted throughout annual
monitoring. Generally during the first year of construction at a given restoration site, heavy
equipment is used to place large structures in the stream and the adjacent bank. During this
construction many different sizes of substrate are uncovered and disturbed from their original
location in the stream bed. This causes much of this newly exposed spawning sized gravel,
which was previously embedded in finer sediments and sand, to be more readily available to
spawning steelhead. After the initial construction year we have observed redds in the proximity
to almost all restoration sites. This effect varies at each site due to water depth, velocities, and
likelihood that fish would find the area suitable for spawning. Our redd surveys document a
decline in redd construction around the initial restoration sites in subsequent years. This could be
due to increased fine sediment deposition over top of substrate which was previously disturbed.
One example of substrate deposition has occurred at the Milne restoration project. Large woody
debris, boulder groupings, and a rock barb were placed at this site during 2006 and 2007 (BOR,
2012). We saw a dramatic increase in redd construction in 2008 (Table 5). Fewer redd numbers
were seen in this section after 2008, probably due to the continual deposition of fine sediments.

68
Even with the decline of redd productivity the area still seems to attract more spawning than
during pre-restoration. Perhaps the restoration additions that were meant to promote deposition
of spawning gravels have functioned, thus we are still seeing higher redd productivity at these
sites. In 2009, construction of the Keystone Canyon restoration site exposed and loosened
previously embedded gravel substrate. This created spawning habitat and increased the number
of redds at this site. Large woody debris and boulders were also placed at this site. It appears that
an increase in spawning depends upon the type of structure and where it is located i.e. pool,
riffle, or run. Restoration sites that are intended to create pool habitat have had a much shorter
longevity for increasing redd productivity. This is thought to be due to the fact that a flood event
large enough to mobilize bed material at these sites has not occurred since construction (BOR,
2012). Whereas restoration sites such as Milne and Keystone Canyon that utilize instream habitat
enhancements to promote spawning gravel deposition still produce more redds. These sites may
also allow hydrological processes to continually remove fine sediments and sand during peak
flow events better than the pool habitat enhancements. Thus, it appears that an increase in
spawning activity could be attributed to large woody debris and boulder groupings like those
placed at the Milne and Keystone sites. However this remains to be seen. Although not
mentioned in previous reports the Knapp-Wham irrigation diversion has undergone maintenance
construction annually. The diversion consistently has redds located directly in the canal above
the head gate in proximity to this construction. Long term monitoring will be needed to further
analyze these complex habitat enhancements and their value to spawning steelhead.

69
Acknowledgements
MCRFRO staff diligently spent many long hours collecting accurate data for these ISEMP
programs. Thanks to all who assisted with juvenile fish capture operations, PIT Tag Antenna Site
operation and maintenance and steelhead redd surveys: Eric Forbes, Brett Kokes, Andy Johnsen,
Eric Mooney, Dena Mullin, Ken Muir, Barb Kelly-Ringel, Ryan Salem, Dan Sulak, Tara Taylor,
and Heather Trainer. We would further like to acknowledge the dedicated staff provided by the
Washington Department of Fish and Wildlife, Yakama Nation and Terraqua for their valuable
assistance in mark-recapture sampling: Elaine Bianchi, Matt Club, Surya Dimodica, Lauren
Doner, Joe Ezel, Chris Jones, Tom Koski, Ryan Leary, Rueben Miller, Conner Parrish, Jon
Raymond, Kayla Truscott, and Keith Watson. Thanks to Mark Nelson and other MCRFRO staff
for the valuable editorial insight. Last but not least, the success of these projects would have been
limited if not for the support from Craig Chisam, Josh Holmer, and Jason Reeves, the
exceptional staff of Entiat National Fish Hatchery.

70
References
Anderson, R.O, S.J. Gutreuter. 1983. Length, Weight, and Associated Structural Indices. In:
Fisheries Techniques. (eds. L. A. Nielsen and D. L. Johnson), pp. 283-300. Bethesda MD:
American Fisheries Society.
Bailey, N. J. 1951. On estimating the population size of mobile populations from recapture
data. Biometrica, 38:293-306.
Bateman, D.S., R.E. Gresswell. 2006. Survival and Growth of Age-0 Steelhead after Surgical
Implantation of 23-mm Passive Integrated Transponders. North American Journal of Fisheries
Management 26:545-550.
Bilby, R.E., W.J. Ehinger, C. Jordan, K. Krueger, M. McHenry, T. Quinn, G. Pess, D. Poon, D.
Seiler, G. Volkhardt. 2004. Evaluating watershed response to land management and restoration
actions: Intensively monitored watersheds (IMW) progress report. Submitted to Washington
Salmon Recovery Funding Board.
Bilby, R.E., W. Ehinger, T. Quinn, G. Volkhardt, K. Krueger, D. Seiler, G. Pess, C. Jordan, M.
McHenry, D. Poon. 2005. Study evaluates fish response to management actions. Western
Forester 50(2):14-15.
Bureau of Reclamation. 2012. Existing Projects Review: Lower Entiat River, Washington. U.S.
Department of the Interior, Bureau of Reclamation, Pacific Northwest Regional Office, Boise,
Idaho. April 2012.
Carpenter, S.R., S.W. Chisholm, C.J. Krebs, D.W. Schindler, R.F. Wright. 1995. Ecosystem
experiments. Science 269(5222):324-327.
Chapman, D. G. 1948. A mathematical study of confidence limits of salmon populations
calculated from sample tag ratios. Internet Pacific Salmon Fisheries Comm. Bull., 2:69-85.
Chelan County Conservation District. 2004. Entiat Water Resource Inventory (WRIA) 46
Management Plan. October 2004. Prepared for the Entiat Watershed Planning Unit by the
Chelan County Conservation District. Wenatchee, Washington.
Hillman, T.W. 2006. Monitoring strategy for the Upper Columbia Basin. Bioanalysts, Inc.
Second draft report to the Upper Columbia Regional Technical Team, Upper Columbia Salmon
Recovery Board, Wenatchee, Washington. Available: http://www.ucsrb.com/resources.asp.
(December 2010).
Knudsen, C.M., M.V. Johnston, S.L. Schroder, W.J. Bosch, D.E. Fast, C.R. Strom. 2009.
Effects of Passive Integrated Transponder Tags on Smolt-to-Adult Recruit Survival, Growth, and
Behavior of Hatchery Spring Chinook Salmon. North American Journal of Fisheries
Management 29:658-669.

71
Mullan J. W., K. R. Williams, G. Rhodus, T. W. Hillman, J. McIntyre. 1992. Production and
habitat of salmonids in the mid-Columbia River tributary streams. U.S. Fish and Wildlife
Service Monograph I.
National Oceanic and Atmospheric Administration, National Marine Fisheries Service. 2000.
Guidelines for Electrofishing Waters Containing Salmonids Listed Under the Endangered
Species Act. Available: http://www.nwr.noaa.gov/ESA-Salmon-Regulations-Permits/4d-
Rules/upload/electro2000.pdf. (December, 2010).
Nelle, R.D. and J. Moberg 2008. A Field Manual of Scientific Protocols for Steelhead
Redd Surveys within the Upper Columbia Monitoring Strategy. Terraqua, Inc.
PNAMP. 2005. Establishing a network of intensively monitored watersheds in the Pacific
Northwest. http://www.pnamp.org/node/1061.
Reeve, T., J. Lichatowich, W. Towey, A. Duncan. 2006. Building sciences and accountability
into community-based restoration: can a new funding approach facilitate effective and
accountable restoration? Fisheries 31(1):17-24.
Robson, D.S. and H.A. Regier. 1964. Sample size in Petersen mark-recapture experiments.
Transactions of the American Fisheries Society 93:215-226.
Roni, P., M.C. Liermann, C. Jordan, E.A. Steel. 2005 in P. Roni, editor. Monitoring stream and
watershed restoration. American Fisheries Society, Bethesda, Maryland.
Temple, G.M.,T.N. Pearsons. 2006 Evaluation of the Recovery Period in Mark-Recapture
Population Estimates of Rainbow Trout in Small Streams. North American Journal of Fisheries
Management 26:941-948.
USCRB. 2007. Upper Columbia Spring Chinook Salmon and Steelhead Recovery Plan. Upper
Columbia Salmon Recovery Board. http://www.ucsrb.com/UCSRP%20Final%209-13-2007.pdf
Van Den Avyle M.J. and R.S. Hayward. 1999. Dynamics of Exploited Fish Populations. In:
Inland Fisheries Management in North America Second Edition. (eds. C.C. Kohler and W.A.
Hulbert), pp. 127-165. Bethesda MD: American Fisheries Society.

72
Appendix
Appendix Table 1. Summary of nonoperational days for the lower Entiat River rotary screw
trap, 2012.
Date Status Flow
( ) Comments
3/3/2012 Not Operated 4.00 Trap pulled due to IMW staffing needs
3/4/2012 Not Operated 4.20 Trap pulled due to IMW staffing needs
3/5/2012 Not Operated 4.59 Trap pulled due to IMW staffing needs
3/11/2012 Not Operated 4.50 Trap pulled due to IMW staffing needs
3/12/2012 Not Operated 4.65 Trap pulled due to IMW staffing needs
3/13/2012 Not Operated 4.64 Trap pulled due to IMW staffing needs
3/21/2012 Not Operated 4.70 Trap pulled for CPR training
3/25/2012 Not Operated 4.33 Trap pulled
3/26/2012 Not Operated 4.37 Trap pulled due to IMW staffing needs
3/30/2012 Incomplete 6.18 Branch stopped cone
4/1/2012 Not Operated 7.30 Trap pulled
4/11/2012 Incomplete 6.44 Branch stopped cone
4/12/2012 Incomplete 7.19 Branch stopped cone
4/18/2012 Not Operated 9.26 Trap pulled due to hatchery release
4/19/2012 Not Operated 9.23 Trap pulled due to hatchery release
4/20/2012 Not Operated 9.32 Trap pulled due to hatchery release
4/21/2012 Not Operated 10.64 Trap pulled - short handed
4/22/2012 Not Operated 11.91 Trap pulled - short handed
4/23/2012 Incomplete Branch stopped cone
4/24/2012 Incomplete 24.14 Trap sunk
4/25/2012 Incomplete 35.71 Trap sunk
4/26/2012 Incomplete 40.00 Trap sunk
4/27/2012 Not Operated 44.03 Trap pulled due to cone damage
4/30/2012 Incomplete 33.95 Branch stopped cone
5/15/2012 Incomplete 46.80 Trap sunk
5/16/2012 Not Operated 61.26 Trap pulled
5/17/2012 Not Operated 66.95 Trap pulled due to high flow
5/18/2012 Not Operated 61.61 Trap pulled due to high flow
5/19/2012 Incomplete 55.46 Trap sunk
5/28/2012 Incomplete 45.82 Trap sunk
6/1/2012 Incomplete 53.83 Trap pulled due to high flow
6/2/2012 Not Operated 66.94 Trap pulled due to high flow
6/3/2012 Not Operated 74.42 Trap pulled due to high flow
6/4/2012 Not Operated 65.45 Trap pulled due to high flow
6/5/2012 Not Operated 62.33 Trap pulled due to high flow
6/6/2012 Not Operated 62.22 Trap pulled due to high flow
6/7/2012 Not Operated 56.71 Trap pulled due to high flow

73
Appendix Table 1. Continued
Date Status Flow
( ) Comments
6/8/2012 Not Operated 52.09 Trap pulled due to high flow
6/13/2012 Not Operated 46.68 Trap pulled
6/14/2012 Incomplete 56.02 Trap sunk
6/15/2012 Not Operated 56.64 Trap pulled due to high flow
6/16/2012 Not Operated 53.08 Trap pulled due to high flow
6/17/2012 Not Operated 55.33 Trap pulled due to high flow
6/18/2012 Not Operated 68.31 Trap pulled due to high flow
6/19/2012 Not Operated 64.52 Trap pulled due to high flow
6/20/2012 Not Operated 55.57 Trap pulled due to high flow
6/22/2012 Not Operated 52.36 Trap pulled due to high flow
6/23/2012 Not Operated 57.56 Trap pulled due to high flow
6/24/2012 Not Operated 60.71 Trap pulled due to high flow
6/25/2012 Not Operated 56.21 Trap pulled due to high flow
6/26/2012 Incomplete 51.08 Trap sunk
7/1/2012 Not Operated 51.15 Trap pulled due to high flow
7/2/2012 Not Operated 53.74 Trap pulled due to high flow
7/3/2012 Not Operated 48.38 Trap pulled due to high flow
7/4/2012 Not Operated 43.76 Trap pulled for holiday
7/5/2012 Not Operated 39.21 Trap pulled for holiday
7/8/2012 Incomplete 42.32 Trap sunk
7/10/2012 Not Operated 51.40 Trap pulled due to high flow
7/11/2012 Not Operated 48.89 Trap pulled due to high flow
7/14/2012 Not Operated 38.66 Trap pulled - short handed
7/18/2012 Incomplete 33.04 Trap sunk
7/23/2012 Incomplete 21.00 Branch stopped cone
7/28/2012 Not Operated 16.89 Trap pulled due to IMW staffing needs
7/29/2012 Not Operated 15.49 Trap pulled due to IMW staffing needs
7/30/2012 Not Operated 14.48 Trap pulled due to IMW staffing needs
7/31/2012 Not Operated 13.80 Trap pulled due to IMW staffing needs
8/4/2012 Not Operated 11.47 Trap pulled due to IMW staffing needs
8/5/2012 Not Operated 11.03 Trap pulled due to IMW staffing needs
8/6/2012 Not Operated 11.13 Trap pulled due to IMW staffing needs
8/11/2012 Not Operated 8.95 Trap pulled due to IMW staffing needs
8/12/2012 Not Operated 8.63 Trap pulled due to IMW staffing needs
8/13/2012 Not Operated 8.44 Trap pulled due to IMW staffing needs
8/14/2012 Not Operated 8.14 Trap pulled due to IMW staffing needs
8/15/2012 Not Operated 7.83 Trap pulled due to IMW staffing needs
8/16/2012 Not Operated 7.91 Trap pulled due to IMW staffing needs
8/17/2012 Incomplete 7.59 Trap pulled due to IMW staffing needs
8/18/2012 Not Operated 7.49 Trap pulled due to IMW staffing needs
8/19/2012 Not Operated 7.35 Trap pulled due to IMW staffing needs

74
Appendix Table 1. continued
Date Status Flow
( ) Comments
8/20/2012 Not Operated 7.31 Trap pulled due to IMW staffing needs
8/21/2012 Not Operated 7.03 Trap pulled due to IMW staffing needs
8/22/2012 Not Operated 6.82 Trap pulled due to IMW staffing needs
8/23/2012 Not Operated 6.64 Trap pulled due to IMW staffing needs
8/24/2012 Not Operated 6.39 Trap pulled due to IMW staffing needs
8/25/2012 Not Operated 6.01 Trap pulled due to IMW staffing needs
8/26/2012 Not Operated 5.75 Trap pulled due to IMW staffing needs
8/28/2012 Not Operated 5.24 Trap pulled due to IMW staffing needs
9/3/2012 Not Operated 4.50 Trap pulled for holiday
9/4/2012 Not Operated 4.33 Trap pulled for holiday
10/2/2012 Not Operated 3.41 Trap pulled due to IMW staffing needs
10/3/2012 Not Operated 3.31 Trap pulled due to IMW staffing needs
10/4/2012 Not Operated 3.40 Trap pulled due to IMW staffing needs
10/5/2012 Not Operated 3.42 Trap pulled due to IMW staffing needs
10/8/2012 Not Operated 3.35 Trap pulled for holiday
10/9/2012 Not Operated 3.31 Trap pulled due to IMW staffing needs
10/10/2012 Not Operated 3.26 Trap pulled due to IMW staffing needs
10/13/2012 Not Operated 3.11 Trap pulled due to leaf debris
10/16/2012 Incomplete 5.42 Trap pulled due to leaf debris
10/17/2012 Not Operated 6.80 Trap Pulled
10/20/2012 Not Operated 6.50 Trap pulled to prepare for night shifts
10/21/2012 Not Operated 5.64 Trap pulled to prepare for night shifts

75
Appendix Table 2. Summary of fish species captured in the Entiat River rotary screw trap,
2012.
Species and Life Stage Total Capture Capture
Mortality
Wild spring Chinook salmon precocial 4 --
Wild spring Chinook salmon juvenile 7,668 72
Hatchery summer Chinook salmon juvenile 202 --
Wild summer Chinook salmon precocial 3 --
Wild summer Chinook salmon juvenile 6,313 285
Hatchery Chinook salmon (unknown r/t) adult 11 6
Hatchery Chinook salmon (unknown r/t) jack 4 --
Hatchery Chinook salmon (unknown r/t) precocial 1 --
Hatchery Chinook salmon (unknown r/t) juvenile 2 --
Wild Chinook salmon (unknown r/t) adult 2 --
Wild Chinook salmon (unknown r/t) jack 3 1
Wild coho salmon juvenile 99 --
Hatchery summer steelhead adult 2 --
Wild summer steelhead adult 1 --
Wild steelhead juvenile 1,690 4
Bull trout adult 13 --
Bull trout juvenile 82 1
Wild cutthroat trout juvenile 32 --
Wild sockeye salmon (unknown run) adult 1 --
Wild sockeye salmon (unknown run) juvenile 68 --
Other (unknown fish) 26 --
Pacific lamprey ammocoete 1,524 3
Northern pikeminnow adult 5 1
Northern pikeminnow juvenile 4 --
Mountain whitefish adult 7 --
Mountain whitefish juvenile 510 14
Unknown sucker adult 34 --
Unknown sucker juvenile 102 1
Unknown dace 639 19
Chiselmouth adult 9 --
Chiselmouth juvenile 28 --
Unknown sculpin 52 15
Red side shiner 153 1
Three-spine stickleback 1 --
Total 19,295 423

76
Appendix Table 3. Annual dates of inclusion for yearling and sub-yearling Chinook species
used in rotary screw trap based Entiat River production estimates, capture years 2003 to 2012.
Migration Year Life stage Upper Trap Lower Trap
Start End Start End
2003 Yearling -- -- -- --
Sub-yearling 9/1/2003 11/24/2003 -- --
2004 Yearling 3/8/2004 5/26/2004 -- --
Sub-yearling 8/31/2004 11/21/2004 -- --
2005 Yearling 3/2/2005 5/9/2009 -- --
Sub-yearling 8/24/2005 11/27/2005 -- --
2006 Yearling 3/3/2006 5/15/2006 -- --
Sub-yearling 9/1/2006 11/27/2006 -- --
2007 Yearling 2/28/2007 5/18/2007 3/23/2007 5/9/2007
Sub-yearling 9/8/2007 11/20/2007 9/8/2007 11/19/2007
2008 Yearling 3/3/2008 5/15/2008 3/3/2008 5/14/2008
Sub-yearling 9/8/2008 11/20/2008 9/8/2008 11/19/2008
2009 Yearling 2/26/2009 5/14/2009 3/18/2009 5/22/2009
Sub-yearling 9/4/2009 11/20/2009 9/4/2009 11/20/2009
2010 Yearling -- -- 3/1/2010 5/27/2010
Sub-yearling -- -- 9/18/2010 11/19/2010
2011 Yearling -- -- 3/1/2011 5/14/2011
Sub-yearling -- -- 10/4/2011 11/19/2011
2012 Yearling 3/30/2012 5/10/2012 2/29/2012 5/25/2012
Sub-yearling 9/29/2012 10/22/2012 9/29/2012 11/18/2012

77
Appendix Table 4. Mark-recapture site locations, dates sampled, average flow (m3/s),
maximum water temperature (˚C) and sampling notes during the winter 2012 sampling period.
Site
Code River
Site
Length
(m)
RKM Avg.
( )
Mark
Date
Recap
Date
Max
Water
Temp
(˚C)
Sample Comments
1BC4 Entiat 330 1.88 4.63 03/05 03/06 6.0 Site fully sampled.
1D4 Entiat 330 7.42 4.56 03/13 03/14 5.0 Site fully sampled.
1E2 Entiat 330 9.93 4.56 03/13 03/14 4.0 Site fully sampled.
1F13 Entiat 330 14.66 4.63 03/05 03/06 5.5 Site fully sampled.
1G16 Entiat 330 22.45 4.51 03/15 03/16 5.0 Site fully sampled.
2A2 Entiat 330 27.12 4.63 03/05 03/06 4.0 Site fully sampled.
2C1 Entiat 330 30.58 4.32 03/07 03/08 4.0 Site fully sampled.
3A5 Entiat 330 37.35 4.26 03/09 03/10 4.0 Site fully sampled.
3C2 Entiat 330 40.55 4.29 03/09 03/10 3.5 Site fully sampled.
3D2 Entiat 330 41.75 4.56 03/13 03/14 3.0 Site fully sampled.
3F2 Entiat 330 44.59 4.26 03/09 03/10 3.0 Site fully sampled.
M04 Mad 220 0.65 4.32 03/07 03/08 3.0 Site fully sampled.
M14 Mad 220 2.85 4.32 03/07 03/08 2.0 Site fully sampled.
M23 Mad 220 4.83 4.51 03/15 03/16 2.0 Site fully sampled.

78
Appendix Table 5. Number of fish captured and mortalities during the winter 2012 mark
recapture study in the Entiat and Mad rivers.
Species and Life Stage Total Capture Capture Mortality
Wild spring Chinook salmon juvenile 863 2
Wild summer Chinook salmon juvenile 9 1
Wild coho salmon juvenile 11 0
Wild steelhead juvenile 1,975 0
Wild steelhead precocial 3 0
Bull trout juvenile 2 0
Mountain whitefish juvenile 13 0
Unknown sculpin juvenile 3 0
Total 2,879 3

79
Appendix Table 6. Mark-recapture site locations, dates sampled, average flow (m3/s),
maximum water temperature (˚C) and sampling notes during the summer 2012 sampling period.
Site
Code River
Site
Length
(m)
RKM Avg.
( )
Mark
Date
Recap
Date
Max
Water
Temp
(˚C)
Sample Comments
1BC11 Entiat 330 4.19 6.51 08/23 08/24 17.0 Site fully sampled.
1D4 Entiat 330 7.43 6.92 08/21 08/22 18.0 Site fully sampled.
1E3 Entiat 330 10.25 6.51 08/23 08/24 15.5 Site fully sampled.
1F13 Entiat 330 14.66 7.30 08/15 08/16 17.5 Site fully sampled.
1G19 Entiat 330 23.44 8.29 08/13 08/14 17.5 Site fully sampled.
2A5 Entiat 330 28.18 8.29 08/13 08/14 15.0 Site fully sampled.
2C4 Entiat 330 31.55 6.92 08/21 08/22 16.0 Site fully sampled.
3A3 Entiat 330 36.69 7.87 08/15 08/16 16.5 Site fully sampled.
3C1 Entiat 330 40.24 7.54 08/17 08/18 16.5 Site fully sampled.
3D5 Entiat 330 42.73 7.87 08/15 08/16 15 Site fully sampled.
3F2 Entiat 330 44.58 8.29 08/13 08/14 15.5 Site fully sampled.
M04 Mad 220 0.65 6.92 08/21 08/22 15.5 Site fully sampled.
M14 Mad 220 2.85 7.54 08/17 08/18 16.5 Site fully sampled.
M23 Mad 220 4.83 7.54 08/17 08/18 14.0 Site fully sampled.

80
Appendix Table 7. Number of fish captured and mortalities during the summer 2012 mark
recapture study in the Entiat and Mad rivers.
Species and Life Stage Total Capture Capture Mortality
Wild Chinook (unknown run) salmon juvenile 3,529 92
Wild Chinook (unknown run) salmon precocial 3 0
Hatchery summer Chinook salmon juvenile 1 0
Hatchery summer Chinook salmon precocial 1 0
Wild coho salmon juvenile 125 1
Wild steelhead juvenile 2,727 37
Bull trout juvenile 13 0
Wild resident cutthroat trout juvenile 15 0
Pacific lamprey ammocoete 126 0
Mountain whitefish juvenile 52 7
Unknown sucker juvenile 14 0
Unknown dace juvenile 808 1
Unknown sculpin juvenile 2,355 11
Total 9,769 149

81
Appendix Table 8. Site operational summary for the lower Entiat River interrogation site
(ENL) during the 2012 monitoring period.
Date Operational Comments
12/6/2012 Antenna checked all good. Removed debris by antenna.
10/16/2012 Antennas checked all good.
8/22/2012 Automated modem uploads discontinued.
6/18/2012 Possible shed tag with multiple detections at site. Originally implanted in 15W in 2003- tag code is
3D9.1BF1637723
6/6/2012 Antenna #2 high noise ~36%; antenna #3 high noise ~47%; antenna #5 high noise ~ 27%, antenna #6
high noise ~43%.
5/30/2012 Antenna #2 high noise ~32%; antenna #3 high noise ~35%; antenna #5 high noise ~23%; antenna #6
high noise ~34%. 5315 records. Alarm reads, “memory full.”
2/9/2012 Antenna #1 high noise ~25%, antenna #2 high noise ~39%, antenna #3 high noise ~40%, antenna #4
high noise ~23%, antenna #5 high noise ~21%, antenna #6 high noise ~36%.
1/19/2012 Antenna #2 high noise ~28%; antenna #3 high noise ~31%; antenna #5 high noise ~25%; antenna #6
~28%. Alarm reads, “Test Tag Failed.” Changed Lithium battery. Changed MUX time from 11:55 to
11:49 to match the laptop time. Alarm reads, “Lithium Low,” after battery was changed.
1/3/2012 Antenna 2 high noise ~31%; antenna 3 high noise ~34%; antenna 4 high noise ~20%; antenna 6 high
noise ~24%. 861 new records downloaded.

82
Appendix Table 9. Site operational summary for the Entiat River interrogation site at
Ardenvoir (ENA) during the 2012 monitoring period.
Date Operational Comments
12/11/2012 Site set up for wireless downloads.
12/06/2012 Antennas checked and straps checked. Looks good removed debris near Antennas.
11/28/2012 Antenna #1 Noise = 28%, #4 = 58%, 1701 new records. File looks good.
11/07/2012 Antenna #4 High noise = 30%, 1758 New Records. File looks good.
10/18/2012 No Alarms, File looks good. 648 New records.
10/11/2012 Antenna #2 high noise= 20%, #4=36%. 1043 new records File looks good.
9/26/2012 Test Tag Failed, 1968 new records. File looks good
8/29/2012 Antenna #1 high noise= 34%, #4= 46%. No alarm, 2004 new records. File looks good
8/9/2012 No Alarms, 2104 new records. File looks good.
8/3/2012 Couldn’t get in to do downloads. Spraying trees in orchard.
7/26/2012
Couldn’t get in to do downloads. Sprinklers on in orchard.
7/18/2012 Antenna #3 high noise ~26%. 469 new records downloaded. It seems that the data has been fixed
starting on 7/13/2012.
7/11/2012 No alarms. Antennas all look good. No test tags show up on data except for one on 7/7/2012 at 00:20.
5 new records downloaded.
7/3/2012 Antenna #3 high noise ~26%. 17 new records downloaded.
6/27/2012 Antenna #3 high noise ~21%. 13 new records downloaded.
6/20/2012 Alarm reads, “Test Tag Failed.” Last time tag read at 6/15/12, 3:18. No tags recorded after 6/17/12,
5:48.
6/15/2012 Antenna #4 high noise ~29%. Alarm reads, “test tag failed.” MUX stopped recording on 6/14/12 after
17:40. 70 new records downloaded. Data lost from 6/5/12, 17:32
6/7/2012 GFCI breaker was tripped again. MUX left off to charge batteries. Unable to turn MUX on. Number
of records unknown. 0 records new downloaded. WDFW notified about the GFCI breaker.
5/31/2012 WDFW replaced the GFCI breaker. Waiting to see if that fixes the problem. If not WDFW says an
election will need to be brought in. Data lost from 5/25/12, 3:31 – 5/31/12, 13:31.
5/30/2012 No power to MUX. GFI breaker tripped. Left MUX off to charge batteries. 0 records downloaded.
5/17/2012 Started MUX; Both battery banks are charged. MUX was off on arrival. Charger flashing green on
ready light.
5/16/2012 Could not communicate with MUX and the display very dim, found the GFCI breaker tripped. Turned
off MUX and reset the breaker. Couldn't tell how long power was off. No records downloaded.
4/23/2012 Antennas all good. Reset circuit breaker. Turned on MUX; the MUX was off to change batteries. 267
new records downloaded. No data from 4/09/12, 14:04:39 – 4/23/2012, 14:47:50.
4/20/2012 The MUX was off and there was no power to the MUX. The “on” light on the MUX was not lit up.
The GFCI was tripped approx. on 4/9 at 14:04 and then turned on at 4/23 at 14:47.
4/4/2012 Changed end times on files due to day light savings time.
4/2/2012 Antennas all good. 376 new records downloaded.
3/22/2012 When the communication cord to Loggernet data logger is unplugged from MUX the amps jump from
0 to 3.96amps; and the slope flashes from -7 to 217 on all antennas. When the communication cord
was plugged back in the amps and slope went back to normal.
3/16/2012 Current flashing between 4.45 and 0 on antennas 1,4,5,6. Problem with current stopped when I
unplugged computer and removed it from box.
3/1/2012 Antenna #1 high noise ~29%. Antenna #3 high noise ~26%, antenna #4 high noise ~32%, antenna #5
high noise ~32%. 152 new records downloaded.
2/24/2012 Antenna #1 high noise ~50%, antenna #4 high noise ~32%, antenna #6 high noise ~29%. 217 new
records.
2/15/2012 Antenna #1 high noise ~42%, antenna #4 high noise ~32%, antenna #6 high noise ~ 25%. 159 new
records.
2/9/2012 Antenna #4 high noise ~32%, antenna #6 high noise ~ 23%. 67 new records.
2/1/2012 Antenna # 4 high noise ~39%, antenna #6 high noise ~22%. Alarm reads test tag failed. 144 new
records downloaded.

83
Appendix Table 9. Continued
Date Operational Comments
1/26/2012 Antennas all good. 204 new records. Alarm reads, “lithium low.” Reset MUX, “lithium low,” alarm
went off.
1/19/2012 Antenna #4 high noise ~59%; alarm reads “Test Tag Failed.” Changed lithium battery. Changed MUX
time from 11:09 to 11:08 to match laptop time. Alarm reads “Lithium Low,” after battery was
changed.
1/10/2012 Antennas all good. 206 new records downloaded
1/3/2012 Changed the time on MUX to match the laptop time. Antennas all good; 336 new records downloaded.

84
Appendix Table 10. Site operational summary for the middle Entiat River interrogation site
(ENM) during the 2012 monitoring period.
Date Operational Comments
12/11/2012 Wireless Download set up.
12/06/2012 Checked antennas and straps all good. Removed debris from around antennas.
11/28/2012 Antenna # 1 high amps = 5.00A High noise Antenna #2 = 60%, #3 = 26%. 454 New Records File
Good.
10/18/2012 Antenna #1 high noise= 68%, #3= 27%, 211 new records. File looks good.
10/11/2012 Antenna #3 high noise= 28%, #5 = 60%, #6 = 22%, 496 new records file looks good.
9/26/2012 Antenna #3 high noise= 29%, Antenna #5 high noise= 40%, 839 new records, File looks good.
8/29/2012 Antenna #3 high noise= 26%, No Alarms. 600 new records, File looks good.
8/8/2012 High noise on Antenna #1= 30%, #2=40%, #3= 24%, #4= 29%, #5= 21%. 113 New records. File
looked good.
8/3/2012 High noise on Antenna #1= 22%, #3= 27%, #4= 49%, #5=20% 183 New Records. File looked good.
7/26/2012 Antenna #1 High noise= 25%, #2 high noise= 25%, #3 high noise= 26%, #4 high noise= 27%, #5 high
noise= 21%, 181 New records. MUX was fast by about 18 minutes. Changed time to 13:08:00 Laptop
is fast by 1 hour.
7/18/2012 Antenna #1 high noise ~26%; antenna #2 high noise ~20%; antenna #3 high noise ~30%; antenna #4
high noise ~89%; antenna #5 high noise ~21%, antenna #6 high noise ~23%.
7/11/2012 Antenna #1 high noise ~24%; antenna #3 high noise ~31%; antenna #4 high noise~ 93%; antenna #5
high noise ~ ~22%. 157 new records downloaded.
7/3/2012 Antenna #1 high noise ~34%; antenna #2 high noise ~24%; antenna #3 high noise ~26%; antenna #4
high noise ~25%; antenna #5 high noise ~21%; antenna #6 high noise ~28%. 116 new records
downloaded.
6/27/2012 Antenna #1 high noise ~36%; antenna #2 high noise ~75%; antenna #3 high noise ~28%; antenna #4
high noise ~31%; antenna #5 high noise ~22%; antenna #6 high noise ~20%. 129 new records
downloaded.
6/20/2012 Antenna #1 high noise ~27%; antenna #2 high noise ~49%; antenna # high noise ~31%; antenna;
antenna #4 high noise ~36%; antenna #5 high noise ~20%. 78 new records.
6/15/2012 Antenna #1 high noise ~26%; antenna #2 high noise ~43%; antenna #3 high noise 30%; antenna #4
high noise 28%; antenna #5 high noise ~21%. 121 new records downloaded.
6/6/2012 Antenna #1 high noise ~22%; antenna #3 high noise ~45%; antenna #4 high noise ~29%. 100 new
records downloaded.
5/30/2012 Antenna #3 high noise ~22%. 62 new records downloaded.
5/23/2012 Antenna #3 high noise ~20%; antenna #4 high noise ~22%. 92 new records downloaded.
5/16/2012 Antenna #1 high noise ~24%. 116 new records downloaded.
5/9/2012 Antenna #2 high noise ~49%. 110 new records downloaded.
5/2/2012 Antenna #1 high noise ~37%. 90 new records downloaded. On 4/26, only antennas 1,5, and 6 fired
one test tag at 11:24; no other data for 4/26, unknown reason why.
4/25/2012 Antenna #3 high noise ~20%; antenna #5 high noise ~41%. 147 new records downloaded.
4/20/2012 Antenna #1 high noise ~22%; antenna #2 high noise ~32%; antenna #4 high noise ~36%; antenna #5
high noise ~35%. 150 new records downloaded.

85
Appendix Table 10. Continued Date Operational Comments
4/15/2012 Antenna #2 high noise ~21%. 165 new records downloaded.
4/11/2012 Antenna #2 high noise ~72%. 136 new records downloaded. Checked all antennas straps; they all
looked good.
4/7/2012 142 new records. Antenna #1 high noise ~20%. Change time on MUX from 09:37 to 09:30 to match the
time on the laptop.
4/4/2012 Changed end times on files ENM12076.ALL, ENM12082.ALL, and ENM12093.ALL to 1 hour earlier
than what they were originally due to they were downloaded with a lap top that was on day light
savings time. Also changed start times on files ENM12082.ALL and ENM12093.ALL due to the same
reason
4/3/2012 Cleared debris off of all antennas.
4/2/2012 Antenna #3 high noise ~23%. 349 new records downloaded.
3/22/2012 Antenna #3 high noise ~22%. 184 new records.
3/1/2012 Antenna #1 high noise ~34%. 208 new records.
2/24/2012 Antenna #1 high noise ~31%. 269 new records.
1/26/2012 Antenna #2 high noise ~31%. Changed lithium battery. Changed MUX time from 11:37 to 11:22 to
match the time on the laptop. 662 new records downloaded. After battery changed, alarm reads,
“lithium low.” Reset MUX, “lithium low,” alarm went off.
1/10/2012 Antenna #1 high noise ~48%. Time on MUX reads 11:08, time on laptop reads 10:54; MUX is 14
minutes faster than the time on the laptop. On 11/8/2011 the time on MUX was changed to match the
laptop time. 224 new records downloaded.
1/3/2012 Antenna 1 high nose ~55%; Antenna 2 high noise ~22%. Could not connect to MUX again; reset
MUX, and was able to download all records. 538 new records downloaded.

86
Appendix Table 11. Site operational summary for the Entiat River interrogation site near
Stormy Creek (ENS) during the 2012 monitoring period
Date Operational Date
12/11/2012 Wireless downloads set up.
12/06/2012 Checked all Straps and antennas all good. Removed debris around antennas.
11/28/2012 Low amps on #2= 2.84, Reset MUX 6 New Records. Only 1 day of data 11/14
11/14/2012 Low Amps on #2 = 2.97, 9 New Records, Missing Test Tag. File looks good otherwise.
11/07/2012 Low Amps on Antenna #2= 2.97, No test tag on file. File good otherwise. 21 New Records.
10/18/2012 24 New records. Low amps on #2= 2.77 No Alarms
10/11/2012 No Alarms Low amps on #2 = 2.85. 23 New records.
10/1/2012 Low amps on Antenna #2 = 2.81. Missing days of info on file. 14 New records.
9/26/2012 Low Amps on Antenna #2 = 2.81. Missing days of info on file could be due to missing timer tags.
102 New records.
8/29/2012 Timer tags recording. File looks good. 145 new records. No Alarms. Antennas look good.
8/18/2012 Not recording timer tags.
8/8/2012 Antenna #4 high noise ~20%. Could not communicate with MUX; reset MUX and then was able to
download. 48 new records downloaded.
8/2/2012 Antenna #2 low amps ~2.8. 39 new records downloaded.
7/26/2012 Antenna #4 high noise ~22%. 47 new records downloaded.
7/18/2012 Antenna #2 low amps 2.85 amps. 50 new records downloaded.
7/11/2012 Antenna #2 low amps 2.95 amps. 38 new records downloaded.
7/3/2012 Antenna #2 low amps 2.91. No test tag stored 6/27-7/3. No data stored from 7/1-7/3. Unknown reason
why.
6/27/2012 Antenna #2 low amps 2.94. Diagnostic readout was there. No test tag stored from 6/21-6/27, no data
stored from 6/22, 6/23, 6/26. Unknown reason why. 12 new records downloaded.
6/20/2012 Antenna #2 low amps at 2.83amps. Could not communicate at first with MUX, had to reset MUX;
then could communicate with MUX. 219 new records downloaded.
6/18/2012 Downloaded 290 new files. Antennas all good
6/15/2012 Antenna #1 high noise ~25%; antenna #4 high noise ~26%. Initially couldn’t communicate with
MUX. Reset MUX then downloaded. 142 new records downloaded. WDFW Replaced the MUX later
in the day after site had been downloaded.
6/6/2012 Antenna #4 high noise ~20%. Could not communicate with MUX; reset MUX; after resetting MUX
was able to then communicate. Lost 0 records from resetting. MUX stopped recording “test tags”, or
any tags after 5/31/12, 6:44; no unique tags were recorded. 47 new records downloaded.
5/31/2012 WDFW went through all of the settings and everything looked to be running good.
5/30/2012 Antenna #1 high noise ~24%; antenna #4 high noise ~23%. Connected to MUX and ran test tag
diagnosis. MUX read and saved tags. Set timer tag to 180 minutes. 0 records downloaded.
5/23/2012 Antenna #1 high noise ~21%; antenna #4 high noise ~38%. Data lost from 5/14/12, 11:53- 5/17/12,
14:50. File stopped on 5/19/12. 316 new files downloaded.
5/9/2012 MUX screen was black. 342 new records downloaded.
4/11/2012 237 new records downloaded. Antennas all good. Checked all antennas straps; they all looked good.
4/7/2012 Antenna #4 high noise ~20%. Changed time on MUX from 09:52 to 09:45 to match the laptop time.
182 new records downloaded.
4/4/2012 Changed end times on to 1 hour earlier than what they were originally due to they were downloaded
with a lap top that was on day light savings time.
1/26/2012 Antennas all good. Alarm reads, “lithium low.” MUX time matches the time on the laptop. Reset
MUX, “lithium low,” alarm went off. 296 new records downloaded.
1/19/2012 Antennas all good. Changed lithium battery. Changed MUX time from 10:24 to 10:16 to match the
laptop time. 83 new records downloaded.
1/17/2012 Antennas all good. MUX is 8 minutes faster than laptop time. 315 new records downloaded.
1/10/2012 Antennas all good. Mux time reads 10:45; the time on the laptop reads 10:38. Mux is 7 minutes fast
from the time on the laptop. On 11/08/11 the time on MUX was changed to match the time on the
laptop. 301 new records downloaded.

87
Appendix Table 12. Site operational summary for the Entiat River Forest Service boundary
interrogation site (ENF) during the 2012 monitoring period.
Date Operational Comments
12/11/2012 Wireless download set up.
12/06/2012 Antennas checked all straps good. Removed debris.
11/28/2012 Antenna #2 noise = 24%, #6 = 62%. 1030 New Records. File looks good. “Test Tag Failed”
11/07/2012 Antennas look good. 1435 New records. File looks good.
10/18/2012 Antenna #5 high noise-31%, Test Tag Failed, 490 new records.
10/11/2012 Antenna #1 high noise-38%, Antenna #2 high noise-25%, Antenna #4 high noise- 27%, Antenna #5
high noise-32%, 606 new records, Had to reset MUX in order for download to work.
10/01/2012 Antenna #1 high noise-55%, Antenna #5 high niose-33%, 335 new records,
9/26/2012 Test Tag Failed. 1816 new records. File looked good.
8/29/2012 Antenna #5 high noise ~44%. File looks good. 954 new records downloaded.
8/8/2012 Antenna #6 high noise ~44%; alarm reads test tag failed. 493 new records.
8/2/2012 Antenna #6 high noise ~38%. 501 new records downloaded.
7/26/2012 Antenna #4 slope is fluctuating very fast between -3 to 6. Antenna #6 high noise ~40%. 531 new
records downloaded.
7/18/2012 Antenna #5 high noise ~35%; antenna #6 high noise ~71%. 301 new records downloaded.
7/11/2012 Alarm reads, “test tag failed.” Antenna #4 high noise ~447%. 562 new records downloaded.
7/3/2012 Antenna #6 high noise ~72%. 456 new records were thought to have been downloaded, but were not.
The buffer was also erased. The 456 records were lost.
6/27/2012 Alarm reads, “test tag failed.” 504 new records downloaded.
6/20/2012 Alarm reads, “test tag failed.” 365 new records downloaded.
6/15/2012 Alarm reads, “test tag failed.” 668 new records downloaded.
6/6/2012 Antenna #3 high noise ~49%. 503 new records downloaded.
5/30/2012 Antenna #6 high noise ~23%; 479 new records downloaded.
5/23/2012 Antenna #3 high noise ~23%; antenna #6 high noise ~29%. Alarm reads “test tag failed.” 557 new
records downloaded.
5/16/2012 Antenna #3 high noise ~26%; antenna #6 high noise ~22%. 497 new records downloaded.
5/9/2012 Alarm reads “test tag failed.” Antennas all good. 167 new records downloaded.
5/7/2012 Alarm reads “test tag failed.” Reset MUX.
5/2/2012 Test tag stopped working on all antennas. MUX seemed locked up. Reset MUX 14 new records
downloaded.
4/25/2012 Antenna #3 high noise ~22%. Alarm reads “test tag failed.” 140 new records downloaded.
4/20/2012 Other than the alarm reading “test tag failed” , the antennas are all good. 131 new records
downloaded.
4/15/2012 Antenna #1 high noise ~84%, antenna #4 high noise ~63%. 159 new records.
4/11/2012 Antenna #1 high noise ~85%. 149 new records downloaded. Antennas #1 and #4 have disconnected
middle braces. Data lost from 4/7/2012, 12:15 – 4/11/12, 10:05, unknown reason
4/7/2012 Could not connect to the MUX with the laptop. Was able to connect to MUX after resetting it.
Antennas all good. 103 new records downloaded.
4/4/2012 Changed end times on files due to day light savings time.
3/14/2012 Antenna #3 replaced by the state because of low amps.
3/1/2012 Antenna #3 low amps 0.76. 260 new records downloaded.
2/24/2012 Antenna #3 low current 0.86. Examined antenna from the bank, could not see anything wrong with it.
All other antennas are good. 388 new records.
2/6/2012 Antenna #4 slope fluctuating fast from -2 to 2. 210 new records downloaded.
2/1/2012 Alarm reads lithium low. Antennas all good. Reset MUX, 248 records downloaded.
1/26/2012 Antennas all good. 295 new records downloaded.
1/19/2012 Changed lithium battery. Changed MUX time from 9:55 to 9:47 to match the time on the lap top. 82
new records downloaded.
1/17/2012 Antenna #4 high noise ~28%, antenna #5 high noise ~22%. Alarm reads, “Test tag failed.” 260 new
records downloaded.
1/10/2012 Alarm reads “test tag failed.” Antennas all good; 278 new records downloaded.
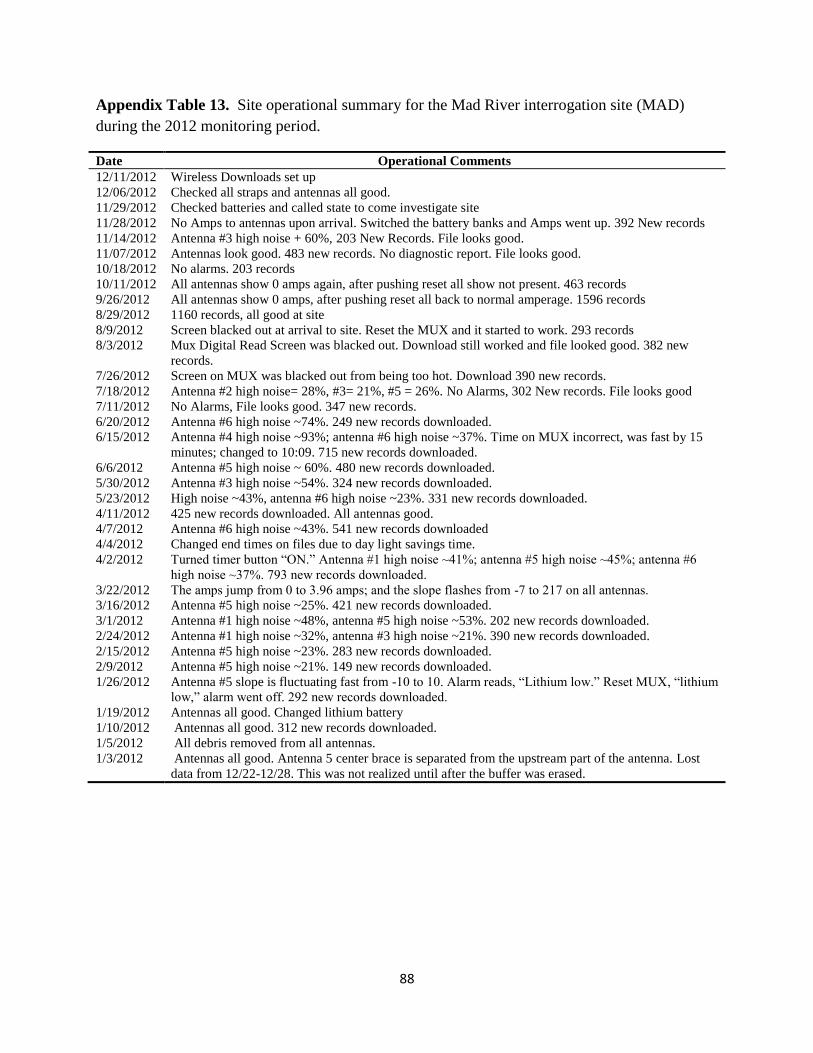
88
Appendix Table 13. Site operational summary for the Mad River interrogation site (MAD)
during the 2012 monitoring period.
Date Operational Comments
12/11/2012 Wireless Downloads set up
12/06/2012 Checked all straps and antennas all good.
11/29/2012 Checked batteries and called state to come investigate site
11/28/2012 No Amps to antennas upon arrival. Switched the battery banks and Amps went up. 392 New records
11/14/2012 Antenna #3 high noise + 60%, 203 New Records. File looks good.
11/07/2012 Antennas look good. 483 new records. No diagnostic report. File looks good.
10/18/2012 No alarms. 203 records
10/11/2012 All antennas show 0 amps again, after pushing reset all show not present. 463 records
9/26/2012 All antennas show 0 amps, after pushing reset all back to normal amperage. 1596 records
8/29/2012 1160 records, all good at site
8/9/2012 Screen blacked out at arrival to site. Reset the MUX and it started to work. 293 records
8/3/2012 Mux Digital Read Screen was blacked out. Download still worked and file looked good. 382 new
records.
7/26/2012 Screen on MUX was blacked out from being too hot. Download 390 new records.
7/18/2012 Antenna #2 high noise= 28%, #3= 21%, #5 = 26%. No Alarms, 302 New records. File looks good
7/11/2012 No Alarms, File looks good. 347 new records.
6/20/2012 Antenna #6 high noise ~74%. 249 new records downloaded.
6/15/2012 Antenna #4 high noise ~93%; antenna #6 high noise ~37%. Time on MUX incorrect, was fast by 15
minutes; changed to 10:09. 715 new records downloaded.
6/6/2012 Antenna #5 high noise ~ 60%. 480 new records downloaded.
5/30/2012 Antenna #3 high noise ~54%. 324 new records downloaded.
5/23/2012 High noise ~43%, antenna #6 high noise ~23%. 331 new records downloaded.
4/11/2012 425 new records downloaded. All antennas good.
4/7/2012 Antenna #6 high noise ~43%. 541 new records downloaded
4/4/2012 Changed end times on files due to day light savings time.
4/2/2012 Turned timer button “ON.” Antenna #1 high noise ~41%; antenna #5 high noise ~45%; antenna #6
high noise ~37%. 793 new records downloaded.
3/22/2012 The amps jump from 0 to 3.96 amps; and the slope flashes from -7 to 217 on all antennas.
3/16/2012 Antenna #5 high noise ~25%. 421 new records downloaded.
3/1/2012 Antenna #1 high noise ~48%, antenna #5 high noise ~53%. 202 new records downloaded.
2/24/2012 Antenna #1 high noise ~32%, antenna #3 high noise ~21%. 390 new records downloaded.
2/15/2012 Antenna #5 high noise ~23%. 283 new records downloaded.
2/9/2012 Antenna #5 high noise ~21%. 149 new records downloaded.
1/26/2012 Antenna #5 slope is fluctuating fast from -10 to 10. Alarm reads, “Lithium low.” Reset MUX, “lithium
low,” alarm went off. 292 new records downloaded.
1/19/2012 Antennas all good. Changed lithium battery
1/10/2012 Antennas all good. 312 new records downloaded.
1/5/2012 All debris removed from all antennas.
1/3/2012 Antennas all good. Antenna 5 center brace is separated from the upstream part of the antenna. Lost
data from 12/22-12/28. This was not realized until after the buffer was erased.