Quality Assurance Project Plan: Deschutes River Multi ... · Deschutes River Multi-Parameter ....
49
Deschutes River Multi-Parameter Total Maximum Daily Load Effectiveness Monitoring Pilot Project Water Quality Study Design (Quality Assurance Project Plan) December 2009 Publication No. 09-03-133
Transcript of Quality Assurance Project Plan: Deschutes River Multi ... · Deschutes River Multi-Parameter ....

Deschutes River Multi-Parameter Total Maximum Daily Load Effectiveness Monitoring Pilot Project
Water Quality Study Design (Quality Assurance Project Plan)
December 2009 Publication No. 09-03-133

Publication and Contact Information This plan is available on the Department of Ecology’s website at www.ecy.wa.gov/biblio/0903133.html. Author and Contact Information Scott Collyard and Markus Von Prause P.O. Box 47600 Environmental Assessment Program Washington State Department of Ecology Olympia, WA 98504-7710 For more information contact: Carol Norsen, Communications Consultant Phone: 360-407-7486 Washington State Department of Ecology - www.ecy.wa.gov/ o Headquarters, Olympia 360-407-6000 o Northwest Regional Office, Bellevue 425-649-7000 o Southwest Regional Office, Olympia 360-407-6300 o Central Regional Office, Yakima 509-575-2490 o Eastern Regional Office, Spokane 509-329-3400
Study Codes Data for this project are available at Ecology’s Environmental Information Management (EIM) website at www.ecy.wa.gov/eim/index.htm. Search User Study ID is SCOL0003. Ecology’s Project Tracker Code for this study is 09-540. Federal Clean Water Act 2004 303(d) Listings Addressed in this Study Deschutes River (WA-13-1010; TM40PW): Temperature, pH. Deschutes River (WA-13-1020; TM40PW): Temperature, Fine Sediment. Cover photo: Deschutes River site by Cougar Mountain Road Bridge at river mile 32.3.
Any use of product or firm names in this publication is for descriptive purposes only and
does not imply endorsement by the author or the Department of Ecology.
To ask about the availability of this document in a format for the visually impaired, call Carol Norsen at 360-407-7486.
Persons with hearing loss can call 711 for Washington Relay Service. Persons with a speech disability can call 877-833-6341.

Page 1
Deschutes River Multi-Parameter Total Maximum Daily Load
Effectiveness Monitoring Pilot Project
Water Quality Study Design (Quality Assurance Project Plan)
December 2009
Approved by:
Signature: Date: December 2009
Scott Collyard, Author, Project Manager, DSU, WOS, EAP
Signature: Date: December 2009
Markus Von Prause, Co-Author, EIM Data Engineer, DSU, WOS, EAP
Signature: Date: December 2009
George Onwumere, Unit Supervisor, DSU, WOS, EAP
Signature: Date: December 2009
Robert F. Cusimano, Section Manager, WOS, EAP
Signature: Date: December 2009
Stuart Magoon, Director, Manchester Environmental Laboratory
Signature: Date: December 2009
Bill Kammin, Ecology Quality Assurance Officer
Signatures are not available on the Internet version. DSU – Directed Studies Unit. WOS – Western Operations Section. EAP – Environmental Assessment Program. EIM – Environmental Information Management system.

Page 2
Table of Contents
Page
List of Figures and Tables....................................................................................................4
Abstract ................................................................................................................................5
TMDL Process and Effectiveness Monitoring ....................................................................6 TMDL Process ...............................................................................................................6 TMDL Effectiveness Monitoring ..................................................................................6
Project Background ..............................................................................................................8 Study Area .....................................................................................................................8 TMDL Overview .........................................................................................................10 Cleanup and Implementation .......................................................................................10
Project Goals and Study Objectives ...................................................................................11 Goals ............................................................................................................................11 Objectives ....................................................................................................................11
Study Design ......................................................................................................................12 Overview ......................................................................................................................12 Sampling Locations .....................................................................................................13 Experimental Design ....................................................................................................14 Project Schedule...........................................................................................................15
Project Costs ......................................................................................................................16
Quality Objectives .............................................................................................................17
Sampling Procedures .........................................................................................................19 Safety ...........................................................................................................................19 Sampling ......................................................................................................................19 Measurements ..............................................................................................................27 Sequence for Conducting Field Operations .................................................................27
Quality Control Procedures................................................................................................30 Laboratory Analyses ....................................................................................................30
Data Management Procedures ...........................................................................................31 Laboratory Data ...........................................................................................................31 Laboratory Reports ......................................................................................................31 Field Data .....................................................................................................................31
Audits and Reports .............................................................................................................32
Data Verification and Usability Assessment .....................................................................32 Data Verification ..........................................................................................................32 Data Usability Assessment ..........................................................................................33
Project Organization ..........................................................................................................34
References ..........................................................................................................................35

Page 3
Appendices .........................................................................................................................37 Appendix A. Glossary, Acronyms, and Abbreviations ...............................................38 Appendix B. Macroinvertebrate Scope of Work ........................................................41 Appendix C. Periphyton Scope of Work ....................................................................44

Page 4
List of Figures and Tables
Page
Figures
Figure 1. Ecology’s Deschutes River biological monitoring sites. ................................................ 9
Figure 2. Sequence of field operations. ....................................................................................... 28
Figure 3. Spatial distribution of field operations. ........................................................................ 29
Tables Table 1. Descriptive information for the Deschutes River sampling sites. ................................. 13
Table 2. Sampling schedule for the Deschutes River 2009-2013 study. ..................................... 14
Table 3. Proposed schedule for completing field and laboratory work, entering data into EIM, and writing reports. ........................................................................................................ 15
Table 4. Laboratory and taxonomic costs. ................................................................................... 16
Table 5. Measurement quality objectives. ................................................................................... 18
Table 6. Organization of project staff and responsibilities. ......................................................... 34

Page 5
Abstract
The Deschutes River in western Washington and some of its tributaries are on the federal Clean Water Act 2008 Section 303(d) list for at least one of the following parameters: temperature, fecal coliform bacteria, dissolved oxygen, fine sediment, or pH. This Quality Assurance (QA) Project Plan describes the technical study that will use macroinvertebrate, periphyton, and related habitat indicators to evaluate the effectiveness of the 2009 Total Maximum Daily Load (TMDL; water cleanup plan) in improving water quality in the Deschutes River. The study design described in this plan will be used as a supplement to routine chemical parameters currently used for monitoring TMDL effectiveness. Each study conducted by the Washington State Department of Ecology must have an approved QA Project Plan. The plan describes the goals and objectives of the study and the procedures to be followed to achieve them. The goals of this monitoring project are to (1) summarize and link watershed-based cleanup efforts to changes in biological communities (macroinvertebrate and periphyton), and (2) distinguish between natural and anthropogenic (human-caused) variables that affect changes in biological communities over time. After completion of the study, a final report describing the study results will be posted to the Internet.

Page 6
TMDL Process and Effectiveness Monitoring
TMDL Process The Total Maximum Daily Load (TMDL) study is a requirement under the federal Clean Water Act. The process typically includes, but is not limited to, the following steps:
1. Scientific study to (1) characterize the pollution parameters identified on the Section 303(d) list of impaired waterbodies, and (2) identify pollutant sources.
2. Modeling of pollutant impacts on the environment and quantifying the extent of impairment.
3. Estimating the loading capacity of the receiving water to assimilate pollutants and still meet Washington State surface water quality standards.
4. Determining the TMDL of pollutants by allocating (1) the loading capacity to wasteload allocations for point sources (discrete sources that receive an NPDES permit), and (2) load allocations for nonpoint (diffuse) sources.
5. Developing a Summary Implementation Strategy (SIS) describing the approach for meeting pollutant allocations and complying with water quality standards.
6. Submitting the TMDL and SIS to the U.S. Environmental Assessment Program (EPA) for approval.
Based on the approved TMDL, an implementation plan is developed to correct pollution problems identified in the TMDL. Community involvement is encouraged during this period, as pollution-control strategies are reviewed and converted into feasible solutions and activities that are economically feasible and capable of early implementation. These implementation activities are continued, as necessary, to meet and maintain compliance with state surface water quality standards. Periodic monitoring, effectiveness monitoring, is used to determine the progress of the TMDL implementation activities.
TMDL Effectiveness Monitoring TMDL effectiveness monitoring is a fundamental component of any TMDL implementation activity. It measures to what extent the waterbody has improved and whether it has been brought into compliance with the state water quality standards. Effectiveness monitoring takes a holistic look at TMDL implementation, watershed management plan implementation, and other watershed-based cleanup efforts. Success may be measured against TMDL load allocations or targets correlated with baseline conditions, or desired future conditions.

Page 7
The benefits of the TMDL effectiveness evaluation include:
• A measure of progress toward implementation of recommendations. In other words, how much watershed restoration has been achieved and how much more effort is required.
• More efficient allocation of funding and optimization in planning and decision-making. In other words, identifying recommendations or restoration activities that worked and identifying which restoration activities achieved the most success for the money spent.
• Technical feedback to refine the initial TMDL model, best management practices, nonpoint source plans, and permits.

Page 8
Project Background
Study Area The study area extends from the headwaters of the Deschutes River northward to its confluence with Capitol Lake (Figure 1). The watershed occupies a total of 178 square miles, all within Thurston County. Elevations range from 3870 feet (1180 meters) at Cougar Mountain in the Bald Hills to near sea level at the confluence of Capitol Lake. Land cover includes forests, agricultural, rural residential, and urban. Developed areas dominate in the northern watershed, while grass, shrubs, and forests dominate the southern part of the watershed. Most of Olympia and Tumwater, a portion of Lacey, and the town of Rainier are the largest population centers within the watershed. The population of Olympia has nearly doubled since 1970 to 42,530 people as of April 2001 (Municipal Research and Services Center of Washington, 2003). Over 50,000 people live in the study area. Weyerhaeuser Company is the largest private forest lands owner and largest land owner, with 49,480 acres (20,024 hectares) or 39% of Deschutes-Budd Inlet watershed. The Department of Natural Resources (DNR) and the U.S. Forest Service own and manage public timberlands (Ecology 2004.) Commercial and non-commercial agriculture occur primarily in the central Deschutes River watershed. Animal facilities include one commercial dairy, sheep, and non-commercial livestock. The Deschutes-Bud Inlet watershed supports important shellfish and anadromous (sea-run) fish populations. Five salmonid species use the Deschutes basin and other drainages into Budd Inlet for spawning and rearing: steelhead trout, sea-run and resident cutthroat trout, coho, hatchery chinook, and chum salmon (Haring and Konovsky, 1999), although historically Tumwater Falls presented a natural barrier to fish passage. The Washington Department of Fisheries constructed a fish ladder in 1954 to aid in fish migration (GA, 2002). Chinook salmon use of the basin is limited mainly to the lower and middle mainstem of the Deschutes River. The middle and upper reaches of most of the accessible drainages are used by coho salmon, steelhead trout, and sea-run and resident cutthroat trout. Resident trout are common in the tributaries above barriers to anadromous salmonids.

Page 9
Figure 1. Deschutes River sampling sites for the 2009-2013 study.

Page 10
TMDL Overview In 2008, the Washington State Department of Ecology (Ecology), in cooperation with the Squaxin Island Tribe, Thurston County, the City of Olympia, and others, conducted a TMDL study because several waterbodies do not meet the Washington State surface water quality standards (Ecology, 2008 Draft). Loading target limits for temperature, dissolved oxygen, and pH were established for the Deschutes River. These loading targets were based on effective shade achieved from full mature riparian vegetation and improved channel conditions. No nutrient load reductions were recommended, since current loads are within the loading capacity for the river to meet water quality standards. However, nutrient loads cannot increase, and reductions may be needed to meet standards in Capitol Lake and Budd Inlet. Fine sediment targets were based on reductions needed to meet healthy habitat levels to protect salmonid spawning. However, because natural sources of sediment were determined to be greater or equal to anthropogenic contributions, targets may not be met in some areas. The draft report recommends that programs which preserve and restore riparian vegetation and restore natural stream channel characteristics should be established throughout the Deschutes River.
Cleanup and Implementation In 2009, Ecology formed the Deschutes TMDL Advisory Group to begin work on the summary TMDL implementation strategy. This report, called the Water Cleanup Detailed Implementation Plan (DIP), will provide detail on watershed activities intended to clean up the Deschutes River. Cleanup and implementation activities will be monitored throughout this process culminating in effectiveness monitoring to determine success.

Page 11
Project Goals and Study Objectives
Goals The goals of this monitoring project are to:
• Summarize and link watershed-based cleanup efforts to changes in biological communities (macroinvertebrate and periphyton).
• Distinguish between natural and anthropogenic variables that affect change in biological communities over time.
Objectives The project goals will be met through the following objectives:
• Collect, analyze, and interpret biological (macroinvertebrate and periphyton) data to determine if biological indexes and metrics improve with implementation activities over time.
• Collect, analyze, and interpret habitat and chemistry data in conjunction with biological data to explain natural variations on biological indexes and metrics.
• Review data for representativeness, comparability, and usability.

Page 12
Study Design
Overview This TMDL effectiveness monitoring pilot project will explore the feasibility of using biological indicators to determine the effectiveness of TMDL implementation activities. Assessments monitoring macroinvertebrate and periphyton assemblages will be conducted during 2009-2013 on the Deschutes River. It is expected that after the initial two years of baseline data collection, implementation activities designed to improve water quality will occur in the Deschutes River watershed. Because biological assessment has not been proven to be a good indicator of bacteria, fecal coliform reduction activities will not be directly addressed by this study. Biological indicators may be responsive to surrogate measures of fecal coliform such as nutrients and sediment and may provide indirect evidence of cleanup activities. In addition to the biological assessments, several stream habitat and chemical parameters will be monitored. These data will be used to distinguish between natural and anthropogenic variability in the biological community structure. Nine biological monitoring stations will be established along the Deschutes River; these sites are expected to respond to TMDL implementation activities. Reference or “least impacted” sites will also be established in which no water quality impairments exist to monitor the effects of natural conditions on biological assemblages. This information will be used to establish the expected ranges of variability within communities. Data collected prior to TMDL implementation activities (during the first two years of the project, 2009-10) will be considered baseline data and will be compared to data collected the last two years of the project (2012-13). Key macroinvertebrate and periphyton metrics will be indentified based on reference and baseline data, and compared over time to measure TMDL effectiveness. Commonly used multi- metric macroinvertebrate models will be used to track water quality improvement. Staff have set a sampling and analysis goal of 100% completeness. However, there are many reasons for missing sampling events in a monitoring program. These include inclement weather or flooding, hazardous driving or monitoring conditions, and illness or unavailability of monitoring staff. Routinely missed samples could impart bias in expressions generated from final data. Sampling events will be rescheduled when missed in order to maintain integrity of the characterization effort. Field monitoring data loss due to equipment failure may occur; backup equipment will be available to minimize this problem. Apart from weather, unforeseen occurrences are random relative to water quality conditions. These occurrences will not affect long-term data analyses, except for effects from potential reduction in sample size.
Page 13
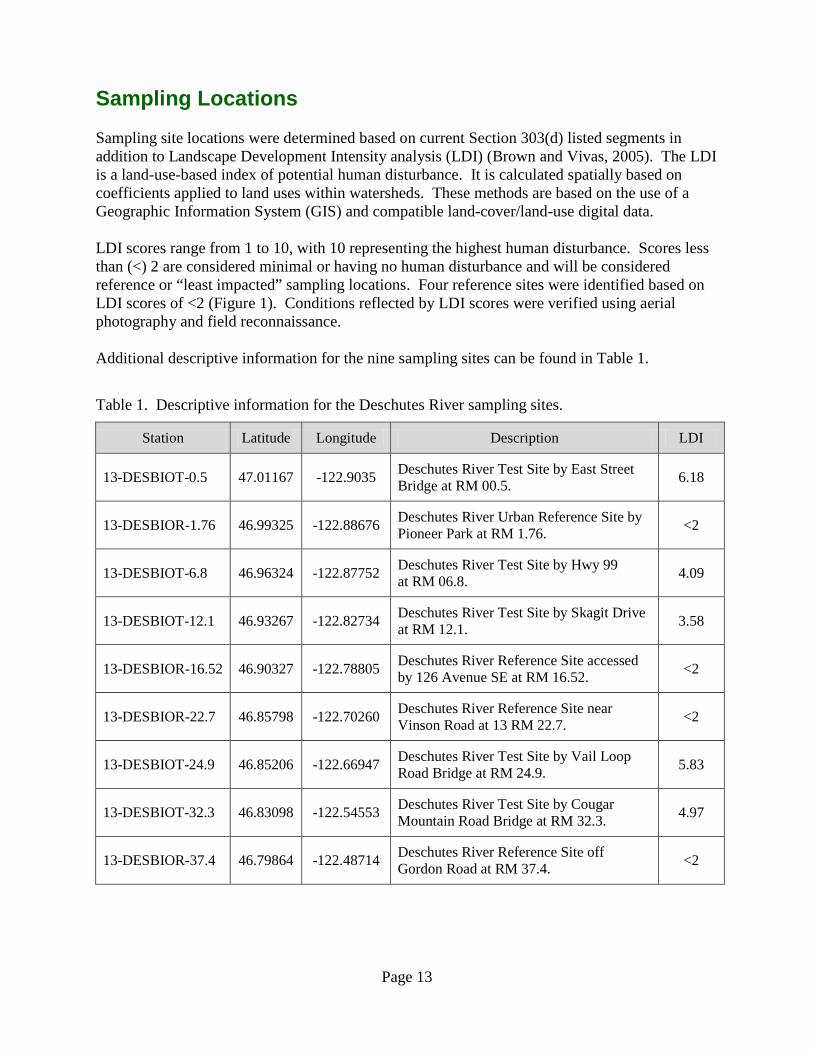
Sampling Locations Sampling site locations were determined based on current Section 303(d) listed segments in addition to Landscape Development Intensity analysis (LDI) (Brown and Vivas, 2005). The LDI is a land-use-based index of potential human disturbance. It is calculated spatially based on coefficients applied to land uses within watersheds. These methods are based on the use of a Geographic Information System (GIS) and compatible land-cover/land-use digital data. LDI scores range from 1 to 10, with 10 representing the highest human disturbance. Scores less than (<) 2 are considered minimal or having no human disturbance and will be considered reference or “least impacted” sampling locations. Four reference sites were identified based on LDI scores of <2 (Figure 1). Conditions reflected by LDI scores were verified using aerial photography and field reconnaissance. Additional descriptive information for the nine sampling sites can be found in Table 1.
Table 1. Descriptive information for the Deschutes River sampling sites.
Station Latitude Longitude Description LDI
13-DESBIOT-0.5 47.01167 -122.9035 Deschutes River Test Site by East Street Bridge at RM 00.5. 6.18
13-DESBIOR-1.76 46.99325 -122.88676 Deschutes River Urban Reference Site by Pioneer Park at RM 1.76. <2
13-DESBIOT-6.8 46.96324 -122.87752 Deschutes River Test Site by Hwy 99 at RM 06.8. 4.09
13-DESBIOT-12.1 46.93267 -122.82734 Deschutes River Test Site by Skagit Drive at RM 12.1. 3.58
13-DESBIOR-16.52 46.90327 -122.78805 Deschutes River Reference Site accessed by 126 Avenue SE at RM 16.52. <2
13-DESBIOR-22.7 46.85798 -122.70260 Deschutes River Reference Site near Vinson Road at 13 RM 22.7. <2
13-DESBIOT-24.9 46.85206 -122.66947 Deschutes River Test Site by Vail Loop Road Bridge at RM 24.9. 5.83
13-DESBIOT-32.3 46.83098 -122.54553 Deschutes River Test Site by Cougar Mountain Road Bridge at RM 32.3. 4.97
13-DESBIOR-37.4 46.79864 -122.48714 Deschutes River Reference Site off Gordon Road at RM 37.4. <2

Page 14
Experimental Design The intent of this 2009-2013 study is to collect biological and habitat data at a high enough frequency and a long enough time span to (1) obtain a reasonable level of confidence in the results and (2) meet the objectives of this project. To evaluate the effectiveness of future TMDL implementation activities in the Deschutes River watershed, staff will collect biological data and identify metrics based on baseline data as well as reference data. Changes in metrics over time will be used to assess the success of TMDL implementation activities. Macroinvertebrate and periphyton assemblages will be described using common biological indexes and metrics that have been identified by others such as Stevenson et al. (1996), Merritt and Cummins (1996), and Barbour et al. (1999). In addition, related chemical and physical habitat data will be assessed during the biological surveys and used to relate variation in the community structure over time. Reference or “least impact” stations based on LDI scores (<2) will also be established to monitor the effects of natural variability on biological assemblages as well as to establish expected ranges of variability within other targeted station communities. Four sampling events will occur at nine sampling sites along the Deschutes River. The first sampling events will take place in October of 2009 and 2010. The remaining sampling events will occur in October of 2012 and 2013. Table 2 outlines the sampling schedule for this project.
Table 2. Sampling schedule for the Deschutes River 2009-2013 study.
Parameters* October 2009
October 2010
October 2012
October 2013
Discharge / Water Chemistry X X X X Macroinvertebrate / Periphyton X X X X Embeddedness / Pebble Count X X X X Slope / Canopy Cover X X X X
*Parameters are measured in the sequence in which they are listed.
Biological sampling will occur using modified protocols from Plotnikoff and Wiseman (2001) and Wyoming’s Department of Environmental Quality (2005). Macroinvertebrate and periphyton will be collected from a series of four riffles within a reach at each pre-selected sampling site. Rational for choosing sampling sites is described above. Supporting embeddedness, pebble count, slope, bankfull width, and canopy cover data collection will coincidence with biological data collection within riffles. One-time measurements of discharge and routine chemical parameters (temperature, dissolved oxygen, pH) will be collected at the base of each sampling site during each of the four sampling periods.

Page 15
Project Schedule The project schedule is in Table 3. Table 3. Proposed schedule for completing field and laboratory work, entering data into EIM, and writing reports.
Field and laboratory work Due date Lead staff Field work completed October 2013 Scott Collyard Laboratory analyses completed May 2014
Environmental Information System (EIM) database EIM user study ID SCOLL003 Product Due date Lead staff
EIM data loaded June 2014 Markus Von Prause EIM quality assurance July 2014 Scott Collyard EIM complete August 2014 Markus Von Prause
Final report Author lead /support staff Scott Collyard / Markus Von Prause Schedule
Draft due to supervisor March 2015 Draft due to peer reviewer April 2015 Draft due to external reviewer(s) May 2015 Final (all reviews done) due to publications coordinator June 2015
Final report due on web July 2015

Page 16
Project Costs
The total laboratory and taxonomic cost for this project is approximately $34,476 (Table 4).
Table 4. Laboratory and taxonomic costs.
Parameter Number of samples
Cost per sample Cost
Macroinvertebrate taxonomic identification 52 $300 $15,600
Periphyton taxonomic identification 52 $320 $16,640
Chlorophyll a analysis 52 $43 $ 2,236
Total laboratory costs (including pre-planning 50% discount) $34,476

Page 17
Quality Objectives
Quality objectives are statements of the precision, bias, and lower reporting limits necessary to address project objectives. Precision and bias together express data accuracy. Other considerations of quality objectives include representativeness and completeness. • Precision is a measure of data consistency. It is expressed as the relative standard deviation
(RSD) and derived from replicate sample analyses. It is subject to random error. RSD is determined by dividing the standard deviation of a sample by the mean for the same sample and then multiplying by 100%. For this project, each chemistry sample for which an RSD will be calculated will consist of paired duplicates.
For biological samples, total precision will be estimated from the results of four replicate samples collected from 10% of the reaches sampled annually in the riffle habitats. The goal for coefficient of variation (CV) from four replicate riffle samples is ≤ 20% when using the taxa richness metric (Plotnikoff and Wiseman, 2001). Staff expect collections of macroinvertebrates and periphyton from four replicate locations to have similar biological community structure.
• Bias is a measure of the systematic error between an estimated value for a parameter and the
true value. Systemic errors can occur through poor technique in sampling, sample handling, or analysis. Bias from the true value is very difficult to determine for this set of biological and chemical parameters. Staff will minimize the bias through strict adherence to standard operating procedures (SOPs). Field staff will follow the SOPs listed in this plan (Swanson, 2007; Mathieu, 2006; Barbour et al., 1999; Plotnikoff and Wiseman, 2001). Field dissolved oxygen, pH, and conductivity meters will be calibrated before each day of sampling and checked following each day of sampling using a standard solution of known conductivity. There will be back-up equipment during sampling events in case of equipment failure. Measurement quality objectives will vary for parameters based on their measurability in the natural environment. Increasing the number of replicates will improve precision estimation and confidence in decision making. Correct identification of benthic organisms is important for definition of biological community structure and function. Taxonomic misidentification results in inadequate stream biology characterization. Errors in identification of benthic macroinvertebrate taxa should be ≤ 5% of the total taxa in the sample. Re-identification of samples will be done for 10% of the total number of samples collected in each year. Secondary identification is conducted by experienced taxonomists in order to maintain confidence in the data set. A voucher collection is maintained by Ecology and is updated on an annual basis with macroinvertebrate specimens from each year's collection. All taxa are coded with the source for taxonomic literature used in identification.
Page 18
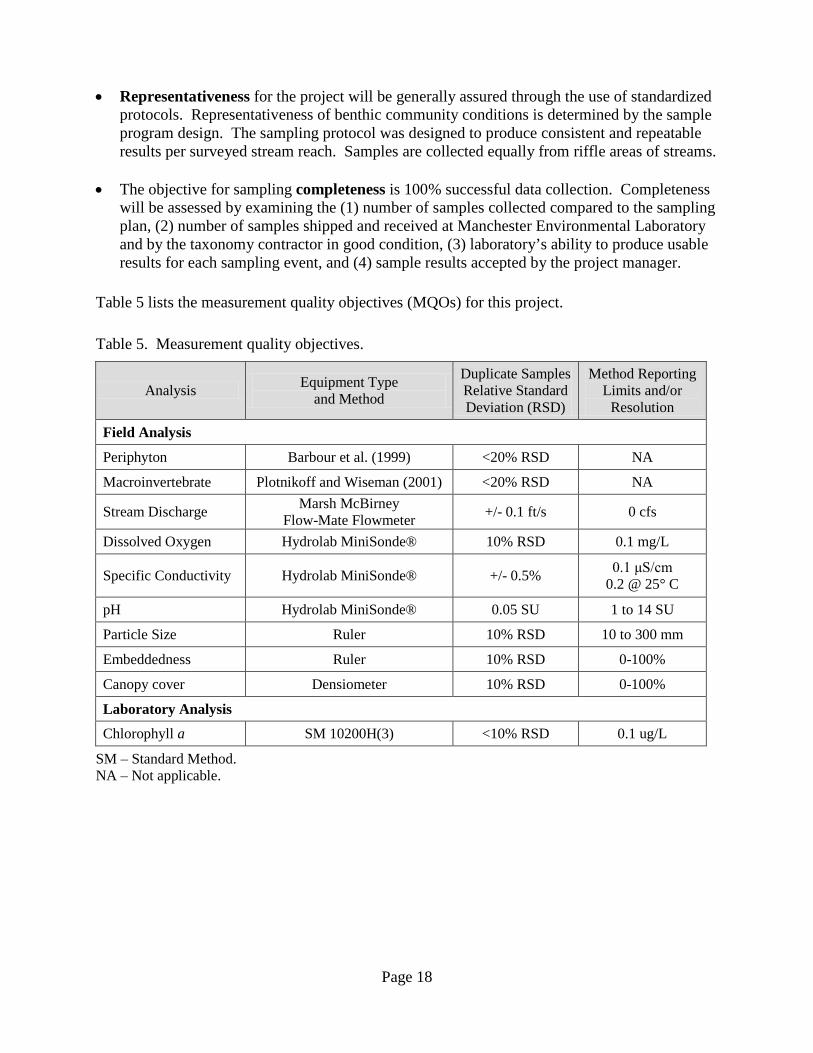
• Representativeness for the project will be generally assured through the use of standardized protocols. Representativeness of benthic community conditions is determined by the sample program design. The sampling protocol was designed to produce consistent and repeatable results per surveyed stream reach. Samples are collected equally from riffle areas of streams.
• The objective for sampling completeness is 100% successful data collection. Completeness
will be assessed by examining the (1) number of samples collected compared to the sampling plan, (2) number of samples shipped and received at Manchester Environmental Laboratory and by the taxonomy contractor in good condition, (3) laboratory’s ability to produce usable results for each sampling event, and (4) sample results accepted by the project manager.
Table 5 lists the measurement quality objectives (MQOs) for this project.
Table 5. Measurement quality objectives.
Analysis Equipment Type and Method
Duplicate Samples Relative Standard Deviation (RSD)
Method Reporting Limits and/or
Resolution
Field Analysis
Periphyton Barbour et al. (1999) <20% RSD NA
Macroinvertebrate Plotnikoff and Wiseman (2001) <20% RSD NA
Stream Discharge Marsh McBirney Flow-Mate Flowmeter +/- 0.1 ft/s 0 cfs
Dissolved Oxygen Hydrolab MiniSonde® 10% RSD 0.1 mg/L
Specific Conductivity Hydrolab MiniSonde® +/- 0.5% 0.1 μS/cm 0.2 @ 25° C
pH Hydrolab MiniSonde® 0.05 SU 1 to 14 SU
Particle Size Ruler 10% RSD 10 to 300 mm
Embeddedness Ruler 10% RSD 0-100%
Canopy cover Densiometer 10% RSD 0-100%
Laboratory Analysis
Chlorophyll a SM 10200H(3) <10% RSD 0.1 ug/L
SM – Standard Method. NA – Not applicable.

Page 19
Sampling Procedures
Safety Field and Laboratory Preservatives Biological samples collected from streams must be preserved immediately following storage in containers. Inadequate preservation often results in (1) loss of prey organisms through consumption by predators, (2) eventual deterioration of the macroinvertebrate specimens, and (3) deformation of macroinvertebrate tissue and body structures, making taxonomic identification difficult or impossible. The field preservative used in this program is 85% denatured ethanol. The preservative is prepared from a stock standard of 95% denatured ethanol. Flammability, health risks, and containment information are listed on warning labels supplied with the preservative container. Detailed information can be found with the Materials Safety Data Sheets (MSDS) maintained by Ecology’s Environmental Assessment Program staff. Minimal contact with the 95% denatured ethanol solution is recommended. The preservative used in handling sorted laboratory samples is 95% ethanol (non-denatured). Seventy percent non-denatured ethanol is used for preservation of voucher specimens in two dram vials (8 mL). Hazard Communication Training is required for all personnel who come into contact with hazardous materials while conducting program duties. Miscellaneous Field activities should be conducted by at least two persons, especially when in remote streams. A contact person should be designated at Ecology’s headquarters office to which field personnel report daily at pre-designated times (EAP, 2009). Careful planning of field activities is essential and permission to access private land must be obtained. Access to private land is usually obtained through verbal agreement with the land owner while at the proposed sampling site.
Sampling Index Period The index period is a time span during the year in which samples are collected. The index period used in this study (July 1 - October 15) was chosen for the following reasons: • Adequate time is available for the instream environment to stabilize following natural
disturbances (e.g., spring floods). • Many macroinvertebrates reach body sizes that can be readily identified.

Page 20
• Representation of benthic macroinvertebrate species reaches a maximum, particularly during periods of pre-emergence (typically mid-spring to late-summer).
Biological assessments can yield different interpretations depending on the index period chosen. This is because natural seasonal disturbances and physical stream conditions strongly affect the diversity, abundance, and life-stage progression of aquatic insects (Hynes, 1970; Vannote et al., 1980). Macroinvertebrate Sampling At each site, stream reach length is determined by identifying the lower end of the study unit and estimating an upstream distance of 20 times the bankfull width or a minimum of 1000 feet. The lower end of a study unit is located at the point of access to the stream and is always below the first upstream riffle encountered. This reach length ensures that characteristic riffle sequences are represented and potentially sampled. The sampling routine used at each site includes collection of surface water information and determination of discharge at the furthest downstream portion of the sample reach. Collection of benthic macroinvertebrate samples follows the initial surface water chemical and physical measurements. The last component of a site visit is habitat characterization. Thus stream disturbance is minimized before the biological information is collected. Eight biological samples are collected from riffle habitat in a reach. Two samples are collected from each of four riffle habitats. A variety of riffle habitats are chosen within the reach to ensure representativeness of the biological community. Sampling among several riffles in a stream increases representation of physical differences in this habitat. Also, this sampling design maximizes the chance of collecting a larger number of benthic macroinvertebrate taxa from a reach than from fewer riffles. Variations in physical condition of the riffle habitat provide an opportunity to collect both common and rare taxa. Macroinvertebrate samples are collected from riffle habitats with a D-Frame kicknet (500-micrometer net mesh). A device fastened to the base of the D-Frame kicknet encloses a one-foot by one-foot area in front of the sampler (sampling area= 1 square mile). Larger cobble and gravels within the sampler will be scraped by hand and soft brush, visually examined to ensure removal of all organisms, then discarded outside and downstream of the sampler. Remove all algae and periphyton attached to substrate since macroinvertebrates reside on these materials. Thoroughly agitate the remaining substrate within the sampler, if possible, to a depth of no more than two to three inches (5 to 8 cm). Visually examine two to three hands full of substrate to confirm that all organisms have been removed. Excess sediment and detritus (e.g., algae, leaves, plant material) retained in the sampler serve as a visual warning of the potential for net clogging. Empty the D-frame sampler into a tub between sample locations before signs of net clogging (backwash out the front of the sampler). The eight D-frame samples may be collected and composited in the net without emptying the sampler if net clogging is not suspected.

Page 21
If the net becomes full and there is danger of backwash or loss of material from around the opening of the net, then the net must be emptied. Hold the net upright, splash water on the outside of the D-frame sampler netting to wash organisms and detritus to the bottom of the net. Holding the net over a tub, invert the net and gently pull the net inside out. Using stream water previously filtered through a U.S. Standard No. 35 (500 μm) sieve, rinse and then examine the net to ensure that all organisms are removed. Remove cobbles and large gravels from the tub after close examination. Pour tub contents into a U.S. Standard No. 35 sieve. Rinse the tub and examine it to be sure all organisms are removed. Repeat the procedure at the remaining randomly selected locations until eight samples have been collected. If eight locations cannot be sampled due to limited riffle length or width, record the reason for the discrepancy on the Field Data Sheet. Place all of the sieve contents in the sample bottles. Fill each sample container not more than 2/3 full to allow room for the sample preservative. Add alcohol. Wipe the bottle threads (and the cap if necessary) to remove any sand or dirt so that the cap will tighten properly, and tighten the screw cap (500 and 1000 mL bottle caps require 40-60 inch pounds of torque to be leakproof). Then gently invert the container three to four times so the preservative will penetrate into all of the organisms. Any liquid leaking from the bottle cap with the bottle inverted indicates an incomplete seal, most likely due to dirt or debris in the bottle or cap threads. Label the bottles and place them in a box, wooden container, or cooler for transport to the laboratory. Periphyton and Chlorophyll a Sampling Periphyton are important primary producers and chemical modulators in stream ecosystems. As such, periphyton can be more sensitive to certain stressors such as nutrients, salts, sediment, and temperature compared to other aquatic organisms. Measures of periphyton structure, diversity, and density are useful in the assessment of biological condition for surface waters. For more information on periphyton and their use in bioassessments, refer to Barbour et al. (1999) and Stevenson et al. (1996). Eight biological samples are randomly collected from riffle habitat in a reach. Two samples are collected from each of four riffle habitats. Samples will be collected in close proximity to (but not within) the randomly selected D-frame sample locations. See Macroinvertebrate Sampling above for description of selecting random sample locations. Carefully remove one or two rocks from each of the eight randomly selected sample locations while retaining the rock’s orientation as it occurred in the stream to avoid loss of periphyton. Rocks should be relatively flat and range in size from about 4 cm (coarse gravel) to 10 cm (small cobble) in diameter. Collect only one rock per randomly selected sample location if the diameter of the first rock selected is equal to or exceeds 7.5 cm. If the diameter of the first rock selected is less than 7.5 cm, select a second rock. If possible, select rocks that are similar with respect to size, depth, and exposure to sunlight. A total of eight to 16 rocks are collected at each sampling site. Gently place the rocks (as they were oriented in the stream) in a plastic tray; do

Page 22
not stack rocks upon one another. Transport the tray to a convenient sample-processing area. Where possible, process the sample out of direct sunlight to minimize degradation of chlorophyll. Scrub only the upper surface of each rock with a firm-bristled toothbrush using a circular motion. In circumstances where rocks are much greater than 10 cm (medium to large cobbles), firmly brush only a portion of the upper rock surface around 10 cm in diameter. Do not brush the sides or bottom of rocks. If needed, remove any filamentous algae and mosses by scraping with a knife and place in a separate plastic tray. Use a knife or scissor to cut algal filaments or moss into roughly 2 to 3 mm segments. Gently brush other larger plant material that may be attached to the rocks, but do not collect the plants. Rinse the sampled rock surface, attached plants, and toothbrush bristles with a rinse bottle containing deionized or distilled water. Use rinse water sparingly, but be thorough. Collect rinsate in the plastic tray containing any filamentous algae or mosses. Repeat for the remaining rocks. Keep the sample volume less than 500 mL. After sample processing is complete, measure and record the total rinsate volume (now considered the composite sample volume) on the datasheet and pour the rinsate through a funnel into a 500 mL Nalgene® sample bottle. For each rock processed, cover the surface with a sheet of aluminum foil. Either trim the foil with a knife or fold the foil to match the area sampled. Place the trimmed/folded foil templates into a labeled collection envelope and attach to the field data sheets Process the composite sample following steps described in Subsample Processing Procedures to extract subsamples for chlorophyll a analysis and taxonomic identification. Subsample Processing Procedures Each composite periphyton sample processed in the field is used to extract subsamples for chlorophyll a analysis and taxonomic identification. Successful execution of subsample processing procedures described here is dependent on measuring and tracking the various volumes as the composite sample is processed. One subsample is extracted from each composite sample for the purpose of determining chlorophyll a in the laboratory. The remaining volume of the composite sample is considered the ID subsample and is preserved for taxonomic identification. Subsampling processing procedures for periphyton composite samples are as follows:
1. In an area out of direct sunlight, assemble the filtration apparatus by attaching the filter base with rubber stopper to the filtration flask. Join the flask and a hand-operated vacuum pump (with pressure gage) using a section of tubing.
2. Place a 47 mm, 0.7 micron glass microfiber filter (for example, Whatman® GF/F) on the filter base and wet with deionized or distilled water. Note: Wetting the filter will help it adhere to the base in windy conditions. Attach the filter funnel to the filter base.
3. Prior to subsample extraction, homogenize the composite sample by vigorously shaking or using a battery-powered stirrer for 30 seconds.

Page 23
4. Extract one 10 mL aliquot of homogenized composite sample using a disposable serological volumetric glass pipette, and dispense onto the middle of the wetted glass microfiber filter.
5. Filter the aliquot with the vacuum pump using 7 to 10 psi.
a. Examine the filter. An adequate amount of periphytic biomass for analysis is indicated by the green or brown color of material retained on the filter. If needed, extract additional 5 mL aliquots and filter until a green or brown color on the filter is apparent. Note: For composite samples with abundant organic material and/or fine sediment, filtration of a 10 mL aliquot may not be possible. In these circumstances, filter one 5 mL aliquot. If no difficulties were apparent when filtering the first 5 mL aliquot, proceed with filtering a second 5 mL aliquot.
b. The filtered aliquot(s) represent the chlorophyll a subsample. Determine the number of aliquots filtered and record the chlorophyll a subsample volume on the datasheet. For example, 2 aliquots x 5 mL/aliquot = 10 mL subsample volume.
c. Rinse the sides of the filter funnel with deionized or distilled water; allow the water to be vacuumed completely before releasing the vacuum from the filtering apparatus.
d. Using forceps, fold the filter into quarters with the filtered biomass inside. Remove the filter from the funnel base with forceps and wrap in a small piece of aluminum foil. Place the aluminum foil wrapped filter in a separate 47 mm Petri dish.
e. Seal the sides of the Petri dish with plastic tape and label the Petri dish with the following required information:
i. Site name ii. Sample ID iii. Collection date (mm-dd-yyyy) iv. Collection time (24 hr.) v. Composite sample volume (mL) vi. Subsample volume (mL)
f. Repeat the aliquot extraction and filtration processes if necessary for quality control duplicates.
g. Insert the labeled Petri dish(s) in a re-sealable plastic bag and place in a cooler containing dry ice. About 4.5 kg (10 pounds) of dry ice is needed for a small cooler (< 2 gal). Insulate the cooler with newspaper to minimize sublimation of dry ice. Note: Wet ice can be used if dry ice is not available. Make a note on the data sheet when wet ice is used.
h. Coolers should be shipped within a few days after the subsamples have been prepared because of a 25-day holding time limit. Subsamples can be temporarily stored in a freezer (at -20°C) at the field office over weekends. Contact laboratory personnel to notify them of plans to ship (via overnight shipping service) coolers containing dry ice and frozen subsamples. Be sure to disclose to the carrier the amount of dry ice in the cooler prior to shipping.
6. Measure the volume of the remaining composite sample (which represents the ID subsample volume) and record on the datasheet.

Page 24
7. Preserve the ID subsample with 5 to 10% Lugol’s solution (see Sample Preservative-Lugol’s Solution for preparation). Five percent should be sufficient for most samples, although up to 10% can be used for samples rich in organic matter. Record the preservative volume on the datasheet. The quantities of Lugol’s solution required for selected sample volumes are:
500 mL ID subsample, add 25 mL Lugol’s solution. 400 mL ID subsample, add 20 mL Lugol’s solution. 250 mL ID subsample, add 12 mL Lugol’s solution.
8. Label the ID subsample with the following required information: a. Site name b. Sample ID c. Collection date (mm-dd-yyyy) d. Collection time (24 hr.) e. ID subsample volume (mL) [ID subsample + preservative]
Periphyton Sample Preservative-Lugol’s Solution Prepare Lugol’s solution by dissolving 20 grams potassium iodide (KI) and 10 grams iodine crystals in 200 mL distilled water containing 20 mL glacial acetic acid. Store Lugol’s solution in an opaque plastic bottle. Riffle Pebble Count and Embeddedness Measurements The embeddedness measurement procedure presented herein is a modified version of the procedure described by MacDonald, Smart, and Wissmar (1991). It is most applicable to channels with gravel- or cobble-dominated beds. It may have limited, if any, use in high-energy, steep-gradient channels where fine sediment deposition is unlikely. It may not be as appropriate in basins where the sediment load is mostly comprised of silts and clays, and in low-gradient reaches that lack the coarse particles needed to measure embeddedness. Embeddedness and riffle pebble count is evaluated at the same time when, and in the same riffle/run habitat where, the macroinvertebrate D-frame samples are collected (See Macroinvertebrate Sampling). Measurements are made after rocks are scrubbed in the D-frame. The channel bed upstream and within the riffle/run habitat should not be disturbed prior to making measurements.
1) Each of the four riffles are divided into three equidistance transects. A total of 11 particles
are measured across each transect as follows: a. At the left bankfull stage. b. 10% distance across the channel. c. 20% distance across the channel. d. 30% distance across the channel. e. 40% distance across the channel. f. Half way across the channel. g. 60% distance across the channel.

Page 25
h. 70% distance across the channel. i. 80% distance across the channel. j. 90% distance across the channel. k. At the right bankfull stage.
2) Data are collected in the size range of ≥10 mm to ≤300 mm median diameter. Areas, regions, or “pockets” of homogenous fine sediment that cover gravels and cobbles are defined as 100% embedded. Hardpan and bedrock are by definition 0% embedded (consider the applicability of embeddedness measures for these bed materials).
3) Individual particles are selected from the streambed in front of the predetermined random locations where D-frame samples were collected. Particles are selected from the “wetted” or “active” bed of the channel. The particles are “blindly” selected by looking away from the selection site and extending an index finger to the first particle touched on the streambed. Before the particle is removed from the bed, its top and sides are closely examined to determine if it is covered or embedded by fine sediment. A piece of plexiglass may be used to break the water surface and provide a clearer view of the particle. This is done to verify that stain lines on the particle are not the result of past sedimentation or periphyton growth on the upper surface.
4) Remove the particle from the streambed while retaining its spatial orientation to measure and record both its total vertical height (Dt) and embedded height (De) perpendicular to the bed surface. A stain line may be noticeable to differentiate the embedded portion from the portion that is above the plane of embeddedness. The particle’s median or intermediate diameter (Dm) is measured and recorded after Dt and De are measured.
5) The number of particles to be collected in front (upstream) of each D-frame collection
location may require some pre-planning, depending on the size of the riffle and the relative proximity of each randomly determined D-frame location. The individual Dt and De values for all 100 particles are summed, and a percent embeddedness value is calculated for the riffle/run habitat from the formula:
Percent Mean Embeddedness = 100 (∑ De / ∑ Dt)

Page 26
Bankfull Width, Determining Determining bankfull width is a qualitative evaluation and a distance/elevation measurement, followed by a calculation of the entrenchment ratio. Bankfull stage is defined as the point where stream water just begins to overflow into the active flood plain (approximately the 1.5 to 2.0 year flood). Bankfull stage must be determined at each wadeable monitoring sample location. Observe bankfull stage indicators such as (1) the flat, depositional surface adjacent to the channel (best indicator, but may be absent in certain stream types); (2) top of point bars; (3) a change in vegetation (especially the lower limit of perennial species); (4) a slope or topographic break along the bank; (5) a change in particle size of bank material; (6) undercuts in the bank, which usually reach an interior elevation slightly below bankfull stage; and (7) stain lines or the lower extent of lichens on boulders. Stretch a tape across the stream, perpendicular to the flow at the bankfull stage elevation. The tape should be level. If the tape is sloped, the bankfull indicators need to be reevaluated. Determine and record bankfull width by measuring the distance from bank to bank. Water Surface Slope This method describes how to measure stream slope and bearing of the main channel at each site during a data collection event. It applies to waded streams. This method requires use of a hand level, measuring rod, and a compass to make incremental measurements across each sample riffle. This is a quantitative measurement of the change in elevation over a measured distance. Riffle gradient refers to the percent slope of the monitoring site riffle over a distance of 100 feet OR the entire length of the riffle if it is less than 100 feet. To measure stream gradient, place a staff or rod in a vertical position at the stream’s "wetted edge" (edge of water) at the most downstream portion of the riffle. Stand next to the staff at the same elevation as the wetted edge, hold a clinometer to one eye, align the cross hairs with the zero, and record the reference point on the staff. Measure 100 feet OR the entire length of the riffle if it is less than 100 feet upstream from the staff, and leave the tape in place. Record the actual distance if it is less than 100 feet. Do not enter the stream. Stand at the wetted edge, hold the clinometer to one eye, and align the cross hairs with the reference point on the staff. Record percent slope per 100 feet or for the length of the riffle.

Page 27
Canopy Cover Percent canopy cover is estimated with a convex densiometer (Lemmon, 1957) that has been modified according to Mulvey et al. (1999). Canopy cover is estimated at each sampling riffle. Four readings are taken at the sample point (facing upstream, facing downstream, facing the right bank, and facing the left bank). In addition, one reading is taken facing the bank at the wetted right bank and left bank, respectively. Each measurement is taken one foot above the water surface. The composite value is the sum of the four readings taken from the macroinvertebrate sample location.
Measurements Stream Discharge
Instantaneous discharge measurements will be taken at the base of each sampling reach according to field methods described by the American Fisheries Society (Gallagher and Stevenson, 1999) and according to methods in the meter manufacturer’s operating manual. One duplicate discharge measurement will be recorded during each sampling event. Conductivity (or Salinity), pH, and Dissolved Oxygen
Conductivity, pH, and dissolved oxygen measurements will be collected at each sampling site using a Hydrolab MiniSonde®. Measurements will be collected according to field methods described in the Standard Operations for Hydrolab® DataSonde® and MiniSonde® Multiprobes (Swanson, 2007). Multi-probe, pre-and post-calibration procedures (Swanson, 2007) will be performed for each sampling run.
Sequence for Conducting Field Operations Field procedures follow a sequence of measurements that ensure quality information is collected and a reasonable amount of time is spent at each site. The sequence and spatial arrangement of field operations is outlined in Figures 2 and 3, respectively. 1. Field staff collect surface water and discharge information for water quality measurements at
the furthest downstream portion of the sample reach.
2. Field crew lead selects biological sampling locations in four different riffles.
3. The lead identifies the biological sampling location with numbered flags along the bank.
4. Field crew collects macroinvertebrate samples from all four sampling locations.
5. The lead collects two substrates from the sides of the D-frame net and hands them to a field assistant for periphyton collection.
6. Field crew collects periphyton samples.

Page 28
7. The lead collects particles across the channel at each of the three riffle transects and determines particle embeddedness and size.
8. Field crew deposits collected macroinvertebrates into a container and preserves the samples with 85% isopropanol.
9. Field crew evaluates slope and reach-wide bank stabilization. With the above sampling sequence, stream disturbance is minimized before surface water and biological information is collected.
Figure 2. Sequence of field operations.
(Modified from Plotnikoff and Wiseman, 2001.)

Page 29
Figure 3. Spatial distribution of field operations.
(Modified from Plotnikoff and Wiseman, 2001).

Page 30
Quality Control Procedures
Laboratory Analyses Chlorophyll a analyses will be performed in accordance with the Manchester Environmental Laboratory Users Manual (MEL, 2008). This manual indicates that the reporting limits listed in Table 5 can be achieved by using analytical methods listed. Laboratory staff will consult the project manager if there are any changes in procedures over the course of the 2009-2013 project timeline, or if other difficulties arise. The field crew will communicate with the laboratory to ensure that laboratory resources are available. The project team will follow normal Manchester Environmental Laboratory (MEL) procedures for sample notification and scheduling. With adequate communication, sample quantities and processing procedures should not overwhelm the laboratory capacity. When laboratory-sample load capacities are heavy, rescheduling of individual surveys may be necessary. Macroinvertebrate and Periphyton Identification Quality control procedures for biological identification are outlined in the Scope of Work to the contractor and are presented in Appendices B and C.

Page 31
Data Management Procedures
Laboratory Data Procedures for laboratory data reduction, review, and reporting are outlined in the Lab Users Manual (MEL, 2008). Laboratory staff will be responsible for the following functions: • Data verification. • Proper transfer of data to the Laboratory Information Management System (LIMS). • Reporting data to the project manager. The Environmental Information Management (EIM) data engineer will subsequently enter data into Ecology’s EIM system after data verification and validation. The project manager will perform the following functions: • Review data for errors (quarterly) and make procedural adjustments as necessary after
consultation with the project team. • Apply corrective measures to minimize errors and validate the quality of the data. Major changes will require notification of those who have signed this Quality Assurance (QA) Project Plan. The project manager may approve data that do not meet MQOs (Table 5), but only after consultation with QA Project Plan signatories, and only with appropriate data qualification.
Laboratory Reports MEL will report all laboratory results to the project manager within 30 days of sample delivery. The reports will include narratives, numerical results, data qualifiers, and costs. The taxonomic contractor will report all results to the project manager within six months of sample delivery.
Field Data Field observations and measurement data will be recorded by pencil onto a notebook with waterproof pages. The project manager will review the field data after each sampling run and calculate discharge from water velocity measurements. The project manager will review calculated data for errors and make procedural adjustments as necessary. All field data will then be entered into Excel® spreadsheets (Microsoft, 2001) for later integration with laboratory data before exporting to Ecology's EIM database. Data entry and validation will be performed by staff within Ecology's Environmental Assessment Program. All entered data will be validated by an internal, independent reviewer. Errors found will be identified, flagged, and corrected by the project manager. The EIM data engineer will upload all data into the EIM database.
Page 32
Audits and Reports
The taxonomic contractor and MEL will submit laboratory reports, QA worksheets, and chain-of-custody records to the Environmental Assessment Program staff. Any problems and associated corrective actions will be reported by the laboratory to the project manager. The project manager is responsible for periodic audit updates to the team and client as well as for the final report.
Data Verification and Usability Assessment
Data Verification Data verification involves examining the data for errors, omissions, and compliance with quality control (QC) acceptance criteria. MEL is responsible for performing the following functions:
• Reviewing and reporting QC checks on instrument performance such as initial and continuing calibrations.
• Reviewing and reporting case narratives. This includes comparison of QC results with method acceptance criteria such as precision data, surrogate and spike recoveries, laboratory control sample analysis, and procedural blanks.
• Explaining flags or qualifiers assigned to sample results.
• Reviewing and assessing MEL’s performance in meeting the conditions and requirements set forth in this QA Project Plan.
• Reporting the above information to the project manager or lead. After field staff record measurement results, the results are verified by the project manager to ensure that:
• Data are consistent, correct, and complete, with no errors or omissions.
• Results of QC samples accompany the sample results.
• Established criteria for QC results were met.
• Data qualifiers are properly assigned where necessary.
• Data specified in the Sampling Process Design were obtained.
• Methods and protocols specified in this QA Project Plan were followed. The project manager is responsible for verifying all taxonomic results.

Page 33
MEL is responsible for verifying all analytical results. Reports of results and case summaries provide adequate documentation of the verification process. MEL analytical data will be reviewed and verified by comparison with acceptance criteria according to the data review procedures outlined in the Lab Users Manual (MEL, 2008). Appropriate qualifiers will be used to label results that do not meet QA requirements. Field results will also be verified by field staff before leaving the site after measurements are made. Detailed field notes will be kept to meet the requirements for documentation of field measurements. The field lead is responsible for checking that field data entries are complete and error free. The field lead will check for consistency within an expected range of values, verify measurements, ensure measurements are made within the acceptable instrumentation error limits, and record anomalous observations.
Data Usability Assessment Data validation and usability assessment follow verification. This involves a detailed examination of the data package using professional judgment to determine whether the MQOs have been met. The project manager examines the complete data package to determine compliance with procedures outlined in the QA Project Plan and Standard Operating Procedures. The project manager is also responsible for the data usability assessment by ensuring that the MQOs for precision, bias, and sensitivity are met. Part of this process is an evaluation of precision. Precision will be assessed by calculating relative standard deviations (RSDs) for field and laboratory duplicates. Laboratory duplicates will yield estimates of precision performance at the laboratory only. Field replicates will indicate overall variability (environmental + sampling + laboratory). Acceptable precision performance is outlined in the MQOs (Table 5). The project manager will assess completeness by examining the (1) number of samples collected compared to the sampling plan; (2) number of samples shipped and received at MEL and the taxonomic contractor in good condition; (3) lab’s ability to produce usable results for each sample; and (4) sample results accepted by the project manager. To analyze data for its usability, the project lead will consider precision, completeness, and documentation of adherence to protocols. Data will also be examined for extremes (i.e., against historical records and against the distributions of these project data). Extreme values will require logical explanations. Identified sources of bias will be described in the final project report.

Page 34
Project Organization
Ecology employees involved in this project are listed in Table 6. All persons listed on the signature approval page are responsible for reviewing and approving the final QA Project Plan. Table 6. Organization of project staff and responsibilities.
Staff (All are in EAP) Title Responsibilities
Scott Collyard Directed Studies Unit Western Operations Section Phone: (360) 407-6455
Author, Project Manager,
and Principal Investigator
Writes the QAPP. Conducts QA review of data, analyzes and interprets data, and prepares data for upload to EIM. Writes the draft report and final report.
Markus Van Prause Directed Studies Unit Western Operations Section Phone: (360) 407-6000
Co-Author, EIM Data Engineer, and Field Assistant
Assists in writing the QAPP. Uploads data into EIM. Collects samples and records field information.
George Onwumere Directed Studies Unit Western Operations Section Phone: (360) 407-6730
Unit Supervisor Reviews and approves the QAPP and final report.
Robert F. Cusimano Western Operations Section Phone: (360) 407 - 6596
Section Manager Approves the QAPP and final report.
Stuart Magoon Manchester Environmental Laboratory Phone: (360) 871-8801
Director Approves the final QAPP.
William R. Kammin Phone: (360) 407-6964
Ecology Quality Assurance Officer
Reviews the draft QAPP and approves the final QAPP.
EAP – Environmental Assessment Program. EIM – Environmental Information Management system. QAPP – Quality Assurance Project Plan.

Page 35
References
Barbour, M.T., J. Gerritsen, B.D. Snyder, and J.B. Stribling, 1999. Rapid Bioassessment Protocols for Use in Streams and Wadeable Rivers: Periphyton, Benthic Macroinvertebrates, and Fish, Second Edition. EPA 841-B-99-002. U.S. Environmental Protection Agency, Office of Water, 33399 Washington, D.C. Brown, M.T. and M.B. Vivas, 2005. Landscape Development Intensity Index. Environmental Monitoring and Assessment 101:289-309. EAP, 2009. Environmental Assessment Program Safety Manual. Environmental Assessment Program, Washington State Department of Ecology, Olympia, WA. Ecology, 2004. Quality Assurance Project Plan: Deschutes River, Capitol Lake, and Budd Inlet Temperature, Fecal Coliform Bacteria, Dissolved Oxygen, pH, and Fine Sediment: Total Maximum Daily Load Study. Washington State Department of Ecology, Olympia, WA. Publication No. 04-03-103. www.ecy.wa.gov/biblio/0403103.html. Ecology, 2009. Draft. Deschutes River, Capitol Lake, and Budd Inlet Temperature, Fecal Coliform Bacteria, Dissolved Oxygen, pH, and Fine Sediment: Total Maximum Daily Load. Water Quality Study Findings. Washington State Department of Ecology, Olympia, WA. Gallagher, A.S. and N.J. Stevenson, 1999. Streamflow. Pages 149-157 in M.B. Bain and N.J. Stevenson, editors. Aquatic Habitat Assessment: Common Methods. American Fisheries Society, Bethesda, MD. General Administration (GA), 2002. Capitol Lake, A Vision for the Next Ten Years. Washington State Department of General Administration, Olympia, WA. Haring, D. and J. Konovsky, 1999. Salmonid habitat limiting factors: Water Resources Inventory Area 13. Final Report. Washington State Conservation Commission, Olympia, WA. Hynes, H.B.N., 1970. The Ecology of Running Waters. University of Toronto Press, Toronto, Canada. 555 pp. Lemmon, P.E., 1957. A New Instrument for Measuring Forest Overstory Density. Journal of Forestry. 55(9):667-668. MacDonald, L.H., A.S. Smart, and R.C. Wissmar, 1991. Monitoring guidelines to evaluate effects of forestry activities on streams in the Pacific Northwest and Alaska. EPA/910/9-91-001, U.S. Environmental Protection Agency, Water Division, Seattle, WA. 166 pp.

Page 36
Mathieu, N., 2006. Replicate Precision for Twelve Total Maximum Daily Load (TMDL) Studies and Recommendations for Precision Measurement Quality Objectives for Water Quality Parameters. Washington State Department of Ecology, Olympia, WA. Publication No. 06-03-044. www.ecy.wa.gov/biblio/0603044.html. MEL, 2008. Manchester Environmental Laboratory Lab Users Manual, Ninth Edition. Washington State Department of Ecology, Manchester, WA. Merritt, R.W. and K.W. Cummins (eds.), 1996. An Introduction to the Aquatic Insects of North America, 3rd ed. Kendall/Junt Publishing Company, Dubuque, IA. 862 pp. Microsoft, 2001. Microsoft Office XP Professional, Version 10.0. Microsoft Corporation. Mulvey, M., L. Caton, and R. Hafele, 1999. Oregon Nonpoint Source Monitoring Protocols and Stream Bioassessment Field Manual for Macroinvertebrates and Habitat Assessment, Draft. Oregon Department of Environmental Quality, Portland, OR. Municipal Research and Services Center of Washington, 2003. City Demographics. www.mrsc.org/cityprofiles/. Plotnikoff, R.W. and C. Wiseman, 2001. Revision. Benthic Macroinvertebrate Biological Monitoring Protocols for Rivers and Streams. Washington State Department of Ecology, Olympia WA. Publication No. 01-03-028. www.ecy.wa.gov/biblio/0103028.html. Stevenson, R.J., M.L. Bothwell, and R.L. Lowe, 1996. Algal Ecology, Freshwater Benthic Ecosystems. Academic Press. 753 pp. Swanson, T., 2007. Standard Operating Procedure (SOP) for Hydrolab® DataSonde® and MiniSonde® Multiprobes, Version 1.0. Washington State Department of Ecology, Olympia, WA. SOP Number EAP033. www.ecy.wa.gov/programs/eap/quality.html. Vannote, R.L., G.W. Minshall, K.W. Cummins, J.R. Sedell, and C.E. Cushing, 1980. The river continuum concept. Canadian Journal of Fisheries and Aquatic Sciences 37: 130- 137. Wyoming Department of Environmental Quality, 2005. Manual of Standard Operating Procedures for Sample Collection and Analysis. Water Quality Division, Watershed Program, Cheyenne, WY.

Page 37
Appendices

Page 38
Appendix A. Glossary, Acronyms, and Abbreviations Glossary 303(d) list: Section 303(d) of the federal Clean Water Act requires Washington State to periodically prepare a list of all surface waters in the state for which beneficial uses of the water – such as for drinking, recreation, aquatic habitat, and industrial use – are impaired by pollutants. These are water quality limited estuaries, lakes, and streams that fall short of state surface water quality standards, and are not expected to improve within the next two years.
Anthropogenic: Human-caused.
Benthic invertebrates: Bottom-dwelling organisms without backbones (e.g., aquatic insects, crustaceans, worms).
Biological samples: In this study, biological samples include macroinvertebrate and periphyton samples collected from the bottom of the stream.
Chemistry samples: In this study, chemistry samples include the measurement of pH, dissolved oxygen, temperature, and conductivity.
Clean Water Act: A federal act passed in 1972 that contains provisions to restore and maintain the quality of the nation’s waters. Section 303(d) of the Clean Water Act establishes the TMDL program.
Macroinvertebrates: Animals without backbones that are big enough to see with the naked eye. Examples include most aquatic insects, snails, and crayfish.
Matrix: Sample type.
Metrics: A set of measurements that quantify results.
National Pollutant Discharge Elimination System (NPDES): National program for issuing, modifying, revoking and reissuing, terminating, monitoring, and enforcing permits, and imposing and enforcing pretreatment requirements under the Clean Water Act. The NPDES program regulates discharges from wastewater treatment plants, large factories, and other facilities that use, process, and discharge water back into lakes, streams, rivers, bays, and oceans.
Nonpoint source: Pollution that enters any waters of the state from any dispersed land-based or water-based activities, including but not limited to atmospheric deposition, surface water runoff from agricultural lands, urban areas, or forest lands, subsurface or underground sources, or discharges from boats or marine vessels not otherwise regulated under the NPDES program. Generally, any unconfined and diffuse source of contamination. Legally, any source of water pollution that does not meet the legal definition of “point source” in section 502(14) of the Clean Water Act.
Nutrient: Substance such as carbon, nitrogen, and phosphorus used by organisms to live and grow. Too many nutrients in the water can promote algal blooms and rob the water of oxygen vital to aquatic organisms.

Page 39
Parameter: Water quality constituent being measured (analyte).
Pathogen: Disease-causing microorganisms such as bacteria, protozoa, viruses.
Periphyton: Microscopic plants and animals that are firmly attached to solid surfaces under water such as rocks, logs, pilings, and other structures.
Point source: Sources of pollution that discharge at a specific location from pipes, outfalls, and conveyance channels to a surface water. Examples of point source discharges include municipal wastewater treatment plants, municipal stormwater systems, industrial waste treatment facilities, and construction sites that clear more than 5 acres of land.
Pollution: Such contamination, or other alteration of the physical, chemical, or biological properties, of any waters of the state. This includes change in temperature, taste, color, turbidity, or odor of the waters. It also includes discharge of any liquid, gaseous, solid, radioactive, or other substance into any waters of the state. This definition assumes that these changes will, or is likely to, create a nuisance or render such waters harmful, detrimental, or injurious to (1) public health, safety, or welfare, or (2) domestic, commercial, industrial, agricultural, recreational, or other legitimate beneficial uses, or (3) livestock, wild animals, birds, fish, or other aquatic life.
Reach: A specific portion or segment of a stream.
Riffle: A shallow in a stream, producing a stretch of ruffled or choppy water.
Riparian: Transitional zone between aquatic and upland areas. The riparian area has vegetation or other physical features reflecting permanent influence on surface water or subsurface water.
Salmonid: Any fish that belong to the family Salmonidae. Basically, any species of salmon, trout, or char. www.fws.gov/le/ImpExp/FactSheetSalmonids.htm
Sediment: Solid fragmented material (soil and organic matter) that is transported and deposited by water and covered with water (example, river or lake bottom).
Stormwater: The portion of precipitation that does not naturally percolate into the ground or evaporate but instead runs off roads, pavement, and roofs during rainfall or snow melt. Stormwater can also come from hard or saturated grass surfaces such as lawns, pastures, playfields, and from gravel roads and parking lots.
Taxa: Species or group of organisms having similar characteristics. The lowest level of identification for organisms.
Total Maximum Daily Load (TMDL): A distribution of a substance in a waterbody designed to protect it from exceeding water quality standards. A TMDL is equal to the sum of all of the following: (1) individual wasteload allocations for point sources, (2) the load allocations for nonpoint sources, (3) the contribution of natural sources, and (4) a Margin of Safety to allow for uncertainty in the wasteload determination. A reserve for future growth is also generally provided.

Page 40
Wasteload allocation: The portion of a receiving water’s loading capacity allocated to existing or future point sources of pollution. Wasteload allocations constitute one type of water quality-based effluent limitation.
Watershed: A drainage area or basin in which all land and water areas drain or flow toward a central collector such as a stream, river, or lake at a lower elevation.
Acronyms and Abbreviations
Ecology Washington State Department of Ecology EIM Environmental Information Management system EPA U.S. Environmental Protection Agency GIS Geographic Information System software LDI Landscape Development Intensity analysis MEL Manchester Environmental Laboratory MQO Measurement quality objective NAWQA National Water Quality Assessment Program (USGS) NPDES (See Glossary above) QA Quality assurance QC Quality control RM River mile TMDL (See Glossary above) USGS U.S. Geological Survey WAC Washington Administrative Code WDFW Washington Department of Fish and Wildlife Units of Measurement °C degrees centigrade cfs cubic feet per second ft feet m meter mL milliliters µS/cm microsiemens per centimeter, a unit of conductivity

Page 41
Appendix B. Macroinvertebrate Scope of Work
Washington Department of Ecology Periphyton Sample Analysis and Data Management
Scope of Work
Sample Information Samples are collected with a 500-micrometer mesh D-frame kicknet. At each site, kick samples are collected from one square foot of surface area along eight transects and composited into a single sample bottle for a total of 8 square feet of sampling area. Samples are preserved in the field using a solution of 95% non-denatured ethanol. Sample Preparation Samples are sub-sampled using a 500-organism count. According to Ecology protocols (Plotnikoff and Wiseman, 2001), macroinvertebrates are removed from a minimum of two randomly chosen squares from a 30-square, sub-sampling grid. The dimension of each square is 6 cm x 6 cm, and the grids’ overall dimensions are 30 cm x 36 cm. The sample material is spread evenly across the grid, and all organisms are removed from randomly chosen squares until a minimum of 500 macroinvertebrates are removed from the sample prior to identification under the dissecting scope. In some cases, there may be less than 500 organisms in the whole sample. When the target count of organisms has been reached or the specified amount of material has been sorted, a special protocol for Large and Rare Specimens may be followed, with these organisms placed in an additional labeled vial. Large and Rare Specimen Identification The remainder of the sample material in the tray will be scanned for a maximum of 15 minutes to find any large or rare taxa that may have been missed in the sample. These specimens will be identified and placed together in a vial labeled “Large and Rare Taxa” for the voucher collection. This scan will include any adult aquatic invertebrates, which will be archived separately (not to be identified and included in the dataset) for anyone interested in looking at the material in the future. Macroinvertebrate Identification All major orders of freshwater macroinvertebrates are identified to at least the genus level, including the Chironomidae and Simuliidae, and to species where existing taxonomic keys are available. Taxon groups normally identified to coarser taxonomic levels include: Lumbriculidae, Naididae, Oligochaeta, and select families of the Coleoptera, Planariidae, and Acari. If the taxonomist has a compelling reason that a specimen cannot be identified to the genus level, the taxonomist may decide to aggregate individuals in the next highest taxonomic level.

Page 42
Lab Quality Assurance Samples - Macroinvertebrate Sorting Samples are either sorted whole, or in the case of large sediment volumes, sub-sampled so that only a fraction of the original is analyzed. Precision of the sub-sampling process is evaluated by re-sorting a new sub-sample of the original samples. Ten percent of the benthic macroinvertebrate samples (1 of 10 samples) are re-sorted by a second laboratory technician. Sorting results that are less than 95% similar would indicate the need for (1) more thorough distribution of sample materials across the sub-sampling grid, and (2) special attention given to easily missed taxa when sorting (for example, increased magnification). Taxonomic Accuracy and Precision Taxonomic misidentification results in inadequate biological characterization of a stream. Errors in identification should be less than 5% of the total taxa in the sample. Re-identification of samples is conducted for 10% of the total number of samples in each year. Secondary identification is conducted by experienced taxonomists to maintain confidence in the data set. Difficult taxa should be sent to museum curators whose specialty includes members of the order in question. A voucher collection has been maintained by Ecology and is being transferred to the Orma J. Smith Museum of Natural History in Caldwell, Idaho for curation. A voucher collection should be prepared from the set of samples for the year and shipped to the address below: The Orma J. Smith Museum of Natural History College of Idaho 2112 Cleveland Blvd Caldwell, ID 83605-4432 Documentation necessary for acceptance by the museum will be delivered to the apparent successful contractor with the samples. Reporting Requirements The contractor will complete all analyses and submit all final data and QA results via the Puget Sound Stream Benthos website, including; • Sample ID. • ITIS (Integrated Taxonomic Information System) number. • Taxon name. • Taxon count. • Density estimate per sample of each species in square meters. • Percent sample sorted – Website will ask for number of squares counted out of total number
of squares. • Number of individuals per species of organisms in a life stage other than Juvenile
(i.e., eggs, adults, larval) in each sample. • Number of individuals that were damaged to the point that identification to the required
resolution was not possible.

Page 43
The Puget Sound Stream Benthos website is an online macroinvertebrate data management system used by numerous jurisdictions and organizations in Washington State. King County Department of Natural Resources and Parks will provide the contractor with a secure login to access the website, www.pugetsoundstreambenthos.org. The data management system has an extensive approved master taxa list, as well as built in data validation. Therefore, the contractor will be required to use the tools provided by the data management system (either online or desktop) when tabulating the samples and taxonomic data. The advantages of submitting via this system include automatic availability of data to the public, comparability with archived data in the repository, and reporting and analysis options are pre-built and customizable. Therefore, the contractor is not obligated to conduct further analyses of the data (for example, no BIBI calculations are required). Note: If the contractor identifies taxa in the samples that are not already included in the approved master taxa list, the contractor will notify the Puget Sound Stream Benthos technical support of the new taxa in order to update the list. This is anticipated to be a rare occurrence. However, if it does occur, technical support will respond within 72 hours. The contractor will be solely responsible for the integrity of all samples from the time of contractor receipt to the time of results delivery (data upload and voucher specimen delivery). The contractor agrees to operate under an active safety program. This program will meet all applicable federal, state, and local regulations for (1) the safe handling and analysis of environmental samples, and (2) safe laboratory practices for handling samples preserved with a 95% solution of non-denatured ethanol. Delivery The contractor will be responsible for the pick-up of samples from Ecology and return of sample jars to Ecology. Upload of data to the Puget Sound Stream Benthos website, delivery of the voucher specimens, and return of original sample jars should be completed by March 1 of the year following sample receipt. Should the bidding contractor find this schedule too stringent, the contractor may suggest the time in which the contractor can guarantee delivery of data after receipt of samples. Ecology will make payment to the contractor after uploading and accepting the data.

Page 44
Appendix C. Periphyton Scope of Work
Washington Department of Ecology Periphyton Sample Analysis and Data Management
Scope of Work
Introduction Samples are collected in one of three ways: 1. Each individual sample is a composite of periphyton collected from eight to 16 rocks
(2.0-4.0 inches in diameter). One or two rocks are collected from each of eight randomly selected locations within a single stream riffle.
2. Each individual sample is a composite of periphyton collected from eight 4-8 inch long
pieces of woody material. 3. Each individual sample is a composite of periphyton collected from five depositional areas
using a Petri dish (cookie cutter) method. All samples are preserved in 5-10% Lugol’s solution. Concentration of Lugol’s solution depends on the amount of organic material in the sample. The estimated number of samples is approximately 15 per year (60 total). Level of Identification A standardized level of identification is required to allow for valid comparison of periphyton data sets between sampling locations. The standard level of identification required by Ecology is that diatoms be identified to species (or species variety, if possible), and non-diatoms (soft-bodied algae) be identified to genus. Sample Processing and Subsampling
Samples are homogenized in a blender to break up large colonies and filaments and to evenly distribute individual cells. A sub-sample is transferred to a Palmer-Maloney counting chamber, and 300 live algae cells are counted at 400X. The sub-sample is diluted or concentrated to achieve an optimum concentration of 10-20 cells per field. For small filamentous cyanobacteria (e.g., Phormidium) and for coenocytic algae that lack cell walls (e.g., Vaucheria), the counting unit will be a 10-micron length of filament. Diatoms are identified only as diatoms; soft (non-diatom) algae are identified to genus, and to species if possible. The number of dead (empty) diatom frustules is also recorded on the bench sheet during the count of 300 live cells.
After the identification of soft algae, the homogenized sample is re-agitated and a portion of the raw sample is extracted to make duplicate diatom slides. The diatom sub-sample is cleaned of organic matter using sulfuric acid, potassium dichromate, and hydrogen peroxide. Following

Page 45
several dilutions with distilled water, two permanent diatom slides are prepared from cleaned material using Naphrax, a high refractive index mounting medium. At least 300 diatom cells (600 valves) are counted at random and identified to species, and variety if possible. Diatom naming conventions should follow those adopted by the Academy of Natural Sciences (Philadelphia) for USGS NAWQA samples (Morales and Potapova, 2000) as updated in 2005 (Morales and Charles, 2005). Separate bench sheets will be used for algae and diatom counts, and these will provided to Ecology when samples are completed each year.
Counts of soft algae and diatoms will be conducted with compound research microscopes using brightfield transmitted light or differential interference contrast. Proportional counts will be performed using 100X oil immersion objectives and 10X oculars.
Voucher slides will be provided to Ecology at the end of the project. Alternatives to, or variations in, the methods described above will be considered. Bidders should describe the alternative procedures in their proposal, including any associated variations in pricing. Remaining sample volume will be re-preserved and stored by the contract laboratory. Contractor storage of sample fractions may be as long as six months. Ecology may request that a subset of samples be returned for quality assurance purposes. Non-requested sample fractions will be appropriately discarded by the contractor. Data Management and Periphyton Metrics Taxa lists for each sample should be reported in a taxa- density matrix (expressed as abundance per cm2). Surface area sampled is provided by Ecology and included on the chain-of-custody form. The contract laboratory will analyze the taxonomy matrix for each sample and summarize with a suite of periphyton metrics. In most cases, diatoms and non-diatoms will be analyzed separately with a few exceptions (combined metrics) outlined below. This list represents the minimum metric reporting requirements. The contractor is encouraged to provide additional metrics if available and relevant. Combined metrics 1. Total number of algal divisions. 2. Total number of algal genera. 3. Total number of algal species. Diatom metrics 1. Total number of diatom genera. 2. Total number of diatom species. 3. Shannon Diversity Index. 4. Pollution Index (Lange-Bertalot, 1979; Bahls, 1993; Barbour et al., 1999). 5. Siltation Index (% Navicula + Nitzschia + Surirella)(Bahls, 1993; Barbour et al., 1999). 6. Percent live diatoms (Hill, 1997). 7. Valves counted.

Page 46
8. Cells counted. 9. Percent dominant species. 10. Pollution tolerance (% by category). 11. Disturbance index (Bahls, 1993; Barbour et al., 1999). 12. Percent rhopalodiales. 13. Percent aerophiles. 14. Percent centrics. 15. Motility index. Van Dam diatom metrics (% in each category)(Van Dam et al., 1994) 1. pH. 2. Salinity. 3. Nitrogen uptake. 4. Oxygen demand. 5. Saprobity. 6. Trophic state. 7. Moisture. Non-diatom metrics 1. Dominant phylum. 2. Percent 5 dominant genera. 3. Percent 10 dominant genera. 4. Total number of genera (within each non-diatom algal division). 5. Total number of non-diatom genera. Sample Submittal and Data Turn-Around Ecology will collect samples between early June and late October of years 2009-10 and 2012-13. Ecology will ship samples to the contractor no later than December 1 of each year. Ecology is responsible for costs of shipping samples and forms to the contract laboratory. The processing of samples and reporting of data will be completed within 90 days of the receipt of the samples by the contract laboratory. Data reported to Ecology will consist of: 1. The original (signed) chain-of-custody form. 2. A taxonomic matrix for each sample based on the required level of identification
(Excel or Access format). 3. Metric calculations (Excel or Access format). 4. Copies of bench sheets used by the laboratory. 5. Copies of all QA/QC documentation. The contract laboratory is responsible for the costs of shipping data reports, bench sheets, and chain-of-custody forms. Empty Nalgene bottles, requested sample fractions, and coolers will be returned to Ecology (Olympia office). The contract laboratory shall submit an invoice to the Ecology project officer for reimbursement for the shipping costs of these materials.

Page 47
References for Appendix C Bahls, L.L., 1993. Periphyton bioassessment methods for Montana streams. Department of Health and Environmental Science, Water Quality Bureau, Helena, MT. Barbour, M.T., J. Gerritsen, B.D. Snyder, and J.B. Stribling, 1999. Rapid Bioassessment Protocols for Use in Streams and Wadeable Rivers: Periphyton, Benthic Macroinvertebrates, and Fish, Second Edition. EPA 841-B-99-002. U.S. Environmental Protection Agency, Office of Water, Washington, D.C. Hill, B.H., 1997. The use of periphyton assemblage data in an index of biotic integrity. Bulletin of the North American Benthological Society 14:158. Lange-Bertalot, H., 1979. Pollution tolerance of diatoms as a criterion for water quality estimation. Nova Hedwigia 64: 285-304. Morales, E.A. and D.F. Charles (Eds.), 2005. Tenth NAWQA Taxonomy Workshop on Harmonization of Algal Taxonomy. Report No. 05-1F. Patrick Center for Environmental Research, Academy of Natural Sciences, Philadelphia, PA. 121 pp. Morales, E.A. and M. Potapova, 2000. Third NAWQA workshop on harmonization of algal taxonomy, May 2000. Report No. 00-8. Patrick Center for Environmental Research, Academy of Natural Sciences, Philadelphia, PA. 52 pp. Van Dam, H., A. Mertens, and J Sinkeldam, 1994. A coded checklist and ecological indicator values of freshwater diatoms from the Netherlands. Netherlands Journal of Aquatic Ecology 28(1) 117-133.