Integrated Resource Plan - S.C. Energy Office
112
Integrated Resource Plan 2021‐2040
Transcript of Integrated Resource Plan - S.C. Energy Office
Integrated Resource Plan 2021‐2040

Page | 2
In accordance with the amendment of The South
Carolina Code of Laws, 1976, section 58‐37‐40 to
include electric cooperatives, Central Electric
Power Cooperative Inc. (Central) is submitting
its Integrated Resource Plan to the South
Carolina State Energy Office on behalf of itself
and the 20 South Carolina distribution electric
cooperatives. The IRP’s development included a
planning process that was begun in 2019.
Central will complete this process every three
years, with a review and update in the off years.

Page | 3
Contents
1 Executive Summary ............................................................................................................................... 6
1.1 Central Electric Power Cooperative, Inc. ...................................................................................... 7
1.2 Cooperative Business Model......................................................................................................... 8
1.3 Cooperative Principles .................................................................................................................. 9
1.4 Central’s Member‐Cooperatives ................................................................................................. 10
2 South Carolina Electric Cooperative Service Territories ..................................................................... 12
2.1 Purpose of the Integrated Resource Plan ................................................................................... 15
3 Existing Resources ............................................................................................................................... 16
3.1 Santee Cooper ............................................................................................................................. 17
3.2 Duke Energy Carolinas, LLC ......................................................................................................... 20
3.3 Southeastern Power Administration .......................................................................................... 21
3.4 Renewables – Community Solar, Horry County Schools, Savion QF, Volvo Solar....................... 22
3.5 Diesel Generators........................................................................................................................ 24
3.6 Central’s Energy Mix ................................................................................................................... 25
4 Demand‐Side Management ................................................................................................................ 27
4.1 Existing DSM Resources .............................................................................................................. 28
4.1.1 Future Projections for Existing Programs ........................................................................... 29
4.2 Incremental DSM Modeling ........................................................................................................ 31
4.2.1 Economic Modeling Framework ......................................................................................... 31
4.2.2 Sensitivities ......................................................................................................................... 33
4.2.3 Overview of New Program Archetypes ............................................................................... 34
4.2.4 Business as Usual Funding Allocation ................................................................................. 38
4.2.5 Business as Usual Results .................................................................................................... 38
4.3 Aggressive DSM Scenario ............................................................................................................ 43
4.3.1 Funding Assumptions .......................................................................................................... 43
4.3.2 Aggressive Scenario Results ................................................................................................ 43
5 Load Forecast ...................................................................................................................................... 49
5.1 Methodology ............................................................................................................................... 50
5.2 Base Load Forecast ..................................................................................................................... 51
5.2.1 Member‐Owner Forecasts .................................................................................................. 53
Page | 4
5.2.2 Central Demand and Energy Forecast ................................................................................ 54
5.2.3 DSM and Energy Efficiency in the Base Forecast ................................................................ 54
5.2.4 Load Duration Curves .......................................................................................................... 55
5.3 Load Forecast Scenarios .............................................................................................................. 56
5.3.1 DSM Penetration Scenarios ................................................................................................ 60
5.3.2 Renewable and Cogeneration Penetration Scenarios ........................................................ 60
6 Resource Plan ...................................................................................................................................... 61
6.1 Southeast Regional Transmission Organization Potential .......................................................... 63
6.2 Reliability Considerations ............................................................................................................ 64
6.2.1 Planning Reserve Margin .................................................................................................... 64
6.2.2 Effective Load Carrying Capability ...................................................................................... 64
6.2.3 Probabilistic Loss of Load .................................................................................................... 64
6.2.4 IRP Reserve Margin ............................................................................................................. 65
6.3 Santee Cooper Balancing Authority ............................................................................................ 66
6.4 Duke Balancing Authority ........................................................................................................... 67
6.5 Central Resource Planning Process ............................................................................................. 68
6.6 Study Inputs and Assumptions .................................................................................................... 69
6.6.1 Technical Assessment of New Generation Resources ........................................................ 69
6.6.2 Thermal Technology ............................................................................................................ 69
6.6.3 Peaking Technology ............................................................................................................ 69
6.6.4 Combined Cycle Technology ............................................................................................... 70
6.6.5 Renewable Technology ....................................................................................................... 71
6.6.6 Power Purchase Agreements (PPAs) ................................................................................... 74
6.6.7 Electric Transmission Investments ...................................................................................... 75
6.6.8 Load ..................................................................................................................................... 75
6.6.9 Fuel ...................................................................................................................................... 77
6.6.10 Renewables Integration ...................................................................................................... 78
6.6.11 Demand‐Side Management ................................................................................................ 79
6.6.12 Carbon Policy ...................................................................................................................... 80
6.6.13 Financial Assumptions ......................................................................................................... 80
6.7 Capacity Expansion Modeling ..................................................................................................... 81

Page | 5
6.7.1 Expansion Strategies ........................................................................................................... 82
6.7.2 Expansion Strategies Modeled with Base Input Assumptions ............................................ 83
6.7.3 Scenario Analysis ................................................................................................................. 85
6.7.4 Custom Portfolios ................................................................................................................ 85
6.8 Portfolio Screening ...................................................................................................................... 85
6.9 Production Cost Modeling .......................................................................................................... 86
6.9.1 Sensitivity Analysis .............................................................................................................. 86
6.9.2 Top 10 Portfolios Selection & Review ................................................................................. 86
7 Conclusion ........................................................................................................................................... 89
8 Appendices .......................................................................................................................................... 92
A. Glossary of Acronyms ......................................................................................................................... 94
B. Existing Resources ............................................................................................................................... 96
C. Balance of Loads and Resources (BLR) ................................................................................................ 97
D. Community Causes ............................................................................................................................. 99

Page | 6
1 Executive Summary

Page | 7
1 Executive Summary
1.1 Central Electric Power Cooperative, Inc.
Central Electric Power Cooperative, Inc. (Central) is a wholesale electric generation and transmission
cooperative (G&T) headquartered in Columbia, South Carolina. Central is owned by the 20 independent,
consumer‐owned South Carolina distribution electric cooperatives, referred to in this document as
member‐cooperatives. These member‐cooperatives provide retail electric service to their member‐
owners, located in every county in the State of South Carolina. Central is an IRS Section 501(c)(12) tax‐
exempt organization that operates on a not‐for‐profit, cost‐of‐service basis with the sole purpose of
benefiting its member‐cooperatives. The core services provided by Central for its member‐cooperatives
are power supply, transmission, economic development, member and energy services, and finance and
billing services.
Central was formed in 1948 by seven South Carolina distribution cooperatives with the purpose of
providing wholesale power and transmission aggregation by pooling resources to meet the needs of the
cooperatives in a reliable and cost‐effective manner. Today, Central and its member‐cooperatives own
transmission and distribution facilities in all 46 counties in South Carolina, serving electricity to about one‐
third of the state’s population. Central’s member‐cooperatives serve over 820,000 meters and more than
1.5 million residents over 76,000 miles of power lines covering 70% of South Carolina. Currently, Central
provides wholesale power to its member‐cooperatives largely through long‐term power purchase
contracts with the South Carolina Public Service Authority (Santee Cooper), Duke Energy Carolinas LLC
(Duke), and the Southeastern Power Administration (SEPA). In 2018, approximately 60% of member‐
cooperatives’ energy needs were met by zero or reduced carbon‐emitting resources. The graph below
shows the energy mix that Central supplied in 2018.
Figure 1.1: 2018 Central’s Resource Mix

Page | 8
1.2 Cooperative Business Model
In the 1930s, electricity was only available in larger cities and along major transportation routes, leaving
90% of rural homes without electricity. Electric cooperatives were formed by citizens across the U.S. to
make electricity available in rural areas and small towns. The organizations were structured as member‐
owned and not‐for‐profit businesses. These electric cooperatives filled the void in rural areas where for‐
profit electric companies were historically reluctant to serve because it was not profitable to serve areas
with only a few customers per line mile. Rather than maximizing shareholder value, the primary goal of
investor‐owned companies, service is the main priority for electric cooperatives because the member‐
owners are also the users of the product. Every member‐owner has the right to participate in the policy‐
making process by voting on cooperative bylaws and electing members of the governing board.
Nationwide, electric cooperatives power over 20 million businesses, homes, schools and farms across 56%
of the country’s landmass, while serving over 42 million people.
As a cooperative, Central is also owned by its members, which are cooperatives themselves. Central does
not provide services to retail consumers. This structure is common across the 900 American distribution
electric cooperatives and 60‐plus generation and transmission cooperatives.
Central and its member‐cooperatives are not‐for‐profit corporations and are granted federal tax‐exempt
status provided that 85% or more of their annual revenues are derived from serving member‐owners.
Central and its member‐cooperatives strive to operate at cost but must accumulate capital to build and
maintain the electrical system’s infrastructure and facilities and to provide other services. All amounts
received from member‐owners in excess of operating costs and expenses are considered patronage
capital and are allocated to each member‐owner on a cost‐of‐service basis. Patronage capital is returned
to member‐owners in accordance with the cooperative’s needs and policies.
Central and its member‐cooperatives have access to loans at favorable interest rates through the lending
programs of an agency of the U. S. Department of Agriculture — the Rural Utilities Service (RUS). RUS
loans help finance the large projects that are necessary to maintain and expand the electric generation,
transmission and distribution systems. Access to these loan programs significantly enhance the ability to
provide affordable electric service to South Carolina consumers. Central and its member‐cooperatives also
rely on private‐sector sources of financing such as CoBank and the National Rural Utilities Cooperative
Finance Corporation.
The homes and businesses powered by Central’s member‐cooperatives are spread across the state, often
in rural areas far from the network transmission lines operated by the local balancing authority. A
balancing authority (BA) is an entity that has a legal responsibility for balancing load and generation within
an assigned geographic territory, or its balancing authority area (BAA). Central’s member‐cooperatives
are included in the BAAs of Santee Cooper, Duke, and Dominion Energy South Carolina. Central builds
transmission lines to connect the substations serving member‐cooperatives to the network transmission
systems. The economies of scale provided by Central enhance its member‐cooperatives’ ability to build
their systems efficiently while minimizing costs. The transmissions lines that Central builds are referred to
as “radial lines” because they connect local substations to the network transmission grid. Central does
not own, operate or maintain network transmission lines, nor does Central provide balancing services.
Central’s board approves construction workplans, which identify all needed radial transmission
Page | 9
investments. The current board‐approved transmission construction work plan for the 2019‐2022 period
includes 35 projects with a projected budget of $163.5 million.
1.3 Cooperative Principles
The Seven Cooperative Principles, recognized by cooperatives worldwide, provide philosophical guidance
to organizations that are organized as cooperatives.
Open and Voluntary Membership
Democratic Member Control
Members’ Economic Participation
Autonomy and Independence
Education, Training and Information
Cooperation Among Cooperatives
Concern for Community
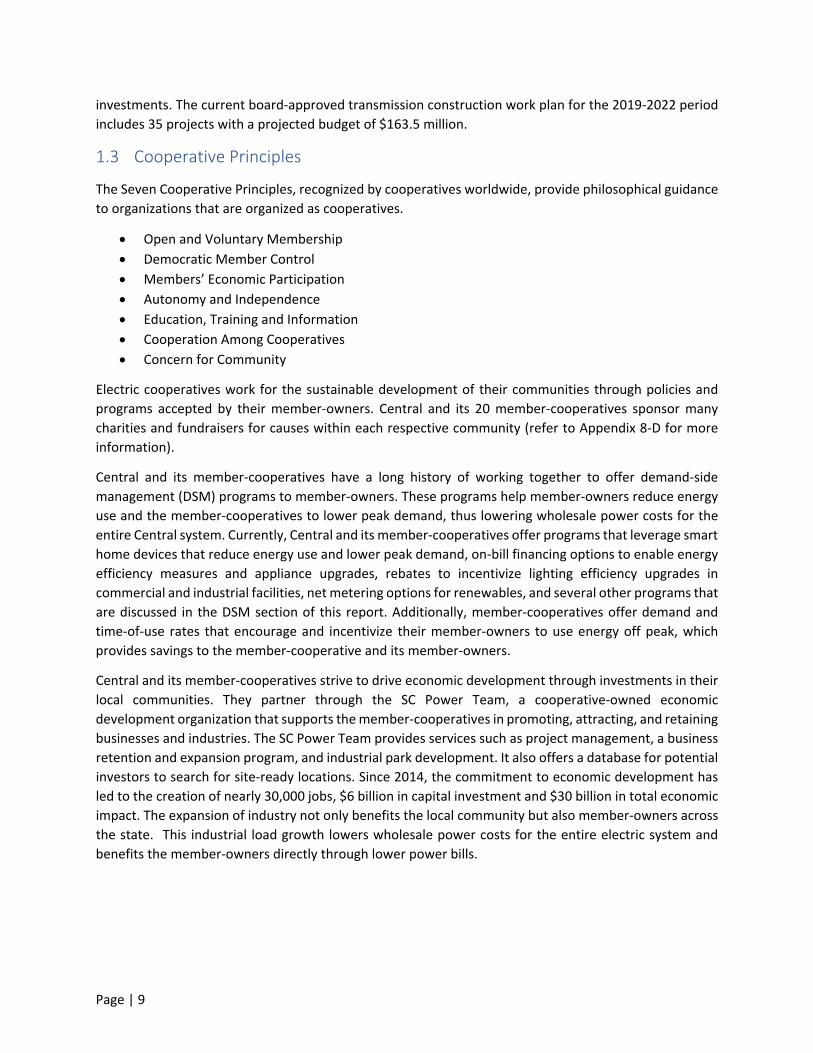
Electric cooperatives work for the sustainable development of their communities through policies and
programs accepted by their member‐owners. Central and its 20 member‐cooperatives sponsor many
charities and fundraisers for causes within each respective community (refer to Appendix 8‐D for more
information).
Central and its member‐cooperatives have a long history of working together to offer demand‐side
management (DSM) programs to member‐owners. These programs help member‐owners reduce energy
use and the member‐cooperatives to lower peak demand, thus lowering wholesale power costs for the
entire Central system. Currently, Central and its member‐cooperatives offer programs that leverage smart
home devices that reduce energy use and lower peak demand, on‐bill financing options to enable energy
efficiency measures and appliance upgrades, rebates to incentivize lighting efficiency upgrades in
commercial and industrial facilities, net metering options for renewables, and several other programs that
are discussed in the DSM section of this report. Additionally, member‐cooperatives offer demand and
time‐of‐use rates that encourage and incentivize their member‐owners to use energy off peak, which
provides savings to the member‐cooperative and its member‐owners.
Central and its member‐cooperatives strive to drive economic development through investments in their
local communities. They partner through the SC Power Team, a cooperative‐owned economic
development organization that supports the member‐cooperatives in promoting, attracting, and retaining
businesses and industries. The SC Power Team provides services such as project management, a business
retention and expansion program, and industrial park development. It also offers a database for potential
investors to search for site‐ready locations. Since 2014, the commitment to economic development has
led to the creation of nearly 30,000 jobs, $6 billion in capital investment and $30 billion in total economic
impact. The expansion of industry not only benefits the local community but also member‐owners across
the state. This industrial load growth lowers wholesale power costs for the entire electric system and
benefits the member‐owners directly through lower power bills.

Page | 10
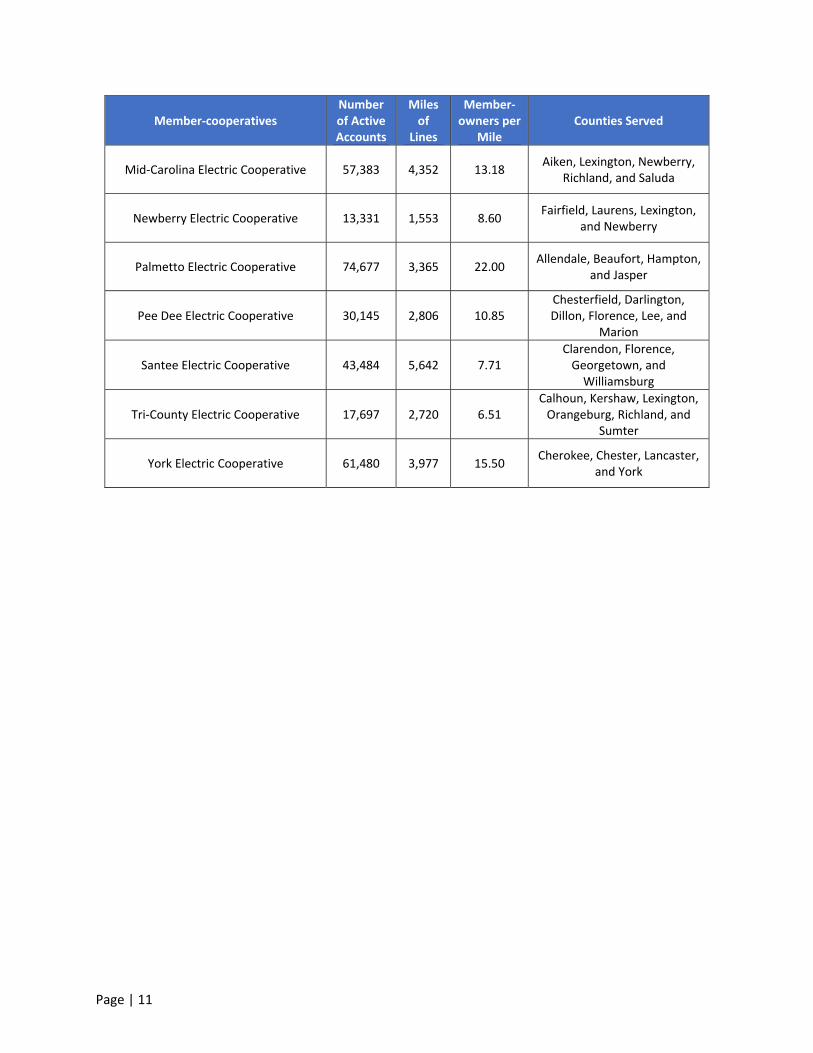
1.4 Central’s Member‐Cooperatives
Member‐cooperatives Number of Active Accounts
Miles of
Lines
Member‐owners per
Mile Counties Served
Aiken Electric Cooperative 48,359 5,541 8.73
Aiken, Barnwell, Calhoun, Edgefield, Greenwood, Lexington, McCormick, Orangeburg, Saluda
Berkeley Electric Cooperative 108,998 5,934 18.40 Berkeley, Dorchester, and
Charleston
Black River Electric Cooperative 33,517 3,992 8.40 Clarendon, Kershaw, Lee, and
Sumter
Blue Ridge Electric Cooperative 67,712 7,110 9.52 Anderson, Greenville, Oconee,
Pickens, and Spartanburg
Broad River Electric Cooperative 22,241 2,662 8.35
Cherokee, Newberry, Spartanburg and Union, SC
Cleveland, Polk and Rutherfordton, NC
Coastal Electric Cooperative 11,683 1,727 6.76 Bamberg, Colleton, and
Dorchester
Edisto Electric Cooperative 20,308 3,615 5.60
Allendale, Bamberg, Barnwell, Berkeley, Colleton,
Dorchester, Hampton, and Orangeburg
Fairfield Electric Cooperative 30,081 3,441 8.74 Fairfield, Chester, Kershaw,
Richland, and York
Horry Electric Cooperative 81,919 5,375 15.20 Horry
Laurens Electric Cooperative 59,031 6,747 8.70
Abbeville, Anderson, Greenville, Laurens,
Newberry, Spartanburg, and Union
Little River Electric Cooperative 14,347 2,096 6.84 Abbeville, Anderson,
Greenwood and McCormick
Lynches River Electric Cooperative 21,301 2,900 7.30 Chesterfield, Kershaw, and
Lancaster
Marlboro Electric Cooperative 6,474 1,088 6.00 Marlboro and Dillon
Page | 11
Member‐cooperatives Number of Active Accounts
Miles of
Lines
Member‐owners per
Mile Counties Served
Mid‐Carolina Electric Cooperative 57,383 4,352 13.18 Aiken, Lexington, Newberry,
Richland, and Saluda
Newberry Electric Cooperative 13,331 1,553 8.60 Fairfield, Laurens, Lexington,
and Newberry
Palmetto Electric Cooperative 74,677 3,365 22.00 Allendale, Beaufort, Hampton,
and Jasper
Pee Dee Electric Cooperative 30,145 2,806 10.85 Chesterfield, Darlington, Dillon, Florence, Lee, and
Marion
Santee Electric Cooperative 43,484 5,642 7.71 Clarendon, Florence, Georgetown, and Williamsburg
Tri‐County Electric Cooperative 17,697 2,720 6.51 Calhoun, Kershaw, Lexington, Orangeburg, Richland, and
Sumter
York Electric Cooperative 61,480 3,977 15.50 Cherokee, Chester, Lancaster,
and York

Page | 12
2 South Carolina
Electric Cooperative
Service Territories

Page | 13
2 South Carolina Electric Cooperative Service Territories
Individual Electric Cooperative Territories
Page | 14
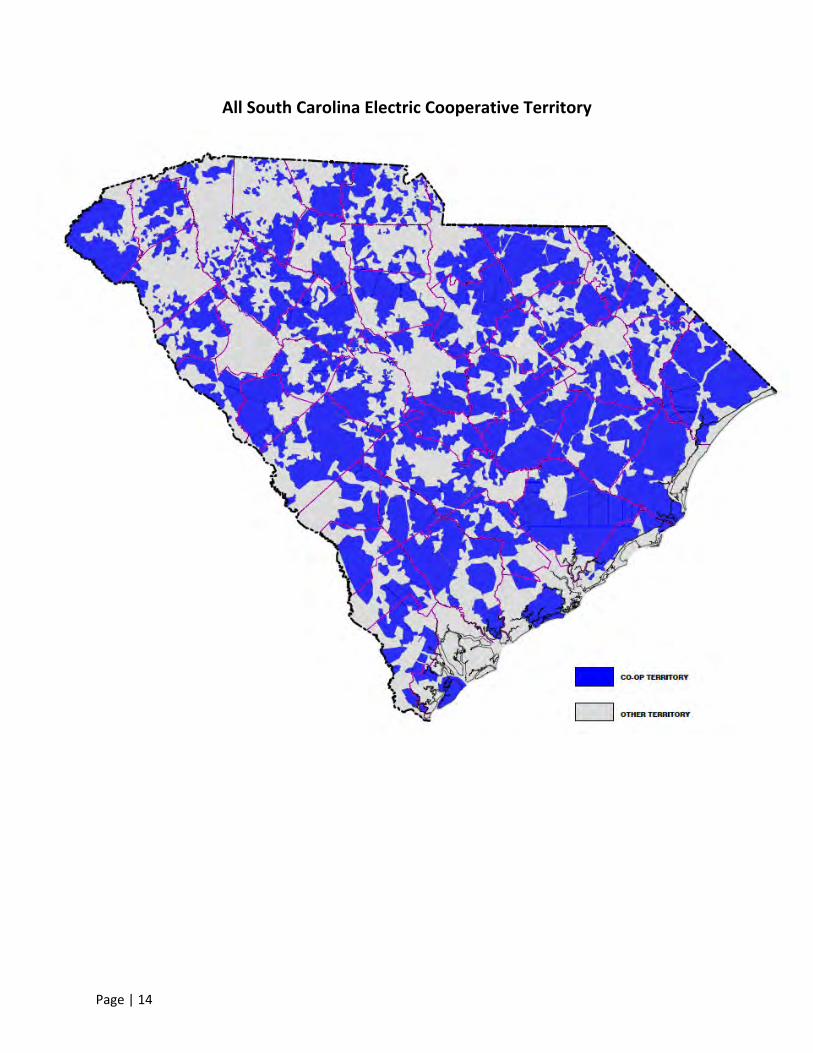
All South Carolina Electric Cooperative Territory

Page | 15
2.1 Purpose of the Integrated Resource Plan
Resource planning is an ongoing process at Central and is one of the core responsibilities of the power
supply department. By design, Central’s integrated resource plan (IRP) is detailed and outlines how Central
can meet its long‐term forecasted energy consumption and peak demand through a combination of
supply‐side and demand‐side resources. The planning period for Central’s IRP is January 1, 2021 –
December 31, 2040.
This report provides a comprehensive view of Central’s vision, initiatives, and future resource plan to serve
the current and growing needs of its member‐cooperatives. The IRP is intended to be a working document,
used to both guide and communicate Central’s long‐term power supply and infrastructure investment
decisions. The plan embodies the commitment to Central’s member‐cooperatives to provide reliable
power supply in a cost‐effective manner.
The provided analysis supporting the plan helps Central, its member‐cooperatives, and their member‐
owners understand the effect of both near‐term and long‐term resource decisions on member‐owner bills
and the future reliability of the electric service. Resource planning at Central is a collaborative process
among Central and its member‐cooperatives. This IRP will not select a specific resource plan for
implementation. It will instead serve as a roadmap, assisting Central, its member‐cooperatives, and their
member‐owners as Central moves into the next phase of resource plan development. The Central team
has examined various reasonable scenarios to determine a series of resource portfolios designed to
minimize both cost and risk.
Page | 16
3 Existing Resources

Page | 17
3 Existing Resources
Central provides wholesale power to its member‐cooperatives primarily through a portfolio of contracts.
The two primary contracts are with the South Carolina Public Service Authority, a state‐owned utility
known as Santee Cooper, and Duke Energy Carolinas, LLC (Duke), a subsidiary of Duke Energy Corporation.
Central’s remaining power‐supply resources supplement these contracts. These supplemental resources
include backup generators and renewable resources such as solar and hydroelectricity. Central’s member‐
cooperatives receive hydroelectric capacity and energy from the Southeastern Power Administration
(SEPA), an entity of the federal government. Central aggregates the power provided under these various
contracts to supply the needs of its member‐cooperatives. Wholesale costs are aggregated, and each
member‐cooperative pays the same posted wholesale power rates. Member‐cooperatives’ wholesale
costs will vary based on their size and member composition. Central manages these contracts with the
objective of providing reliable power at the lowest possible price.
Central’s contract with Santee Cooper is commonly called the Coordination Agreement, which is an all‐
requirements contract. Approximately 76% of the electricity provided by Central to its member‐
cooperatives flows through the Coordination Agreement. SEPA provides 2% of electricity and the
remaining 22% is served by Duke Energy Carolinas. The contract with Duke is referred to as the Duke
Power Purchase Agreement (PPA). The Duke PPA is an all‐requirements contract for member‐cooperative
load in Duke’s BAA. An all‐requirements contract requires the provider to supply the purchaser with all
the purchaser’s energy needs up to the level of reliability specified in the agreement.
3.1 Santee Cooper
The Coordination Agreement is a “bundled” contract for both generation and transmission service
provided by Santee Cooper to Central with a contract end date of 2058. This “bundling” of service is
allowed due to Santee Cooper’s non‐jurisdictional status at the Federal Energy Regulatory Commission
(FERC) and the fact that amendments to the long‐standing Coordination Agreement have not frustrated
this legacy treatment, which is beneficial to both Central and Santee Cooper. Central accounts for more
than 72% of Santee Cooper’s firm demands. Central accounted for approximately 65% of Santee Cooper’s
energy sales in 2018.

Page | 18
Figure 3‐1 illustrates Santee Cooper energy sales by ratepayer class.
Figure 3-1: 2018 Santee Cooper Energy Sales by Ratepayer Class1
Due to Central’s significant share of Santee Cooper’s total business, the Coordination Agreement gives
Central contractual rights related to resource planning and access to information regarding system
operations and fuel purchasing well beyond what is customary in a traditional long term PPA. There are
various joint committees between Central and Santee Cooper such as the Joint Planning Committee and
the Joint Operating Committee. These committees review and vote on critical matters such as system
operations to ensure the combined Central/Santee Cooper system is being planned and operated in a
manner consistent with good utility practice.
The Coordination Agreement outlines the generation expansion process. Santee Cooper must engage
Central throughout the process of creating potential expansion proposals, and Central must opt in to any
proposed generation resource; otherwise, Santee Cooper cannot collect capital costs related to the
proposed resource in their charges to Central. If Central opts out of Santee Cooper’s proposed resource,
then Central must secure its own resource for its own pro‐rata share of the system shortfall. Central can
accomplish this requirement by purchasing capacity from the market, moving load to another regional
utility, building new generating units, implementing demand‐side management and energy efficiency
programs, or some combination thereof.
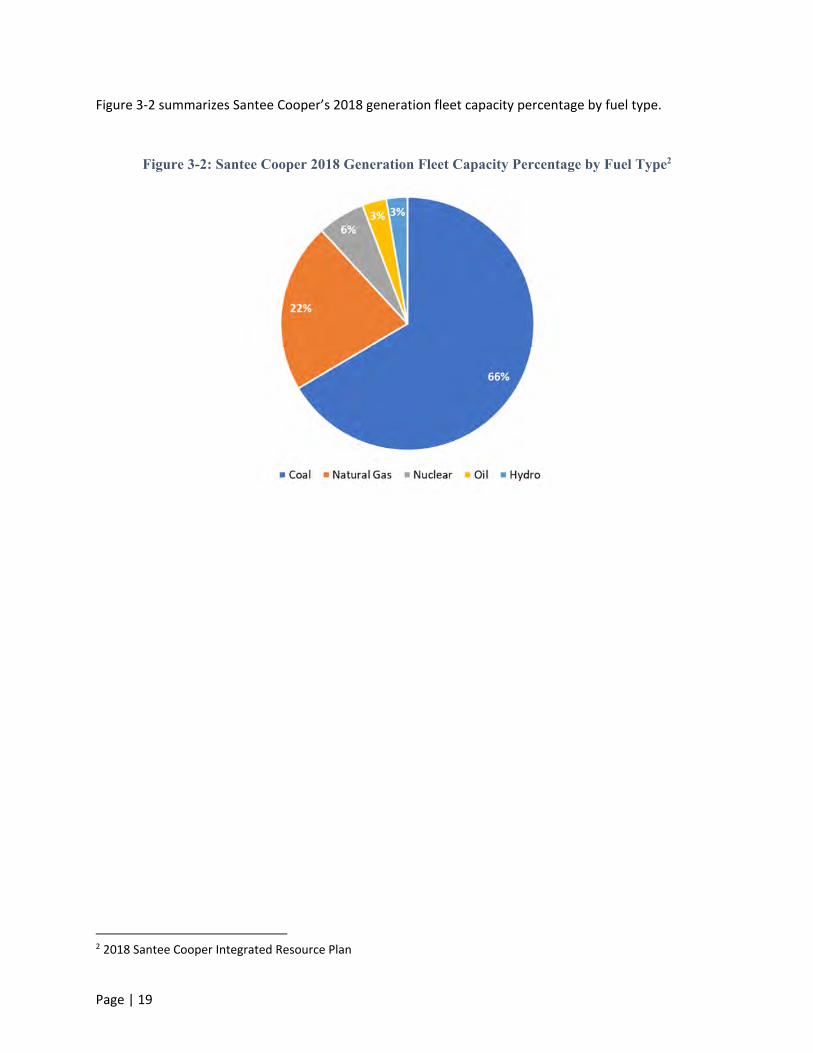
Santee Cooper’s current generation fleet has a mix of coal, nuclear, hydro, and natural gas plants, but the
generation fleet is primarily coal‐based.
1 2018 Santee Cooper Fingertip Facts. Santee Cooper serves four wholesale customers, with Central being the purchaser of almost all of Santee Cooper’s wholesale energy.
65%
18%
17%
Wholesale Military & Large Industrial Residential & Commercial
Page | 19
Figure 3‐2 summarizes Santee Cooper’s 2018 generation fleet capacity percentage by fuel type.
Figure 3-2: Santee Cooper 2018 Generation Fleet Capacity Percentage by Fuel Type2
2 2018 Santee Cooper Integrated Resource Plan
Page | 20
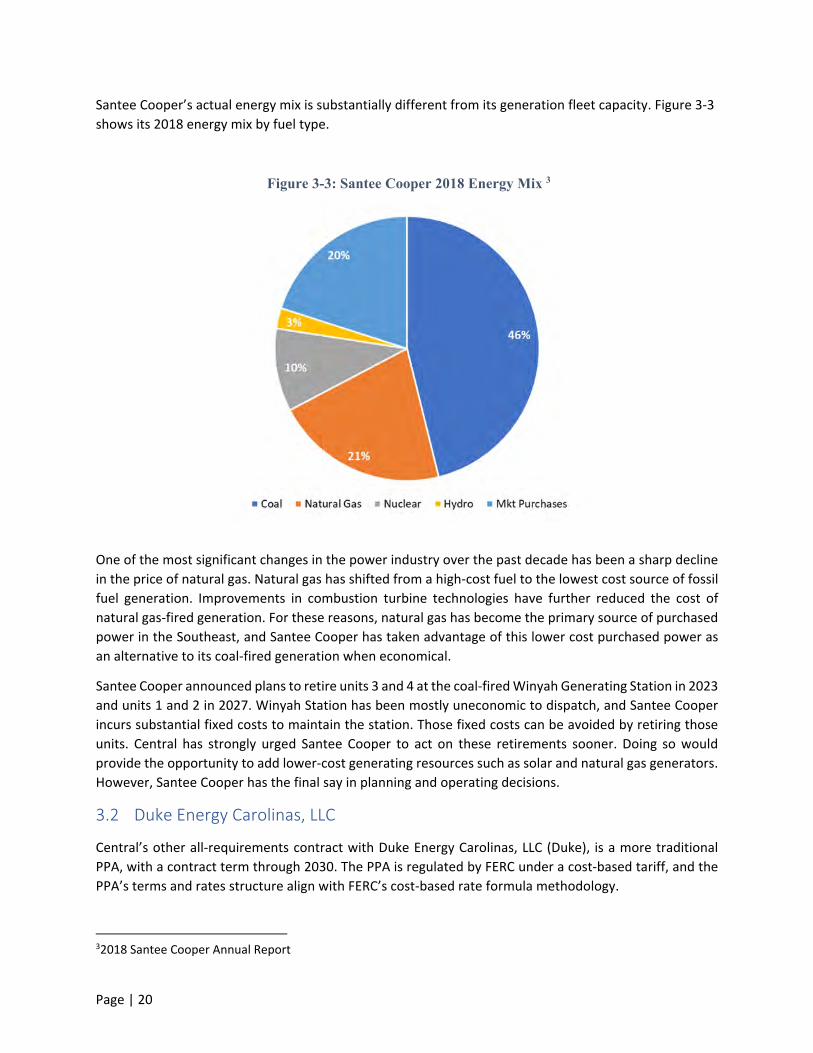
Santee Cooper’s actual energy mix is substantially different from its generation fleet capacity. Figure 3‐3
shows its 2018 energy mix by fuel type.
Figure 3-3: Santee Cooper 2018 Energy Mix 3
One of the most significant changes in the power industry over the past decade has been a sharp decline
in the price of natural gas. Natural gas has shifted from a high‐cost fuel to the lowest cost source of fossil
fuel generation. Improvements in combustion turbine technologies have further reduced the cost of
natural gas‐fired generation. For these reasons, natural gas has become the primary source of purchased
power in the Southeast, and Santee Cooper has taken advantage of this lower cost purchased power as
an alternative to its coal‐fired generation when economical.
Santee Cooper announced plans to retire units 3 and 4 at the coal‐fired Winyah Generating Station in 2023
and units 1 and 2 in 2027. Winyah Station has been mostly uneconomic to dispatch, and Santee Cooper
incurs substantial fixed costs to maintain the station. Those fixed costs can be avoided by retiring those
units. Central has strongly urged Santee Cooper to act on these retirements sooner. Doing so would
provide the opportunity to add lower‐cost generating resources such as solar and natural gas generators.
However, Santee Cooper has the final say in planning and operating decisions.
3.2 Duke Energy Carolinas, LLC
Central’s other all‐requirements contract with Duke Energy Carolinas, LLC (Duke), is a more traditional
PPA, with a contract term through 2030. The PPA is regulated by FERC under a cost‐based tariff, and the
PPA’s terms and rates structure align with FERC’s cost‐based rate formula methodology.
32018 Santee Cooper Annual Report

Page | 21
Central has also contracted for a Network Integration Transmission Service Agreement (NITSA) with Duke.
The NITSA requires Duke to serve all Central delivery points connected to Duke’s transmission system as
network load, with no adverse distinction between Central’s delivery points and Duke’s retail loads. The
term of the NITSA remains in effect for as long as Duke provides transmission services as a balancing
authority and is independent of the PPA term. If Central does not extend the PPA by 2025, then it will
begin ramping down. One third of Central’s load currently served by Duke would transition out of the PPA
in January 2029, followed by another third in January 2030, with the contract terminated at the end of
2030.
Duke relies heavily on nuclear generation, which accounts for 44% of the energy it produces. In recent
years, Duke has retired coal generation and replaced it with natural gas generation, renewable generation,
and market purchases. Duke has steadily added solar generation to its system. Market purchases include
PPAs with third party solar developers.
Figure 3-4: Duke Energy Carolinas 2018 Generation Mix by Fuel Type4
Duke Energy Carolinas and Duke Energy Progress have enacted a joint dispatch agreement to jointly use
their combined generating fleets to serve their loads. This agreement allows for the non‐firm exchange of
energy between both companies. The more efficient generation dispatch also benefits Central by
minimizing fuel cost.
3.3 Southeastern Power Administration
SEPA is a federal power marketing administrator that provides power from hydroelectric dams on the
Thurmond, Russell, and Hartwell reservoirs operated by the U. S. Army Corps of Engineers on the
Savannah River. The power is sold to electric cooperatives and municipal utilities in the Southeast,
4 2018 Duke Energy Carolinas FERC Form 1
23%
44%
5%
13%
4%
11%
Coal Nuclear Hydro Natural Gas Renewables Mkt Purchases

Page | 22
including all 20 of Central’s member‐cooperatives. This low‐cost power source reduces member‐
cooperative costs and lessens Central’s capacity and energy requirements from Duke and Santee Cooper.
SEPA’s power belongs to the member‐cooperatives, and SEPA is obligated to provide capacity to member‐
cooperatives. That capacity is referred to as each cooperative’s SEPA allocation; however, the PPAs are
contracted directly between SEPA and Central. Central acts as the member‐cooperatives’ agent, managing
the contracts and ensuring that the power benefits the member‐cooperatives. SEPA’s costs are directly
passed through to each member‐cooperative based on its SEPA allocation. SEPA currently supplies 200
MW of capacity and associated energy monthly to Central member‐cooperatives.
3.4 Renewables – Community Solar, Horry County Schools, Savion QF, Volvo Solar
Central’s PPAs with Santee Cooper and Duke include limitations on the ability of Central and its member‐
cooperatives to build renewable generation without incurring penalties. Central and its member‐
cooperatives are assisting commercial, industrial and residential member‐owners throughout the state to
access renewable options that meet their needs and benefit the system while minimizing any penalties
assessed to Central.
Under the Public Utility Regulatory Policies Act (PURPA) of 1978, Central and other utilities must contract
with a third‐party renewable developer if its project meets the PURPA criteria to be a Qualified Facility
(QF) and if its offer price is less than or equal to the utility’s avoided energy cost. This avoided energy cost
is specific to each utility but represents the production costs a utility avoids by purchasing energy from
the QF provider. Both Santee Cooper’s and Duke’s contracts with Central acknowledge and account for
PURPA‐required purchases. Central can transact with these PURPA suppliers, and it can reduce its energy
purchases from Santee Cooper and Duke without financial penalties. PURPA law supersedes Central
contract limits. If the renewable energy comes from a QF, Central will not be penalized by its power
providers for having excess generation.
While solar power provides valuable low‐cost energy to Central’s member‐cooperatives, its inherently
intermittent production profile prevents it from significantly reducing Central’s capacity purchases. The
winter peak occurs early in the morning when solar irradiance is low, so solar production would be
minimal at the time of the winter peak. Solar facilities typically are producing during summer peak hours,
but Central’s summer peak typically occurs as the sun is beginning to set, reducing the capacity value of
solar generating facilities.
Below are details of the current and upcoming renewable projects Central and its member‐cooperatives
have in their resource mix:
Savion Solar Qualified Facility
The Savion QF projects will consist of two 75 MW (AC) solar sites located in Orangeburg County, and
Central will purchase the energy from those sites once they are completed in 2023. Once operational the
sites will be capable of producing approximately 250,000 MWh of energy annually. Both sites qualify as
PURPA facilities. Utilities must allow access to their transmission system for these QFs. While the Savion
sites will produce energy during Central’s summer peak period, they will be producing well below their
daily peak generation.

Page | 23
Volvo Solar
As a partial solution to Volvo’s corporate goals to procure carbon‐free energy for its production facilities,
Central has executed a PPA with a solar developer for the output of a project located at Volvo’s
manufacturing site. These solar arrays have a cumulative nameplate capacity of 6.5 MW (AC) and became
operational in March 2020. Volvo is one of the many cooperative member‐owners with sustainability
goals, and Central is working with its member‐cooperatives to help these member‐owners achieve their
goals.
Horry County School Solar
Horry Electric Cooperative serves two schools in Horry County with fixed rooftop solar installations that
were energized in 2018. Both sites have a combined total of 860 kW (AC) of solar nameplate capacity.
Central purchases one‐half of the St. James Intermediate and Socastee Elementary schools’ generation
through a PPA. The remaining generation can be used by the schools to serve their loads, or they can sell
a portion of panels’ generation back to Horry Electric. Horry Electric compensates those schools with a
net metering billing credit, which reduces the schools’ monthly electric bill.
Community Solar
Central’s board authorized the construction for up to 5 MW (AC) of community solar available to all of
Central’s member‐cooperatives. Construction on these sites began in 2016, and they are a mixture of
ground‐mount and canopy configurations. These sites are either owned by Central’s member‐
cooperatives or Central has PPAs with third party solar developers to purchase the energy output.
Currently 18 member‐cooperatives have access to community solar.
Community solar allows Central’s member‐cooperatives to offer their member‐owners the opportunity
to support renewable generation development without the requirement to install those resources on
their homes or property. Member‐cooperatives can lease the panels to their member‐owners. This opens
access to solar energy for renters and mobile homeowners, who would not be able to access solar energy
under a rooftop ownership business model.
In total, the sites have generated 18 gigawatt‐hours (GWh) of energy since 2016, which would equal the
production needed to fully supply 15,000 homes with solar energy. By the end of 2020, 4.2 MW (AC) will
be online.
Page | 24
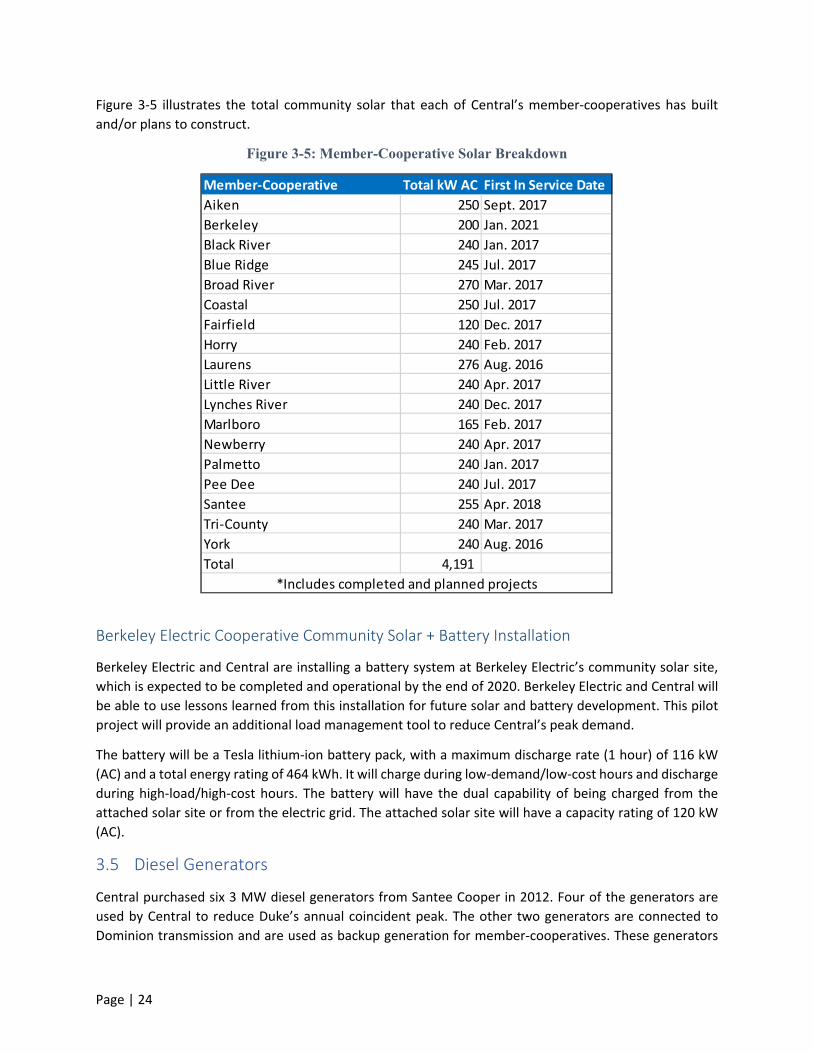
Figure 3‐5 illustrates the total community solar that each of Central’s member‐cooperatives has built
and/or plans to construct.
Figure 3-5: Member-Cooperative Solar Breakdown
Berkeley Electric Cooperative Community Solar + Battery Installation
Berkeley Electric and Central are installing a battery system at Berkeley Electric’s community solar site,
which is expected to be completed and operational by the end of 2020. Berkeley Electric and Central will
be able to use lessons learned from this installation for future solar and battery development. This pilot
project will provide an additional load management tool to reduce Central’s peak demand.
The battery will be a Tesla lithium‐ion battery pack, with a maximum discharge rate (1 hour) of 116 kW
(AC) and a total energy rating of 464 kWh. It will charge during low‐demand/low‐cost hours and discharge
during high‐load/high‐cost hours. The battery will have the dual capability of being charged from the
attached solar site or from the electric grid. The attached solar site will have a capacity rating of 120 kW
(AC).
3.5 Diesel Generators
Central purchased six 3 MW diesel generators from Santee Cooper in 2012. Four of the generators are
used by Central to reduce Duke’s annual coincident peak. The other two generators are connected to
Dominion transmission and are used as backup generation for member‐cooperatives. These generators
Member‐Cooperative Total kW AC First In Service Date
Aiken 250 Sept. 2017
Berkeley 200 Jan. 2021
Black River 240 Jan. 2017
Blue Ridge 245 Jul. 2017
Broad River 270 Mar. 2017
Coastal 250 Jul. 2017
Fairfield 120 Dec. 2017
Horry 240 Feb. 2017
Laurens 276 Aug. 2016
Little River 240 Apr. 2017
Lynches River 240 Dec. 2017
Marlboro 165 Feb. 2017
Newberry 240 Apr. 2017
Palmetto 240 Jan. 2017
Pee Dee 240 Jul. 2017
Santee 255 Apr. 2018
Tri‐County 240 Mar. 2017
York 240 Aug. 2016
Total 4,191
*Includes completed and planned projects
Page | 25
are from the General Motors 645F4B series and were placed into service in 1996. They have undergone
substantial environmental compliance upgrades, meet current environmental emission standards, and
are RICE‐NESHAP compliant. Their quick start abilities and high ramp rates make these generators
effective peak‐shaving resources.
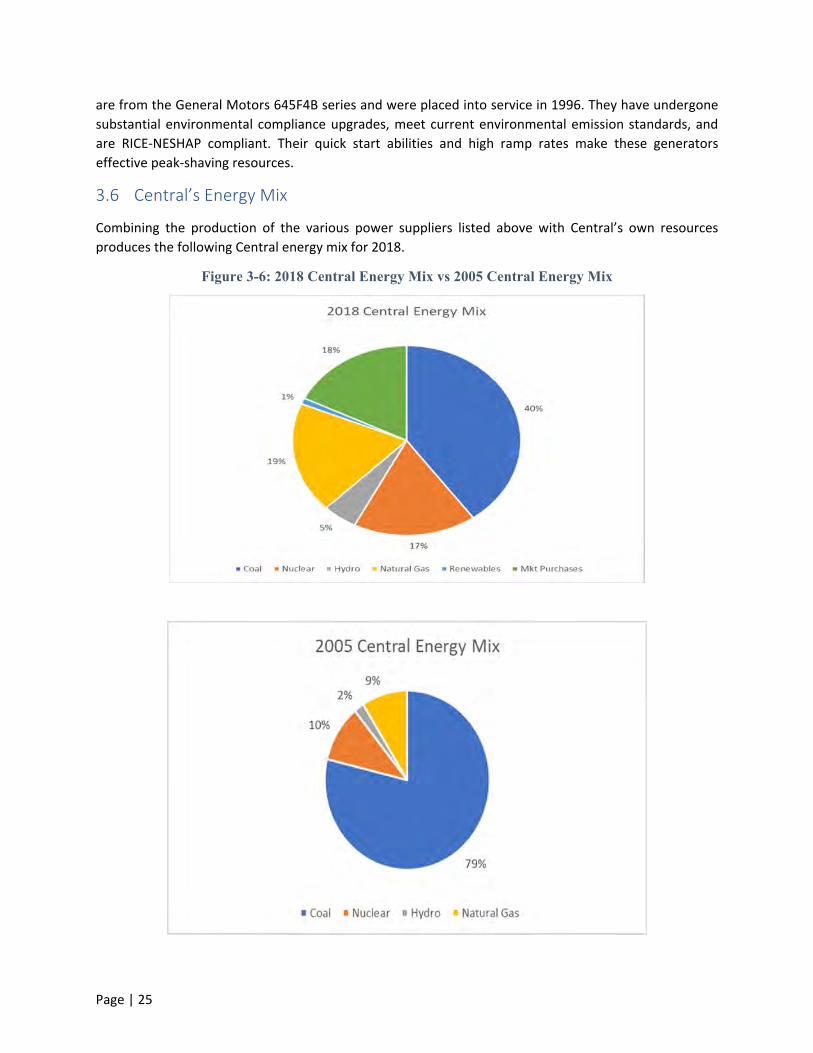
3.6 Central’s Energy Mix
Combining the production of the various power suppliers listed above with Central’s own resources
produces the following Central energy mix for 2018.
Figure 3-6: 2018 Central Energy Mix vs 2005 Central Energy Mix

Page | 26
In 2018, Central’s member‐cooperatives received 40% of their energy from coal‐fired generation, a
reduction by nearly half compared to 2005. Market purchases from other suppliers and natural gas have
displaced coal’s dominant share of power production over time. Central’s coal share of power production
will continue to decrease once Central’s PPAs with Savion become operational in 2023. This solar
production will expand the percentage of renewable energy supplied to Central’s member‐cooperatives.

Page | 27
4 Demand‐Side
Management

Page | 28
4 Demand‐Side Management
Demand‐side management (DSM) is a broad category of resources whereby Central and its member‐
cooperatives encourage member‐owners to modify consumption of electricity either through various
programs or grid‐related projects to reduce capacity and/or energy consumption. For the purposes of this
IRP, Central categorizes four types of DSM programs:
1) Energy Efficiency (EE) – Support of efficient equipment or technology with the objective of
reducing overall energy consumption.
2) Demand Response (DR) – Programs or tariffs designed to reduce consumption of electricity when
the grid is most constrained, or the economic benefits are the greatest. Typically, the objective of
DR programs is to shift load rather than reduce the total amount of consumption.
3) Beneficial Electrification (BE) – Programs or initiatives that encourage member‐owners to
transition energy‐intensive equipment or processes from fossil fuel to electricity. As the electric
grid becomes cleaner, BE measures have the potential to reduce total emissions. If the added load
occurs primarily during off‐peak periods, BE measures can improve system utilization and place
downward pressure on rates.
4) Renewable Energy (RE) – Technologies such as behind‐the‐meter solar photovoltaic arrays reduce
the amount of energy that must be supplied by the utility.
Central and its member‐cooperatives have pursued various DSM strategies since the 1980s and intend to
continue offering member‐owner programs over the planning horizon. The base energy and peak demand
forecasts discussed in Section 5.2 reflect the impacts of current DSM resources so no adjustments to the
load forecast are required. The impact of new DSM programming is not incorporated in the forecast so
the expected impacts of EE and DR need to be subtracted from the base forecasts, while BE impacts need
to be added to the base forecast, as appropriate, to determine the resource requirements of the system
net of projected DSM activity.
Regarding the next three subsections,
Section 4.1 provides an overview of the type and magnitude of existing DSM resources. This
corresponds to a low DSM scenario: given that existing resources are already procured, they
represent a minimum level of resources. This scenario is referred to as “Existing”
Section 4.2 describes the modeling of incremental DSM resources, corresponding to a base or
medium DSM scenario. This scenario is referred to as “Business as Usual”
Section 4.3 explores the impacts of a high DSM scenario where Central and its member‐
cooperatives increase DSM funding compared to historic levels. This scenario is referred to as
“Aggressive”
4.1 Existing DSM Resources
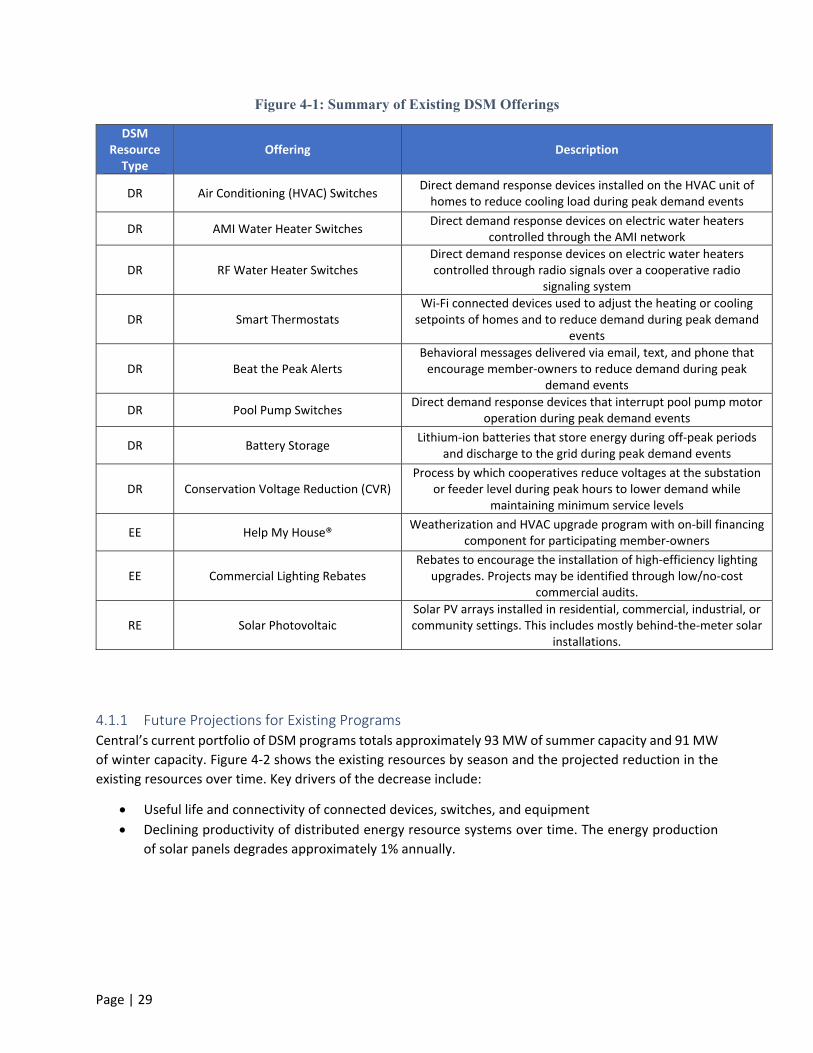
Figure 4‐1 provides a high‐level description of current DSM offerings across the Central system. This list
includes offerings with known levels of participation and documented impacts. Member‐cooperatives
support additional efficiency projects and member services on a case‐by‐case basis.
Page | 29
Figure 4-1: Summary of Existing DSM Offerings
DSM Resource Type
Offering Description
DR Air Conditioning (HVAC) Switches Direct demand response devices installed on the HVAC unit of homes to reduce cooling load during peak demand events
DR AMI Water Heater Switches Direct demand response devices on electric water heaters
controlled through the AMI network
DR RF Water Heater Switches Direct demand response devices on electric water heaters controlled through radio signals over a cooperative radio
signaling system
DR Smart Thermostats Wi‐Fi connected devices used to adjust the heating or cooling setpoints of homes and to reduce demand during peak demand
events
DR Beat the Peak Alerts Behavioral messages delivered via email, text, and phone that encourage member‐owners to reduce demand during peak
demand events
DR Pool Pump Switches Direct demand response devices that interrupt pool pump motor
operation during peak demand events
DR Battery Storage Lithium‐ion batteries that store energy during off‐peak periods
and discharge to the grid during peak demand events
DR Conservation Voltage Reduction (CVR) Process by which cooperatives reduce voltages at the substation
or feeder level during peak hours to lower demand while maintaining minimum service levels
EE Help My House® Weatherization and HVAC upgrade program with on‐bill financing
component for participating member‐owners
EE Commercial Lighting Rebates Rebates to encourage the installation of high‐efficiency lighting
upgrades. Projects may be identified through low/no‐cost commercial audits.
RE Solar Photovoltaic Solar PV arrays installed in residential, commercial, industrial, or community settings. This includes mostly behind‐the‐meter solar
installations.
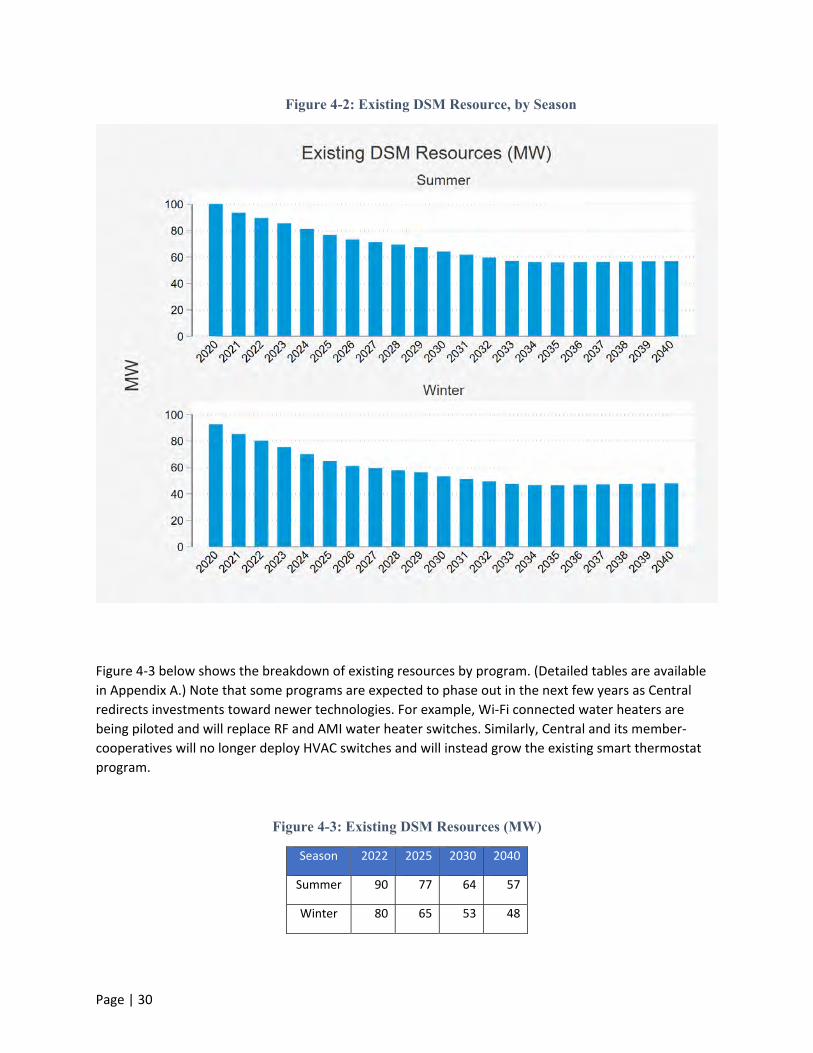
4.1.1 Future Projections for Existing Programs Central’s current portfolio of DSM programs totals approximately 93 MW of summer capacity and 91 MW
of winter capacity. Figure 4‐2 shows the existing resources by season and the projected reduction in the
existing resources over time. Key drivers of the decrease include:
Useful life and connectivity of connected devices, switches, and equipment
Declining productivity of distributed energy resource systems over time. The energy production
of solar panels degrades approximately 1% annually.
Page | 30
Figure 4-2: Existing DSM Resource, by Season
Figure 4‐3 below shows the breakdown of existing resources by program. (Detailed tables are available
in Appendix A.) Note that some programs are expected to phase out in the next few years as Central
redirects investments toward newer technologies. For example, Wi‐Fi connected water heaters are
being piloted and will replace RF and AMI water heater switches. Similarly, Central and its member‐
cooperatives will no longer deploy HVAC switches and will instead grow the existing smart thermostat
program.
Figure 4-3: Existing DSM Resources (MW)
Season 2022 2025 2030 2040
Summer 90 77 64 57
Winter 80 65 53 48

Page | 31
Figure 4-4: Existing DSM Resources, by Program
4.2 Incremental DSM Modeling
Going forward, Central and its member‐cooperatives will continue to invest in DSM programs that bring
value to member‐cooperatives through decreased energy use and demand. The future DSM portfolio was
modeled and forecasted to align with Business as Usual projected budget forecasts. The composition of
the future portfolio reflects ongoing programs, pilots, and research initiatives. The following sections
describe the framework used to assess portfolio benefit‐cost economics, key assumptions, and the
resulting economics of the modeled portfolio from multiple perspectives.
4.2.1 Economic Modeling Framework
To assess the economics of the future portfolio, Central modeled lifetime benefits and costs for each
program over the 20‐year IRP timeline using participation forecasts modeled to align with projected
budgets. These lifetime benefits and costs were assessed from three perspectives using industry standard
benefit‐cost tests, namely:
Page | 32
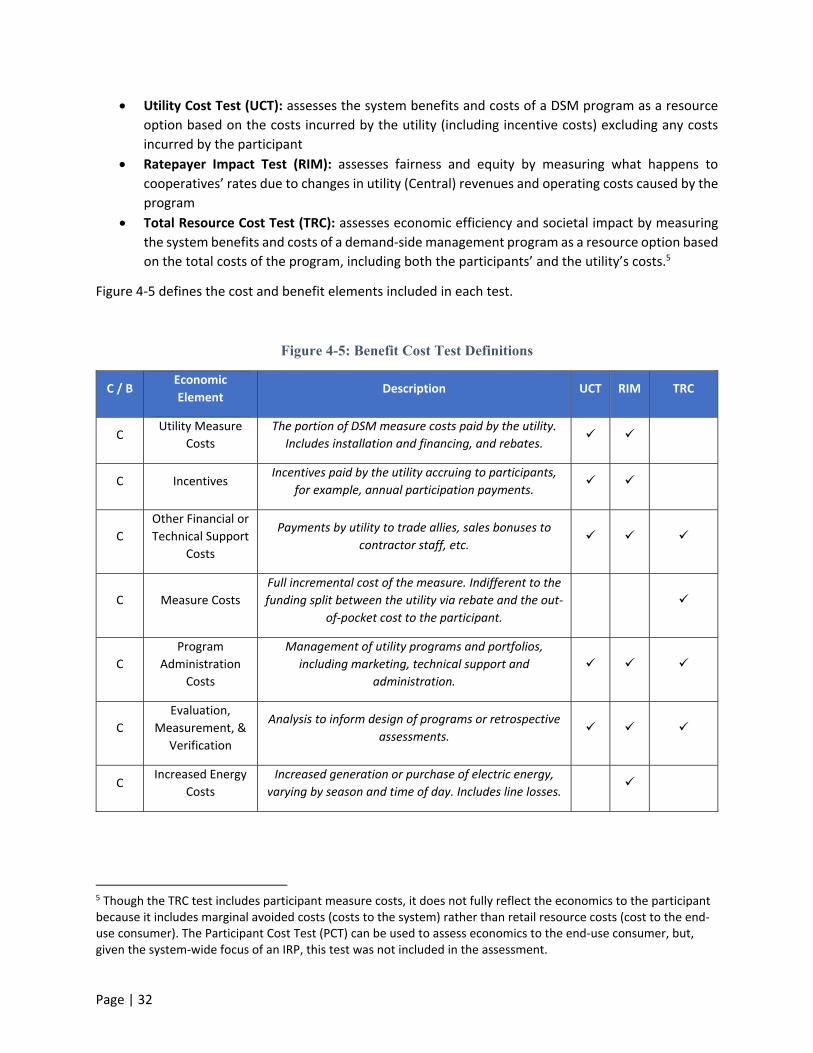
Utility Cost Test (UCT): assesses the system benefits and costs of a DSM program as a resource
option based on the costs incurred by the utility (including incentive costs) excluding any costs
incurred by the participant
Ratepayer Impact Test (RIM): assesses fairness and equity by measuring what happens to
cooperatives’ rates due to changes in utility (Central) revenues and operating costs caused by the
program
Total Resource Cost Test (TRC): assesses economic efficiency and societal impact by measuring
the system benefits and costs of a demand‐side management program as a resource option based
on the total costs of the program, including both the participants’ and the utility’s costs.5
Figure 4‐5 defines the cost and benefit elements included in each test.
Figure 4-5: Benefit Cost Test Definitions
C / B Economic
Element Description UCT RIM TRC
C Utility Measure
Costs
The portion of DSM measure costs paid by the utility.
Includes installation and financing, and rebates.
C Incentives Incentives paid by the utility accruing to participants,
for example, annual participation payments.
C
Other Financial or
Technical Support
Costs
Payments by utility to trade allies, sales bonuses to
contractor staff, etc.
C Measure Costs
Full incremental cost of the measure. Indifferent to the
funding split between the utility via rebate and the out‐
of‐pocket cost to the participant.
C
Program
Administration
Costs
Management of utility programs and portfolios,
including marketing, technical support and
administration.
C
Evaluation,
Measurement, &
Verification
Analysis to inform design of programs or retrospective
assessments.
C Increased Energy
Costs
Increased generation or purchase of electric energy,
varying by season and time of day. Includes line losses.
5 Though the TRC test includes participant measure costs, it does not fully reflect the economics to the participant because it includes marginal avoided costs (costs to the system) rather than retail resource costs (cost to the end‐use consumer). The Participant Cost Test (PCT) can be used to assess economics to the end‐use consumer, but, given the system‐wide focus of an IRP, this test was not included in the assessment.

Page | 33
C / B Economic
Element Description UCT RIM TRC
C
Increased
Generating
Capacity Costs
Cost of increased capacity needs during system peak.
Includes line losses.
C
Increased
Transmission
Capacity Costs
Increased investments in Transmission capacity.
Includes line losses.
C Lost Utility
Revenue
Reduction in retail purchase of energy from a utility as
a result of energy use reduction (e. g. indirect incentive)
B Avoided Energy
Costs
Avoided generation or purchase of electric energy,
varying by season and time of day. Includes line losses.
B
Avoided
Generating
Capacity Costs
Value of avoided capacity during system peak. Includes
line losses.
B
Avoided
Transmission
Capacity Costs
Deferred or eliminated investments in Transmission
capacity. Includes line losses.
B Added Utility
Revenue Increase in retail purchase of energy from a utility.
The economic assessment entails calculating lifetime net present value of benefits and costs. This
requires defining key assumptions for converting costs and benefits for DSM investments made over the
20‐year IRP time period.
4.2.2 Sensitivities
The avoided cost inputs are a function of current contract terms with Duke and Santee Cooper and the
weighting of costs for these two systems. Notably, short range (2021‐2029) avoided capacity costs
(generation plus transmission capacity costs) are higher in the Duke system than in the Santee Cooper
system. In contrast, avoided energy costs in the Duke system are less than those in the Santee Cooper
system. Sensitivities to these assumptions were explored by running two scenarios: one using Duke
system costs alone and another using Santee Cooper system costs alone. Economic outcomes for DSM
were more beneficial using Duke system avoided costs than when using a blended average or Santee
Cooper costs. This is especially true for demand response programs for which the resource benefit is
primarily or exclusively avoided capacity. This is also the case, though to a lesser extent, for energy
efficiency programs which provide avoided energy and avoided capacity benefits.
Another key assumption to which economic outcomes are sensitive is the treatment of avoided capacity
benefits in summer months versus in winter months6. A weighting was applied because the DSM portfolio
6 Summer is defined as April through October, while winter is comprised of the remaining months.

Page | 34
provided capacity benefits in both seasons and because seasonal peaking risk differs by system.
Specifically, summer and winter capacity reductions are not additive. To avoid double counting, weights
were applied to take the weighted average capacity reductions before applying annual avoided capacity
costs. Though the Central system typically peaks in the winter, the Duke portion of the Central system
typically peaks in the summer, and, as described above, the avoided costs also differ by system. At a
program level this matters because the avoided capacity benefits supplied by a specific DSM measure are
a function of the seasonality of the loads being curtailed or otherwise reduced via efficiency
improvements. As an example, demand response enabled via smart thermostats produces avoided
capacity benefits only when the thermostats control curtailable loads. Households with electric heating
and cooling produce both winter and summer avoided capacity benefits. Households with fossil fuel
heating do not have electric heating loads that can be curtailed in the winter and, therefore, only produce
capacity benefits in the summer. For other measures, seasonality of avoided capacity benefits is more a
function of system peak coincidence. Water heating loads are relatively similar year‐round. However,
water heater use is greatest in the morning, which aligns with the timing of winter system peaks. For the
economic analysis, an equal weight was applied to avoided capacity benefits produced in the summer
versus in the winter. To assess sensitivity to this assumption, two scenarios were reviewed: one in which
only winter demand reduction benefits were included and one in which only summer demand benefits
were included.
This sensitivity analysis revealed that the weighting of summer versus winter avoided capacity benefits
does not alter the directional economics, largely because the portfolio includes a mix of summer and
winter resources across measures and programs. That said, concentrating on the avoided cost of capacity
exclusively in the winter worsens economic outcomes because the costs of smart thermostats for dual‐
fuel households are included without including benefits. Ultimately, the mix of measures in the DSM
portfolio, including both summer resources like cooling on smart thermostats and primarily winter
resources like water heater demand response, is reflective of the assumption that both winter and
summer capacity reductions are valuable.
4.2.3 Overview of New Program Archetypes
The development of incremental DSM programs and measures for 2021‐2040 was driven by several trends
already underway both in South Carolina and across the electric industry at large.
1. Preference for Smart Devices: While direct load control of central air conditioners, heat pumps,
and electric water heaters is projected to remain a core focus of DSM efforts across the Central
system, the types of devices and communication protocols are evolving. In 2017 Central began to
pilot smart thermostats for DR purposes and transitioned to a full program in 2018 with active
participants at over half of the member‐cooperatives. Central is currently piloting two Wi‐Fi
connected water heater control devices, and this IRP assumes these Wi‐Fi enabled devices will
replace radio and AMI switches going forward. The preference for smart devices is twofold. First,
the smart devices are more attractive to member‐cooperatives, which can increase adoption rates
among member‐owners. Second, the two‐way communication capabilities of these devices allow
for rapid and accurate impact analysis and increased visibility into the operability of the fleet of
load management devices.
2. Pursuit of Strategic Electrification Opportunities: Electrification of transportation, space heating,
water heating, and agricultural/industrial machinery has seen a sharp increase in policy support

Page | 35
across North America as states and municipalities pursue aggressive climate goals. Unlike EE, DR,
and renewables, these offerings are load‐building and increase the system requirements. The
adoption rate of these technologies is an important consideration for long‐term planning, and
Central and its member‐cooperatives’ position is to help guide the member‐owners through the
conversion to electric equipment and promote technologies where the load shape makes
economic sense.
3. Focus Energy Efficiency Efforts on Equipment that Delivers Peak Demand Reduction: End uses
that drive system peaks, such as HVAC, water heating, and commercial lighting, are most viable
for EE programs.
Page | 36
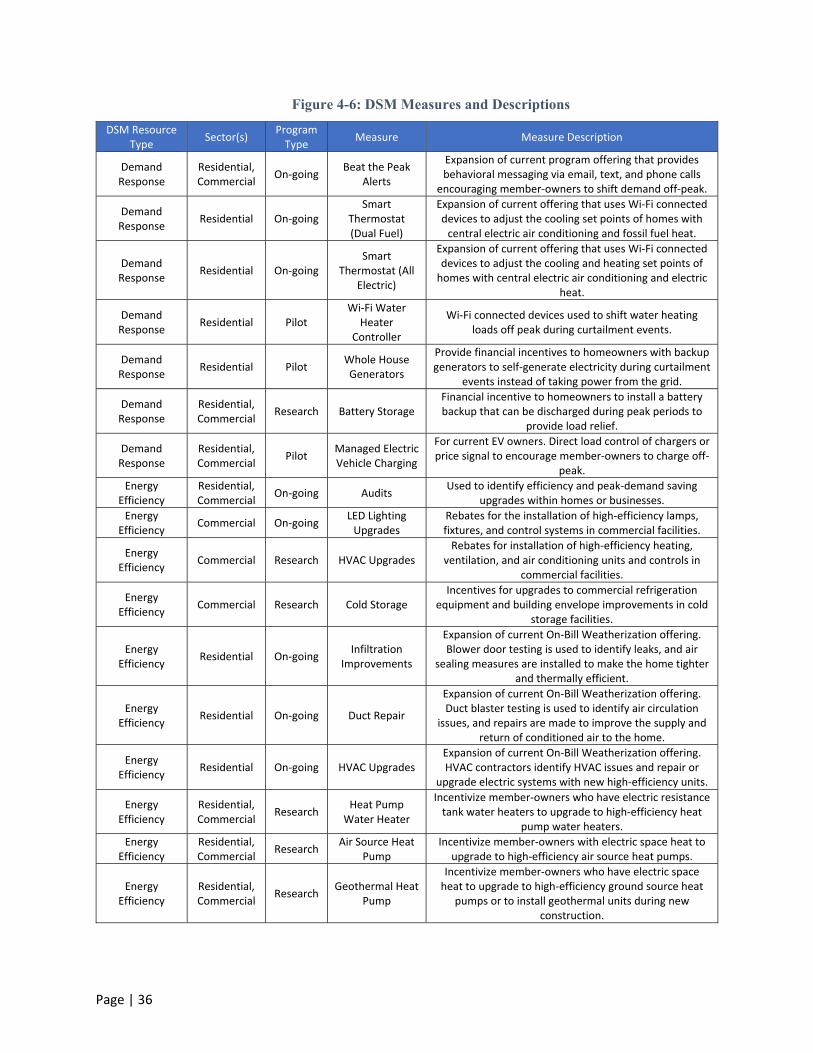
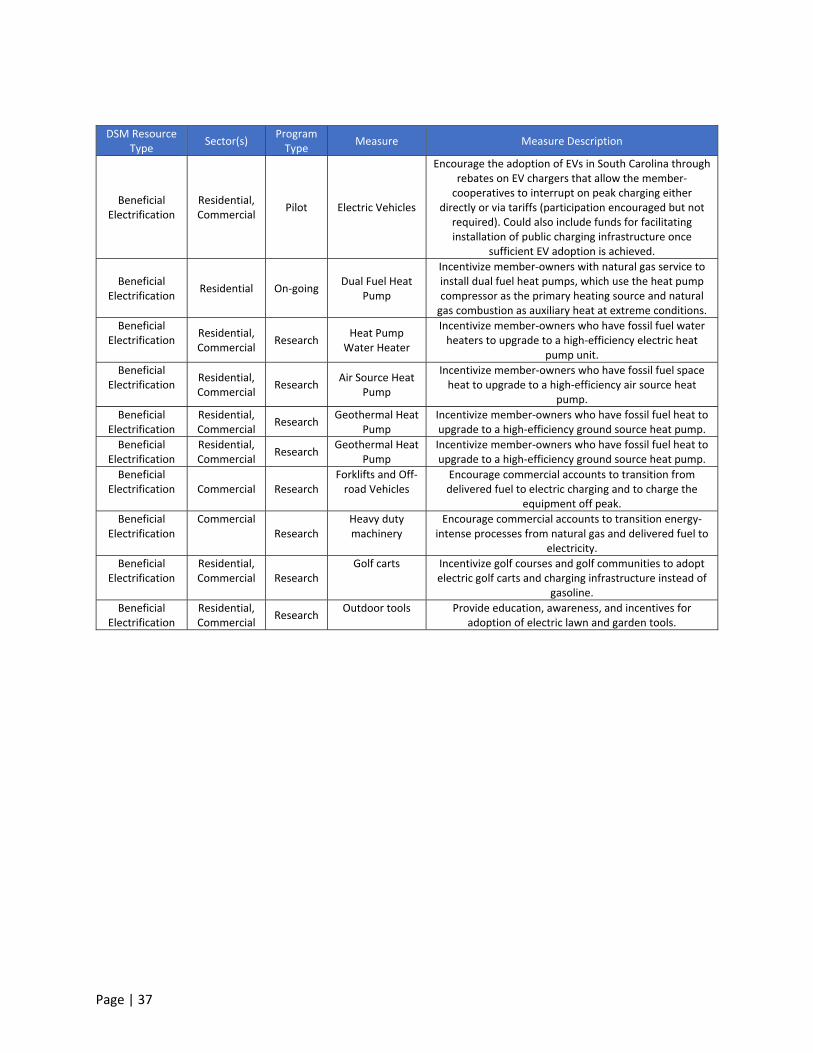
Figure 4-6: DSM Measures and Descriptions
DSM Resource Type
Sector(s) Program Type
Measure Measure Description
Demand Response
Residential, Commercial
On‐going Beat the Peak
Alerts
Expansion of current program offering that provides behavioral messaging via email, text, and phone calls
encouraging member‐owners to shift demand off‐peak.
Demand Response
Residential On‐going Smart
Thermostat (Dual Fuel)
Expansion of current offering that uses Wi‐Fi connected devices to adjust the cooling set points of homes with central electric air conditioning and fossil fuel heat.
Demand Response
Residential On‐going Smart
Thermostat (All Electric)
Expansion of current offering that uses Wi‐Fi connected devices to adjust the cooling and heating set points of homes with central electric air conditioning and electric
heat.
Demand Response
Residential Pilot Wi‐Fi Water
Heater Controller
Wi‐Fi connected devices used to shift water heating loads off peak during curtailment events.
Demand Response
Residential Pilot Whole House Generators
Provide financial incentives to homeowners with backup generators to self‐generate electricity during curtailment
events instead of taking power from the grid.
Demand Response
Residential, Commercial
Research Battery Storage Financial incentive to homeowners to install a battery backup that can be discharged during peak periods to
provide load relief.
Demand Response
Residential, Commercial
Pilot Managed Electric Vehicle Charging
For current EV owners. Direct load control of chargers or price signal to encourage member‐owners to charge off‐
peak.
Energy Efficiency
Residential, Commercial
On‐going Audits Used to identify efficiency and peak‐demand saving
upgrades within homes or businesses.
Energy Efficiency
Commercial On‐going LED Lighting Upgrades
Rebates for the installation of high‐efficiency lamps, fixtures, and control systems in commercial facilities.
Energy Efficiency
Commercial Research HVAC Upgrades Rebates for installation of high‐efficiency heating,
ventilation, and air conditioning units and controls in commercial facilities.
Energy Efficiency
Commercial Research Cold Storage Incentives for upgrades to commercial refrigeration
equipment and building envelope improvements in cold storage facilities.
Energy Efficiency
Residential On‐going Infiltration
Improvements
Expansion of current On‐Bill Weatherization offering. Blower door testing is used to identify leaks, and air
sealing measures are installed to make the home tighter and thermally efficient.
Energy Efficiency
Residential On‐going Duct Repair
Expansion of current On‐Bill Weatherization offering. Duct blaster testing is used to identify air circulation
issues, and repairs are made to improve the supply and return of conditioned air to the home.
Energy Efficiency
Residential On‐going HVAC Upgrades Expansion of current On‐Bill Weatherization offering. HVAC contractors identify HVAC issues and repair or
upgrade electric systems with new high‐efficiency units.
Energy Efficiency
Residential, Commercial
Research Heat Pump
Water Heater
Incentivize member‐owners who have electric resistance tank water heaters to upgrade to high‐efficiency heat
pump water heaters.
Energy Efficiency
Residential, Commercial
Research Air Source Heat
Pump Incentivize member‐owners with electric space heat to
upgrade to high‐efficiency air source heat pumps.
Energy Efficiency
Residential, Commercial
Research Geothermal Heat
Pump
Incentivize member‐owners who have electric space heat to upgrade to high‐efficiency ground source heat
pumps or to install geothermal units during new construction.
Page | 37
DSM Resource Type
Sector(s) Program Type
Measure Measure Description
Beneficial Electrification
Residential, Commercial
Pilot Electric Vehicles
Encourage the adoption of EVs in South Carolina through rebates on EV chargers that allow the member‐cooperatives to interrupt on peak charging either
directly or via tariffs (participation encouraged but not required). Could also include funds for facilitating installation of public charging infrastructure once
sufficient EV adoption is achieved.
Beneficial Electrification
Residential On‐going Dual Fuel Heat
Pump
Incentivize member‐owners with natural gas service to install dual fuel heat pumps, which use the heat pump compressor as the primary heating source and natural gas combustion as auxiliary heat at extreme conditions.
Beneficial Electrification
Residential, Commercial
Research Heat Pump
Water Heater
Incentivize member‐owners who have fossil fuel water heaters to upgrade to a high‐efficiency electric heat
pump unit.
Beneficial Electrification
Residential, Commercial
Research Air Source Heat
Pump
Incentivize member‐owners who have fossil fuel space heat to upgrade to a high‐efficiency air source heat
pump.
Beneficial Electrification
Residential, Commercial
Research Geothermal Heat
Pump Incentivize member‐owners who have fossil fuel heat to upgrade to a high‐efficiency ground source heat pump.
Beneficial Electrification
Residential, Commercial
Research Geothermal Heat
Pump Incentivize member‐owners who have fossil fuel heat to upgrade to a high‐efficiency ground source heat pump.
Beneficial Electrification Commercial Research
Forklifts and Off‐road Vehicles
Encourage commercial accounts to transition from delivered fuel to electric charging and to charge the
equipment off peak.
Beneficial Electrification
Commercial Research
Heavy duty machinery
Encourage commercial accounts to transition energy‐intense processes from natural gas and delivered fuel to
electricity.
Beneficial Electrification
Residential, Commercial Research
Golf carts Incentivize golf courses and golf communities to adopt electric golf carts and charging infrastructure instead of
gasoline.
Beneficial Electrification
Residential, Commercial
Research Outdoor tools Provide education, awareness, and incentives for
adoption of electric lawn and garden tools.
Page | 38
4.2.4 Business as Usual Funding Allocation
Central and the member‐cooperatives contribute funding and administrative labor to DSM measures, and
some member‐cooperatives also administer programs tailored to their local communities. For the
economic assessment, the collective DSM budget was assumed to remain at “Business as Usual” levels for
the duration of the IRP study period. While estimates of incremental resources include forecasted
incremental renewables, the economic assessment only includes budget dollars and resources associated
with DR, EE, and BE.
4.2.5 Business as Usual Results
Participation and resource forecasts for each program were developed by scaling granular “bottom up”
forecasts based on near‐ to medium‐term plans to match these “top down” budget allocations. Forecasts
for energy and capacity avoided by these incremental resources are a function of the participation
forecasts and the assumptions for per‐participant energy and demand impacts as well as useful life for
each measure. Impacts and measure‐life assumptions are based on a combination of program
measurement and validation and industry standards.
Figures 4‐7 and 4‐8 show cumulative capacity reductions for the forecasted incremental DSM portfolio
resources by budget category. The initial increase in resources reflects the increase in funding as the
budget is reallocated away from renewables. Most measures have an assumed useful life of 10 to 15 years,
so resources stabilize in the early 2030s as existing resources retire and are replaced by newer resources.
Note that the vast majority of DSM capacity comes from demand response. Energy efficiency contributes
relatively little capacity reduction and electrification contributes only a small increase.

Page | 39
Figure 4-7: Incremental DSM Capacity Resources (MW) by Budget Category – Business as Usual
Figure 4-8: Incremental DSM Capacity Resources (MW) by Budget Category – Business as Usual
Resource 2022 2025 2030 2040
DR 6 19 37 39
EE 0 1 2 5
Electrification 0 0 ‐1 ‐2
Renewables 1 2 2 3
Total 7 21 41 46

Page | 40
Figures 4‐9 and 4‐10 show cumulative energy reductions for the forecasted incremental DSM portfolio
resources. As with capacity, the increase in resources mirrors the allocation of budget to each resource.
Notably, energy reductions from energy efficiency (in blue) are partially canceled out by energy increases
due to electrification (in gray).
Figure 4-9: Incremental DSM Energy Resources (GWh) by Budget Category – Business as Usual
Figure 4-10: Incremental DSM Energy Resources (GWh) by Budget Category – Business as Usual
Resource 2022 2025 2030 2040
EE 1 5 16 31
Electrification 0 ‐2 ‐10 ‐22
Renewables 9 12 16 24
Total 9 15 22 33

Page | 41
Figures 4‐11 and 4‐12 show the capacity forecast for incremental and existing resources. Note that while
existing resources decline over time, this is largely offset by the addition of incremental resources, keeping
the overall portfolio roughly at 95 MW across summer and winter.
Figure 4-11: Existing and Incremental DSM Capacity Forecast (MW) – Business as Usual
Figure 4-12: Existing and Incremental DSM Capacity Forecast (MW) – Business as Usual
Season Resource 2022 2025 2030 2040
Summer Existing 90 77 64 57
Incremental 7 20 38 44
Winter Existing 80 65 53 48
Incremental 7 22 45 47

Page | 42
The economic assessment of the Central Business as Usual DSM portfolio evaluated the utility cost
perspective (UCT), the ratepayer impact perspective (RIM), which includes the impact of changes to utility
revenue, and the total resource perspective (TRC), which includes participant costs. Including these
standard cost tests provides a more complete assessment of portfolio economics. This assessment
includes lifetime benefits and costs for incremental DSM resources forecasted for 2021 through 2040.
Importantly, the assessment focused on electric resources only and did not include fuel costs avoided by
participants (which would improve outcomes for electrification) or any estimated reduction of participant
utility due to load curtailment (which would decrease outcomes for demand response).
Figure 4‐13 shows the benefit‐cost ratios from the three perspectives. Outcomes are shown for DR
programs, EE programs, beneficial electrification, and for the whole DSM portfolio. Key observations
include:
From the utility perspective, the DSM portfolio is cost‐effective (benefit‐cost ratio above 1.0) with
a benefit‐cost ratio of 1.11. DR (benefit‐cost ratio of 1.46) and EE (benefit‐cost ratio of 2.01)
programs are each cost effective, with a combined benefit‐cost ratio of 1.56. Electrification
programs have a negative benefit‐cost ratio (‐0.90) because of the increase in energy and capacity
(and a reduction in avoided costs) that results from electrification of new end uses. However,
electrification also provides valuable benefits in the form of potential emission reductions and
new revenue sources that partially offset lost revenue due to DR and EE programs. Importantly, a
utility that supplies electricity and gas would recognize avoided fuel costs due to end‐use fuel
switching. Because Central is an electric‐only utility, it experiences electric resource cost increases
without commensurate fuel resource cost savings.
The individual categories and portfolio are not cost‐effective from a RIM perspective. This is
expected because it considers changes in utility revenue. However, relative to the other budget
categories the benefit‐cost ratio is highest for electrification due to the increase in energy sales
from newly electrified end uses.
From the TRC perspective only demand response is cost‐effective due to the inclusion of the cost
of participant measures.7 This essentially increases the denominator (costs) while keeping the
numerator (benefits) constant. Demand response outcomes are very similar to the UCT
perspective because all costs are borne by the utility and non‐monetary participant impacts are
not factored in, though this is sometimes done for this test.
7 Though the TRC test includes participant measure costs, it does not fully reflect the economics to the participant because it includes marginal avoided costs (costs to the system) rather than retail resource costs (cost to the end‐use customer). The Participant Cost Test (PCT) can be used to assess economics to the end‐use customer, but, given the system‐wide focus of an IRP, this test was not included in the assessment.

Page | 43
Figure 4-13: Benefit-Cost Ratios for DSM Portfolio Categories
4.3 Aggressive DSM Scenario
As a sensitivity analysis, a second DSM portfolio scenario was also constructed and assessed. The goal of
this “Aggressive” scenario is to analyze whether substantial increases to DSM resources would
meaningfully impact the overall Central resource mix. The Aggressive scenario was designed to be feasible
within the range of neighboring utilities’ DSM program spending. The following sections discuss the
regional context for DSM, funding assumptions for the Aggressive scenario, resulting resource
magnitudes, and economics.
4.3.1 Funding Assumptions
For the Aggressive scenario, DSM spending was assumed to ramp up to reach roughly 4.7 times that of
the Business as Usual scenario by 2027. To translate this budget scenario into a participation forecast
program, administration costs were kept largely fixed, consistent with the assumption that incremental
revenue would largely be allocated towards growing participation. Some additional administrative costs
were included to cover the likelihood that additional staffing would be needed to support a DSM budget
of this magnitude.
To develop forecasts for incremental resources in future years for the Aggressive scenario, the forecasted
budget was allocated across the same four key spending categories using the same annual budget shares
as applied to the Business as Usual scenario. For incremental renewables, annual additions are assumed
to reach an equilibrium of 1 MW of AC capacity per year starting in 2025, compared to 0.5 MW of AC
capacity in the Business as Usual scenario. This higher rate of additions is meant to capture conditions
generally more favorable to renewables and could include increased marketing, offering of value of solar
(VOS) tariffs by additional member‐cooperatives, a more favorable VOS tariff, or lower market costs for
solar modules.
4.3.2 Aggressive Scenario Results
Participation and resource forecasts for each program were developed by scaling granular “bottom up”
forecasts based on near‐term to medium‐term plans to match the “top down” allocations of the
1.11
0.380.60
1.46
0.32
1.49
2.01
0.450.58
‐0.90
0.75
‐0.25
‐1.0
‐0.5
0.0
0.5
1.0
1.5
2.0
UCT RIM TRC
Ben
efit Cost Ratio
Portfolio DR EE Electrification

Page | 44
Aggressive budget. Forecasts for energy and capacity avoided by these incremental resources are a
function of the participation forecasts and the assumptions for per‐participant energy and demand
impacts as well as useful life for each measure. Impacts and measure‐life assumptions are based on a
combination of program measurement and validation and industry standards.
Figures 4‐14 and 4‐15 show cumulative capacity reductions for the forecasted incremental DSM portfolio
resources by budget category. The initial increase in resources reflects a more than four‐fold increase in
funding as budget is scaled up from Business as Usual levels to Aggressive levels by 2027. Subsequent
growth in resources continues for another eight years until equilibrium is reached between retirement of
existing resources and replacement by newer resources. Note that the vast majority of DSM capacity
comes from demand response. Energy efficiency contributes relatively little capacity reduction and
electrification contributes only a small increase.
Figure 4-14: Incremental DSM Capacity Resources (MW) by Budget Category – Aggressive
Page | 45
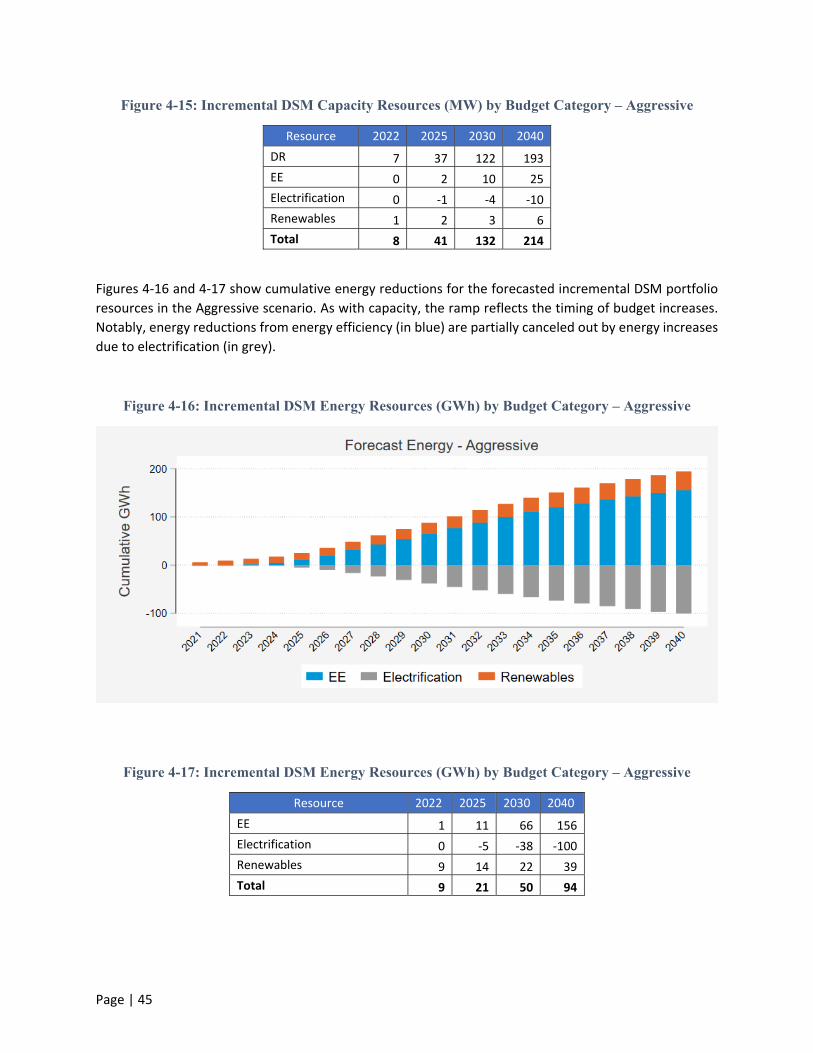
Figure 4-15: Incremental DSM Capacity Resources (MW) by Budget Category – Aggressive
Resource 2022 2025 2030 2040
DR 7 37 122 193
EE 0 2 10 25
Electrification 0 ‐1 ‐4 ‐10
Renewables 1 2 3 6
Total 8 41 132 214
Figures 4‐16 and 4‐17 show cumulative energy reductions for the forecasted incremental DSM portfolio
resources in the Aggressive scenario. As with capacity, the ramp reflects the timing of budget increases.
Notably, energy reductions from energy efficiency (in blue) are partially canceled out by energy increases
due to electrification (in grey).
Figure 4-16: Incremental DSM Energy Resources (GWh) by Budget Category – Aggressive
Figure 4-17: Incremental DSM Energy Resources (GWh) by Budget Category – Aggressive
Resource 2022 2025 2030 2040
EE 1 11 66 156
Electrification 0 ‐5 ‐38 ‐100
Renewables 9 14 22 39
Total 9 21 50 94
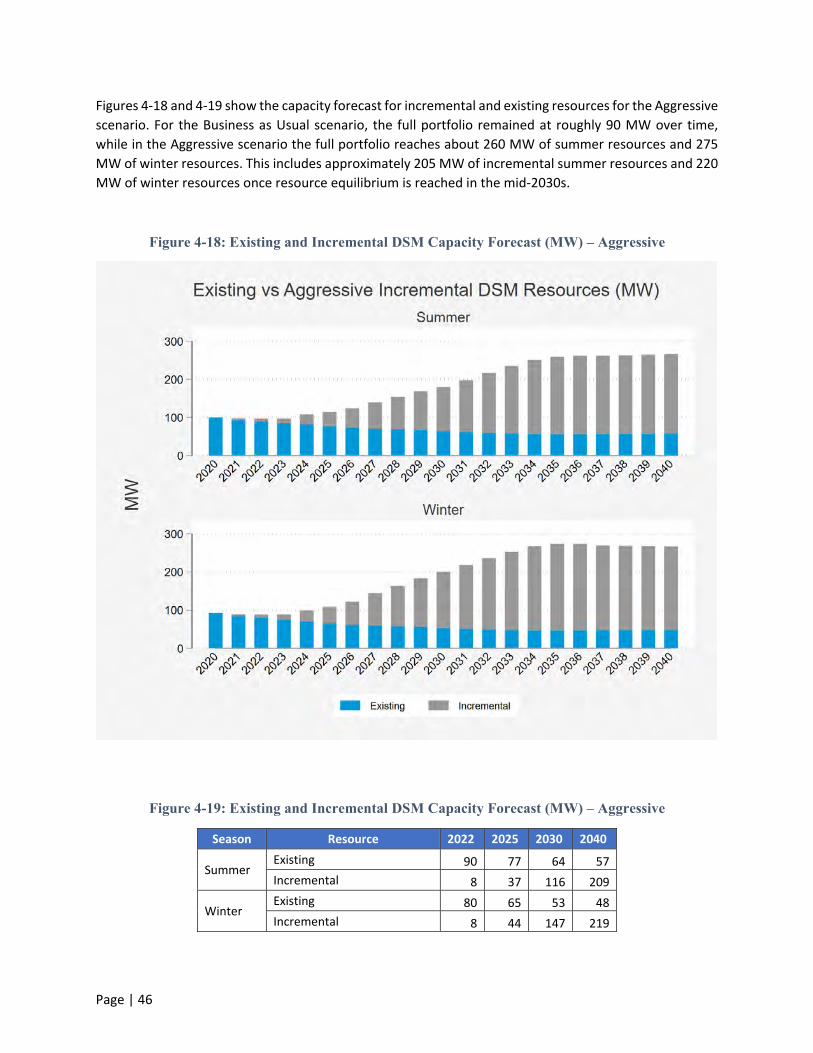
Page | 46
Figures 4‐18 and 4‐19 show the capacity forecast for incremental and existing resources for the Aggressive
scenario. For the Business as Usual scenario, the full portfolio remained at roughly 90 MW over time,
while in the Aggressive scenario the full portfolio reaches about 260 MW of summer resources and 275
MW of winter resources. This includes approximately 205 MW of incremental summer resources and 220
MW of winter resources once resource equilibrium is reached in the mid‐2030s.
Figure 4-18: Existing and Incremental DSM Capacity Forecast (MW) – Aggressive
Figure 4-19: Existing and Incremental DSM Capacity Forecast (MW) – Aggressive
Season Resource 2022 2025 2030 2040
Summer Existing 90 77 64 57
Incremental 8 37 116 209
Winter Existing 80 65 53 48
Incremental 8 44 147 219
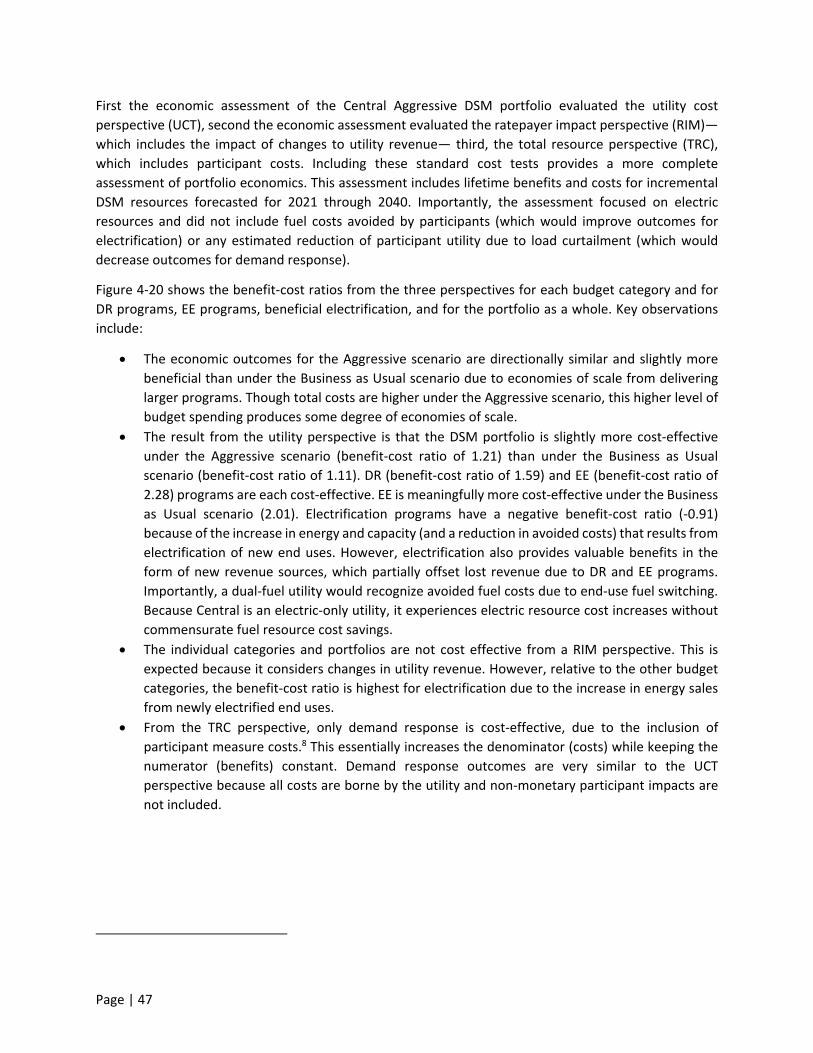
Page | 47
First the economic assessment of the Central Aggressive DSM portfolio evaluated the utility cost
perspective (UCT), second the economic assessment evaluated the ratepayer impact perspective (RIM)—
which includes the impact of changes to utility revenue— third, the total resource perspective (TRC),
which includes participant costs. Including these standard cost tests provides a more complete
assessment of portfolio economics. This assessment includes lifetime benefits and costs for incremental
DSM resources forecasted for 2021 through 2040. Importantly, the assessment focused on electric
resources and did not include fuel costs avoided by participants (which would improve outcomes for
electrification) or any estimated reduction of participant utility due to load curtailment (which would
decrease outcomes for demand response).
Figure 4‐20 shows the benefit‐cost ratios from the three perspectives for each budget category and for
DR programs, EE programs, beneficial electrification, and for the portfolio as a whole. Key observations
include:
The economic outcomes for the Aggressive scenario are directionally similar and slightly more
beneficial than under the Business as Usual scenario due to economies of scale from delivering
larger programs. Though total costs are higher under the Aggressive scenario, this higher level of
budget spending produces some degree of economies of scale.
The result from the utility perspective is that the DSM portfolio is slightly more cost‐effective
under the Aggressive scenario (benefit‐cost ratio of 1.21) than under the Business as Usual
scenario (benefit‐cost ratio of 1.11). DR (benefit‐cost ratio of 1.59) and EE (benefit‐cost ratio of
2.28) programs are each cost‐effective. EE is meaningfully more cost‐effective under the Business
as Usual scenario (2.01). Electrification programs have a negative benefit‐cost ratio (‐0.91)
because of the increase in energy and capacity (and a reduction in avoided costs) that results from
electrification of new end uses. However, electrification also provides valuable benefits in the
form of new revenue sources, which partially offset lost revenue due to DR and EE programs.
Importantly, a dual‐fuel utility would recognize avoided fuel costs due to end‐use fuel switching.
Because Central is an electric‐only utility, it experiences electric resource cost increases without
commensurate fuel resource cost savings.
The individual categories and portfolios are not cost effective from a RIM perspective. This is
expected because it considers changes in utility revenue. However, relative to the other budget
categories, the benefit‐cost ratio is highest for electrification due to the increase in energy sales
from newly electrified end uses.
From the TRC perspective, only demand response is cost‐effective, due to the inclusion of
participant measure costs.8 This essentially increases the denominator (costs) while keeping the
numerator (benefits) constant. Demand response outcomes are very similar to the UCT
perspective because all costs are borne by the utility and non‐monetary participant impacts are
not included.
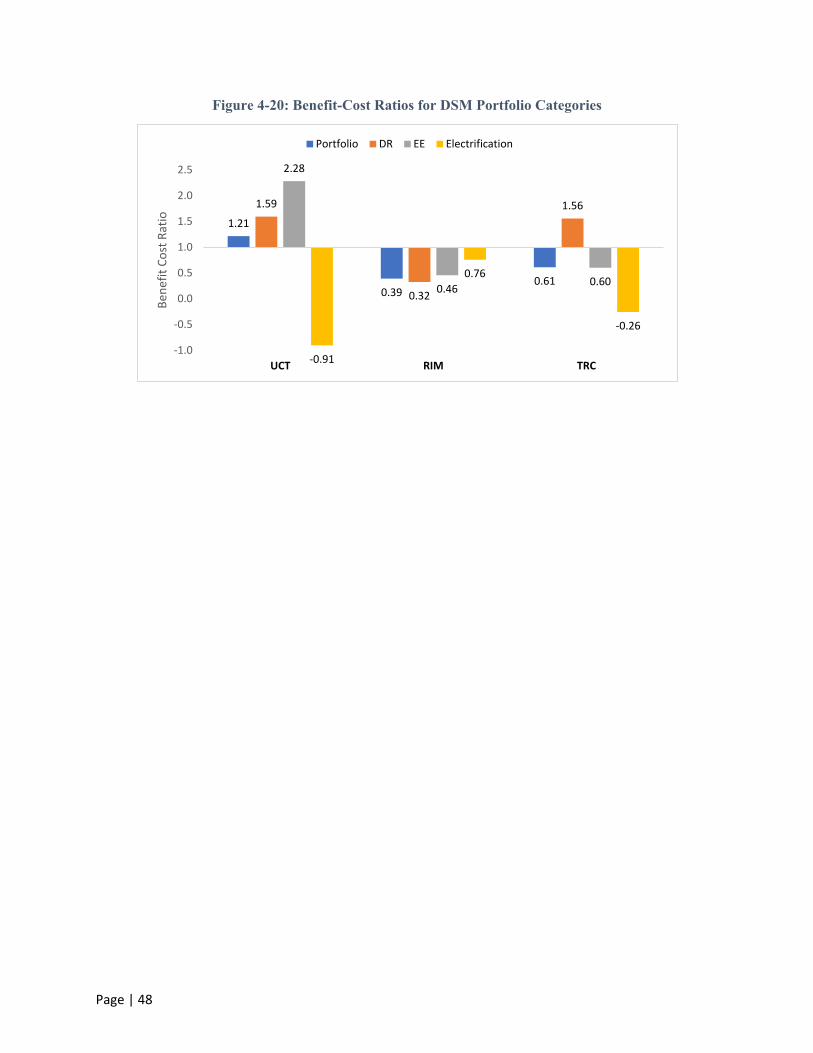
Page | 48
Figure 4-20: Benefit-Cost Ratios for DSM Portfolio Categories
1.21
0.390.61
1.59
0.32
1.56
2.28
0.460.60
‐0.91
0.76
‐0.26
‐1.0
‐0.5
0.0
0.5
1.0
1.5
2.0
2.5
UCT RIM TRC
Ben
efit Cost Ratio
Portfolio DR EE Electrification
Page | 49
5 Load Forecast
Page | 50
5 Load Forecast
5.1 Methodology
The load forecast is a key input in Central’s resource plan. The 2020 Central Load Forecast is the sum of
the 20 member‐cooperative forecasts through 2040. The peak forecast identifies capacity requirements
necessary for the system to maintain reliability. Central completes a load forecast annually for each of its
20 member‐cooperatives by allocating member‐cooperative loads into classes according to standards set
forth in the RUS Form 7. The Form 7 classes are: Residential, Small Commercial, Large Commercial &
Industrial, Seasonal, Irrigation, Lighting, and Other load classes.
Residential and Small Commercial classes are forecasted using the industry standard Statistically Adjusted
End‐Use (SAE) modeling, discussed in more detail later in this section. Residential energy is modeled by
forecasting the number of residential member‐owners and the average use per member‐owner. Due to
energy efficiency trends, residential growth comes from new residential member‐owners on the system.
Similarly, Small Commercial growth is driven by additional member‐owners. The Industrial subset of Large
Commercial and Industrial is forecasted individually in close consultation with member‐cooperatives. The
remaining classes (Seasonal, Irrigation, Lighting, and Other) are forecasted using linear trends and
historical averages.
Weather sensitive loads are modeled using 30‐year rolling temperature averages. The member‐
cooperatives are each assigned one of the following airport weather stations: Greenville‐Spartanburg,
Columbia, Savannah, Charleston, or Florence. Peak Heating Degree Days are calculated with a base of 55,
and Cooling Degree Days base of 75. Energy forecasts use the Degree Day base of 65 for both heating and
cooling. Deviations from the base degree cause increases in the degree days.9 Degree Days are a
forecasting tool used to better analyze the impact of temperature on electric loads. Increases in degree
days result in increases in weather related loads, such as heating and air conditioning.
Economic and demographic projections are obtained from IHS Markit, a nationally recognized economic
forecasting firm. These are county‐level forecasts for South Carolina. Each member‐cooperative’s
economic forecast is based on the counties in its service territory. Below are the projected average annual
growth rates of key economic drivers for South Carolina. Economic data for individual member‐
cooperatives can vary from the state averages due to the economic data of the counties in their service
territories.
Figure 5-1: Average Annual Growth for South Carolina 2020-2040
Gross State Product 2.0%
Real Personal Income 2.5%
Households 1.0%
9 Using a base of 75, an average peak day temperature of 90 will yield a cooling degree day value of 15. Degree‐Days are non‐negative, so the Heating Degree Day value in this example is 0.

Page | 51
No increase in electric vehicles or behind‐the‐meter solar penetration is explicitly modeled in the Base
forecast. Existing solar and electric vehicles are instead embedded in the Base forecast. Scenario forecasts
are explained in Section 6 of this report. The Base Forecast excludes adverse economic and load impacts
of the coronavirus (COVID‐19) pandemic. Central developed a COVID‐19 scenario that sits between the
Base and Low Cases. This is explained in more detail in section 5.3.
5.2 Base Load Forecast
The SAE modeling methodology combines linear regression analysis with end‐use models. It employs end‐
use data, housing information, weather data, economic data and price projections. It explicitly accounts
for future energy efficiencies that may not be included in the load history. The end‐use data includes
appliance efficiency trends and appliance saturations.
Linear regression analysis calculates the historical relationship between variables by estimating a line‐of‐
best‐fit through the sample. In this process, the predictor variables are measured against the dependent
variable, and the resulting coefficients quantify the relationship. For example, the forecast uses linear
regressions to estimate coefficients between total households in a county and a member‐cooperative’s
residential member‐owners. SAE modeling uses the linear regression framework on end‐use models to
create the energy and peak forecasts. End‐use models use appliance stock to forecast retail use. Estimates
of household appliances such as electric water heaters, heat pumps, televisions, and refrigerators are
used. Commercial end‐use models use heating, cooling, floor space, lighting, and refrigeration. The total
appliance stock is multiplied by the average electric use of the appliance (use‐per). This method requires
much data collection—even estimates of the square footage of a house or commercial building—and
appliance use analysis to make total energy balance with existing sales. SAE models allow for reasonable
end‐use estimates to be calibrated to actual load using linear regression. These models depend upon
reliable efficiency projections. Central uses energy efficiency projections for the South Atlantic Census
Region produced annually by the Energy Information Administration (EIA). Central then customizes the
appliance share forecasts using the member‐cooperatives’ most recent appliance saturation survey
results.
Central’s member‐cooperatives collect appliance saturation surveys from their member‐owners every
three years. These surveys collect information on home air conditioning type, kitchen appliances, and
lighting type. The survey gives Central and its member‐cooperatives a clearer understanding of the
characteristics of the residential housing stock in member‐cooperative service territories, forming the
basis for updating current appliance share estimates and forecasts for each member‐cooperative. The
average‐use‐per‐household forecast is the product of the appliances operated in the household and the
efficiency of those appliances. Future efficiency improvements are both naturally occurring, as technology
improvements make their way into member‐owner households and are based on federal mandates.
Efficiency mandates are not immediately adopted, and the EIA makes predictions regarding the rate at
which these efficiencies are adopted into the average household.
There are two elements to the load forecast: peaks and energy. Energy, the total amount of electricity
consumed over a month, is forecasted as described above. Peaks, the highest electric load level on the
system in an hour, are modeled using a combination of SAE and historical averages. Large Industrial peaks
are modeled individually using historical peaks. New Large Industrials are projected using future billing
estimates provided by the member‐cooperative. Non‐industrial load is modeled using SAE. Weather‐

Page | 52
sensitive load is estimated by interacting monthly energy forecasts with average peak‐day temperatures.
Baseload is not weather sensitive and uses peak fractions to determine the contribution to the monthly
peak. Peak fractions are estimates of appliance load during the monthly peak hour. For example, if 15%
of electric water heaters are online during the February peak hour, electric water heaters would have a
peak fraction of 0.15 in February.

Page | 53
5.2.1 Member‐Owner Forecasts Below are the member‐owner forecasts for the 20 member‐cooperatives. Figure 5‐1 shows the number
of member‐owners served by member‐cooperatives, categorized by class designations from the RUS Form
7.
Figure 5-1: Member-Owner Accounts Forecast by Class
Year Residential Small
Commercial
Large
Commercial Other Lighting Irrigation Seasonal
2020 735,885 84,537 369 2,320 1,628 1,434 1,814
2021 746,885 85,265 369 2,320 1,628 1,437 1,814
2022 756,762 85,912 369 2,320 1,628 1,440 1,814
2023 766,176 86,536 369 2,320 1,628 1,443 1,814
2024 775,223 87,222 369 2,320 1,628 1,446 1,814
2025 784,389 87,964 369 2,320 1,628 1,449 1,814
2026 793,604 88,722 369 2,320 1,628 1,452 1,814
2027 802,735 89,488 369 2,320 1,628 1,455 1,814
2028 812,034 90,254 369 2,320 1,628 1,458 1,814
2029 821,436 91,062 369 2,320 1,628 1,461 1,814
2030 830,959 91,867 369 2,320 1,628 1,464 1,814
2031 840,594 92,653 369 2,320 1,628 1,467 1,814
2032 850,256 93,479 369 2,320 1,628 1,470 1,814
2033 859,870 94,280 369 2,320 1,628 1,473 1,814
2034 869,424 95,072 369 2,320 1,628 1,476 1,814
2035 878,987 95,855 369 2,320 1,628 1,479 1,814
2036 888,621 96,635 369 2,320 1,628 1,482 1,814
2037 898,282 97,422 369 2,320 1,628 1,485 1,814
2038 907,993 98,212 369 2,320 1,628 1,488 1,814
2039 917,761 99,002 369 2,320 1,628 1,491 1,814
2040 927,584 99,798 369 2,320 1,628 1,494 1,814
Growth
Rate 1.2% 0.8% 0.0% 0.0% 0.0% 0.2% 0.0%

Page | 54
5.2.2 Central Demand and Energy Forecast
Below in Figure 5‐2 are the base peak and energy forecasts for Central. These projections are at the
generation level, meaning that they include all losses incurred as power flows between the generating
stations and the member‐owner.
Figure 5-2: Central Demand and Energy Forecast (MW)
Year Summer Peak Winter Peak Energy
2020 3,776 4,273 19,013,291
2021 3,845 4,324 19,341,329
2022 3,900 4,373 19,659,974
2023 3,942 4,418 19,907,944
2024 3,985 4,471 20,210,524
2025 4,024 4,515 20,346,333
2026 4,056 4,551 20,483,036
2027 4,092 4,588 20,627,910
2028 4,128 4,632 20,837,420
2029 4,171 4,669 20,941,239
2030 4,207 4,704 21,083,958
2031 4,245 4,740 21,232,792
2032 4,281 4,780 21,442,244
2033 4,326 4,814 21,545,762
2034 4,368 4,852 21,703,919
2035 4,413 4,891 21,870,299
2036 4,456 4,937 22,105,285
2037 4,511 4,978 22,237,227
2038 4,562 5,024 22,427,834
2039 4,614 5,072 22,623,156
2040 4,663 5,122 22,826,503
Average Annual Growth Rate
1.0% 0.9% 0.9%
5.2.3 DSM and Energy Efficiency in the Base Forecast
The base forecast has over 90 MW of existing DSM. Naturally occurring energy efficiencies are embedded
in the base forecast using the EIA’s efficiency projections of the South Atlantic Census region. These are
based on national efficiency mandates unfolding throughout the forecast period. Current mandates will
not be reflected in the average appliance for many years. Further explanation of existing and forecasted
DSM is covered in Section 4 of this report.
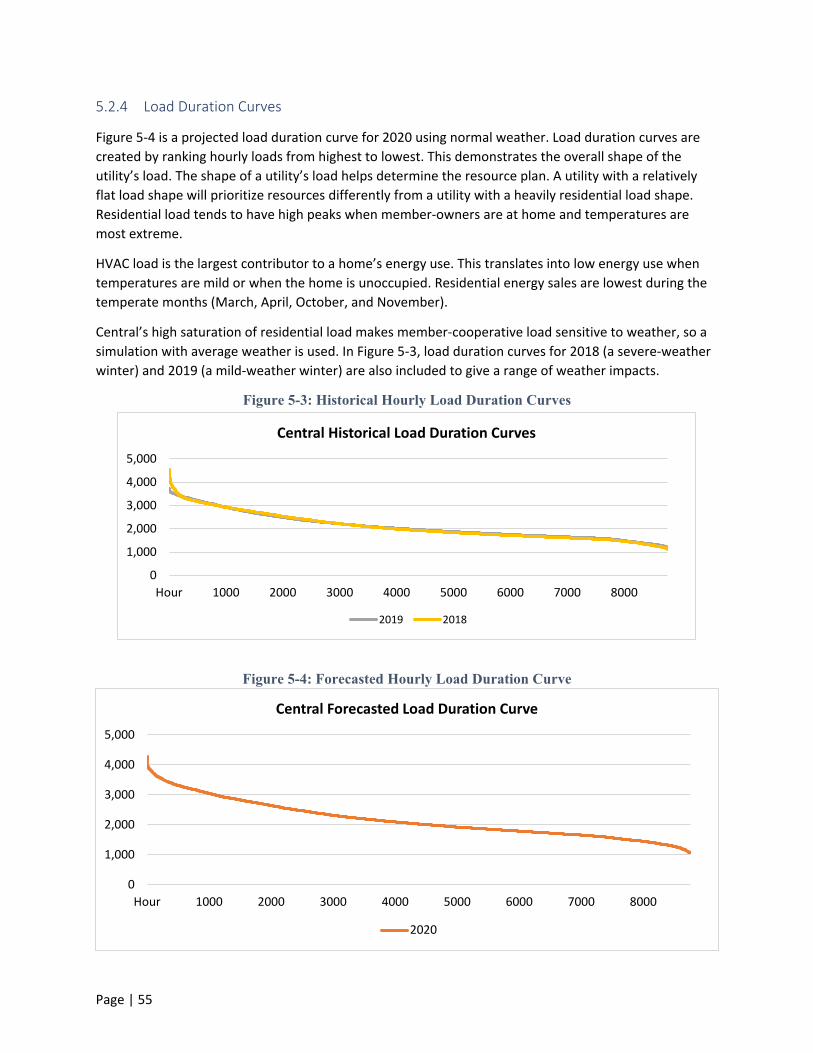
Page | 55
5.2.4 Load Duration Curves
Figure 5‐4 is a projected load duration curve for 2020 using normal weather. Load duration curves are
created by ranking hourly loads from highest to lowest. This demonstrates the overall shape of the
utility’s load. The shape of a utility’s load helps determine the resource plan. A utility with a relatively
flat load shape will prioritize resources differently from a utility with a heavily residential load shape.
Residential load tends to have high peaks when member‐owners are at home and temperatures are
most extreme.
HVAC load is the largest contributor to a home’s energy use. This translates into low energy use when
temperatures are mild or when the home is unoccupied. Residential energy sales are lowest during the
temperate months (March, April, October, and November).
Central’s high saturation of residential load makes member‐cooperative load sensitive to weather, so a
simulation with average weather is used. In Figure 5‐3, load duration curves for 2018 (a severe‐weather
winter) and 2019 (a mild‐weather winter) are also included to give a range of weather impacts.
Figure 5-3: Historical Hourly Load Duration Curves
Figure 5-4: Forecasted Hourly Load Duration Curve
0
1,000
2,000
3,000
4,000
5,000
Hour 1000 2000 3000 4000 5000 6000 7000 8000
Central Historical Load Duration Curves
2019 2018
0
1,000
2,000
3,000
4,000
5,000
Hour 1000 2000 3000 4000 5000 6000 7000 8000
Central Forecasted Load Duration Curve
2020

Page | 56
5.3 Load Forecast Scenarios
High and low load growth scenarios are demonstrated below in Figure 5‐5. The low‐growth scenario uses
economic growth that is one standard deviation below the IHS Markit base forecast. (Standard deviation
measures the variability of individual values from the average.) The growth rates for all economic and
demographic categories are reduced by the standard deviation calculation. For example, a standard
deviation estimate of 0.5% and a growth estimate of 1.2% yields 0.7% growth in the low‐growth scenario.
Residential member‐owner forecasts are also one standard deviation below projections. High‐growth
scenarios are calculated similarly, but one standard deviation is added for economic growth and the
member‐owner forecasts.
Standard deviations are calculated for each member‐cooperative using the years 2000‐2019. These
estimates assume normal distributions around the base forecast. The base forecast values of the
residential member‐owner forecasts and economic projections serve as the mean. The range between
the high‐ and low‐growth rates represents 68.3% of the possible values.
The low‐growth scenarios are approximately 0.5% per year for the period. The low‐growth scenario
incorporates the negative economic impacts due to COVID‐19. Large industrial loads are more sensitive
to economic recessions than residential loads, and this reduces energy in the early forecast years. The
high‐growth scenario estimates a 1.7% annual growth and excludes negative impacts from COVID‐19.
The COVID‐19 scenario forecasts electric sales using a 30% GDP contraction in the second quarter of 2020.
While the third quarter bounces back strongly, it does not assume a V‐shaped recovery. Economic output
does not return to 2019 levels until 2022.10 Twenty years of historical data are used in the scenario
forecasts. Residential, Small Commercial, and Large Commercial classes are modeled.
10 IHS Markit COVID Scenario Forecast for South Carolina published in April 2020

Page | 57
Figure 5-5: Forecasted Scenarios
Figure 5-6: Forecasted Winter Peak Scenarios
‐
1,000
2,000
3,000
4,000
5,000
6,000
7,000
2020 2021 2022 2023 2024 2025 2026 2027 2028 2029 2030 2031 2032 2033 2034 2035 2036 2037 2038 2039 2040
Central Forecast Scenarios Winter Peak (MW)
Low Scenario Base Forecast High Scenario
‐
5,000,000
10,000,000
15,000,000
20,000,000
25,000,000
30,000,000
202020212022202320242025202620272028202920302031203220332034203520362037203820392040
Central Forecast Scenarios (MWh)
Low Scenario Base Forecast High Scenario

Page | 58
Figure 5-7: Forecasted Summer Peak Scenarios
‐
1,000
2,000
3,000
4,000
5,000
6,000
2020 2021 2022 2023 2024 2025 2026 2027 2028 2029 2030 2031 2032 2033 2034 2035 2036 2037 2038 2039 2040
Central Forecast Scenarios Summer Peak (MW)
Low Scenario Base Forecast High Scenario
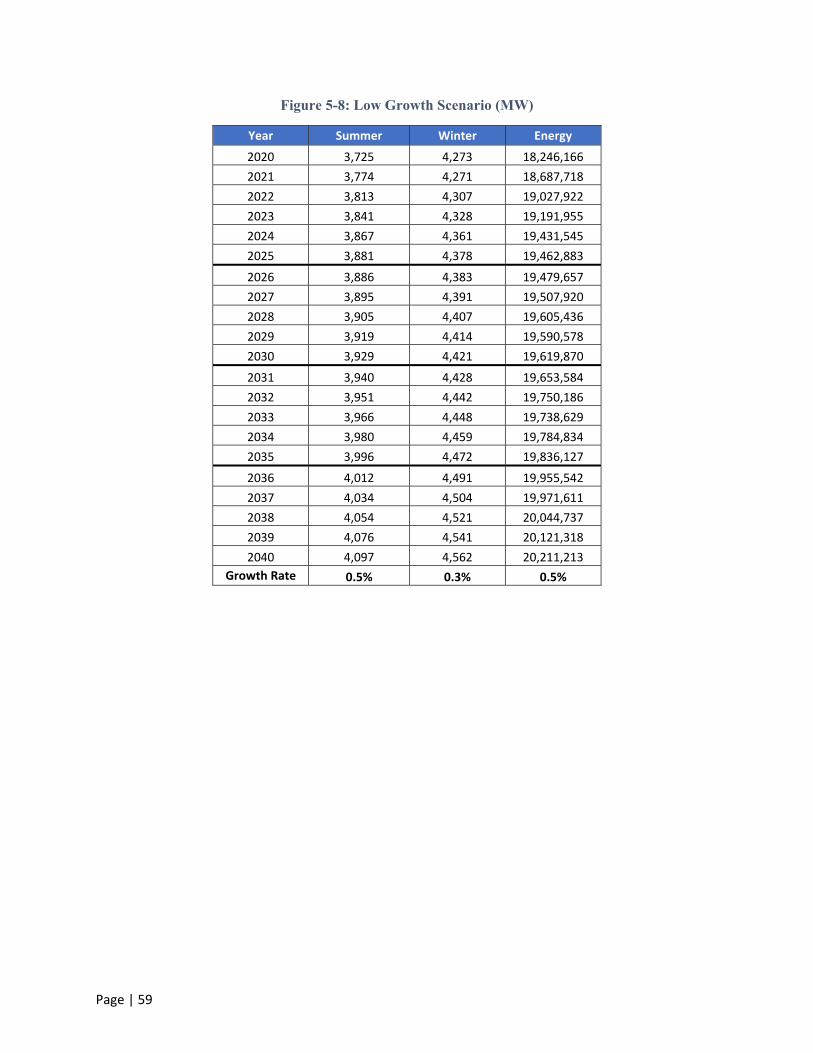
Page | 59
Figure 5-8: Low Growth Scenario (MW)
Year Summer Winter Energy
2020 3,725 4,273 18,246,166
2021 3,774 4,271 18,687,718
2022 3,813 4,307 19,027,922
2023 3,841 4,328 19,191,955
2024 3,867 4,361 19,431,545
2025 3,881 4,378 19,462,883
2026 3,886 4,383 19,479,657
2027 3,895 4,391 19,507,920
2028 3,905 4,407 19,605,436
2029 3,919 4,414 19,590,578
2030 3,929 4,421 19,619,870
2031 3,940 4,428 19,653,584
2032 3,951 4,442 19,750,186
2033 3,966 4,448 19,738,629
2034 3,980 4,459 19,784,834
2035 3,996 4,472 19,836,127
2036 4,012 4,491 19,955,542
2037 4,034 4,504 19,971,611
2038 4,054 4,521 20,044,737
2039 4,076 4,541 20,121,318
2040 4,097 4,562 20,211,213
Growth Rate 0.5% 0.3% 0.5%

Page | 60
Figure 5-9: High Growth Scenario (MW)
Year Summer Winter Energy
2020 3,870 4,392 19,581,735
2021 3,966 4,477 20,007,320
2022 4,052 4,560 20,447,938
2023 4,136 4,650 20,895,318
2024 4,226 4,751 21,419,959
2025 4,304 4,838 21,732,361
2026 4,376 4,916 22,047,666
2027 4,453 4,997 22,376,481
2028 4,530 5,086 22,768,481
2029 4,616 5,167 23,061,601
2030 4,695 5,247 23,391,400
2031 4,776 5,328 23,728,526
2032 4,856 5,415 24,125,119
2033 4,947 5,498 24,425,917
2034 5,034 5,584 24,781,428
2035 5,124 5,673 25,147,546
2036 5,214 5,771 25,585,885
2037 5,319 5,864 25,930,037
2038 5,420 5,964 26,339,956
2039 5,529 6,071 26,784,762
2040 5,638 6,180 27,244,789
Growth Rate 1.9% 1.7% 1.7%
5.3.1 DSM Penetration Scenarios
These scenarios are referenced in sections 4.2 and 4.3.
5.3.2 Renewable and Cogeneration Penetration Scenarios
These scenarios are referenced in Section 4 of this report.

Page | 61
6 Resource Plan
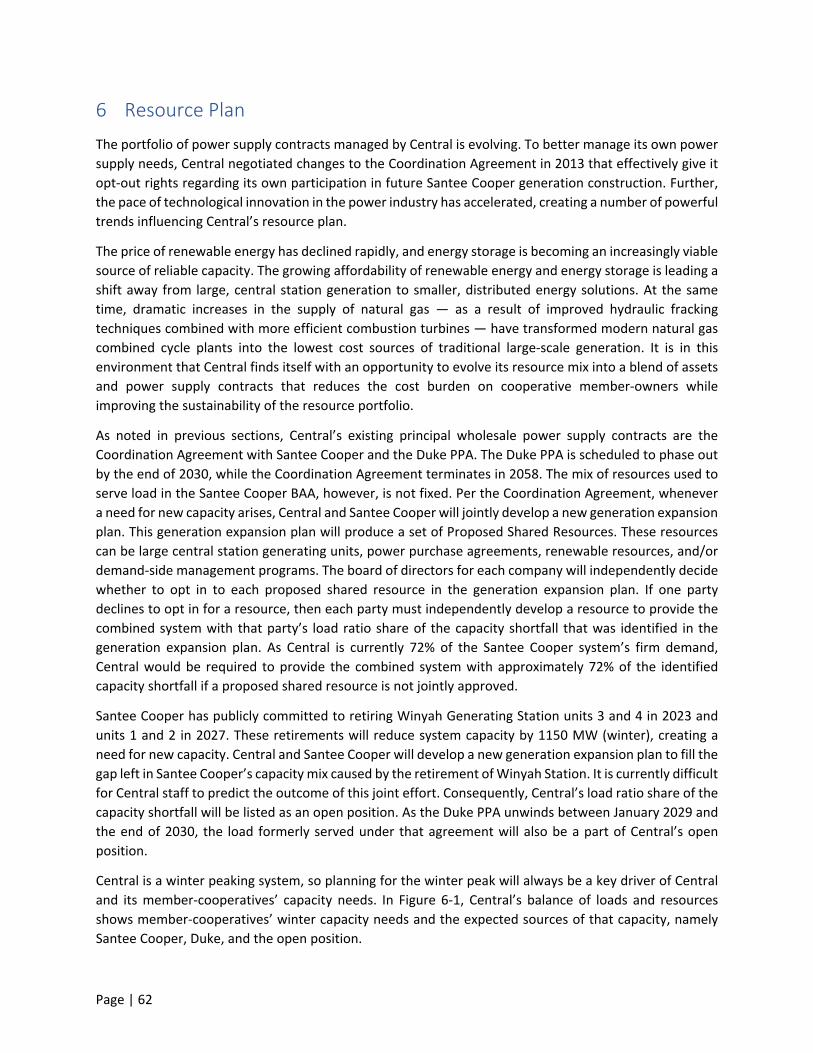
Page | 62
6 Resource Plan
The portfolio of power supply contracts managed by Central is evolving. To better manage its own power
supply needs, Central negotiated changes to the Coordination Agreement in 2013 that effectively give it
opt‐out rights regarding its own participation in future Santee Cooper generation construction. Further,
the pace of technological innovation in the power industry has accelerated, creating a number of powerful
trends influencing Central’s resource plan.
The price of renewable energy has declined rapidly, and energy storage is becoming an increasingly viable
source of reliable capacity. The growing affordability of renewable energy and energy storage is leading a
shift away from large, central station generation to smaller, distributed energy solutions. At the same
time, dramatic increases in the supply of natural gas — as a result of improved hydraulic fracking
techniques combined with more efficient combustion turbines — have transformed modern natural gas
combined cycle plants into the lowest cost sources of traditional large‐scale generation. It is in this
environment that Central finds itself with an opportunity to evolve its resource mix into a blend of assets
and power supply contracts that reduces the cost burden on cooperative member‐owners while
improving the sustainability of the resource portfolio.
As noted in previous sections, Central’s existing principal wholesale power supply contracts are the
Coordination Agreement with Santee Cooper and the Duke PPA. The Duke PPA is scheduled to phase out
by the end of 2030, while the Coordination Agreement terminates in 2058. The mix of resources used to
serve load in the Santee Cooper BAA, however, is not fixed. Per the Coordination Agreement, whenever
a need for new capacity arises, Central and Santee Cooper will jointly develop a new generation expansion
plan. This generation expansion plan will produce a set of Proposed Shared Resources. These resources
can be large central station generating units, power purchase agreements, renewable resources, and/or
demand‐side management programs. The board of directors for each company will independently decide
whether to opt in to each proposed shared resource in the generation expansion plan. If one party
declines to opt in for a resource, then each party must independently develop a resource to provide the
combined system with that party’s load ratio share of the capacity shortfall that was identified in the
generation expansion plan. As Central is currently 72% of the Santee Cooper system’s firm demand,
Central would be required to provide the combined system with approximately 72% of the identified
capacity shortfall if a proposed shared resource is not jointly approved.
Santee Cooper has publicly committed to retiring Winyah Generating Station units 3 and 4 in 2023 and
units 1 and 2 in 2027. These retirements will reduce system capacity by 1150 MW (winter), creating a
need for new capacity. Central and Santee Cooper will develop a new generation expansion plan to fill the
gap left in Santee Cooper’s capacity mix caused by the retirement of Winyah Station. It is currently difficult
for Central staff to predict the outcome of this joint effort. Consequently, Central’s load ratio share of the
capacity shortfall will be listed as an open position. As the Duke PPA unwinds between January 2029 and
the end of 2030, the load formerly served under that agreement will also be a part of Central’s open
position.
Central is a winter peaking system, so planning for the winter peak will always be a key driver of Central
and its member‐cooperatives’ capacity needs. In Figure 6‐1, Central’s balance of loads and resources
shows member‐cooperatives’ winter capacity needs and the expected sources of that capacity, namely
Santee Cooper, Duke, and the open position.
Page | 63
Figure 6-1: Central Electric Balance of Loads and Resources (MW)
The resource plans detailed in this IRP are designed to fill this open position. Central intends to develop a
blended portfolio of demand‐side management, renewable resources, conventional central station
generation, and power purchase agreements to create a portfolio of resources capable of serving Central’s
member‐cooperatives with reliable, low‐cost power. Central’s continuing mission will be to manage this
portfolio of resources in the best interests of its member‐cooperatives.
6.1 Southeast Regional Transmission Organization Potential
The adaptation of emerging technology, economic efficiencies, and regulatory initiatives refocuses
attention toward achieving more affordable, reliable, safe, and sustainable electricity. Regional
transmission organizations (RTOs) and other Independent System Operators (ISOs) operate the
transmission delivery network and facilitate the business of buying and selling power. Each market and
region has a distinct design and structure through which customer value can be derived. An important
function of an RTO is to dispatch generating plants on a lowest cost basis across a wider pool, creating
savings for customers.
The majority of the United States’ electricity users are serviced by seven ISOs or RTOs, while the Southeast
region of the country operates without an organized wholesale electricity marketplace. In recent years,
there have been studies and discussions on the impacts of forming one in the Southeast. The formation
of an organized marketplace in the Southeast could facilitate greater competition and transparency for
‐
1,000
2,000
3,000
4,000
5,000
6,000
2021 2023 2025 2027 2029 2031 2033 2035 2037 2039
Central Electric Power Cooperative Balance of Loads and Resources (MW)
Santee Cooper Shared Resources Duke PPA
Central Open Position Peak Demand
Page | 64
energy, capacity, and ancillary services transactions, which could result in net economic savings and fewer
concerns with building new generators that become stranded assets.
Recent studies of a Southeast regional market demonstrate cumulative economic savings for the entire
Southeast, but the assumptions and conclusions of these reports will need further analysis as part of the
South Carolina legislature’s recently passed law forming the “Electricity Market Reform Measures Study
Committee.” This committee will deliver a report in late 2021 describing the committee’s assessment of
electricity market reform options, the value to consumers of those options, and establishing next steps
for the state of South Carolina.
6.2 Reliability Considerations The overarching objective of this IRP is to reliably and economically meet forecasted annual peak demand
and energy and to establish reserves above the shortfalls demonstrated in the previous sections. Upon
the full retirement of the Winyah Generating Station, Central plans to achieve adequate reserves with the
addition of new capacity. Reliability implications differ between a large 2 x 1 combined cycle generator
and multiple generators that equal the same capacity. Large generating units within a system can
contribute a significant portion of an area’s capacity reserves, but load‐serving capability diminishes
rapidly when a large unit is forced offline or taken out of service. The loss of a single or multiple large
unit(s) would reduce reserves in an instant and may potentially compromise reliability. The loss probability
of one large unit versus multiple units differs significantly.
6.2.1 Planning Reserve Margin
The planning reserve margin (PRM) is a metric that represents the amount of generation capacity available
to meet the forecasted load in the planning period. Alternatively stated, planning reserve margin is the
percentage difference in projected resource availability over/above the net demand. Projected planning
reserve margins can be determined with probabilistic models that measure the uncertainty of resource
delivery as compared to net demand. “Net demand” is the total internal demand minus dispatchable,
controllable demand used to reduce load. This measurement indicates the capacity available above the
uncertainty in demand for the planning horizon. This measurement is capacity‐based and does not provide
an indication of energy adequacy.
6.2.2 Effective Load Carrying Capability
The effective load carrying capability (ELCC) of a generating resource represents its probabilistic capacity
contribution as a percentage of its nameplate capacity. Most thermal generators are attributed a high
percentage ELCC due to their likely availability to generate when called upon, typical of the unit’s capacity
and forced outage rate. Solar and wind generators are attributed ELCC based upon their time of delivery
due to their variable and intermittent nature. Their contribution to utility peak demand is dependent on
the uncontrollable factor of sunshine and wind. ELCC decreases as variable generation increases, the
impact to peak demand shifts, and overall reduction diminishes.
6.2.3 Probabilistic Loss of Load
Loss of load probability (LOLP) is a metric of resource adequacy that can be calculated with the use of a
detailed model that measures the hourly risk of load not being served. The measurement considers hourly
projected load and compares it to generation capacity and generation forced outage rate. LOLP measures

Page | 65
the risk associated with insufficient generation to meet hourly load requirements. LOLP does not measure
the amount of unmet demand or the duration that the demand is not met.
Loss of load expectation (LOLE) is a reliability metric that seeks to determine the amount of capacity
needed to operate a reliable system without numerous shortages. LOLE is an annual measure of resource
adequacy converted from the product of hourly LOLP. For the calculations of LOLE to be performed, the
generators of a given system are analyzed by combining their capacity profiles, scheduled outages, and
probability of generator forced outages to determine how many days in a year a shortage could occur.
The historically accepted industry target for LOLE is to remain below 1 day in 10 years.
In a survey of load serving entities, North American Electric Reliability Corporation (NERC) observed that
most entities in North America performed resource adequacy studies primarily using LOLE. While it has
been a matter of judgement between regions and assessment areas as to the methodology used to
measure adequacy, the trend is that most recognize that emerging reliability issues may be assessed with
probabilistic models. The LOLE of any system can be lowered by managing and reducing forced outages
rates. The replacement of larger units, equal in capacity, with smaller, flexible, and reliable generating
units will maintain PRM while reducing LOLE. In a wider interconnected system, additional reliability gains
can be measured through the accounting of neighboring utility support. Reserve sharing programs serve
to minimize loss of load probability resulting in increased reliability.
6.2.4 IRP Reserve Margin As explained above, important measures of reliability are planning reserve margin (PRM) and loss of load
expectation (LOLE), and the relationship between them should be noted when assessing system reliability.
NERC references 15% and 10% PRM to mostly thermal and mostly hydro‐electric systems, respectively,
when regional and sub‐regional specific margin calculations are not provided. Coupled with probabilistic
analysis, the PRM is a standard used by planners to measure adequacy. NERC guidance is provided to SERC
Reliability Corporation (SERC) and the other coordinating regions. The individual coordinating regions
provide further guidance and/or requirements to the balancing authorities.
Consistent with Santee Cooper’s application of planning reserves, this IRP targets planning reserve
margins of 12% and 15% for the winter and summer months, respectively.

Page | 66
6.3 Santee Cooper Balancing Authority
If Central declines to opt into a Proposed Shared Resource resulting from the Santee Cooper‐led joint
generation expansion process, Central is obligated to provide capacity to the Santee Cooper system if
existing resources are insufficient to maintain the required reserve margins. Figure 6‐2 includes an
overview of the existing Coordination Agreement’s contractual requirements related to generation
resource requirements in the Santee Cooper BAA.
Figure 6-2: Santee Cooper BAA Capacity Position
Santee Cooper BAA Capacity Position (MW)
Year Base Case High Load Low Load
2020 ‐ ‐ ‐
2021 ‐ ‐ ‐
2022 ‐ ‐ ‐
2023 12 168 ‐
2024 33 208 ‐
2025 44 228 ‐
2026 99 302 ‐
2027 529 774 359
2028 566 843 377
2029 494 818 294
2030 520 877 302
2031 547 937 311
2032 577 1,001 324
2033 604 1,064 334
2034 632 1,129 347
2035 661 1,196 359
2036 696 1,269 378
2037 726 1,340 391
2038 761 1,416 408
2039 796 1,498 427
2040 857 1,569 443

Page | 67
6.4 Duke Balancing Authority
Central’s current all‐requirements contract with Duke features a three‐year ramp down prior to the
contract’s end date of December 31, 2030. Figure 6‐3 includes an overview of the existing PPA’s
contractual requirements related to generation resource requirements in the Duke BAA.
Figure 6-3: Duke BAA Capacity Position
Duke BAA Capacity Position
Year Duke PPA Coverage
Duke BAA Capacity Shortfall
Base Case High Load Low Load
2020 100% ‐ ‐ ‐
2021 100% ‐ ‐ ‐
2022 100% ‐ ‐ ‐
2023 100% ‐ ‐ ‐
2024 100% ‐ ‐ ‐
2025 100% ‐ ‐ ‐
2026 100% ‐ ‐ ‐
2027 100% ‐ ‐ ‐
2028 100% ‐ ‐ ‐
2029 66.7% 362 384 335
2030 33.3% 731 783 676
2031 ‐ 1,110 1,197 1,020
2032 ‐ 1,124 1,219 1,027
2033 ‐ 1,136 1,243 1,032
2034 ‐ 1,149 1,267 1,038
2035 ‐ 1,163 1,292 1,045
2036 ‐ 1,178 1,317 1,053
2037 ‐ 1,192 1,346 1,059
2038 ‐ 1,206 1,374 1,066
2039 ‐ 1,221 1,404 1,073
2040 ‐ 1,237 1,432 1,081

Page | 68
6.5 Central Resource Planning Process
Central designed a process for its IRP analyses to determine the most cost‐effective resource portfolios
for the 20‐year study period. The key steps were as follows:
1. Inputs and assumptions were developed that define important variables.
2. Capacity expansion modeling was performed to identify lowest cost portfolios under different
sets of resource constraints and with variations in key inputs and assumptions.
3. These portfolios were analyzed and reduced to a meaningful but manageable number for more
detailed analysis.
4. Production cost modeling was conducted on the remaining portfolios for detailed cost,
operational, and sensitivity analysis.
5. The top 10 portfolios were then selected and represented a diverse set of cost‐effective
portfolios.
Figure 6‐4 is a high‐level illustration of these key process steps, which are described in more detail within this section
Figure 6-4: Central IRP Process

Page | 69
6.6 Study Inputs and Assumptions
The first step in resource planning is to identify study inputs and assumptions with an emphasis on those
that impact the cost‐effectiveness of resource portfolios. For example, the projected price of natural gas
is an important input assumption that affects the cost‐effectiveness of potential future resources. Central
categorized input assumptions into the following categories:
New Generation Resources (Cost and Operational Performance)
o Thermal Generation Options
o Renewable Generation and Energy Storage Options
Power Purchase Options
Electric Transmission Investments
Load
Fuel (Commodity Prices and Transportation Costs)
Renewables Integration
Demand‐Side Management
Environmental Regulations
Financial Assumptions
In addition to the base case assumptions for these inputs, the analysis included sensitivities or variations
in these input assumptions, such as a high natural gas price and low natural gas price. The sections below
highlight the input assumptions used for capacity expansion scenarios and sensitivities.
6.6.1 Technical Assessment of New Generation Resources
Technology assumptions for new resources are a critical component of a capacity expansion plan. A typical
assessment is comprised of planning‐level assumptions for cost (Capital, Operations & Maintenance) and
performance characteristics. The assessment for new resources to satisfy future capacity and energy
needs in this expansion plan was split into two main technology categories: thermal and renewable. The
thermal unit technology assessments were performed for various peaking and combined cycle
technologies. Peaking generation is designed to produce power for relatively brief periods of time.
Combined cycle generators are baseload generation, which are expected to operate around the clock.
The renewable technologies consisted of offshore wind, solar, and battery storage.
6.6.2 Thermal Technology
The thermal unit technology assessments were separated into two main groups: peaking and combined
cycle technologies. There were six peaking technology assessments and four combined cycle technology
assessments.
6.6.3 Peaking Technology
Simple cycle gas turbine (SCGT) technology produces power in a gas turbine generator and is typically
used for peaking power due to fast load ramp rates and relatively low capital costs. These units have high
heat rates compared to combined cycle technologies. Heat rate is a measure of efficiency; it relates the
amount of energy (thermal) consumed to the amount of electricity generated. All peaking technology
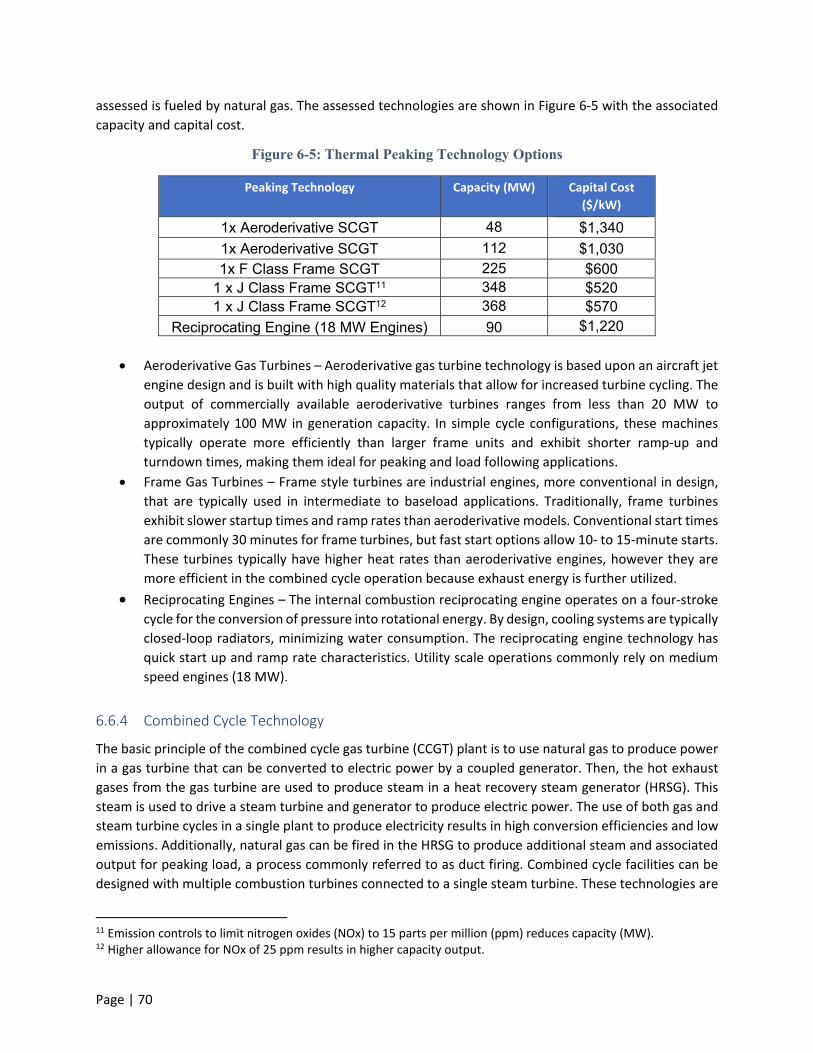
Page | 70
assessed is fueled by natural gas. The assessed technologies are shown in Figure 6‐5 with the associated
capacity and capital cost.
Figure 6-5: Thermal Peaking Technology Options
Peaking Technology Capacity (MW) Capital Cost
($/kW)
1x Aeroderivative SCGT 48 $1,340
1x Aeroderivative SCGT 112 $1,030 1x F Class Frame SCGT 225 $600
1 x J Class Frame SCGT11 348 $520 1 x J Class Frame SCGT12 368 $570
Reciprocating Engine (18 MW Engines) 90 $1,220
Aeroderivative Gas Turbines – Aeroderivative gas turbine technology is based upon an aircraft jet
engine design and is built with high quality materials that allow for increased turbine cycling. The
output of commercially available aeroderivative turbines ranges from less than 20 MW to
approximately 100 MW in generation capacity. In simple cycle configurations, these machines
typically operate more efficiently than larger frame units and exhibit shorter ramp‐up and
turndown times, making them ideal for peaking and load following applications.
Frame Gas Turbines – Frame style turbines are industrial engines, more conventional in design,
that are typically used in intermediate to baseload applications. Traditionally, frame turbines
exhibit slower startup times and ramp rates than aeroderivative models. Conventional start times
are commonly 30 minutes for frame turbines, but fast start options allow 10‐ to 15‐minute starts.
These turbines typically have higher heat rates than aeroderivative engines, however they are
more efficient in the combined cycle operation because exhaust energy is further utilized.
Reciprocating Engines – The internal combustion reciprocating engine operates on a four‐stroke
cycle for the conversion of pressure into rotational energy. By design, cooling systems are typically
closed‐loop radiators, minimizing water consumption. The reciprocating engine technology has
quick start up and ramp rate characteristics. Utility scale operations commonly rely on medium
speed engines (18 MW).
6.6.4 Combined Cycle Technology
The basic principle of the combined cycle gas turbine (CCGT) plant is to use natural gas to produce power
in a gas turbine that can be converted to electric power by a coupled generator. Then, the hot exhaust
gases from the gas turbine are used to produce steam in a heat recovery steam generator (HRSG). This
steam is used to drive a steam turbine and generator to produce electric power. The use of both gas and
steam turbine cycles in a single plant to produce electricity results in high conversion efficiencies and low
emissions. Additionally, natural gas can be fired in the HRSG to produce additional steam and associated
output for peaking load, a process commonly referred to as duct firing. Combined cycle facilities can be
designed with multiple combustion turbines connected to a single steam turbine. These technologies are
11 Emission controls to limit nitrogen oxides (NOx) to 15 parts per million (ppm) reduces capacity (MW). 12 Higher allowance for NOx of 25 ppm results in higher capacity output.
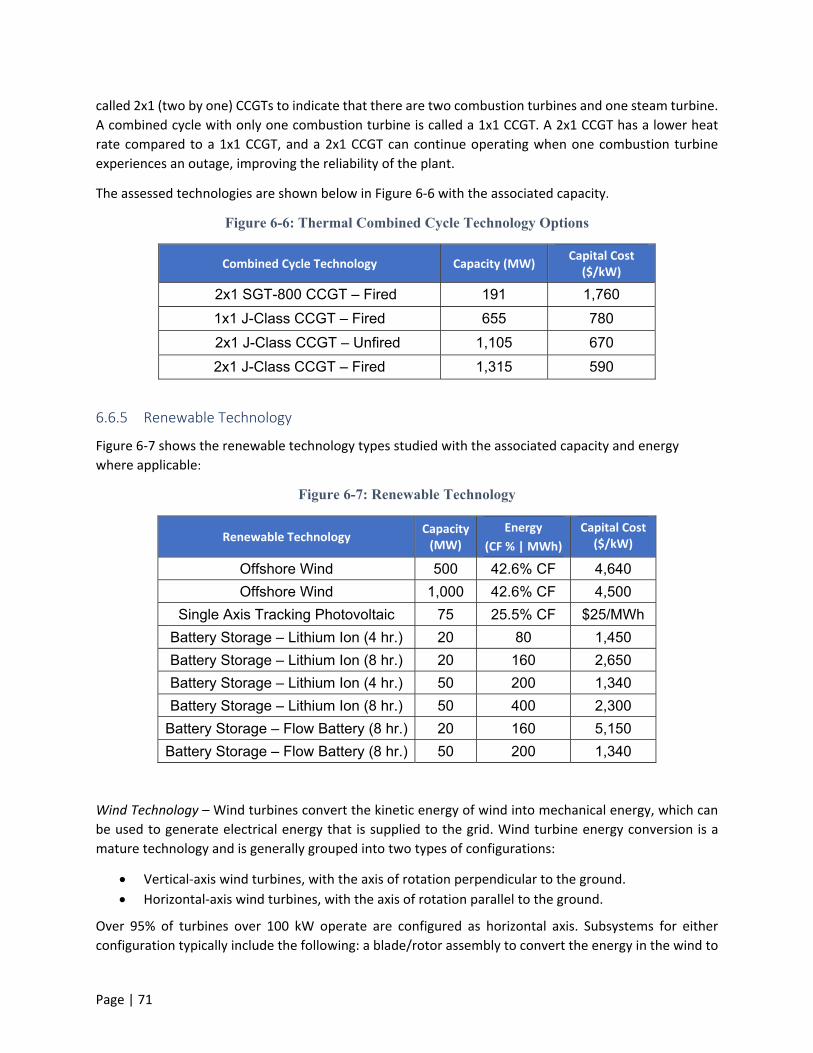
Page | 71
called 2x1 (two by one) CCGTs to indicate that there are two combustion turbines and one steam turbine.
A combined cycle with only one combustion turbine is called a 1x1 CCGT. A 2x1 CCGT has a lower heat
rate compared to a 1x1 CCGT, and a 2x1 CCGT can continue operating when one combustion turbine
experiences an outage, improving the reliability of the plant.
The assessed technologies are shown below in Figure 6‐6 with the associated capacity.
Figure 6-6: Thermal Combined Cycle Technology Options
6.6.5 Renewable Technology
Figure 6‐7 shows the renewable technology types studied with the associated capacity and energy
where applicable:
Figure 6-7: Renewable Technology
Renewable Technology Capacity (MW)
Energy
(CF % | MWh)
Capital Cost ($/kW)
Offshore Wind 500 42.6% CF 4,640
Offshore Wind 1,000 42.6% CF 4,500
Single Axis Tracking Photovoltaic 75 25.5% CF $25/MWh
Battery Storage – Lithium Ion (4 hr.) 20 80 1,450
Battery Storage – Lithium Ion (8 hr.) 20 160 2,650
Battery Storage – Lithium Ion (4 hr.) 50 200 1,340
Battery Storage – Lithium Ion (8 hr.) 50 400 2,300
Battery Storage – Flow Battery (8 hr.) 20 160 5,150
Battery Storage – Flow Battery (8 hr.) 50 200 1,340
Wind Technology – Wind turbines convert the kinetic energy of wind into mechanical energy, which can
be used to generate electrical energy that is supplied to the grid. Wind turbine energy conversion is a
mature technology and is generally grouped into two types of configurations:
Vertical‐axis wind turbines, with the axis of rotation perpendicular to the ground.
Horizontal‐axis wind turbines, with the axis of rotation parallel to the ground.
Over 95% of turbines over 100 kW operate are configured as horizontal axis. Subsystems for either
configuration typically include the following: a blade/rotor assembly to convert the energy in the wind to
Combined Cycle Technology Capacity (MW) Capital Cost ($/kW)
2x1 SGT-800 CCGT – Fired 191 1,760
1x1 J-Class CCGT – Fired 655 780
2x1 J-Class CCGT – Unfired 1,105 670
2x1 J-Class CCGT – Fired 1,315 590
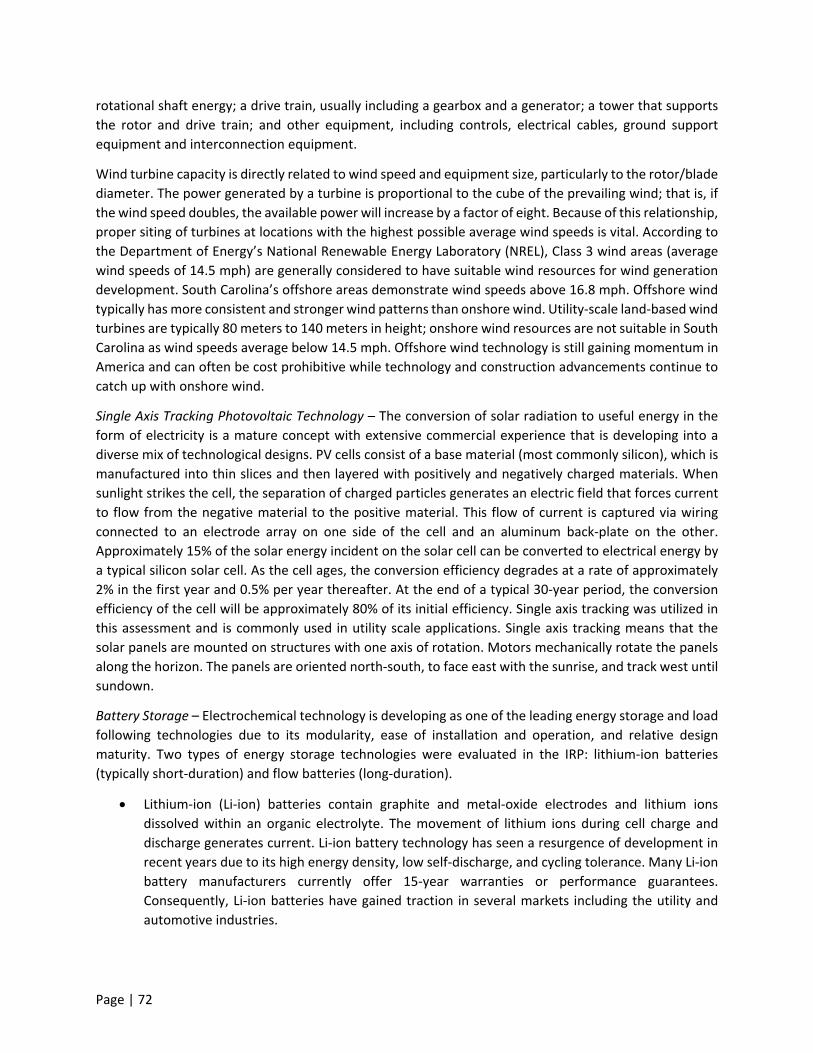
Page | 72
rotational shaft energy; a drive train, usually including a gearbox and a generator; a tower that supports
the rotor and drive train; and other equipment, including controls, electrical cables, ground support
equipment and interconnection equipment.
Wind turbine capacity is directly related to wind speed and equipment size, particularly to the rotor/blade
diameter. The power generated by a turbine is proportional to the cube of the prevailing wind; that is, if
the wind speed doubles, the available power will increase by a factor of eight. Because of this relationship,
proper siting of turbines at locations with the highest possible average wind speeds is vital. According to
the Department of Energy’s National Renewable Energy Laboratory (NREL), Class 3 wind areas (average
wind speeds of 14.5 mph) are generally considered to have suitable wind resources for wind generation
development. South Carolina’s offshore areas demonstrate wind speeds above 16.8 mph. Offshore wind
typically has more consistent and stronger wind patterns than onshore wind. Utility‐scale land‐based wind
turbines are typically 80 meters to 140 meters in height; onshore wind resources are not suitable in South
Carolina as wind speeds average below 14.5 mph. Offshore wind technology is still gaining momentum in
America and can often be cost prohibitive while technology and construction advancements continue to
catch up with onshore wind.
Single Axis Tracking Photovoltaic Technology – The conversion of solar radiation to useful energy in the
form of electricity is a mature concept with extensive commercial experience that is developing into a
diverse mix of technological designs. PV cells consist of a base material (most commonly silicon), which is
manufactured into thin slices and then layered with positively and negatively charged materials. When
sunlight strikes the cell, the separation of charged particles generates an electric field that forces current
to flow from the negative material to the positive material. This flow of current is captured via wiring
connected to an electrode array on one side of the cell and an aluminum back‐plate on the other.
Approximately 15% of the solar energy incident on the solar cell can be converted to electrical energy by
a typical silicon solar cell. As the cell ages, the conversion efficiency degrades at a rate of approximately
2% in the first year and 0.5% per year thereafter. At the end of a typical 30‐year period, the conversion
efficiency of the cell will be approximately 80% of its initial efficiency. Single axis tracking was utilized in
this assessment and is commonly used in utility scale applications. Single axis tracking means that the
solar panels are mounted on structures with one axis of rotation. Motors mechanically rotate the panels
along the horizon. The panels are oriented north‐south, to face east with the sunrise, and track west until
sundown.
Battery Storage – Electrochemical technology is developing as one of the leading energy storage and load
following technologies due to its modularity, ease of installation and operation, and relative design
maturity. Two types of energy storage technologies were evaluated in the IRP: lithium‐ion batteries
(typically short‐duration) and flow batteries (long‐duration).
Lithium‐ion (Li‐ion) batteries contain graphite and metal‐oxide electrodes and lithium ions
dissolved within an organic electrolyte. The movement of lithium ions during cell charge and
discharge generates current. Li‐ion battery technology has seen a resurgence of development in
recent years due to its high energy density, low self‐discharge, and cycling tolerance. Many Li‐ion
battery manufacturers currently offer 15‐year warranties or performance guarantees.
Consequently, Li‐ion batteries have gained traction in several markets including the utility and
automotive industries.

Page | 73
Li‐ion battery prices are trending downward, and continued development and investment by
manufacturers are expected to further reduce production costs. While there is still a wide
range of project cost expectations due to market uncertainty, Li‐ion batteries are anticipated
to expand their reach into the utility sector.
Flow batteries use an electrode cell stack with externally stored electrolyte material. The flow
battery is comprised of positive and negative electrode cell stacks separated by a selectively
permeable ion exchange membrane, in which the charge‐inducing chemical reaction occurs,
and liquid electrolyte storage tanks, which hold the stored energy until discharge is required.
Various control and pumped circulation systems complete the flow battery system, in which
the cells can be stacked in series to achieve the desired voltage difference.
The battery is charged as the liquid electrolytes are pumped through the electrode cell stacks,
which serve only as a catalyst and transport medium to the ion‐inducing chemical reaction.
The excess positive ions at the anode are allowed through the ion‐selective membrane to
maintain electroneutrality at the cathode, which experiences a buildup of negative ions. The
charged electrolyte solution is circulated back to storage tanks until the process is allowed to
repeat in reverse for discharge as necessary.
In addition to external electrolyte storage, flow batteries differ from traditional batteries in
that energy conversion occurs as a direct result of the reduction‐oxidation reactions occurring
in the electrolyte solution itself. The electrode is not a component of the electrochemical fuel
and does not participate in the chemical reaction. Therefore, the electrodes are not subject
to the same deterioration that depletes electrical performance of traditional batteries,
resulting in high cycling life of the flow battery. Flow batteries are also scalable such that
energy storage capacity is determined by the size of the electrolyte storage tanks, allowing
the system to approach its theoretical energy density. Flow batteries are typically less capital
intensive than some conventional batteries but require additional installation and operation
costs associated with balance of plant equipment.
The key cost elements of a battery system are the inverter, the battery cells, the interconnection,
and the installation. The capital costs include engineering, procurement, and construction (EPC)
costs plus owner’s cost, which reflect recent trends for capacity overbuild to account for short‐
term degradation. It is also assumed that the system will be co‐located with an existing asset or
in close proximity to existing infrastructure. Consistent with recent trends, the capital costs of
battery storage installations are expected to continue declining through the end of the decade,
with installation costs expected to fall approximately 20% by 2030. Figure 6‐8 contains indicative
Base and Aggressive cost curves applied to battery storage technologies in this analysis.

Page | 74
Figure 6-8: Battery Storage Cost Projections (50MW-4hr Li-Ion Example)
6.6.6 Power Purchase Agreements (PPAs)
Central solicited and received indicative PPA offers from multiple entities. The PPAs received varied in
options from unit contingent power to full‐requirement options. The PPA options include the ability to
purchase power from existing simple cycle and combined cycle power plants along with options to
purchase power from new combined cycle plants. Figure 6‐9 shows the PPA associated technologies and
nameplate capacity.
Figure 6-9: Power Purchase Agreements
PPA Technology Capacity (MW)
Baseload 250 – 1000
Peaking 150 – 250
Full-Requirements 400 – 1200
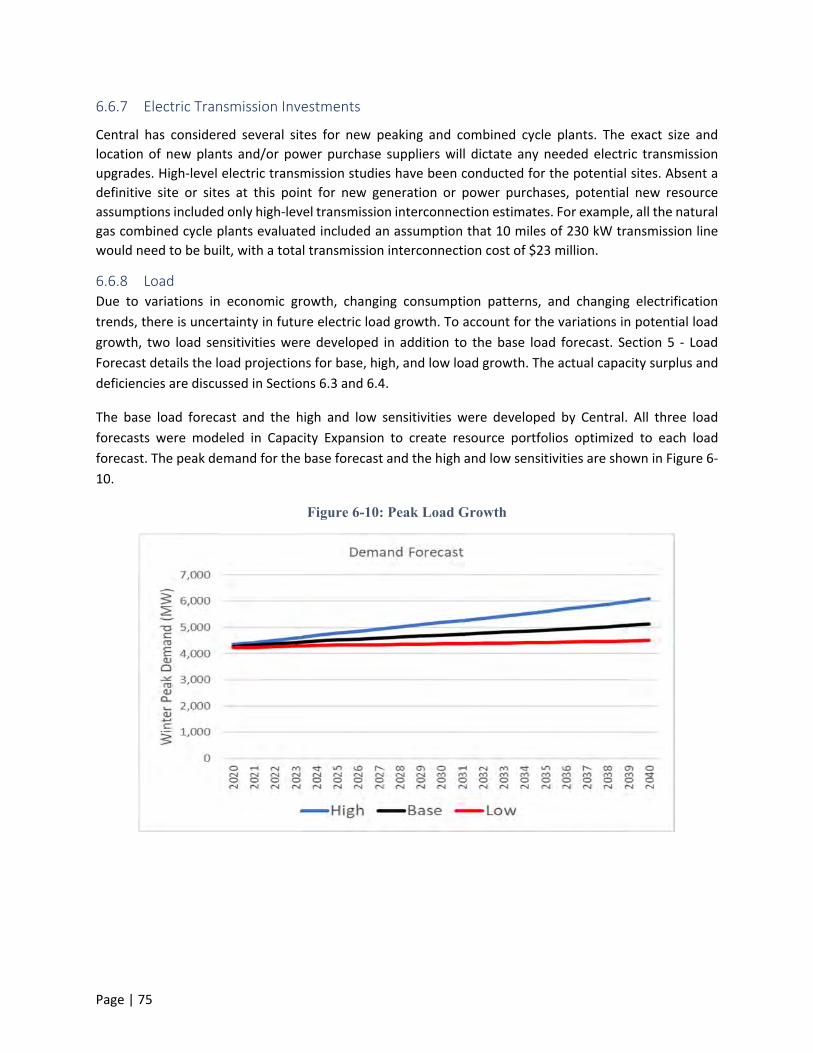
Page | 75
6.6.7 Electric Transmission Investments
Central has considered several sites for new peaking and combined cycle plants. The exact size and
location of new plants and/or power purchase suppliers will dictate any needed electric transmission
upgrades. High‐level electric transmission studies have been conducted for the potential sites. Absent a
definitive site or sites at this point for new generation or power purchases, potential new resource
assumptions included only high‐level transmission interconnection estimates. For example, all the natural
gas combined cycle plants evaluated included an assumption that 10 miles of 230 kW transmission line
would need to be built, with a total transmission interconnection cost of $23 million.
6.6.8 Load Due to variations in economic growth, changing consumption patterns, and changing electrification
trends, there is uncertainty in future electric load growth. To account for the variations in potential load
growth, two load sensitivities were developed in addition to the base load forecast. Section 5 ‐ Load
Forecast details the load projections for base, high, and low load growth. The actual capacity surplus and
deficiencies are discussed in Sections 6.3 and 6.4.
The base load forecast and the high and low sensitivities were developed by Central. All three load
forecasts were modeled in Capacity Expansion to create resource portfolios optimized to each load
forecast. The peak demand for the base forecast and the high and low sensitivities are shown in Figure 6‐
10.
Figure 6-10: Peak Load Growth

Page | 76
The energy forecast for the base assumptions and high/low sensitivities is shown in Figure 6‐11.
Figure 6-11: Energy Growth

Page | 77
6.6.9 Fuel Discussions were held with multiple companies to determine natural gas transportation options including
necessary infrastructure requirements and associated pricing. Based upon this information and absent a
definitive site for a new gas plant, a high‐level assumption for natural gas transportation costs was
included in the analysis. New York Mercantile Exchange (NYMEX) Henry Hub was assumed to be the
source of the natural gas supply. Historically, natural gas prices have experienced volatility that is often
difficult to predict. To account for the volatility that may be present over the study time horizon, two
sensitivities were developed beyond the base scenario. Stochastic distributions for the natural gas prices
were developed and were used to frame the high and low gas prices sensitivities. Figure 6‐12 shows an
annual average commodity price that was modeled for the base natural gas forecast and the high and low
sensitivities.
Figure 6-12: Natural Gas Commodity Price Forecast

Page | 78
6.6.10 Renewables Integration
Renewable energy has been a quickly advancing field and has gathered support due its competitive pricing
and lower environmental impact relative to thermal energy generators. With uncertainty surrounding tax
laws, technology costs, and effective load carrying capability, two renewable sensitivities were developed
beyond the base case. The base case provided the availability to commission up to 225 MW of additional
solar during the study period. Integrating solar can be challenging due to its highly intermittent nature,
and Santee Cooper and Duke Energy Carolinas would be responsible for managing solar integration as
balancing authorities. The costs of integration, however, would be passed on to Central. The high case
provided the availability to commission up to 450 MW of additional solar during the study period. The low
case provided the availability to commission 150 MW of additional solar during the study period. Central
believes that these incremental additions of solar are technically and economically viable. Studies would
need to be conducted to ensure grid reliability before incremental solar above these levels can be
considered.
Figure 6‐13 shows the estimated annual energy generated by solar PV for the high, base, and low cases
of 450 MW, 225 MW and 150 MW, respectively. Modeling for solar PV was represented in 75 MW blocks,
so generation for 75 MW of solar is also shown.
Figure 6-13: Incremental Annual Solar Generation Estimate
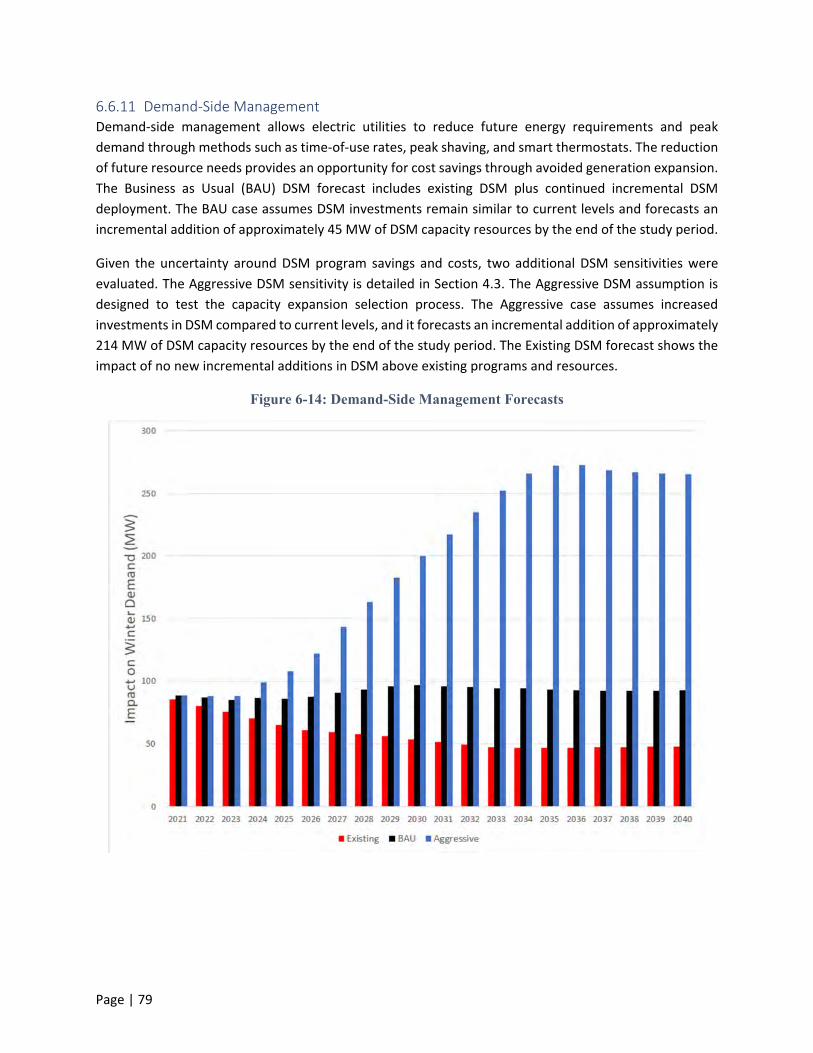
Page | 79
6.6.11 Demand‐Side Management Demand‐side management allows electric utilities to reduce future energy requirements and peak
demand through methods such as time‐of‐use rates, peak shaving, and smart thermostats. The reduction
of future resource needs provides an opportunity for cost savings through avoided generation expansion.
The Business as Usual (BAU) DSM forecast includes existing DSM plus continued incremental DSM
deployment. The BAU case assumes DSM investments remain similar to current levels and forecasts an
incremental addition of approximately 45 MW of DSM capacity resources by the end of the study period.
Given the uncertainty around DSM program savings and costs, two additional DSM sensitivities were
evaluated. The Aggressive DSM sensitivity is detailed in Section 4.3. The Aggressive DSM assumption is
designed to test the capacity expansion selection process. The Aggressive case assumes increased
investments in DSM compared to current levels, and it forecasts an incremental addition of approximately
214 MW of DSM capacity resources by the end of the study period. The Existing DSM forecast shows the
impact of no new incremental additions in DSM above existing programs and resources.
Figure 6-14: Demand-Side Management Forecasts
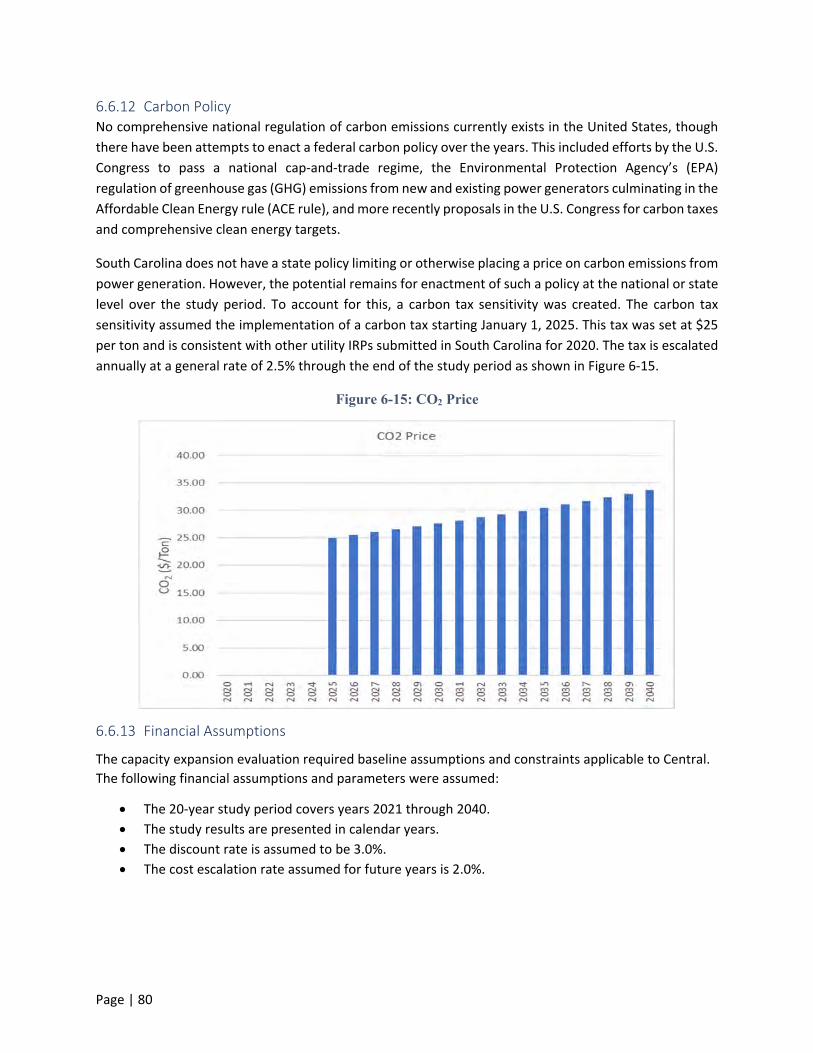
Page | 80
6.6.12 Carbon Policy No comprehensive national regulation of carbon emissions currently exists in the United States, though
there have been attempts to enact a federal carbon policy over the years. This included efforts by the U.S.
Congress to pass a national cap‐and‐trade regime, the Environmental Protection Agency’s (EPA)
regulation of greenhouse gas (GHG) emissions from new and existing power generators culminating in the
Affordable Clean Energy rule (ACE rule), and more recently proposals in the U.S. Congress for carbon taxes
and comprehensive clean energy targets.
South Carolina does not have a state policy limiting or otherwise placing a price on carbon emissions from
power generation. However, the potential remains for enactment of such a policy at the national or state
level over the study period. To account for this, a carbon tax sensitivity was created. The carbon tax
sensitivity assumed the implementation of a carbon tax starting January 1, 2025. This tax was set at $25
per ton and is consistent with other utility IRPs submitted in South Carolina for 2020. The tax is escalated
annually at a general rate of 2.5% through the end of the study period as shown in Figure 6‐15.
Figure 6-15: CO2 Price
6.6.13 Financial Assumptions
The capacity expansion evaluation required baseline assumptions and constraints applicable to Central.
The following financial assumptions and parameters were assumed:
The 20‐year study period covers years 2021 through 2040.
The study results are presented in calendar years.
The discount rate is assumed to be 3.0%.
The cost escalation rate assumed for future years is 2.0%.

Page | 81
6.7 Capacity Expansion Modeling
Once inputs and assumptions are finalized, the next critical step of the IRP process is initiated. The purpose
of the capacity expansion modeling process is to identify cost‐effective resource portfolios to meet the
capacity and energy system requirements.
The complete retirement of the Winyah Generating Station in 2027 results in significant capacity shortfall
in the form of an open position for Central in the Santee Cooper balancing authority. The need for capacity
and energy is compounded when the Duke PPA expires in 2030. This shortfall of capacity and energy will
need to be filled with new generation resource options that could include PPAs.
Figure 6‐17 illustrates the magnitude of capacity shortfall to be investigated and planned for in this IRP.
Figure 6-17: Load Forecast vs Existing Supply
The capacity expansion modeling process utilizes ABB’s Capacity Expansion model. The Capacity
Expansion model is an energy portfolio management software solution, which, under a given set of
assumptions, considers multiple resource combinations to minimize cost over a time horizon while
covering all system energy and capacity needs. The model identifies resource portfolios that have the
lowest present value of revenue requirements (PVRR) for consumers. PVRR, a proxy for end‐user cost,
captures the discounted present value of future costs. The costs for new resources, including capital
investment and production expenses such as fuel, are estimated in the PVRR for each portfolio. Ongoing
costs for existing plants and any credit from off‐system sales are included as well.
Initial capacity expansion modeling was performed using base input assumptions and without
constraining the types or combinations of resources that could be selected. For example, the model can
choose from resources such as large combined cycle units and individual simple cycle combustion turbine
units to create a portfolio that minimizes PVRR for a given set of input assumptions. The results
demonstrate preference for ownership of two new combined cycle (2x1) plants with the first installation

Page | 82
coincident to the Winyah Station retirement in 2027 and the second with the full expiration of the Duke
PPA at the end of 2030.
The lowest cost portfolio generated by this modeling has been selected to be used as a reference
(reference portfolio) for comparison with all other portfolios generated in the IRP process. The portfolio
with two new combined cycle plants has the lowest PVRR with base input assumptions; however, there is
significant risk in Central’s developing, constructing and owning projects of this magnitude. In addition,
this portfolio creates an overbuild of capacity for several years after the combined cycles come online, as
shown in the balance of loads and resources for the reference portfolio (shown in Figure 6‐19). Capacity
overbuild may be cost effective from a PVRR viewpoint (which discounts all future costs to the current
year), but PVRR does not recognize the significant initial rate impact of large capital additions. For these
reasons, while the portfolio with the large combined cycle plants is the reference portfolio, the IRP
analysis will study alternatives with an eye to reducing risk and with consideration of the rate impacts on
member‐owners.
Figure 6-19: Balance of Load and Resources - Reference Portfolio
6.7.1 Expansion Strategies
Based upon the results of this unconstrained modeling, four additional expansion strategies were
designed for evaluation with capacity expansion modeling. These expansion strategies apply limits on
what type of resources the modeling can choose. Here are the five expansion strategies:
1) Unconstrained Modeling (Unconstrained) – No constraints. Optimization modeling allows all new
generation technology and PPA options included in the technical assessment to be considered.

Page | 83
2) Partial CC Ownership Strategy (Partial CC) – The optimization modeling was constrained from
selecting full ownership of a combined cycle. Only 50% ownership of a single new 2x1 combined
cycle was allowed. Optimization modeling considers the balance of new generation technology
and PPA options as shown in the technical assessment.
3) No CC Ownership Strategy (No CC) – This case restrains the optimization model from selecting a
new combined cycle that is fully or even partially owned by Central. Base load needs must be met
with PPAs or other resources included in the technical assessment, such as simple cycle
combustion turbines.
4) Full Requirements PPA & Partial CC Strategy (Full Req & Partial CC) – The optimization model is
forced to select a full requirements PPA to serve all load in the Duke BAA upon expiration of the
Duke PPA. Also, this case constrains the model from selecting full ownership of a 2x1 combined
cycle and only allows the selection of a single partially owned combined cycle. All other resources
included in the technical assessment are available.
5) Full Requirements PPA & No CC Ownership Strategy (Full Req & No CC) – The model is forced to
select a full requirements PPA to serve all load in the Duke BAA upon the expiration of the Duke
PPA. Also, this case does not allow the selection of a combined cycle in the form of ownership.
Optimization modeling allows all other new generation technology and PPA options to be
considered.
6.7.2 Expansion Strategies Modeled with Base Input Assumptions
Capacity expansion modeling was then conducted on each of the four expansion strategy cases using base
input assumptions to identify the lowest cost portfolios that conformed to each strategy. A summary of
the lowest cost portfolios generated for each expansion strategy is listed below and depicted in Figure 6‐
21. A chart of the portfolio PVRRs is shown in Figure 6‐22.
Partial CC Ownership Strategy – The model chooses a PPA that is tied to a new combined cycle in
2027 and elects to build a 2x1 combined cycle that is 50% owned by Central in 2031. Two simple cycle
combustion turbines are also built in 2031. The PVRR of this portfolio is 2.0% higher than the reference
portfolio.
No CC Ownership Strategy – The model chooses a PPA that is tied to a new combined cycle in 2027
and builds a large amount of combustion turbines in 2031. The PVRR of this portfolio is 3.9% higher
than the reference portfolio.
Full Requirements PPA & Partial CC Strategy – The model builds a 2x1 combined cycle that is 50%
owned by Central in 2027. The full requirements PPA begins in 2029. A simple cycle combustion
turbine is built in 2031. The PVRR of this portfolio is 7.1% higher than the reference portfolio.
Full Requirements PPA & No CC Ownership Strategy – This portfolio includes a PPA that is tied to a
new combined cycle in 2027 and the selection of two simple cycle combustion turbines in 2031. The
PVRR of this portfolio is 8.5% higher than the reference portfolio.
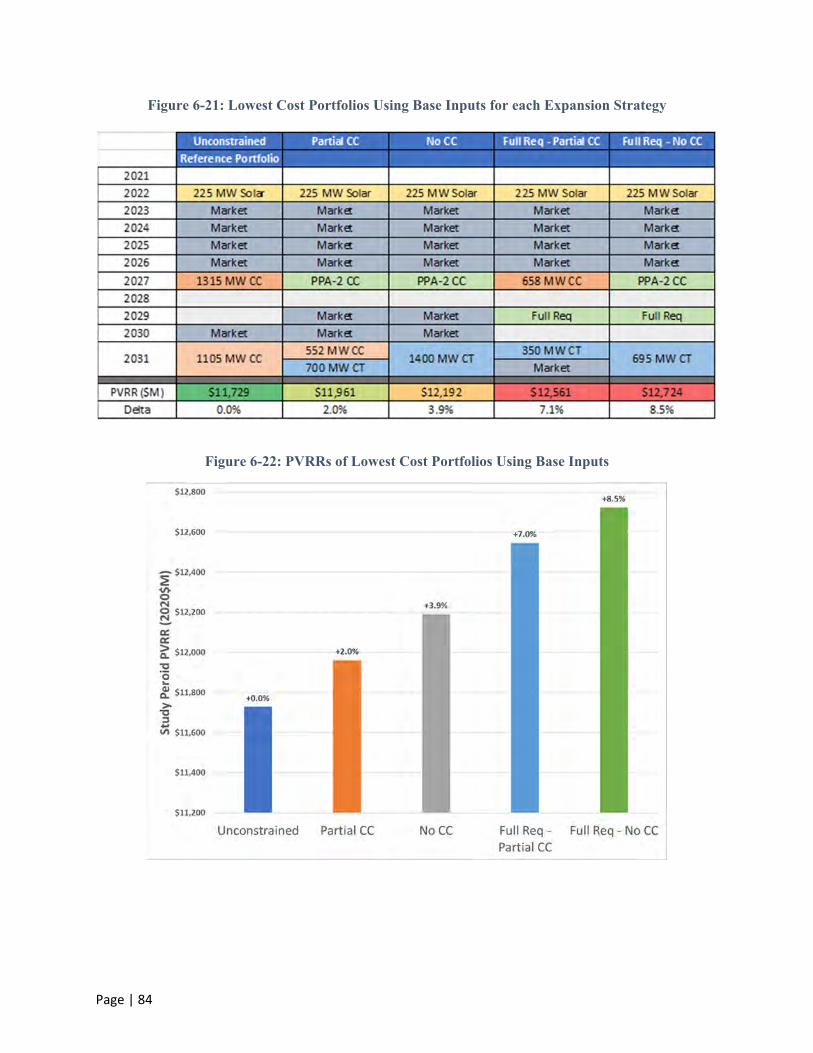
Page | 84
Figure 6-21: Lowest Cost Portfolios Using Base Inputs for each Expansion Strategy
Figure 6-22: PVRRs of Lowest Cost Portfolios Using Base Inputs

Page | 85
6.7.3 Scenario Analysis
An important step in the capacity expansion modeling process is to identify low cost portfolios that
perform well under a wide range of inputs and assumptions. Central modeled the five expansion strategy
cases by varying key inputs and assumptions. The following is a description of key inputs and assumptions
that are varied in the scenario analysis.
1) High Load – Central load demand is higher than forecasted, approximately 1,000 MW higher than
the Base forecast by 2040.
2) Low Load – Central load demand is lower than forecasted, approximately 600 MW lower than the
Base forecast by 2040.
3) High Fuel – Henry Hub natural gas prices remain above the Base price forecast and are slightly
higher than $8/MMBtu by 2040.
4) Low Fuel – Henry Hub natural gas prices remain below the Base price forecast and level off near
$3/MMBtu by 2040.
5) High Renewables – Up to 450 MW of solar is built, and the aggressive battery price forecast is
used.
6) Low Renewables – Solar is limited to 150 MW.
7) Aggressive DSM – DSM is incorporated beyond the BAU plan, reaching a total peak reduction of
247 MW by 2040.
8) Existing DSM – DSM is incorporated at current levels with no incremental DSM. Total peak
reduction falls to just below 50 MW by 2040.
9) Carbon – Carbon tax is incorporated for carbon emissions in this scenario. A carbon tax of $25/ton
is assumed for 2025 and escalates by 2% each year. The carbon tax for 2040 is approximately
$33/ton.
Capacity expansion modeling of all five expansion strategies with each of the scenarios listed above
results in 123 unique portfolios.
6.7.4 Custom Portfolios
After reviewing the modeling results from the original five expansion strategies and scenario analysis,
three custom portfolios were created for further analysis and consideration. One of the custom
portfolios included a high level of battery build‐out, and the other portfolios included both Aggressive
DSM and High Renewables.
6.8 Portfolio Screening
In the portfolio screening process, the 126 unique portfolios generated in the portfolio expansion process
are narrowed down to a meaningful but manageable number for more detailed analysis in the production
cost modeling process. The objective is to find portfolios that perform well in all the tested scenarios, not
simply to focus on strong performers in the Base case assumptions. Considerations for advancing
portfolios include PVRR, magnitude of potential capital expenditures, risk considerations, and ensuring a
diverse set of portfolios. This screening process resulted in 28 portfolios being promoted to the detailed
production cost modeling process.
Page | 86
6.9 Production Cost Modeling
The 28 portfolios that resulted from the capacity expansion modeling process are then modeled and
evaluated in hourly detail. ABB’s PROMOD production cost modeling software is used to conduct a more
detailed cost and operational analysis of the 28 portfolios. PROMOD simulates hourly regional generation
dispatch to meet electricity demand while using the most economical resources. Referred to as security‐
constrained economic dispatch, the model adheres to reliability constraints for generators and
transmission lines in the region.
In capacity expansion modeling, assumptions and resource options are the inputs, and portfolios are the
outputs. In production cost modeling, a single set of assumptions and a single portfolio are the inputs.
The output is total cost, which is summarized in this report as PVRR. The production cost model is run for
each portfolio under each set of assumptions identified in the sensitivity analysis. Production cost
modeling allows the evaluation of a single portfolio under a wide range of sets of assumptions for
comparison to other portfolios under the same sets of assumptions.
6.9.1 Sensitivity Analysis
The 28 selected portfolios are modeled and studied in detail with each portfolio modeled under base input
assumptions. Central also performed sensitivity analysis by modeling each portfolio while varying one
important input assumption at a time. The seven different sensitivities (sets of input assumptions) are as
follows:
High Load
Low Load
High Fuel
Low Fuel
Aggressive DSM
Existing DSM
Carbon Tax
6.9.2 Top 10 Portfolios Selection & Review
The results of the detailed production cost modeling using the base set of input assumptions and seven
sensitivities were analyzed to determine the top 10 portfolios. The top 10 portfolios were selected
primarily based upon their cost performance across the full range of sensitivities with consideration given
to ensuring a diverse set of portfolios was represented. The least cost portfolio remains the reference
portfolio, which includes full ownership of two 2x1 combined cycle plants. The second portfolio includes
the full ownership of one 2x1 combined cycle. The remaining eight portfolios restrict the addition of a full
combined cycle. All remaining eight portfolios include a combination of partial (50%) combined cycle
ownership, PPAs and other peaking resources. Four of the 10 portfolios include between 375 MW and
450 MWs of solar and two have significant battery storage additions. The top 10 portfolios ranked from
lowest PVRR to highest are shown in Figure 6‐43.
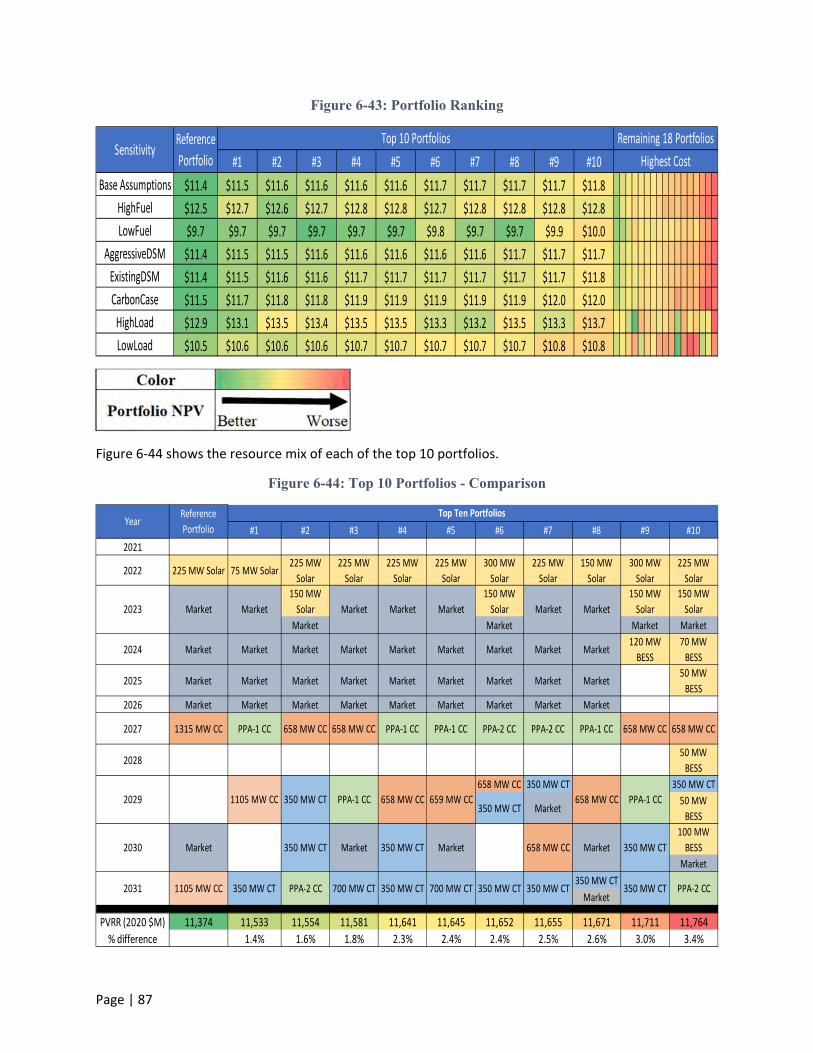
Page | 87
Figure 6-43: Portfolio Ranking
Figure 6‐44 shows the resource mix of each of the top 10 portfolios.
Figure 6-44: Top 10 Portfolios - Comparison
#1 #2 #3 #4 #5 #6 #7 #8 #9 #10
Base Assumptions $11.4 $11.5 $11.6 $11.6 $11.6 $11.6 $11.7 $11.7 $11.7 $11.7 $11.8
HighFuel $12.5 $12.7 $12.6 $12.7 $12.8 $12.8 $12.7 $12.8 $12.8 $12.8 $12.8
LowFuel $9.7 $9.7 $9.7 $9.7 $9.7 $9.7 $9.8 $9.7 $9.7 $9.9 $10.0
AggressiveDSM $11.4 $11.5 $11.5 $11.6 $11.6 $11.6 $11.6 $11.6 $11.7 $11.7 $11.7
ExistingDSM $11.4 $11.5 $11.6 $11.6 $11.7 $11.7 $11.7 $11.7 $11.7 $11.7 $11.8
CarbonCase $11.5 $11.7 $11.8 $11.8 $11.9 $11.9 $11.9 $11.9 $11.9 $12.0 $12.0
HighLoad $12.9 $13.1 $13.5 $13.4 $13.5 $13.5 $13.3 $13.2 $13.5 $13.3 $13.7
LowLoad $10.5 $10.6 $10.6 $10.6 $10.7 $10.7 $10.7 $10.7 $10.7 $10.8 $10.8
SensitivityTop 10 Portfolios Remaining 18 Portfolios
Highest Cost
Reference
Portfolio
#1 #2 #3 #4 #5 #6 #7 #8 #9 #10
2021
2022 225 MW Solar 75 MW Solar225 MW
Solar
225 MW
Solar
225 MW
Solar
225 MW
Solar
300 MW
Solar
225 MW
Solar
150 MW
Solar
300 MW
Solar
225 MW
Solar
150 MW
Solar
150 MW
Solar
150 MW
Solar
150 MW
Solar
Market Market Market Market
2024 Market Market Market Market Market Market Market Market Market120 MW
BESS
70 MW
BESS
2025 Market Market Market Market Market Market Market Market Market50 MW
BESS
2026 Market Market Market Market Market Market Market Market Market
2027 1315 MW CC PPA‐1 CC 658 MW CC 658 MW CC PPA‐1 CC PPA‐1 CC PPA‐2 CC PPA‐2 CC PPA‐1 CC 658 MW CC 658 MW CC
202850 MW
BESS
658 MW CC 350 MW CT 350 MW CT
350 MW CT Market50 MW
BESS
100 MW
BESS
Market
350 MW CT
Market
PVRR (2020 $M) 11,374 11,533 11,554 11,581 11,641 11,645 11,652 11,655 11,671 11,711 11,764
% difference 1.4% 1.6% 1.8% 2.3% 2.4% 2.4% 2.5% 2.6% 3.0% 3.4%
Year
2029
2023
2030
658 MW CC
Market Market Market Market
Top Ten Portfolios Reference
Portfolio
2031
1105 MW CC 350 MW CT PPA‐1 CC
Market Market350 MW CT
PPA‐2 CC
Market Market
1105 MW CC 350 MW CT PPA‐2 CC 700 MW CT 350 MW CT 350 MW CT 350 MW CT
350 MW CT
658 MW CC PPA‐1 CC
Market
659 MW CC
Market
700 MW CT 350 MW CT
350 MW CTMarket658 MW CC

Page | 88
Figure 6‐45 shows the PVRR for the top 10 portfolios along with a breakdown of the cost components.
Figure 6-45: Top 10 Portfolios – PVRR Cost Components

Page | 89
7 Conclusion

Page | 90
7 Conclusion
Central is using this IRP as a foundation to work with its member‐cooperatives to address Central’s
impending open positions and determine the best path forward. Filling these open positions is an
opportunity for Central to support its member‐cooperatives in meeting the needs of member‐owners for
reliable, low‐cost electricity and to create a more diversified portfolio. A diversified portfolio allows
greater flexibility and opportunities for our members than the existing resource mix. The various resource
plans identified in this report provide reliable capacity to meet the needs of member‐owners, as identified
in the current load forecast.
Beginning in 2023, Central will have an open position resulting from the generating unit retirements at
Santee Cooper. The full retirement of Winyah Generating Station by Santee Cooper will create an open
position of 529 MW that Central will be required to fill. This IRP assumes that Santee Cooper will retire
Winyah in 2023 and 2027 as announced. Central can fill this position by opting into a Santee Cooper
Proposed Shared Resource or by independently developing a set of alternative resources. In addition to
the 529 MW position in the Santee Cooper BAA, beginning in 2029 Central will have an open position in
the Duke BAA. As the Duke PPA ramps down between 2029 and January 2031, Central will need to acquire
1,110 MW of capacity to serve its member‐cooperatives' needs in the Duke BAA.
In 2019, Central and its member‐cooperatives began evaluating how to best fill its open positions with a
reliable and economical resource plan. One hundred twenty‐six portfolios were developed and evaluated,
and the top 28 were selected for more in‐depth analysis. These 28 portfolios were analyzed with detailed
production cost modeling to evaluate how they would perform under multiple risk sensitivities. The top
10 portfolios that performed the best under all risk sensitivities were then selected.
Central is a winter peaking system, which typically occurs early in the morning when solar resources are
not available. All top 10 portfolios involve investment in natural gas combined cycle capacity to serve peak
demand. This capacity can come in the form of full ownership, joint ownership, or power purchase
agreements. Natural gas combined cycle generation is both economical and 50% less carbon intensive
than coal generation. Battery storage can be used to shift the timing of solar power into hours when
demand is highest. Battery storage options are currently more expensive than natural gas options;
however, Central will continue to monitor developments in the storage sector.
Central is committed to serving its member‐cooperatives by procuring low‐cost power for their member‐
owners. Central and its member‐cooperatives must understand and evaluate the risks involved in every
portfolio. Many portfolios are dependent upon natural gas fired generation. The future of natural gas
prices and delivery is uncertain. Resource plans with high capital investment create the possibility for
stranded costs if the environment shifts against that type of generation. Changes in technology can make
an existing or planned generating unit less attractive. The development of an organized market in the
Southeast could fundamentally alter the economic structure of the electric utility business in South
Carolina. Advances in energy storage can reduce the integration costs of intermittent renewable energy.
Reductions in the variable integration costs of solar will enable Central and its member‐cooperatives the
ability to commission solar beyond the levels evaluated in this report.
As a part of the production cost modeling process, varying levels of DSM and renewable implementation
were assessed. The results consistently showed that resource portfolios high in DSM, specifically demand
response, and renewables outperformed portfolios with lower implementation levels across all evaluated

Page | 91
risk scenarios. The analysis in this report indicates that replacing energy purchases from fossil fuel plants
with the development of solar energy resources reduces power costs. Although solar provides minimal
winter capacity benefit, Central and its member‐cooperatives should continue working to expand access
for member‐owners to low‐cost renewable energy.
Central’s strength has always been in the diversity of its member‐cooperatives and their shared
commitment to reliable, low‐cost power. Each of the 20 member‐cooperatives brings experience,
understanding, and resources that produce a system that serves member‐owners better than each
member‐cooperative working independently. Central will use this same philosophy as it builds a system
to serve its member‐cooperatives in the future.
This IRP is the foundation upon which Central and its member‐cooperatives can build a more diversified
portfolio to serve the energy needs of the people of South Carolina for years to come. The electric industry
is changing, and the portfolio of resources that Central manages will need to evolve as well. A holistic
approach that combines renewable energy, demand side management, energy storage, efficient central
station generation, and power purchase agreements will likely produce a superior risk‐adjusted outcome
compared to a portfolio that ignores one of these components.

Page | 92
8 Appendices

Page | 93
8 Appendices

Page | 94
A. Glossary of Acronyms
AC AMI BA BAA BAU BC BE BESS BLR C&I CCGT CFL CVR DOE DR DSM Duke ECSC EE EESI EIA EISA ELCC EPC EV FERC G&T GDP GHG GW GWh HRSG HVAC IOU IRP ISO kW kWh LED Li‐ion LOLE LOLP MLOC MW MWh NERC
alternating current advanced metering infrastructure balancing authority balancing authority area business as usual benefit‐cost beneficial electrification battery energy storage system balance of loads and resources commercial and industrial combined‐cycle gas turbine compact fluorescent light conservation voltage reduction U.S. Department of Energy demand response demand‐side management Duke Energy Carolinas The Electric Cooperatives of South Carolina energy efficiency Environmental and Energy Study Institute Energy Information Administration Energy Independence and Security Act effective load carrying capability engineering, procurement, and construction costs electric vehicle Federal Energy Regulatory Commission generation and transmission cooperative gross domestic product greenhouse gas gigawatt gigawatt‐hour heat recovery steam generator heating, ventilation, and air conditioning investor‐owned utility integrated resource plan independent system operator kilowatt kilowatt‐hour light‐emitting diode lithium ion loss of load expectation loss of load probability member line of credit megawatt megawatt‐hour North American Electric Reliability Corporation

Page | 95
NESHAP NITSA NOx NPV NREL OATT PPA PRM PURPA PV PVRR QF RE RICE RF RIM RTO RUS SAE Santee Cooper SCGT SEEM SEPA TRC UCT VOS
National Emission Standards for Hazardous Air Pollutants Network Integrated Transmission Service Agreement nitrogen oxides net present value National Renewable Energy Laboratory Open Access Transmission Tariff power purchase agreement planning reserve margin Public Utility Regulatory Policies Act (1978) photovoltaic present value of revenue requirements qualified facility renewable energy reciprocating internal combustion engine radio frequency ratepayer impact measurement regional transmission organization Rural Utilities Service statistically adjusted end‐use South Carolina Public Service Authority simple‐cycle gas turbine Southeast Energy Exchange Market Southeastern Power Administration total resource cost test utility cost test value of solar

Page | 96
B. Existing Resources
Season Resource 2020 2021 2022 2023 2024 2025 2026 2027 2028 2029 2030 2031 2032 2033 2034 2035 2036 2037 2038 2039 2040
Summer
AC Switches 12 11 10 9 8 8 7 6 5 4 3 2 1 0 0 0 0 0 0 0 0
AMI Water Heater Switches
17 16 14 13 12 11 9 8 7 5 4 3 2 0 0 0 0 0 0 0 0
Battery 0 0 0 0 0 0 0 0 0 0 0 0 0 0 0 0 0 0 0 0 0
Beat the Peak Alerts
3 0 0 0 0 0 0 0 0 0 0 0 0 0 0 0 0 0 0 0 0
CVR 30 31 32 33 33 34 34 34 34 35 35 35 36 36 36 36 37 37 37 38 38
Commercial EE 2 2 2 2 2 2 2 2 2 2 2 1 1 1 0 0 0 0 0 0 0
On‐bill Weatherization
0 0 0 0 0 0 0 0 0 0 0 0 0 0 0 0 0 0 0 0 0
Pool Pumps 0 0 0 0 0 0 0 0 0 0 0 0 0 0 0 0 0 0 0 0 0
RF Water Heater Switches
14 12 9 7 4 1 0 0 0 0 0 0 0 0 0 0 0 0 0 0 0
Solar 15 15 14 14 14 14 14 14 14 14 14 14 14 14 14 14 13 13 13 13 13
Thermostats 1 1 1 1 1 1 1 1 1 1 0 0 0 0 0 0 0 0 0 0 0
Winter
AC Switches 0 0 0 0 0 0 0 0 0 0 0 0 0 0 0 0 0 0 0 0 0
AMI Water Heater Switches
25 23 21 20 18 16 14 12 10 8 6 4 3 1 0 0 0 0 0 0 0
Battery 0 0 0 0 0 0 0 0 0 0 0 0 0 0 0 0 0 0 0 0 0
Beat the Peak Alerts
3 0 0 0 0 0 0 0 0 0 0 0 0 0 0 0 0 0 0 0 0
CVR 36 37 38 38 39 39 40 40 40 41 41 41 42 42 42 43 43 43 44 44 44
Commercial EE 1 1 1 1 1 1 1 1 1 1 1 1 1 0 0 0 0 0 0 0 0
On‐bill Weatherization
1 1 1 1 1 1 1 1 1 1 1 1 1 1 1 0 0 0 0 0 0
Pool Pumps 0 0 0 0 0 0 0 0 0 0 0 0 0 0 0 0 0 0 0 0 0
RF Water Heater Switches
22 18 14 10 6 2 0 0 0 0 0 0 0 0 0 0 0 0 0 0 0
Solar 3 3 3 3 3 3 3 3 3 3 3 3 3 3 3 3 3 3 3 3 3
Thermostats 1 1 1 1 1 1 1 1 1 1 0 0 0 0 0 0 0 0 0 0 0
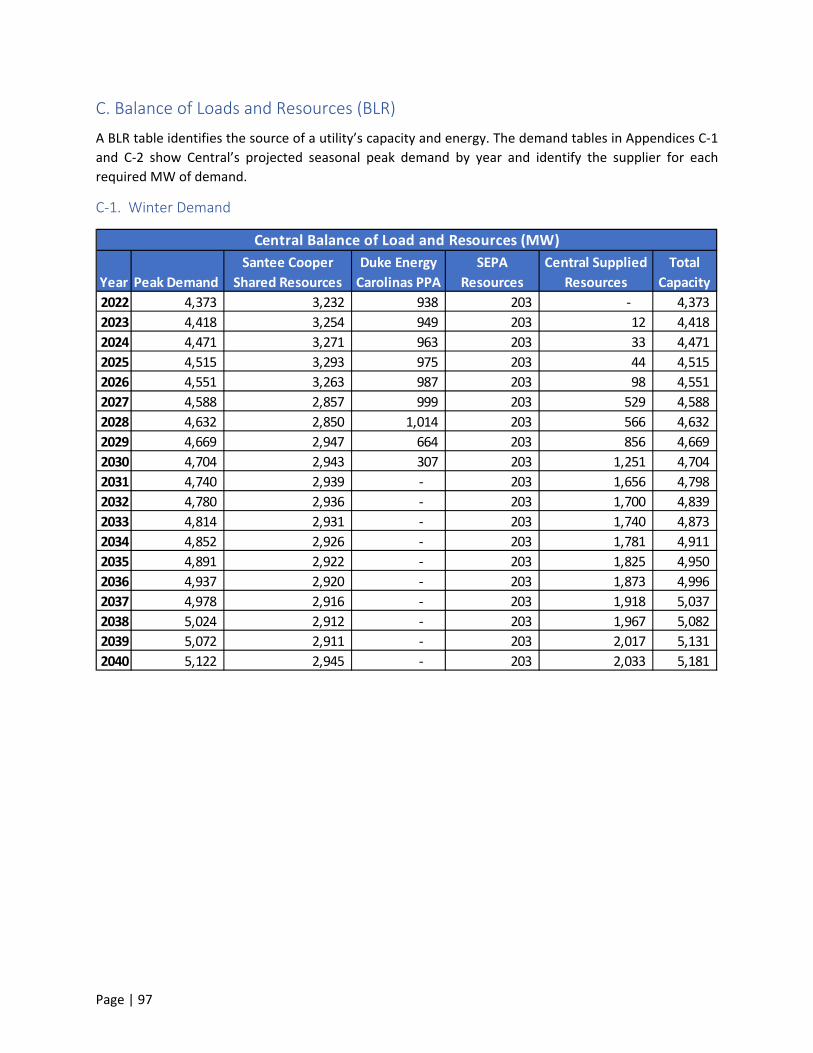
Page | 97
C. Balance of Loads and Resources (BLR)
A BLR table identifies the source of a utility’s capacity and energy. The demand tables in Appendices C‐1
and C‐2 show Central’s projected seasonal peak demand by year and identify the supplier for each
required MW of demand.
C‐1. Winter Demand
2022 4,373 3,232 938 203 ‐ 4,373
2023 4,418 3,254 949 203 12 4,418
2024 4,471 3,271 963 203 33 4,471
2025 4,515 3,293 975 203 44 4,515
2026 4,551 3,263 987 203 98 4,551
2027 4,588 2,857 999 203 529 4,588
2028 4,632 2,850 1,014 203 566 4,632
2029 4,669 2,947 664 203 856 4,669
2030 4,704 2,943 307 203 1,251 4,704
2031 4,740 2,939 ‐ 203 1,656 4,798
2032 4,780 2,936 ‐ 203 1,700 4,839
2033 4,814 2,931 ‐ 203 1,740 4,873
2034 4,852 2,926 ‐ 203 1,781 4,911
2035 4,891 2,922 ‐ 203 1,825 4,950
2036 4,937 2,920 ‐ 203 1,873 4,996
2037 4,978 2,916 ‐ 203 1,918 5,037
2038 5,024 2,912 ‐ 203 1,967 5,082
2039 5,072 2,911 ‐ 203 2,017 5,131
2040 5,122 2,945 ‐ 203 2,033 5,181
Year
Santee Cooper
Shared Resources
Duke Energy
Carolinas PPA
Central Supplied
Resources
SEPA
Resources
Total
CapacityPeak Demand
Central Balance of Load and Resources (MW)

Page | 98
C‐2. Summer Demand
2022 3,900 2,776 921 203 ‐ 3,900
2023 3,942 2,795 931 203 12 3,942
2024 3,985 2,805 944 203 33 3,985
2025 4,024 2,820 956 203 44 4,024
2026 4,056 2,789 966 203 98 4,056
2027 4,092 2,382 979 203 529 4,092
2028 4,128 2,369 990 203 566 4,128
2029 4,171 2,471 650 203 848 4,171
2030 4,207 2,469 299 203 1,236 4,207
2031 4,245 2,468 ‐ 203 1,574 4,245
2032 4,281 2,463 ‐ 203 1,616 4,281
2033 4,326 2,466 ‐ 203 1,657 4,326
2034 4,368 2,466 ‐ 203 1,699 4,368
2035 4,413 2,467 ‐ 203 1,743 4,413
2036 4,456 2,462 ‐ 203 1,791 4,456
2037 4,511 2,468 ‐ 203 1,840 4,511
2038 4,562 2,468 ‐ 203 1,891 4,562
2039 4,614 2,468 ‐ 203 1,943 4,614
2040 4,663 2,500 ‐ 203 1,960 4,663
Central Balance of Load and Resources (MW)
Year
Duke Energy
Carolinas PPA
SEPA
Resources
Central Supplied
Resources
Total
CapacityPeak Demand
Santee Cooper
Shared Resources

Page | 99
D. Community Causes
Aiken Electric Cooperative
Volunteer Services / Community Development Initiatives
Run United
Wire bag packing for Co‐op Closet
United Way Agencies
Project Power
Salvation Army Bell Ringing
Aiken Lighting Ceremony
Relay for Life
United Way Family Fun Day
Christmas Caroling – local nursing home
Sponsorships of Charities and Local Organizations
United Way – School Tools, Corporate Contributions, Annual Fundraisers/Events
Aiken YMCA
NAACP
Special Olympics
CSRA Foundation
Aiken Heart Board
Co‐op ministries of North
NRECA Foundation
Alzheimer’s Association
Legion Post
Fit 4 School
Education Matters
Aikenites
Red Cross
Rotary Club
MLK Celebration
Scholarship Grants
Axel Adams Foundation
Cinderella Project
Storytime in the Garden
Edgefield County First Steps
Aiken County Veterans
Aiken County PRT
Hankinson’s Boxing Gym
Recovery Road
Southeastern Firefighters
TPSA
Golden Harvest Food Bank
Operation Sunscreen for Soldiers
Great Oak Equine Program
SPCA
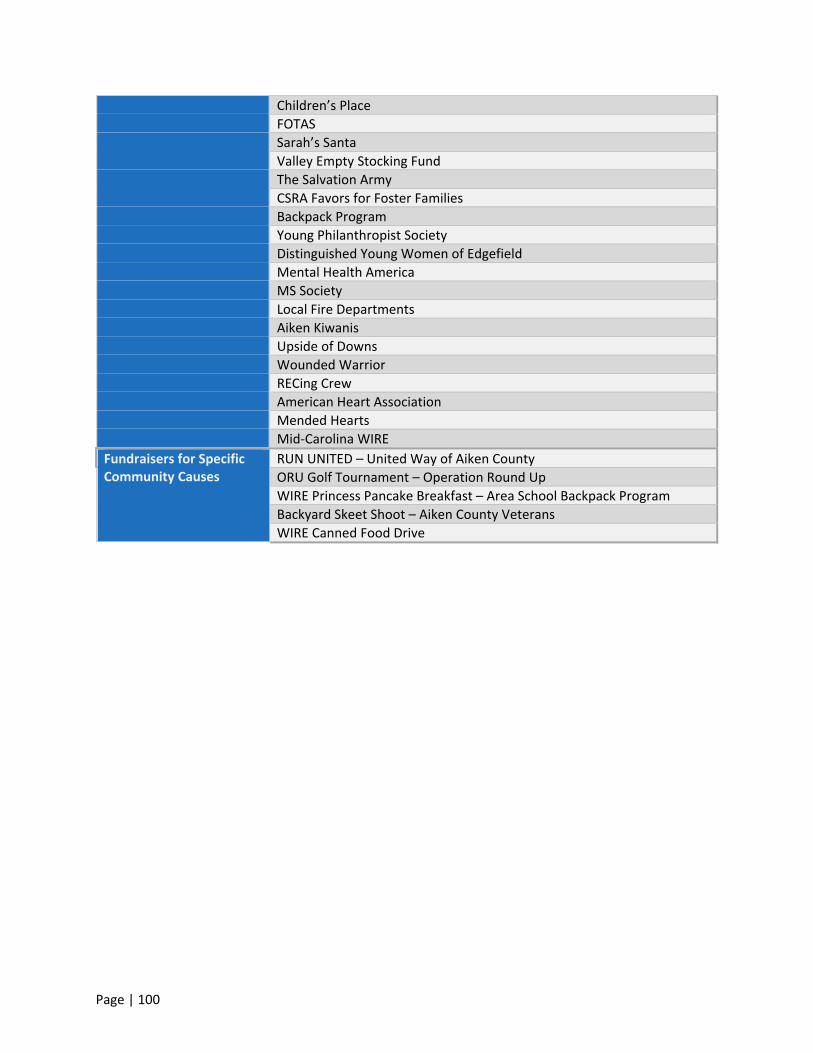
Page | 100
Children’s Place
FOTAS
Sarah’s Santa
Valley Empty Stocking Fund
The Salvation Army
CSRA Favors for Foster Families
Backpack Program
Young Philanthropist Society
Distinguished Young Women of Edgefield
Mental Health America
MS Society
Local Fire Departments
Aiken Kiwanis
Upside of Downs
Wounded Warrior
RECing Crew
American Heart Association
Mended Hearts
Mid‐Carolina WIRE
Fundraisers for Specific Community Causes
RUN UNITED – United Way of Aiken County
ORU Golf Tournament – Operation Round Up
WIRE Princess Pancake Breakfast – Area School Backpack Program
Backyard Skeet Shoot – Aiken County Veterans
WIRE Canned Food Drive
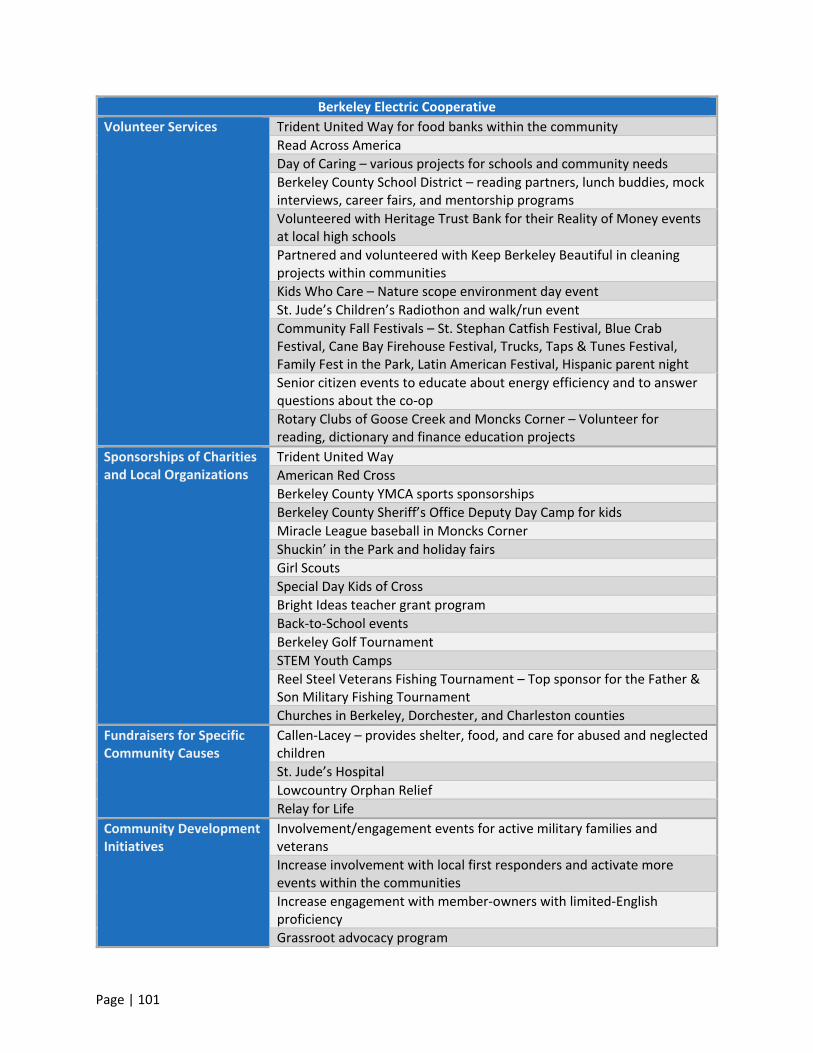
Page | 101
Berkeley Electric Cooperative
Volunteer Services Trident United Way for food banks within the community
Read Across America
Day of Caring – various projects for schools and community needs
Berkeley County School District – reading partners, lunch buddies, mock interviews, career fairs, and mentorship programs
Volunteered with Heritage Trust Bank for their Reality of Money events at local high schools
Partnered and volunteered with Keep Berkeley Beautiful in cleaning projects within communities
Kids Who Care – Nature scope environment day event
St. Jude’s Children’s Radiothon and walk/run event
Community Fall Festivals – St. Stephan Catfish Festival, Blue Crab Festival, Cane Bay Firehouse Festival, Trucks, Taps & Tunes Festival, Family Fest in the Park, Latin American Festival, Hispanic parent night
Senior citizen events to educate about energy efficiency and to answer questions about the co‐op
Rotary Clubs of Goose Creek and Moncks Corner – Volunteer for reading, dictionary and finance education projects
Sponsorships of Charities and Local Organizations
Trident United Way
American Red Cross
Berkeley County YMCA sports sponsorships
Berkeley County Sheriff’s Office Deputy Day Camp for kids
Miracle League baseball in Moncks Corner
Shuckin’ in the Park and holiday fairs
Girl Scouts
Special Day Kids of Cross
Bright Ideas teacher grant program
Back‐to‐School events
Berkeley Golf Tournament
STEM Youth Camps
Reel Steel Veterans Fishing Tournament – Top sponsor for the Father & Son Military Fishing Tournament
Churches in Berkeley, Dorchester, and Charleston counties
Fundraisers for Specific Community Causes
Callen‐Lacey – provides shelter, food, and care for abused and neglected children
St. Jude’s Hospital
Lowcountry Orphan Relief
Relay for Life
Community Development Initiatives
Involvement/engagement events for active military families and veterans
Increase involvement with local first responders and activate more events within the communities
Increase engagement with member‐owners with limited‐English proficiency
Grassroot advocacy program

Page | 102
Host community meetings
Sponsored various chamber events and hosted “Environmental Day”
Host of voter registration drives at the district offices
Black River Electric Cooperative
Volunteer Services / Community Development Initiatives
Heart Walk
Relay for Life team and sponsorship
Salvation Army Board and sponsor
Sponsorships of Charities and Local Organizations
Kiwanis Pancake Day
Striped Bass Festival
Sumter County Museum and Art Gallery
Shaw Air Force Base events and local school events
Fundraisers for Specific Community Causes
Heart Association
Relay for Life team and sponsorship
Community Development Initiatives
Work with local economic development boards
Blue Ridge Electric Cooperative
Volunteer Services / Community Development Initiatives
Employees can participate in a mentorship program with the Pickens County YMCA
Employees are involved and active leaders in local chambers of commerce and organizations
Local leadership programs
Sponsorships of Charities and Local Organizations
Sponsorships for numerous local events and charity events (chamber events, charity balls, The Dream Center in Pickens County, local school initiatives)
Assisted the local career center with equipment needed for electrical/lineman training
Donations to local agencies to help member‐owners pay their electrical bills
Sponsored a local school’s security upgrade
Donated a bucket truck to the local technical college to assist with their linemen training program
Sponsored a field trip to Roper Mountain Science Center in Greenville for two elementary schools in the service territory
Fundraisers for Specific Community Causes
Annual Blue Ridge Fest – Raises money for 12 local charities
Annual fundraiser for all local United Ways in each county served by Blue Ridge Electric Cooperative

Page | 103
Broad River Electric Cooperative
Volunteer Services Meal on Wheels annual food drive
United Way of the Piedmont (donations)
Sponsorships of Charities and Local Organizations
Round‐Up Program
Central Electric Power Cooperative
Volunteer Services / Community Development Initiatives
Meals on Wheels – pack and deliver meals to local seniors and disabled
Chris Myers’ Children Place – performed landscaping, yard work and minor repairs around the property
Fundraisers for Specific Community Causes
United Way – yearly campaign drive for monetary donations
School Supply Drive – collect and donate school supplies for a local elementary school
Harvest Hope Food Bank – food drive and money donations to the local food bank
American Heart Association – collect donations and participate in the march to support the American Heart Association
Leukemia & Lymphoma Society – collect donations and participate in the Light the Night walk
Palmetto Place Children and Youth Services – collected money donations
Oliver Gospel Mission – Collect donations for Thanksgiving & Christmas
Coastal Electric Cooperative
Sponsorships of Charities and Local Organizations
Colleton County Relay for Life
Rotary Club of Walterboro
Walterboro Criterium
Walterboro Rice Festival
Fundraisers for Specific Community Causes
Operation Round Up
Annual CEC Golf Tournament to support Coastal Electric Trust Round Up Program and Colleton County Relay for Life
Smoke in the “Boro” BBQ Event to support Coastal Electric Trust Round Up, Colleton County High School Band of Blue and Colleton Children’s Theater
Community Development Initiatives
Colleton County Economic Alliance
Mega Site – Industrial Development

Page | 104
Fairfield Electric Cooperative
Volunteer Services Employees volunteer and support the local sporting leagues as coaches and organizers
Meal preparation assistance for Salkehatchie Summer Services
Employees volunteer & contribute to the Operation Give‐A‐Turkey & Adopt‐the‐Elders Programs for Thanksgiving and Christmas each year
Sponsorships of Charities and Local Organizations
Rotary Club
Lions Club
Chamber of Commerce
Salkahatchie Summer Services
Fairfield Behavioral Health Organization
Big Red Barn Retreat
Red Cross
Harvest Food Bank
Volunteer Agencies – Wheelchair Ramps
Volunteer Fire Departments
Rescue Squads & smoke detectors
Local Law Enforcement Agencies
Burned Out Fire families
Fundraisers for Specific Community Causes
American Cancer Society (Relay for Life)
United Way Payroll Deductions
ACRE / ECHO
Operation Round Up Program
Community Development Initiatives
Local county and town economic development initiatives (Industrial Parks, Speculative Building, New Sites)
Washington Youth Tour, Cooperative Youth Summit, & Scholarships for community youth
Edisto Electric Cooperative
Sponsorships of Charities and Local Organizations
American Legion Unit 105‐ Palmetto Girls State and Boys State, Bamberg Ehrhardt High School, Blackville Hilda High School, Dorchester Academy
Chamber of Commerce
Tri County Chamber of Commerce
Bamberg Lions Club
Beidler Forest – Audubon
Distinguished Young Women of Dorchester County
Dorchester County Economic Development
SC Sheriffs Association

Page | 105
Horry Electric Cooperative
Volunteer Services Trouble in Tiny Town – Safety demonstration to increase safety awareness of potential dangers of electricity on a small scale. Typically presented to schools, civic centers and community organizations
Local Christmas parades
Meet the Linemen – Safety and safety equipment awareness presented to schools and the community
Energy Advisors – Energy tips with Q & A supporting various programs
Sponsorships of Charities and Local Organizations
WIRE (Women in Rural Electrification) at Horry and at ECSC levels
ORU (Operation Round‐Up) – Food, clothing and medication support for the community
Community Development Initiatives
Bright Ideas – Additional project funding for public schools in Horry County
Washington Youth Tour – Gives high school Juniors the opportunity to visit Washington DC
enLIGHTENSC – Energy related lesson plans for local teachers to better access energy‐related information and activities for their classrooms
enLIGHTENSC – Children’s Book Challenge which is a competition for 4th and 5th grade students to write stories focused on how electricity impacts their lives and community
Laurens Electric Cooperative
Sponsorships of Charities and Local Organizations
WIRE (Women in Rural Electrification) – Jenny Ballard Scholarship
Pay It Forward program
Cooperative Caring Fund‐ Benefits the Baptist Crisis Center and the Golden Strip Emergency Relief Agency
Fundraisers for Specific Community Causes
Annual Motorcycle Ride to Give

Page | 106
Lynches River Electric Cooperative
Volunteer Services Chesterfield Soup Kitchen – Co‐op has the meal catered at the annual event and the employees serve
Community Ambassador Program – Employees can volunteer up to 16 hours during the business day without using vacation time for the following programs: Steam Day at Erwin Elementary; Career Day at Jefferson Elementary or Chesterfield Ruby Middle; Stream Career Day at Buford Elementary
Lineman’s Rodeo
Sponsorships of Charities and Local Organizations
Rainbow Enterprise
Sandhill Volunteer Fire Department
Teals Mill Fire Department
Salem United Methodist Church – Backpack Buddies & Youth Rally
Connie Maxwell Children’s Home
Angelus Community Center
Mookie’s Place
American Cancer Society
American Legion Aux. 92
Andrew Jackson High School
Andrew Jackson Middle School
Camden Jr. Welfare League
CareFIRST Carolina
Central High School
Cheraw Air Show
Cheraw Chamber
Cheraw Rotary
Chesterfield County Library
Chesterfield County Schools
Flat Creek Fire Department
Ground 40 Ministries
Town of Heath Springs
Heath Springs Elementary
J‐Town Express Travel Baseball
Jefferson‐Angelus Legion Post 80
Jefferson Dixie Youth Baseball
Jefferson Elementary School
365 Sports
Kershaw County Fine Arts Center
Kershaw Chamber
Kershaw Ducks Unlimited
Lancaster Children’s Home
Lancaster County Council of the Arts
Lancaster County Parks and Recreation
Mercy In Me Free Medical Clinic
Mid‐Carolina EC
Mt. Calvary Outreach Center

Page | 107
National Federation of the Blind
New Heights Middle School
North Central High School
Heath Children’s Hospital
Pee Dee Coalition
Petersburg Primary
Rich Hill Community Center
Salkehatchie Camp New Hope
Second Baptist Church
Buford Middle School
Civil Air Patrol
Southpointe Christian School
McDonald‐Green Fire Department
Chesterfield Soccer
NAMI Piedmont Tri‐County
SC Wildlife Association
Lancaster High School
Kershaw Elementary School
Antioch Fire Department
Hospice of Chesterfield County
Town of Kershaw
Town of Cheraw
Tiney Grove Youth Band
Rich Hill Fire Department
Helping Hands Outreach
Buford High School
Kershaw Area Resource Exchange
Justin Brewer Memorial Foundation
St. James AME Church
Fundraisers for Specific Community Causes
The LIGHT Foundation: Live auction and golf tournament to raise money for local groups and organizations
Needful Things of Pageland LLC
Mt. Olive Baptist Church
Teal’s Mill Fire Department
Pageland Lions Club
Maranatha Family Center
Community Development Initiatives
Touchstone Energy Passion Project
Bright Ideas Teacher Grant Program: LREC funding for local teachers to execute unique classroom projects & learning techniques not possible without additional funding
ORU Truck Raffle: supports individuals and organizations within the community during hardships

Page | 108
Mid‐Carolina Electric Cooperative
Volunteer Services Meals on Wheels through Lexington County Recreation & Aging Commission
Women Involved in Rural Electrification (“Wire”)
Employee involvement on Leeza’s Care Connection Board
Employee involvement on LRADAC Foundation Board
Employee involvement on Lexington County Sheriff’s Association Board
Employee involvement on Saluda Shoals Foundation Board
Employee involvement on Lexington One Educational Foundation Board
Employee involvement on Lexington Chamber Board
Membership in Midlands Business Leadership Group (“MBLG”)
Employee involvement on Lexington‐Richland Five Business Advisory Board
Employee involvement on Celebrate Freedom Foundation Board
Sponsorships of Charities and Local Organizations
Mission Lexington, Race for Hunger Title Sponsorship
Lighthouse for Life, Run for Her Life Walk/Race Title Sponsorship
The Courage Center
Local Festivals
Fundraisers for Specific Community Causes
Sporting Clays Fundraiser for ALS (Lou Gehrig’s Disease) & Southeastern Firefighters Burn Association
WIRE Golf Tournament for Becky’s Place at Lexington Medical Center
Light the Night Walk – Leukemia Lymphoma Society
Relay for Life – American Cancer Society
Community Development Initiatives
Operation Round‐Up
Touchstone Energy Scholarships
Washington Youth Tour
Cooperative Youth Summit
Bright Ideas – Education Grants
TreeMendUs – tree seedlings to local 3rd graders
Touchstone Energy Cooperative Bowl – Recognizing student athletes
Red Ribbon Week – Bookmarks to 4th graders to strengthen community‐wide efforts of drug prevention
Co‐op Clean‐Up Day
Boys/Girls State
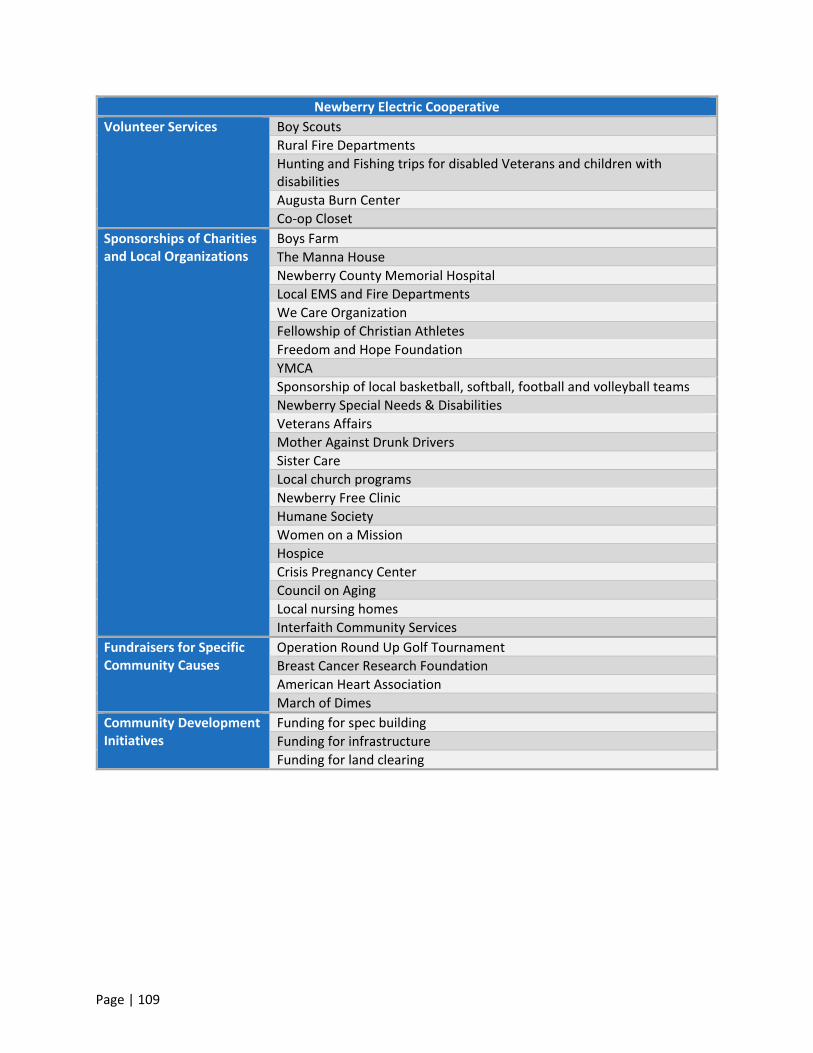
Page | 109
Newberry Electric Cooperative
Volunteer Services Boy Scouts
Rural Fire Departments
Hunting and Fishing trips for disabled Veterans and children with disabilities
Augusta Burn Center
Co‐op Closet
Sponsorships of Charities and Local Organizations
Boys Farm
The Manna House
Newberry County Memorial Hospital
Local EMS and Fire Departments
We Care Organization
Fellowship of Christian Athletes
Freedom and Hope Foundation
YMCA
Sponsorship of local basketball, softball, football and volleyball teams
Newberry Special Needs & Disabilities
Veterans Affairs
Mother Against Drunk Drivers
Sister Care
Local church programs
Newberry Free Clinic
Humane Society
Women on a Mission
Hospice
Crisis Pregnancy Center
Council on Aging
Local nursing homes
Interfaith Community Services
Fundraisers for Specific Community Causes
Operation Round Up Golf Tournament
Breast Cancer Research Foundation
American Heart Association
March of Dimes
Community Development Initiatives
Funding for spec building
Funding for infrastructure
Funding for land clearing
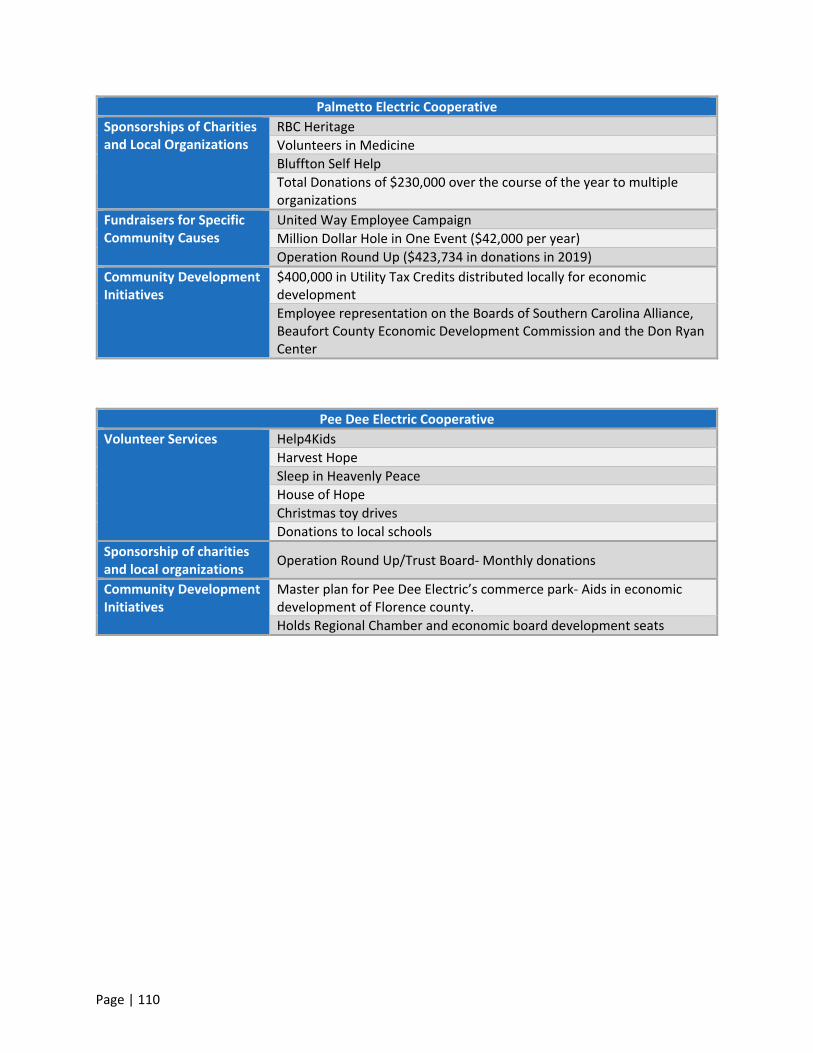
Page | 110
Palmetto Electric Cooperative
Sponsorships of Charities and Local Organizations
RBC Heritage
Volunteers in Medicine
Bluffton Self Help
Total Donations of $230,000 over the course of the year to multiple organizations
Fundraisers for Specific Community Causes
United Way Employee Campaign
Million Dollar Hole in One Event ($42,000 per year)
Operation Round Up ($423,734 in donations in 2019)
Community Development Initiatives
$400,000 in Utility Tax Credits distributed locally for economic development
Employee representation on the Boards of Southern Carolina Alliance, Beaufort County Economic Development Commission and the Don Ryan Center
Pee Dee Electric Cooperative
Volunteer Services Help4Kids
Harvest Hope
Sleep in Heavenly Peace
House of Hope
Christmas toy drives
Donations to local schools
Sponsorship of charities and local organizations
Operation Round Up/Trust Board‐ Monthly donations
Community Development Initiatives
Master plan for Pee Dee Electric’s commerce park‐ Aids in economic development of Florence county.
Holds Regional Chamber and economic board development seats
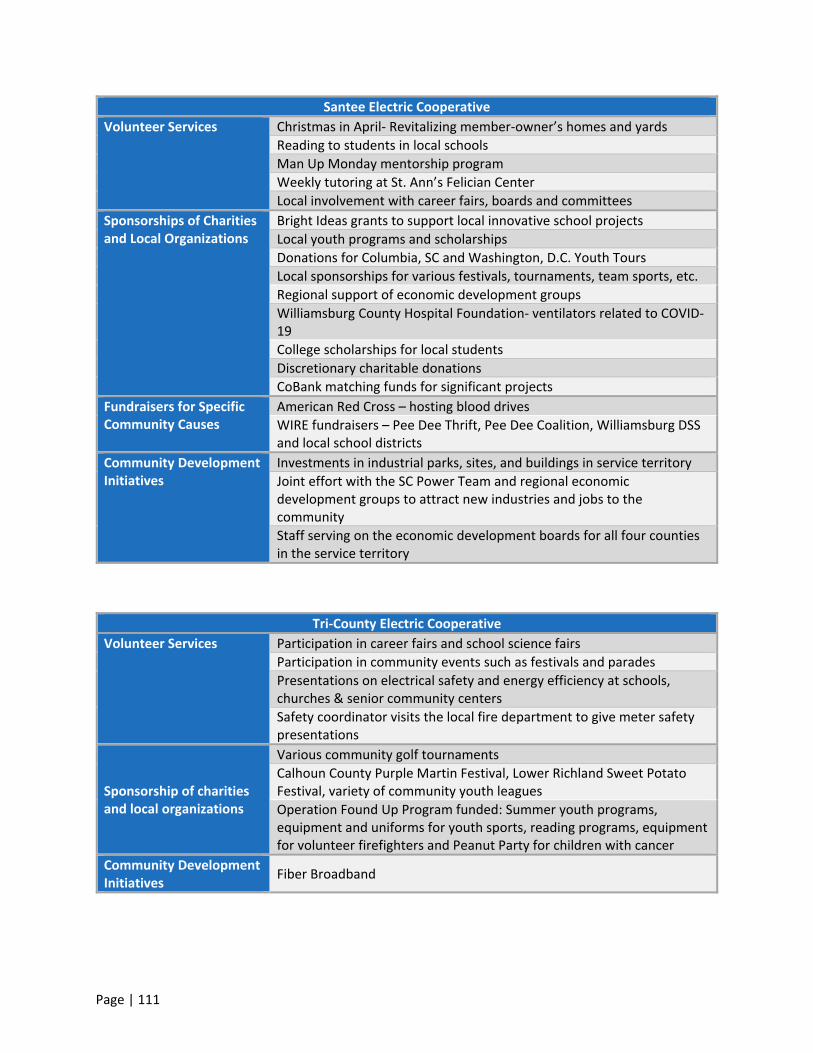
Page | 111
Santee Electric Cooperative
Volunteer Services Christmas in April‐ Revitalizing member‐owner’s homes and yards
Reading to students in local schools
Man Up Monday mentorship program
Weekly tutoring at St. Ann’s Felician Center
Local involvement with career fairs, boards and committees
Sponsorships of Charities and Local Organizations
Bright Ideas grants to support local innovative school projects
Local youth programs and scholarships
Donations for Columbia, SC and Washington, D.C. Youth Tours
Local sponsorships for various festivals, tournaments, team sports, etc.
Regional support of economic development groups
Williamsburg County Hospital Foundation‐ ventilators related to COVID‐19
College scholarships for local students
Discretionary charitable donations
CoBank matching funds for significant projects
Fundraisers for Specific Community Causes
American Red Cross – hosting blood drives
WIRE fundraisers – Pee Dee Thrift, Pee Dee Coalition, Williamsburg DSS and local school districts
Community Development Initiatives
Investments in industrial parks, sites, and buildings in service territory
Joint effort with the SC Power Team and regional economic development groups to attract new industries and jobs to the community
Staff serving on the economic development boards for all four counties in the service territory
Tri‐County Electric Cooperative
Volunteer Services Participation in career fairs and school science fairs
Participation in community events such as festivals and parades
Presentations on electrical safety and energy efficiency at schools, churches & senior community centers
Safety coordinator visits the local fire department to give meter safety presentations
Sponsorship of charities and local organizations
Various community golf tournaments
Calhoun County Purple Martin Festival, Lower Richland Sweet Potato Festival, variety of community youth leagues
Operation Found Up Program funded: Summer youth programs, equipment and uniforms for youth sports, reading programs, equipment for volunteer firefighters and Peanut Party for children with cancer
Community Development Initiatives
Fiber Broadband

Page | 112
York Electric Cooperative
Volunteer Services Habitat for Humanity
Employees are paid for a full day’s work to go volunteer locally
Sponsorships of Charities and Local Organizations
The Burrell Foundation ‐ 501c3 organization under the York Electric Cooperative umbrella to help those in need in the service territory
Operation Round Up Program
Youth sports, public and private school art programs, food drives, and school supply drives
Fundraisers for Specific Community Causes
Child Abuse Awareness Month – Teddy Bear Trot 5k to raise money for the Children’s Attention Home each year
Community Development Initiatives
Earth Day, safety demonstrations at local schools, career fairs and classroom discussions, scholarships, Washington Youth Tour, and Cooperative Youth Summit
Come‐See‐Me festival, Summerfest, Veterans Day Celebration, First Responders recognition, and internships
Economic development initiatives, Bright Ideas, and community solar
Common Programs Among All or Most S.C. Cooperatives
Youth Programs Washington Youth Tour – Coordinated as a joint event for all S.C. electric
cooperatives, it is an annual six‐day educational trip for 75 high school
rising seniors.
Cooperative Youth Summit – Coordinated as a joint event for all S.C.
electric cooperatives, it is an annual three‐day educational trip to
Columbia, Statehouse, a power plant, and an electric cooperative
headquarters. The 60 students also help assemble care packages for S.C.
public school students who are experiencing homelessness.
Education EnLIGHTenSC.org ‐ an education initiative and website aimed at
teachers, providing energy information, lesson plans, and free master’s
level continuing education.
Children’s Book Challenge – an academic competition aimed at K‐12 students in which they write and illustrate an original children’s book focusing on energy and electricity in South Carolina. The winner’s book is published and distributed to school libraries across the state.
Philanthropy Touchstone Energy Bowl North/South All Star Football Game – Collectively, the co‐ops are the primary sponsor of this annual recognition of 88 players during a week‐long character‐building experience which includes a holiday shopping trip for 44 deserving children co‐sponsored by the co‐ops. The Mr. Football Award recognizes the top prep football player in South Carolina, based on character and on‐field performance.
Scholarships Educational scholarships for students are associated with several of the programs mentioned.