INTEGRATED QUALITY MANAGEMENT TRAINING … · PDCA cycles Integrated improvement and quality tools...
13
INTEGRATED QUALITY MANAGEMENT TRAINING (Albert Balogh) TQM EXCELLENCE MODELS QMS INTEGRATED MANAGEMENT SYSTEMS EFQMͲMODEL ISO 9001 QUALITY TOOLS BODY OF KNOWLEDGE FOR QUALITY MANAGERS ISO (9001+14001+ 18001+27001) PROCESS MANAGEMENT CONTINUOUS IMPROVEMENT SIX SIGMA LEAN MANAGEMENT LEAN SIX SIGMA PROBLEMSOLVING MODELS Fig.1
Transcript of INTEGRATED QUALITY MANAGEMENT TRAINING … · PDCA cycles Integrated improvement and quality tools...
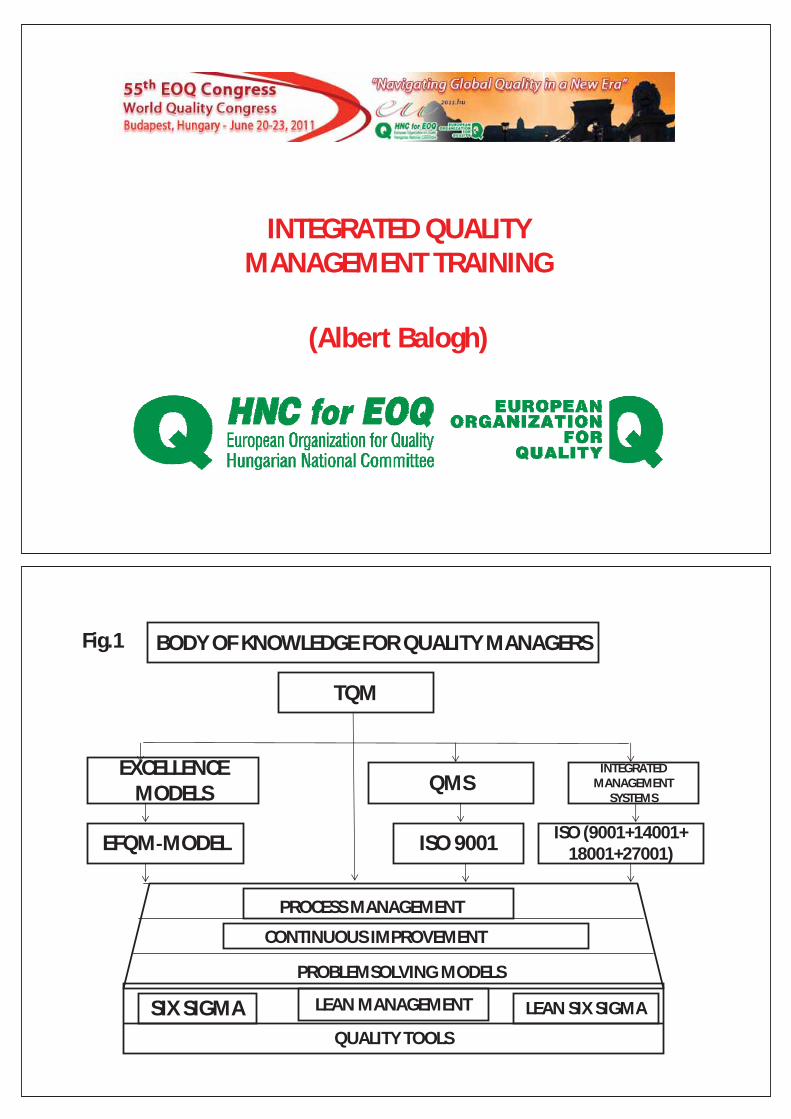
INTEGRATED QUALITYMANAGEMENT TRAINING
(Albert Balogh)
TQM
EXCELLENCEMODELS QMS
INTEGRATEDMANAGEMENT
SYSTEMS
EFQM MODEL ISO 9001
QUALITY TOOLS
BODY OF KNOWLEDGE FOR QUALITY MANAGERS
ISO (9001+14001+18001+27001)
PROCESS MANAGEMENT
CONTINUOUS IMPROVEMENT
SIX SIGMA LEAN MANAGEMENT LEAN SIX SIGMA
PROBLEMSOLVING MODELS
Fig.1
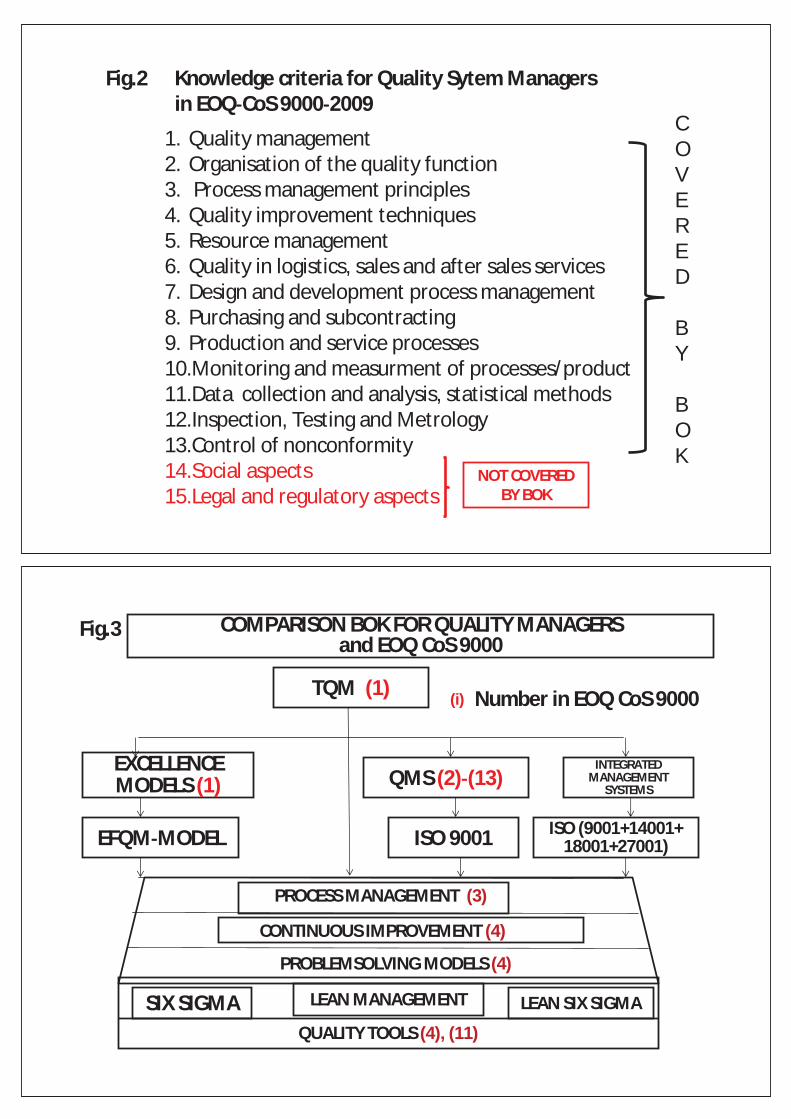
1. Quality management2. Organisation of the quality function3. Process management principles4. Quality improvement techniques5. Resource management6. Quality in logistics, sales and after sales services7. Design and development process management8. Purchasing and subcontracting9. Production and service processes10.Monitoring and measurment of processes/product11.Data collection and analysis, statistical methods12.Inspection, Testing and Metrology13.Control of nonconformity14.Social aspects15.Legal and regulatory aspects
Knowledge criteria for Quality Sytem Managersin EOQ CoS 9000 2009
COVERED
BY
BOK
NOT COVEREDBY BOK
Fig.2
TQM (1)
EXCELLENCEMODELS (1) QMS (2) (13)
INTEGRATEDMANAGEMENT
SYSTEMS
EFQM MODEL ISO 9001
QUALITY TOOLS (4), (11)
COMPARISON BOK FOR QUALITY MANAGERSand EOQ CoS 9000
ISO (9001+14001+18001+27001)
PROCESS MANAGEMENT (3)
CONTINUOUS IMPROVEMENT (4)
SIX SIGMA LEAN MANAGEMENT LEAN SIX SIGMA
PROBLEMSOLVING MODELS (4)
Number in EOQ CoS 9000
Fig.3
(i)
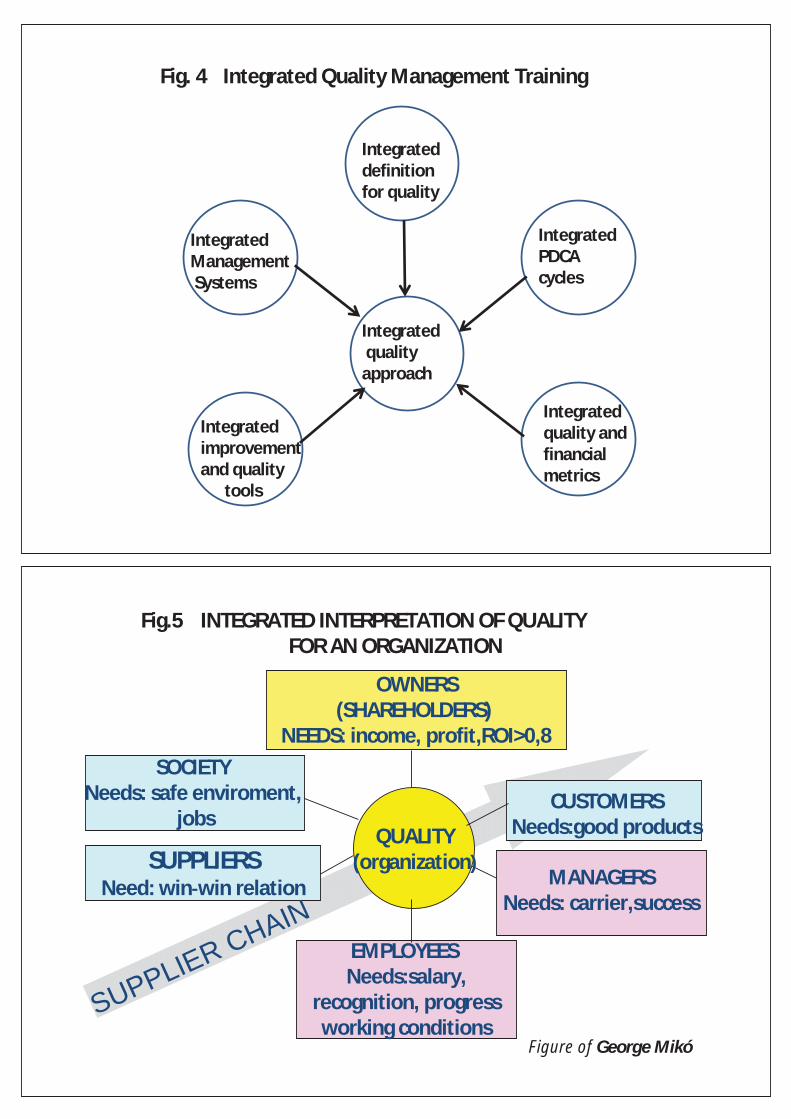
Integrateddefinitionfor quality
IntegratedManagementSystems
IntegratedPDCAcycles
Integratedimprovementand quality
tools
Integratedquality andfinancialmetrics
Integratedqualityapproach
Fig. 4 Integrated Quality Management Training
OWNERS(SHAREHOLDERS)
NEEDS: income, profit,ROI>0,8
SOCIETYNeeds: safe enviroment,
jobs
SUPPLIERSNeed: win win relation
EMPLOYEESNeeds:salary,
recognition, progressworking conditions
CUSTOMERSNeeds:good productsQUALITY
(organization)
SUPPLIER CHAIN
Figure of George Mikó
MANAGERSNeeds: carrier,success
INTEGRATED INTERPRETATION OF QUALITYFOR AN ORGANIZATION
Fig.5
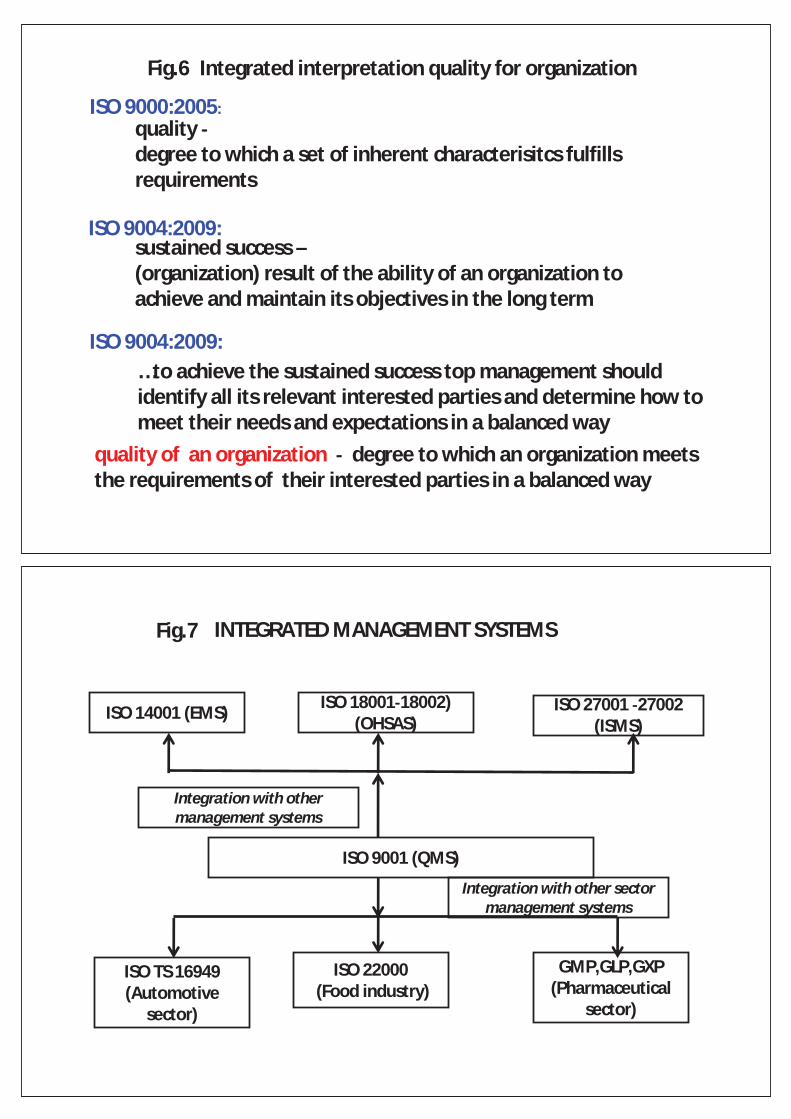
qualitydegree to which a set of inherent characterisitcs fulfillsrequirements
ISO 9000:2005:
ISO 9004:2009:sustained success –(organization) result of the ability of an organization toachieve and maintain its objectives in the long term
…to achieve the sustained success top management shouldidentify all its relevant interested parties and determine how tomeet their needs and expectations in a balanced way
quality of an organization degree to which an organization meetsthe requirements of their interested parties in a balanced way
Fig.6 Integrated interpretation quality for organization
ISO 9004:2009:
INTEGRATED MANAGEMENT SYSTEMS
ISO 9001 (QMS)
ISO 14001 (EMS)ISO 18001 18002)
(OHSAS)ISO 27001 27002
(ISMS)
ISO TS 16949(Automotive
sector)
ISO 22000(Food industry)
GMP,GLP,GXP(Pharmaceutical
sector)
Integration with othermanagement systems
Integration with other sectormanagement systems
Fig.7

Fig.8 Model of a process based quality management system
Fig.9 Product PDCA
7.1 Planning ofproduct realization
7.5. Production andservice provision
8.2.4 Monitoring andmeasurement of product
8.5 Improvement
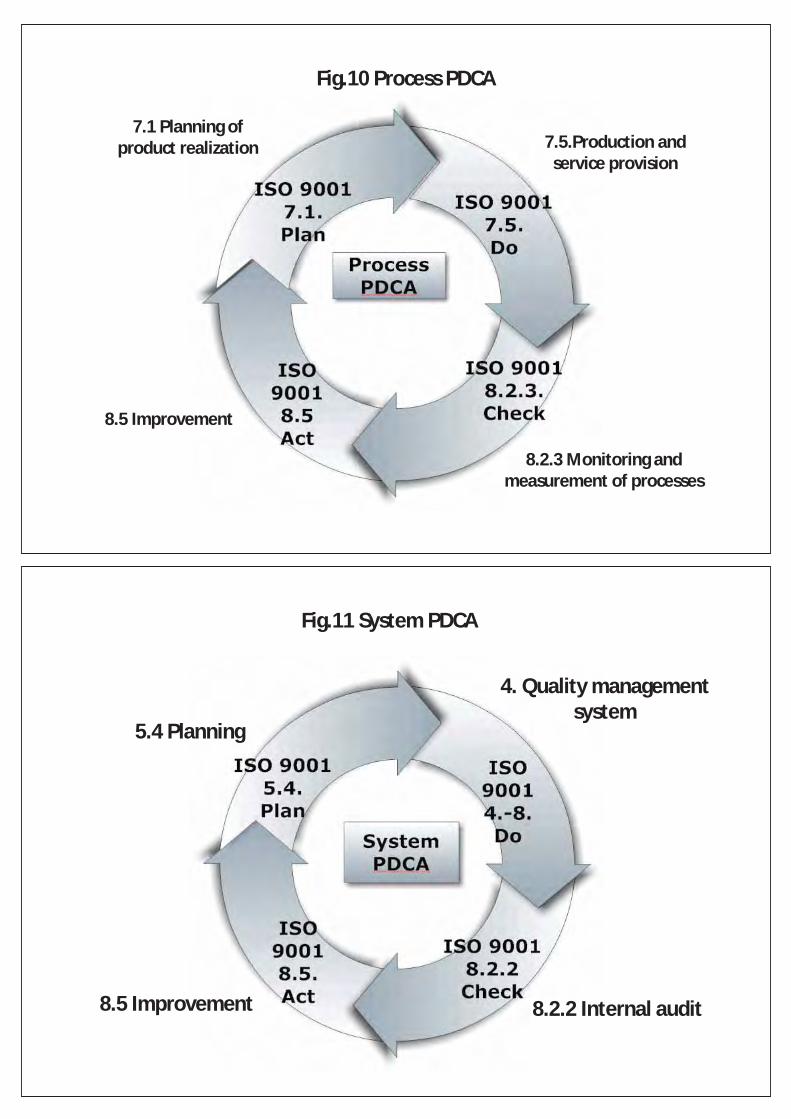
Fig.10 Process PDCA
7.1 Planning ofproduct realization 7.5.Production and
service provision
8.5 Improvement
8.2.3 Monitoring andmeasurement of processes
Fig.11 System PDCA
8.2.2 Internal audit8.5 Improvement
5.4 Planning
4. Quality managementsystem
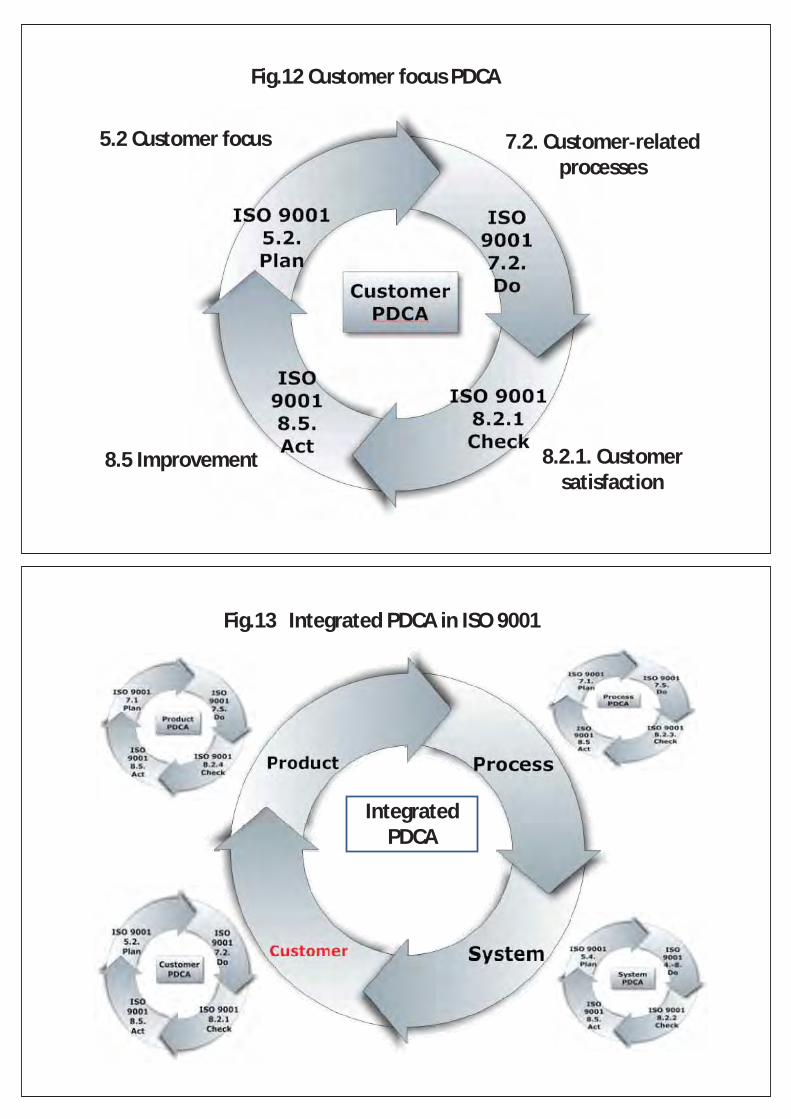
Fig.12 Customer focus PDCA
5.2 Customer focus 7.2. Customer relatedprocesses
8.2.1. Customersatisfaction
8.5 Improvement
IntegratedPDCA
Integrated PDCA in ISO 9001Fig.13

1.Problem and goaldescription
2.Data collection
Data3. Data process
l44. Cause detection
5. Root cause detectionand solution search
E6. Evaluation
7. Implementation
7 problem solving steps l7 basic quality tools
FFlowchart
Data sheet
Histogram
Pareto diagram
Ishikawa diagram
SPC chart andScatter diagram
SPC chart
IMPOVEMENT
AND
TOOLS
Fig.14
Time management
Goal: time reduction
Datacollection
Dataprocess
Random timepoints
Frequencyanalysis
Cause detection
Pareto diagram
Root causes –solutions
Ishikawa diagram
Evaluation
Individualcontrol chart
Implementation
Home workFig.15
Monday Tuesday Wednesday Thursday Friday
6.35 6.28 6.05 6.45 6.23
7.18 7.45 7.02 6.59. 7.32
8.12 10,43 9.45 7.58 9.43
9.34 11.02 10.32 8.39 10.21
11.14 12.31 11.09 9.06 10.49
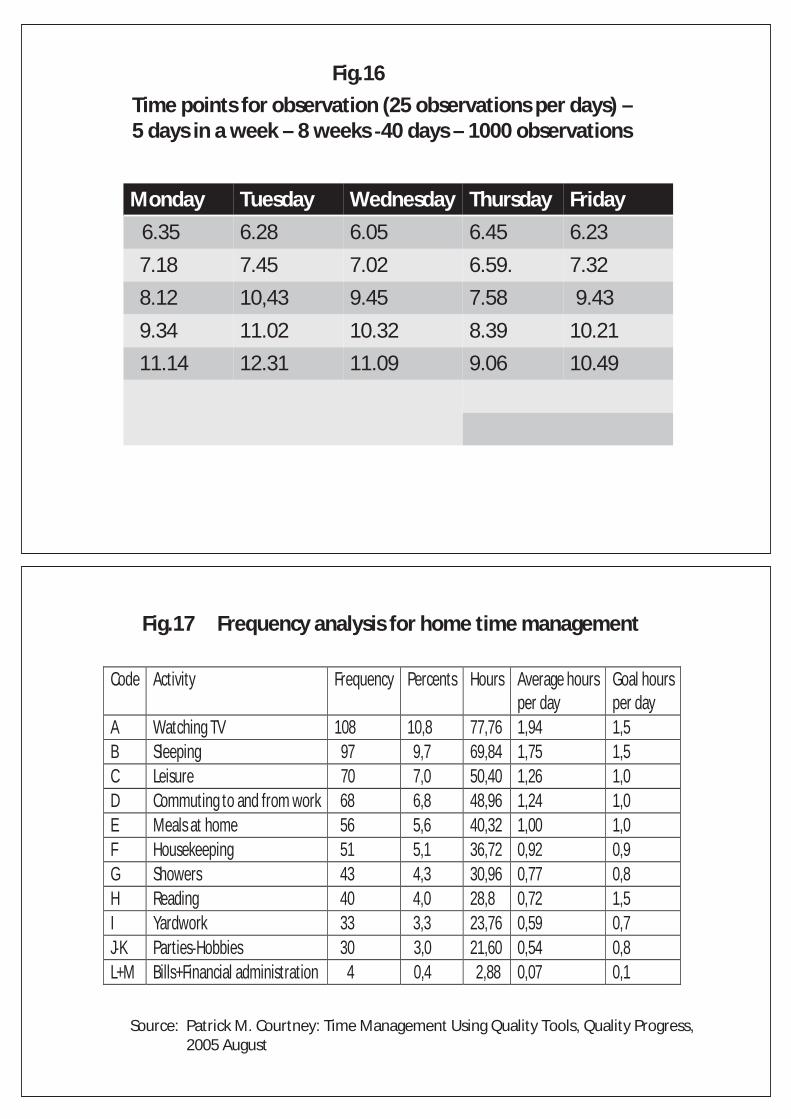
Time points for observation (25 observations per days) –5 days in a week – 8 weeks 40 days – 1000 observations
Fig.16
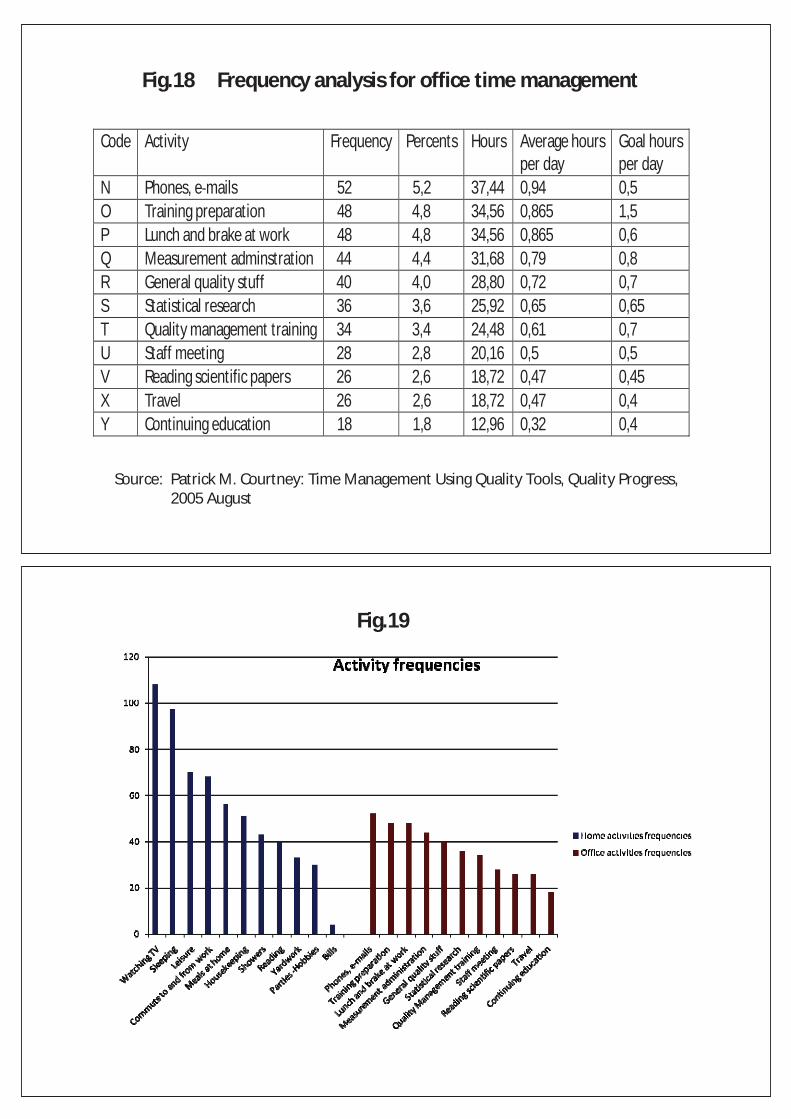
Code Activity Frequency Percents Hours Average hoursper day
Goal hoursper day
A Watching TV 108 10,8 77,76 1,94 1,5B Sleeping 97 9,7 69,84 1,75 1,5C Leisure 70 7,0 50,40 1,26 1,0D Commuting to and from work 68 6,8 48,96 1,24 1,0E Meals at home 56 5,6 40,32 1,00 1,0F Housekeeping 51 5,1 36,72 0,92 0,9G Showers 43 4,3 30,96 0,77 0,8H Reading 40 4,0 28,8 0,72 1,5I Yardwork 33 3,3 23,76 0,59 0,7J K Parties Hobbies 30 3,0 21,60 0,54 0,8L+M Bills+Financial administration 4 0,4 2,88 0,07 0,1
Frequency analysis for home time managementFig.17
Source: Patrick M. Courtney: Time Management Using Quality Tools, Quality Progress,2005 August
Code Activity Frequency Percents Hours Average hoursper day
Goal hoursper day
N Phones, e mails 52 5,2 37,44 0,94 0,5O Training preparation 48 4,8 34,56 0,865 1,5P Lunch and brake at work 48 4,8 34,56 0,865 0,6Q Measurement adminstration 44 4,4 31,68 0,79 0,8R General quality stuff 40 4,0 28,80 0,72 0,7S Statistical research 36 3,6 25,92 0,65 0,65T Quality management training 34 3,4 24,48 0,61 0,7U Staff meeting 28 2,8 20,16 0,5 0,5V Reading scientific papers 26 2,6 18,72 0,47 0,45X Travel 26 2,6 18,72 0,47 0,4Y Continuing education 18 1,8 12,96 0,32 0,4
Frequency analysis for office time managementFig.18
Source: Patrick M. Courtney: Time Management Using Quality Tools, Quality Progress,2005 August
Fig.19
Fig.20 Individual control chart
Fig.21

Use financial metrics to justify the cost of quality improvementfor management!
Quality metrics1.Mean2.Standard deviation3.Sigma level4.DPMO5.SPC charts6.Process capability7.Pareto diagram
Financial metrics1.Revenues2.Costs3.Savings4.Margins5.Return On Investment (ROI)6.Operating leverage (DOE)7.Break even analysis
Fig.22
Incomestatement
Sleep? Happyandsatisfy
Fig.23 Project cost savings waterfall chart
Source: Peter J. Sherman and James G. Vono: All Ears,Quality Progress, 2009 July

Fig. 24 Break even analysis
Source: Peter J. Sherman and James G. Vono: All Ears,Quality Progress, 2009 July
Requirements
ISO 9001 Lean Six Sigma ExcellenceProcess
ManagementProject
Management
Methods CSustainedsuccess
What? How? Result!
The Quality BridgeIIntegrated Quality Approach
Fig.25

![[PPT]Quality Improvement: Problem Solving - Saint …homepages.stmartin.edu/fac_staff/dstout/MEM650/Ch03 7 QC... · Web viewTitle Quality Improvement: Problem Solving Subject PDCA](https://static.fdocuments.in/doc/165x107/5b047a5d7f8b9a2e228de3d9/pptquality-improvement-problem-solving-saint-7-qcweb-viewtitle-quality.jpg)