
Integrated Profiling of Three Dimensional Cell Culture Models and
7
Vol. 29 no. 23 2013, pages 3087–3093 BIOINFORMATICS ORIGINAL PAPER doi:10.1093/bioinformatics/btt535 Bioimage informatics Advance Access publication September 16, 2013 Integrated profiling of three dimensional cell culture models and 3D microscopy Cemal Cagatay Bilgin, Sun Kim, Elle Leung, Hang Chang * and Bahram Parvin * Life Sciences Division, Lawrence Berkeley National Laboratory, Berkeley, CA 94720, USA Associate Editor: Jonathan Wren ABSTRACT Motivation: Our goal is to develop a screening platform for quantita- tive profiling of colony organizations in 3D cell culture models. The 3D cell culture models, which are also imaged in 3D, are functional assays that mimic the in vivo characteristics of the tissue architecture more faithfully than the 2D cultures. However, they also introduce significant computational challenges, with the main barriers being the effects of growth conditions, fixations and inherent complexities in segmentation that need to be resolved in the 3D volume. Results: A segmentation strategy has been developed to delineate each nucleus in a colony that overcomes (i) the effects of growth conditions, (ii) variations in chromatin distribution and (iii) ambiguities formed by perceptual boundaries from adjacent nuclei. The strategy uses a cascade of geometric filters that are insensitive to spatial non- uniformity and partitions a clump of nuclei based on the grouping of points of maximum curvature at the interface of two neighboring nuclei. These points of maximum curvature are clustered together based on their coplanarity and proximity to define dissecting planes that separate the touching nuclei. The proposed curvature-based par- titioning method is validated with both synthetic and real data, and is shown to have a superior performance against previous techniques. Validation and sensitivity analysis are coupled with the experimental design that includes a non-transformed cell line and three tumorigenic cell lines, which covers a wide range of phenotypic diversity in breast cancer. Colony profiling, derived from nuclear segmentation, reveals distinct indices for the morphogenesis of each cell line. Availability: All software are developed in ITK/VTK and are available at https://vision.lbl.gov/Software/3DMorphometry. Contact: [email protected] or [email protected] Supplementary information: Supplementary data are available at Bioinformatics online. Received on April 26, 2013; revised on August 16, 2013; accepted on September 9, 2013 1 INTRODUCTION High content screening of cell culture models continue to play a major role in evaluating therapeutic targets, elucidating aberrant pathways and identifying novel biomarkers. Traditionally, cell culture models are based on 2D monolayers that are grown on plastic, but recent research indicates that cells grown in a 3D culture often behave more like cells in living organisms. This is partly due to the cellular organization, cell–cell contact and unique cell–extracellular matrix (ECM) adhesions and motility phenotype. 3D cell culture models offer many advantages over the 2D monolayer systems: (i) Each cell forms an ellipsoid with dimensions of 10–30 microns (Pampaloni et al., 2007), whereas in the monolayer system, each cell remains flat with a thickness of a few microns; (ii) In a 3D system, the entire cell surface is exposed to neighboring cells and extracellular matrix. In contrast, in a 2D system, a small percentage of the cell surface is exposed to the other cells. These differences in shape and surfaces are significant given that 30% of the genome is known to encode membrane- bound macromolecules (Wallin and Heijme, 1998). (iii) Studies have shown that 3D morphological organizations have a pro- found impact on cellular function, such as morphogenesis (Fournier et al., 2009), development (Park et al., 2000), response to therapy (Liu et al., 2004) and patterns of gene expression (Han et al., 2010). (iv) Unlike conventional 2D models, 3D culture assays distinguish tumor phenotypes from non-malignant ones, where the tumor phenotype is often manifested as multicellular organizations (Peterson et al., 1992). Owing to these differences, there is a greater need for characterizing and quantifying organizations through the delineation of each cell. Because the protocols for nuclear staining are well established, we focus on delineating nuclear regions, which also provides context for quantifying multiple endpoints in high content screening. In add- ition, cell-by-cell analysis enables characterization of heterogen- eity, which is one of the central challenges and a fundamental property in cellular systems (Altschuler and Wu, 2010). It has been suggested that heterogeneity enables cellular systems to explore a wide range of phenotypic responses, where a specific subpopulation may serve as a predictor of response to perturb- ations. An example is shown in Supplementary Figure S1 in the Supplementary Section. Given the aforementioned motivation, there is clear gap in quantitative methods for characterizing multicellular organiza- tions for the next generation of high content screening systems. This is partly due to the massive amounts of 3D data that have to be acquired through confocal or deconvolution microscopy, and the ambiguities that were present in the 2D assays (Coelho et al., 2009) must now be resolved in the 3D volume space. In this article, we propose a pipeline, implemented within the Insight Segmentation and Registration Toolkit (ITK) and The Visualization Toolkit (VTK) framework, to delineate each nu- cleus and to profile morphometric and colony organization. At an abstract level, our approach is an extension of a previously developed method for monolayer cell culture models (Wen et al., 2009). Nevertheless, such an extension has proven to be challen- ging because of structural heterogeneity and partitioning of clumped nuclei in a 3D volume. Our approach consists of a *To whom correspondence should be addressed. ß The Author 2013. Published by Oxford University Press. This is an Open Access article distributed under the terms of the Creative Commons Attribution Non-Commercial License (http://creativecommons.org/licenses/ by-nc/3.0/), which permits non-commercial re-use, distribution, and reproduction in any medium, provided the original work is properly cited. For commercial re-use, please contact [email protected] Downloaded from https://academic.oup.com/bioinformatics/article/29/23/3087/248495 by guest on 04 February 2022
Transcript of Integrated Profiling of Three Dimensional Cell Culture Models and
Vol 29 no 23 2013 pages 3087ndash3093BIOINFORMATICS ORIGINAL PAPER doi101093bioinformaticsbtt535
Bioimage informatics Advance Access publication September 16 2013
Integrated profiling of three dimensional cell culture models and
3D microscopyCemal Cagatay Bilgin Sun Kim Elle Leung Hang Chang and Bahram ParvinLife Sciences Division Lawrence Berkeley National Laboratory Berkeley CA 94720 USA
Associate Editor Jonathan Wren
ABSTRACT
Motivation Our goal is to develop a screening platform for quantita-
tive profiling of colony organizations in 3D cell culture models The 3D
cell culture models which are also imaged in 3D are functional assays
that mimic the in vivo characteristics of the tissue architecture more
faithfully than the 2D cultures However they also introduce significant
computational challenges with the main barriers being the effects of
growth conditions fixations and inherent complexities in segmentation
that need to be resolved in the 3D volume
Results A segmentation strategy has been developed to delineate
each nucleus in a colony that overcomes (i) the effects of growth
conditions (ii) variations in chromatin distribution and (iii) ambiguities
formed by perceptual boundaries from adjacent nuclei The strategy
uses a cascade of geometric filters that are insensitive to spatial non-
uniformity and partitions a clump of nuclei based on the grouping of
points of maximum curvature at the interface of two neighboring
nuclei These points of maximum curvature are clustered together
based on their coplanarity and proximity to define dissecting planes
that separate the touching nuclei The proposed curvature-based par-
titioning method is validated with both synthetic and real data and is
shown to have a superior performance against previous techniques
Validation and sensitivity analysis are coupled with the experimental
design that includes a non-transformed cell line and three tumorigenic
cell lines which covers a wide range of phenotypic diversity in breast
cancer Colony profiling derived from nuclear segmentation reveals
distinct indices for the morphogenesis of each cell line
Availability All software are developed in ITKVTK and are available at
httpsvisionlblgovSoftware3DMorphometry
Contact b_parvinlblgov or hchanglblgov
Supplementary information Supplementary data are available at
Bioinformatics online
Received on April 26 2013 revised on August 16 2013 accepted on
September 9 2013
1 INTRODUCTION
High content screening of cell culture models continue to play a
major role in evaluating therapeutic targets elucidating aberrant
pathways and identifying novel biomarkers Traditionally cell
culture models are based on 2D monolayers that are grown on
plastic but recent research indicates that cells grown in a 3D
culture often behave more like cells in living organisms This is
partly due to the cellular organization cellndashcell contact and
unique cellndashextracellular matrix (ECM) adhesions and motility
phenotype 3D cell culture models offer many advantages over
the 2D monolayer systems (i) Each cell forms an ellipsoid with
dimensions of 10ndash30 microns (Pampaloni et al 2007) whereas in
the monolayer system each cell remains flat with a thickness of a
few microns (ii) In a 3D system the entire cell surface is exposed
to neighboring cells and extracellular matrix In contrast in a 2D
system a small percentage of the cell surface is exposed to the
other cells These differences in shape and surfaces are significant
given that 30 of the genome is known to encode membrane-
bound macromolecules (Wallin and Heijme 1998) (iii) Studies
have shown that 3D morphological organizations have a pro-
found impact on cellular function such as morphogenesis
(Fournier et al 2009) development (Park et al 2000) response
to therapy (Liu et al 2004) and patterns of gene expression (Han
et al 2010) (iv) Unlike conventional 2D models 3D culture
assays distinguish tumor phenotypes from non-malignant ones
where the tumor phenotype is often manifested as multicellular
organizations (Peterson et al 1992) Owing to these differences
there is a greater need for characterizing and quantifying
organizations through the delineation of each cell Because the
protocols for nuclear staining are well established we focus on
delineating nuclear regions which also provides context for
quantifying multiple endpoints in high content screening In add-
ition cell-by-cell analysis enables characterization of heterogen-
eity which is one of the central challenges and a fundamental
property in cellular systems (Altschuler and Wu 2010) It has
been suggested that heterogeneity enables cellular systems to
explore a wide range of phenotypic responses where a specific
subpopulation may serve as a predictor of response to perturb-
ations An example is shown in Supplementary Figure S1 in the
Supplementary SectionGiven the aforementioned motivation there is clear gap in
quantitative methods for characterizing multicellular organiza-
tions for the next generation of high content screening systems
This is partly due to the massive amounts of 3D data that have to
be acquired through confocal or deconvolution microscopy and
the ambiguities that were present in the 2D assays (Coelho et al
2009) must now be resolved in the 3D volume space In this
article we propose a pipeline implemented within the Insight
Segmentation and Registration Toolkit (ITK) and The
Visualization Toolkit (VTK) framework to delineate each nu-
cleus and to profile morphometric and colony organization At
an abstract level our approach is an extension of a previously
developed method for monolayer cell culture models (Wen et al
2009) Nevertheless such an extension has proven to be challen-
ging because of structural heterogeneity and partitioning of
clumped nuclei in a 3D volume Our approach consists of aTo whom correspondence should be addressed
The Author 2013 Published by Oxford University Press
This is an Open Access article distributed under the terms of the Creative Commons Attribution Non-Commercial License (httpcreativecommonsorglicenses
by-nc30) which permits non-commercial re-use distribution and reproduction in any medium provided the original work is properly cited For commercial
re-use please contact journalspermissionsoupcom
Dow
nloaded from httpsacadem
icoupcombioinform
aticsarticle29233087248495 by guest on 04 February 2022
series of filters that remove ambiguities in (i) the nuclear stainthrough prior modeling (ii) the structural heterogeneity throughobject level adaptive smoothing and (iii) the perceptual bound-
aries within a clump of cells by detecting and grouping points ofmaximum curvature These processes are intrinsically compute-intensive in a 3D volume As a result the segmentation strategy
initially detects isolated nuclei and groups of nuclei that areclumped together prior to subsequent partitioning The netresult is increased throughput for processing a large amount of
data The proposed method is referred to as curvature-basedpartitioning (CBP) in the remainder of the articleOrganization of the article is as follows Section 2 provides a
brief review of the motivation issues and prior research Section3 discusses details of the experimental design and computationalapproach Section 4 provides validation results on synthetic and
real data and compares performance of CBP with the previoustechniques Section 5 compares morphogenesis of multiple cell
lines in terms of the colony organization Section 6 concludes thearticle
2 BACKGROUND
In Section 1 we reviewed the prior literature to suggest that the3D cell culture models are in fact functional assays As a result
the utility of these model systems have been on the rise Forexample in 2008 the growth rate for the number of publicationsexploiting 3D cell culture models increased by 153 of the pre-
vious year (www3dcellculturecom) ie from approximately370ndash930 publications This trend indicates the growing import-
ance for multicellular segmentation and profiling Challenges forsegmenting the 3D colonies are similar to those involving the 2Dassays they include (i) variation in cellular state and cell shape
and (ii) the traditional issue of the perceptual boundaries be-tween adjacent nuclei Moreover segmentation of 3D coloniesis aggravated by complex volumetric analysis and cellular growth
in the MatrigelThe key concepts in delineating nuclei have been watershed
(Chawla et al 2004) with user intervention active surface
models (Padfield et al 2009) gradient flow tracking (GFT) (Liet al 2007) atlas-based methods (Qu et al 2011) and hybridmethods of seed detection through iterative voting (IV) and geo-
metric partitioning (Han et al 2011) Interactive techniques arenot amenable for large scale data and the watershed method isprone to erroneous partitioning of the image space On the other
hand level set method while having a solid analytical founda-tion requires robust initialization and stopping criterion they
can also benefit from the prior shape models Of course anysegmentation technique can benefit from additional constraintsbut creating the necessary diversity of prior models can add to
the complexity GFT which is conceptually similar at an ab-stract level to the radial centroid transform (Yang and Parvin2003) is sensitive to morphometric aberrations and internal
structure within the nucleus Whereas the atlas-based modelsassume a prior model of organization which is (i) nonexistentfor the growth of 3D cell culture models and (ii) difficult to
generate as a result of cellular and organizational heterogeneityThe general strategy for segmentation has been to detect a dis-tinct seed per nucleus [eg LoG radial centroid transform (IV)]
that is followed through geometric partitioning These techniques
work well in live cell assays and when each cell in a whole or-ganism has a similar morphology In contrast fixed cell assays
may have artifacts that lead to dislocation of constituents and
cancer cells are well known to have aberrant morphologies In
addition multicellular systems cultured in Matrigel can have
higher background intensity within the colony than outside of
the colony which complicates cell-by-cell segmentation The
novelty of our approach is that it incorporates these insights
and overcomes intrinsic barriers associated with the segmenta-
tion of 3D cell culture models
3 APPROACH
One of the barriers in delineating a multicellular colony system
has to do with separating touching nuclei in 3D The basic idea
for segmentation is to use curvature feature to detect perceptual
boundaries (eg touching adjacent nuclei) however curvature
can be noisy as a result of structural nucleoli which is respon-
sible for transcribing ribosomal RNA Therefore the first step is
to interpolate nucleoli (eg smoothing) through harmonic cut
(Yang and Parvin 2003) Furthermore 3D segmentation is in-
trinsically compute intensive which motivates for a more oppor-
tunistic policy for quantitative analysis These insights are thebasis of the organization and integration of filters shown in
Figure 1 Accordingly the method integrates a cascade of filter
operations to eliminate ambiguities in a stepwise fashion (i) The
approach replaces the original image with harmonic cut where
inter-nuclei structural details (eg nucleoli) are interpolated for
smoothness (ii) An initial segmentation delineates isolated nuclei
or clumps of nuclei from the background These segmented re-
gions provide the basis for decomposing the space through
Voronoi partitioning (iii) Simultaneously the clumped nuclei
are separated along their overlapping regions These overlapping
regions are detected using curvature maxima and clustered to
define dissecting planes (iv) The aggregate of dissecting planesand Voronoi partitioning are then combined to define polytopes
where segmentation can be refined locally Lastly each deli-
neated nucleus is validated with its surface curvature properties
Each of these steps is discussed below
31 Materials and methods
3D cell cultures are grown in Matrigel using on-top method (Lee
et al 2007) for one non-transformed line MCF10A (Michigan
Cancer Foundation) and three malignant lines of MCF7 MDA-
MB-231 (Monroe Dunaway Anderson metastatic breast) and
MDA-MB-468 All cell lines are breast epithelial lines that
Fig 1 Steps in segmentation of nuclei in a 3D cell culture model The
partitioning of the clumped nuclei consists of four distinct operations
3088
CCBilgin et al
Dow
nloaded from httpsacadem
icoupcombioinform
aticsarticle29233087248495 by guest on 04 February 2022
have been obtained from American Type Culture CollectionThe malignant lines are selected for their genetic and morpho-
metric diversity From a genetic perspective MCF7 is estrogenand progesterone positive (ERthorn PRthorn) as well as ERBB2
MDA-MB-468 is ERBB2thorn and MDA-MB-231 is triple negative(eg ER PR and ERBB2) From a morphometric perspec-
tive MCF7 MDA-MB-468 and MDA-MB231 maintain alsquomassrsquo lsquogrape-likersquo and lsquostellatersquo colony organization per nomen-
clature (Han et al 2010) All colonies are fixed and stained with406-diamidino-2-phenylindole (DAPI) These diverse cell lines
were specifically selected as they provide a wide range of pheno-typic diversity for validation and sensitivity analysis For
MCF10A and MCF7 samples were collected on days 2 5 7and 12 For MDA-MB-231 and MDA-MB-468 samples were
fixed and stained for days 2 5 and 7 For the latter two lines theexperiment was discontinued after day 7 as a result of nearby
colonies merging because of their invasive growth propertySamples were imaged with a Zeiss LSM710 confocal with pixel
size of 025 in X and Y and 1 micron in Z dimensions All imageswere scaled isotropically for processing and visualization
32 Elliptic features and harmonic cut filtering
The first step is to replace the original scaled image stack (eg
isotropic representation of the image) with a smooth version byremoving the structural heterogeneity It is important that
smoothing is performed at object level as opposed to pixellevel (eg anisotropic diffusion) In this context smoothing
aims at detecting and interpolating subcellular structures suchas nucleoli These structures are detected using elliptic features
and interpolation is performed with the harmonic cuts (Yangand Parvin 2003)
Let I Im and Imn be the image intensity with image partialderivatives in m and mn directions respectively In scale-space
theory the elliptic features are defined by IxxIyy I2xy This def-inition is extended to 3D and the elliptic points are then found
using Ixx Iyy4I2xy ^ Ixx Izz4I2xz ^ Iyy Izz4I2yz These ellipticfeatures correspond to bright punctate regions within the nucleus
when the determinant of the Hessian is negative The bright el-liptic features are interpolated with their immediate background
through harmonic cut which minimizes the functional12
RRRE I
2x thorn I2y thorn I2z dxdydz The EulerndashLagrange solution to this
optimization is the Laplace equation r2I frac14 Ixx thorn Iyy thorn Izz frac14 0which defines a harmonic function This step has a single par-
ameter that corresponds to the scale of smoothing and is set at frac14 4 Figure 2b and c shows the original image and the effect of
harmonic cut respectively The solution to the Laplacian isincluded in the Supplementary Section S2
33 Initial segmentation
To increase computational throughput individual nucleus andclumps of nuclei are delineated from the background using an
initial segmentation The staining is highly variable as a result ofthe cell states The problem is further complicated with hetero-
geneous background signal within and outside of the colonyThese complications hinder any type of global thresholding
(eg Otsu) therefore delineation must be within a local neigh-borhood Simultaneously the initial segmentation increases com-
putational throughput as a complex problem is reduced to
smaller subproblems One strategy for detecting of the initial
seeds is through application of the bright elliptic features asoutlined in section 32 These feature detectors (i) respond to
the local spatial topography (ii) are invariant to the signal
strength (eg variable staining) and (iii) have improved noiseimmunity because of Gaussian smoothing kernel An example
of initial seed detection for one slice of image is shown inFigure 2d These initial seeds are subsequently refined through
geodesic level sets where fragmented blobs within a nucleuscan be merged Let I be in the image intensity u be the impli-
cit representation of the evolving surface g be the image gradi-ent then the initial segmentation of the nuclear regions are
estimated by solving the following evolution equationut frac14 gethITHORNjrujthorn rgethITHORN jruj where g frac14 1
1thornjrethITHORNjp and frac14 divrujruj
(Caselles et al 1997) The net result is that fragmented seedswithin a nucleus are merged subject to the gradient constraint
34 Partitioning clumped nuclei
The partitioning approach builds on the observation that when
two adjacent nuclei overlap they form folds and principle curva-ture along the fold is significantly increased (eg curvature
maxima) These points of maximum curvature are used todetect the boundaries between the overlapping nuclei and separ-
ate them Once identified these points are clustered on the basis
of proximity and coplanarity A plane is then fit to each clusterThese planes are used to partition the volume into subdivisions
whereby a local segmentation could be performed more faith-fully Each of these steps is shown in Figure 3 and summarized in
the next sections
341 Curvature computation Curvature can be estimated either
from 3D volumetric data or calculated from segmented surfacesIn the proposed pipeline curvature features are first estimated
from volumetric data for initial partitioning the space Havingsegmented each nucleus we then use surface curvature in section
36 for validation Volumetric curvature is computed from differ-ential geometric properties (eg partial derivative) of a 3D image
stack (Thirion andGourdon 1995) Once the maximum principalcurvature values are localized they are thresholded to identify the
curvature maxima These maxima points correspond to regionsbetween two overlapping adjacent nuclei The details of curvature
computation are included in the Supplementary Section S3
342 Clustering points of maximum curvature and planefitting Computed curvature maxima convey the boundaries
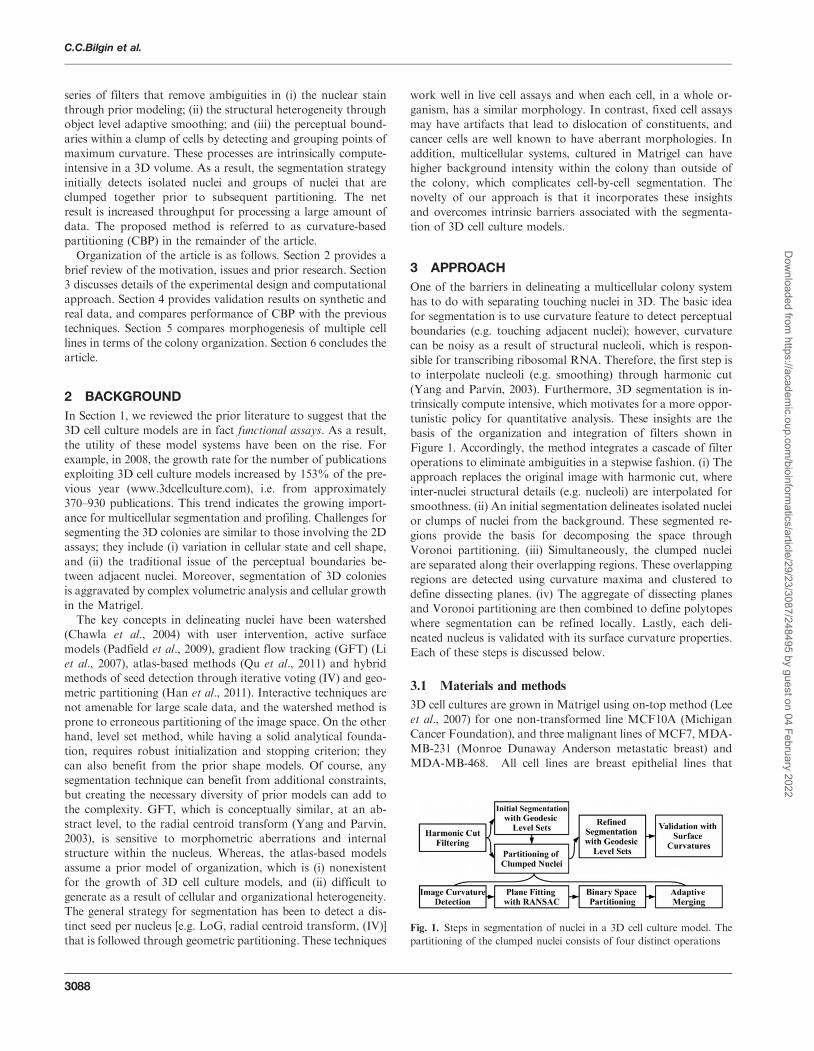
Fig 2 Harmonic cut filtering and seed detection on a 2D slice (a b)
original 3D volume and a slice in the middle of the stack (c) detection
of dark elliptic regions followed by harmonic cuts removes small punctate
internal structures corresponding to nucleoli and (d) results of initial seed
detection from bright elliptic regions Initial seeds labeled in red are frag-
mented within one of the nuclei however these seeds are merged through
the application of geodesic level set to hypothesize an initial segmentation
3089
Integrated Profiling
Dow
nloaded from httpsacadem
icoupcombioinform
aticsarticle29233087248495 by guest on 04 February 2022
between the touching nuclei Points of maximum curvature form
a ring on a specific plane P for two adjacent nuclei Using this
observation we group points of maximum curvature to find a set
of planes for decomposing the colony into individual nuclei
Geometric grouping is performed on the basis of proximity
and coplanarity of the points using Euclidean clustering and
RANdom SAmple Consensus (RANSAC) (Fischler and Bolles
1981) To fit planes to the points of maximum curvature the
iterative RANSAC method is used In this approach a model
is fitted to the points of maximum curvature using the RANSAC
algorithm the inliers are found and removed from the dataset
The remaining dataset is used for fitting more models when pos-
sible The output of this step is a set of plane models that will be
used to partition the clumps of nuclei
343 Binary space partitioning of clumped nuclei RANSACprovides a natural way to cluster points of maximum curvature
based on coplanarity and proximity The clustered points of
curvature maxima define planes that can partition a clump of
nuclei into individual nucleus It should be noted that the parti-
tioning space is exponential in the number of planes ie for n
planes there are Oeth2nTHORN subdivisions Therefore we use an ap-
proach similar to binary space partitioning with auto-partitions
which allows the partition complexity to become Oethn2THORN (De Berg
et al 2008)Denote the volume to be partitioned by V Also denote each
cluster of points of maximum curvature by C and the set of all
clusters by SC Each cluster of points of maximum curvature
defines a plane P with the set of all the planes defined by the
clusters by SP In our partitioning algorithm the volume V is
divided by a plane Pi 2 Sp into two halves with one half falling
to the negative side of the dividing plane ethVTHORN and the other half
falling on the positive side of the plane ethVthornTHORN The plane Pi also
separates the set SC into two SC and SthornC respectively Each
subdivision is further divided with the planes into their respectedsubspace recursively Within each subdivision defined by theintersecting planes computed from points of maximum curva-
ture connected components are performed and the disconnectedobjects are further partitioned using Voronoi partitioning
344 Adaptive Merging Despite a robust set of geometric op-erations previous steps may lead into fragmentation of a nucleusvia binary space partitioning Therefore a policy to validate each
of the hypothesized subdivisions is needed A dissecting plane fora subdivision is considered invalid when the correspondingpoints of maximum curvature for that plane lie on a different
subdivision For example in Figure 3 polytope 2 is invalid asthere are no curvature maxima on the polytope Partitions withinvalid planes are identified and merged back to an adjacent
partition in the opposite side of the plane
35 Refinement of the initial segmentation
As a result of the (i) variations in the background signal withinand outside of the colony (ii) intrinsic artifacts in imaging a 3Dcolony at different Z positions and (iii) heterogeneity in the cell
states refinement of the initial segmentation is needed for a moreaccurate representation In this step the geodesic level setsmethod is applied one more time within the refined space of
the polytope for improved delineation
36 Validation of geometric constraints
The computational pipeline can benefit from additional valid-ation to assure that geometric constraints are satisfied For ex-ample our analysis reveals that the computation of the image
curvature described in section 341 may miss a clump of nucleibecause of the scale of the fold between two adjacent nuclei Thisproblem is more significant in the Z direction because of its lower
resolution and potential accidental alignment of two overlapping
Fig 3 Steps in delineating the nuclear architecture
3090
CCBilgin et al
Dow
nloaded from httpsacadem
icoupcombioinform
aticsarticle29233087248495 by guest on 04 February 2022
nuclei along the Z direction Validation of the geometric con-
straints is based on building surface meshes and computing sur-
face curvatures The same partitioning strategy as in section342 is also used to partition a polytope further
After building a triangular mesh (eg discrete marching
cubes) the discrete Gaussian surface curvature at vertex v is
found by measuring the excess angle at vertex v made by the
incident triangles Specifically Kv frac14 2Pi
i where i rsquos are
the interior angles of all triangles meeting at vertex v On the
other hand the mean curvature for the surface is the sum of the
dihedral angles at e made by the incident triangle normals
weighted by the edge lengths Hv frac14P
e2E letheTHORNe Having calcu-
lated the mean and Gaussian curvatures the principal curvatures
are calculated these values are then thresholded and if enough
data points exist they are used to partition the polytopes as
described previously Details and visual examples are given in
Supplementary Section S4
4 VALIDATION AND COMPARISON
Quantification of the multicellular organization requires success-
ful delineation of each nucleus The proposed computational
pipeline was (i) evaluated with synthetic and manually annotated
images (ii) compared with alternative methods and (iii) applied
to a dataset of MCF10A MCF7 MDA-MB-231 and MDA-
MB-468 cell lines that are fixed in culture at days 2 5 and 7
for quantifying morphogenesis The importance of this experi-
mental design is that genetically diverse cell lines provide a sig-
nificant phenotypic diversity for proof of concept and validation
Comparison is performed against watershed-based techniquessuch as marker-based watershed IV and GFT (Li et al 2007)
based on the availability of the source code
Synthetic Data The efficacy of the proposed method is eval-
uated using synthetically generated datasets The experimental
setup involves 50 randomly generated colonies where nuclei
with ellipsoidal geometry are placed on the surface of a sphere
that represents a colony Each ellipsoidal nucleus is randomly
placed and rotated on the colony sphere Having constructed a
synthetic volume the images are corrupted with four types of
noise models (i) additive Gaussian noise (ii) speckle noise (iii)
shot noise and (iv) salt and pepper noise A peak signal-to-noise
ratio (PSNR) of 9 dB is used for all the experiments PSNR is
given by 10 log10MAX2
I
MSE
where MAXI is the maximum inten-
sity value and MSE is the mean squared error between the noise
and the input signal The parameter setting for the experiments is
as follows for initial segmentation frac14 20 ts frac14 005 for image
curvature detection frac14 3 and for plane fitting p frac14 50 and
T frac14 3 are used In all four cases the nuclei are correctly deli-
neated from each other A sample of each test case is shown in
Figure 4 along with segmentation using proposed method and
classical watershed technique Table 1 summarizes precision and
recall for all of the experiments subject to multiple noise
conditionsReal Data In all 70 image stacks (eg 70 colonies) were
manually annotated from two independent datasets for valid-
ation and comparative analysis Results are represented at
three levels (i) comparison with the watershed-based techniques
(ii) visualization of colony organization for different cell lines
and (iii) precision and recall over annotated dataset The param-
eter setting for processing the real data was identical to the syn-
thetic dataset as in the previous section Variations up to 20
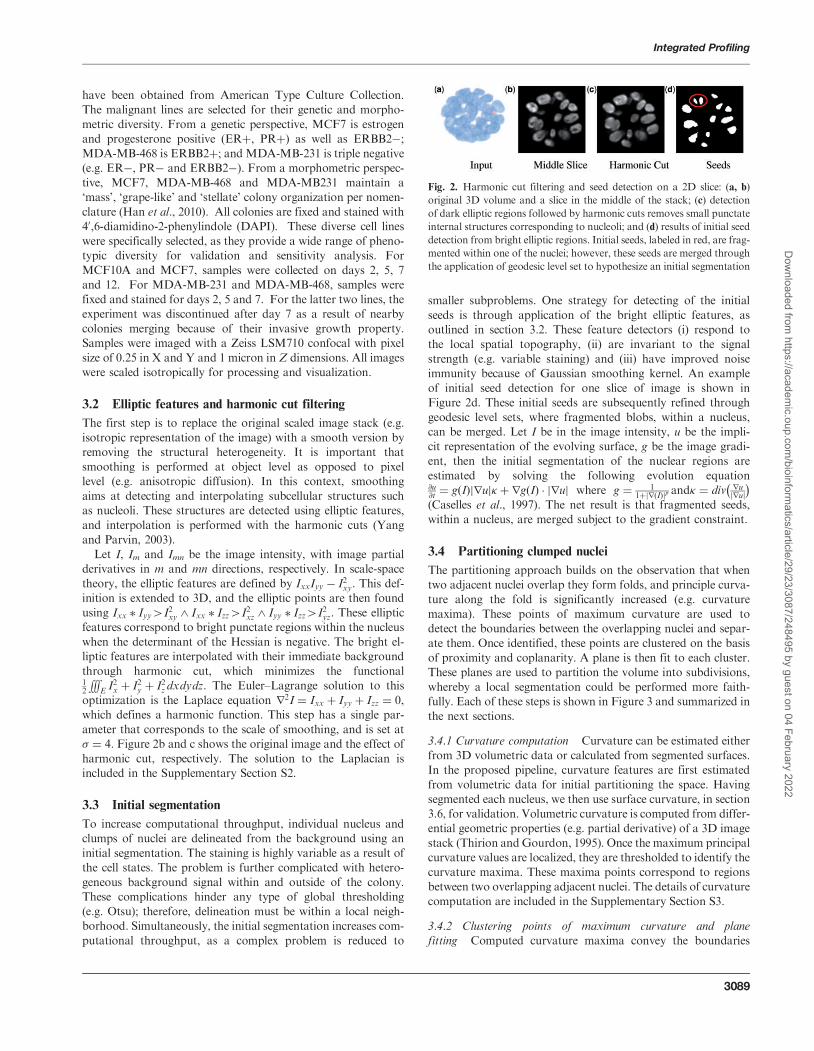
had no impact on the final outcome (i) Figure 5 shows a sample
of segmentation results and comparison with variants of water-
shed-based method (ii) Figure 6 shows a sample of segmented
colony organization for each of the four cell lines (iii) Table 2
shows superior precision and recall against alternative methods
for the annotated dataset Potential failures are (a) accidental
alignment between two adjacent nuclei that form a partial fold
Fig 4 First column illustrates Gaussian speckle shot and salt and
pepper noise models on four randomly generated colonies The segmen-
tation of each colony is provided in the second column and the water-
shed results are given in the third column
Table 1 Object level precision for synthetic data
Algorithm Gaussian Shot Speckle Median
CBP precision 10 10 10 10
CBP recall 10 10 10 10
CBP F-measure 10 10 10 10
IV precision 096 090 099 093
IV recall 097 10 10 084
IV F-measure 097 095 099 088
GFT precision 084 081 075 091
GFT recall 059 049 050 064
GFT F-measure 069 061 060 075
Note Object level precision recall values for the synthetic datasets with different
noise models are given PSNR is set to 9dB
3091
Integrated Profiling
Dow
nloaded from httpsacadem
icoupcombioinform
aticsarticle29233087248495 by guest on 04 February 2022
with insufficient information for partitioning them (shown in
Supplementary Section S5) and (b) sequential RANSAC infer-
ring incorrect partitioning because of its greedy nature however
multi-RANSAC (Isack and Boykov 2012) should reduce the
frequency of incorrect plane fitting On average each stack is
about 512 512 80 pixels and the processing time is 2min
stack with an 800 Mb of memory usage
5 MORPHOGENESIS COMPARISON
Comparison needs to be performed in context For example it is
well known that MCF10A and MCF7 have a well-contained
symmetrical organization whereas MDA-MB-231 and MDA-
MB-468 have more invasive growth properties Therefore mor-
phogenesis analysis is performed by comparing (i) MCF10A
against MCF7 and (ii) all four lines simultaneously In both
cases colony organization is multiparametrically profiled with
the Delaunay triangulationIn the first case the MCF10A line is a non-transformed line
whereas the MCF7 line is tumorigenic one Non-transformed
lines should form a hollow sphere by day 10 ie cells inside the
colony should go through apoptosis Thus a potential index for
lumen formation is the distribution of distances of nuclei to the
center of the convex hull (CH) in a colony Depending on the type
of cell lines during the colony growth the distance of some of the
nuclei to the center of the CH is increased whereas others may
remain unchanged There are a number of ways to visualize cel-
lular organization for quality control as seen in Figure 7a which
shows a distribution of distance of nuclei to the center of the CH
for MCF10A Our investigation indicates that a preferred index
for lumen formation lumenosity is the volume of the CH that
excludes nuclear information where the CH is generated from the
centroids of nuclei in a colony Computation of CH is supported
by the VTK library The evolutions of the lumenosity indices for
MCF10A andMCF7 are shown in Figure 7b which is consistent
with the published literature asMCF7 does not form a lumen (eg
a hollow sphere) (Kenny et al 2007)In the second case colony organization is quantified across
the four cell lines as shown in Figure 7c and d In contrast to
MCF10A and MCF7 the other two lines have an invasive mor-
phogenesis Among computed colony indices lsquoColony
Elongationrsquo and lsquoMean Edge Lengthrsquo were identified to be dis-
criminative between the four cell lines Colony Elongation is
Fig 6 Two examples of MCF10A (ab) MCF7 (cd) MDA-MB-468
(ef) and MDA-MB-231 (gh) cell lines on day 7
Fig 5 Comparison with watershed-based methods on a stack of
MCF10A cell line (a) An example input is given The results of
watershed marker based watershed and the proposed curvature-based
partitioning (CBP) is provided in (b) (c) and (d) respectively
Table 2 Pixel and object level precision recall values for the annotated
dataset
Measurement Type Watershed Marker-based
watershed
GFT IV CBP
BF precision 095 084 095 097 086
BF recall 044 052 082 079 084
BF F-measure 060 058 088 087 085
Object precision 075 088 088 087 097
Object recall 067 072 087 086 095
Object F-measure 071 080 088 087 096
Note BF stands for BackgroundForeground
3092
CCBilgin et al
Dow
nloaded from httpsacadem
icoupcombioinform
aticsarticle29233087248495 by guest on 04 February 2022
calculated as the ratio of 1=2 where 1 2 3 are thelengths of principal moments of the colony For MCF10A and
MCF7 lines the elongation of the colony is significantly lowercompared with the 231 and 468 cell lines at day 7 There is also a2-fold difference between the 231 and 468 cell lines andMCF10A which indicates invasiveness of these cell lines The
mean edge length of these colonies is used as an index to measurethe dispersion of the nuclei in the colony space Both 231 and 468lines are showing increased mean edge lengths in our experiments
as a result of increased proliferation (Fig 7(d))
6 CONCLUSION
With the increasing demand for high content screening of 3D cell
culture models the CBP method is a highly effective approachfor segmentation and subsequent profiling Evaluation and test-ing of CBP have been tightly coupled with the experimental
design that consists of four cell lines with a significant geneticdiversity and distinct phenotypic signatures Comparison of CBPwith the alternative methods demonstrates superior performance
in terms of the error rates Furthermore multiparametric repre-sentation for the colony organization has identified indices thatcapture aberrant and normal morphogenesis in these four celllines The software has been developed in ITKVTK framework
for improved portability and memory use
ACKNOWLEDGEMENTS
We would like to thank Michelle Scott for her invaluable assis-
tance in microscopy and the Bissell lab for biological reagents
Funding National Institute of Health [grant R01 CA140663] andcarried out at Lawrence Berkeley National Laboratory underContract No DE-AC02-05CH11231
Conflicts of Interest none declared
REFERENCES
AltschulerS and WuL (2010) Cellular heterogenetity do differences make a dif-
ference Cell 141 559ndash563
CasellesV et al (1997) Geodesic active contours Int J Comput Vis 22 61ndash79
ChawlaM et al (2004) 3D-catFISH J Neurosci Methods 139 13ndash24
CoelhoL et al (2009) Nuclear segmentation in microscope cell images In ISBI
IEEE pp 518ndash521
De BergM et al (2008) Computational geometry algorithms and applications
Springer-Verlag New York Inc
FischlerM and BollesR (1981) Random sample consensus a paradigm for model
fitting with applications to image analysis and automated cartography
Commun ACM 24 381ndash395
FournierM et al (2009) Interaction of E-cadherin and PTEN regulates morpho-
genesis and growth and growth arrest in human mammary epithelial cells
Cancer Res 69 4545ndash4552
HanJ et al (2010) Molecular predictors of 3Dmorphogenesis by breast cancer cells
in 3D culture PLoS Comput Biol 6 e1000684
HanJ et al (2011) Multiscale iterative voting for differential analysis of stress
response for 2D and 3D cell culture models J Microsc 87 696ndash710
IsackH and BoykovY (2012) Energy-based geometric multi-model fitting Int J
Comput Vision 97 123ndash147
KennyP et al (2007) The morphologies of breast cancer cell lines in three-dimen-
sional assays correlate with their profiles of gene expression Mol Oncol 1
84ndash96
LeeG et al (2007) Three-dimensional culture models of normal and malignant
breast epithelial cells Nat Methods 4 359ndash365
LiG et al (2007) 3D cell nuclei segmentation based on gradient flow tracking
BMC Cell Biol 8 1ndash10
LiuH et al (2004) Polarity and proliferation are controlled by distinct signaling
pathways downstream of PI3-kinase in breast epithelial tumor cells J Cell Biol
164 603ndash612
PadfieldD et al (2009) Spatio-temporal cell cycle phase analysis using level sets and
fast marching methods Med Image Anal 13 143ndash155
PampaloniF et al (2007) The third dimension bridges the gap between the cell
culture and live tissue Nat Rev Mol Cell Biol 8 839ndash845
ParkC et al (2000) The influence of the micro-environment on the malignant
phenotype Mol Med Today 6 324ndash329
PetersonO et al (1992) Interaction with basement membrane serves to rapidly
distinguish growth and differentiation pattern of normal and malignant
human breast epithelial cells PNAS 89 9064ndash8
QuL et al (2011) Simultaneous recognition and segmentation of cells application
in C Elegans Bioinformatics 27 2895ndash2902
ThirionJ and GourdonA (1995) Computing the differential characteristics of
isointensity surfaces Comput Vis Image Underst 61 190ndash202
WallinE and HeijmeG (1998) Genome-wide analysis of integral membrane pro-
teins from eubacterial archaean and eukaryotic organisms Protein Sci 7
1029ndash1038
WenQ et al (2009) A Delaunay triangulation approach for segmenting clumps of
nuclei In ISBI IEEE pp 9ndash12
YangQ and ParvinB (2003) Harmonic cut and regularized centroid transform for
localization of subcellular structures IEEE Trans Biomed Eng 50 469ndash476
Fig 7 (a) A computed morphogenesis index corresponding to the distance of each nucleus to the center of the CH of the MCF10A colony (b) another
computed index indicating an index that represents percentages of nuclei being at a specific distance to the center of the colony for MCF7 and MCF10A
It is clear that MCF10A forms a lumen but MCF7 does not (c d) MDA-MB-468 and MDA-MB-231 have non-symmetrical growth properties
3093
Integrated Profiling
Dow
nloaded from httpsacadem
icoupcombioinform
aticsarticle29233087248495 by guest on 04 February 2022
series of filters that remove ambiguities in (i) the nuclear stainthrough prior modeling (ii) the structural heterogeneity throughobject level adaptive smoothing and (iii) the perceptual bound-
aries within a clump of cells by detecting and grouping points ofmaximum curvature These processes are intrinsically compute-intensive in a 3D volume As a result the segmentation strategy
initially detects isolated nuclei and groups of nuclei that areclumped together prior to subsequent partitioning The netresult is increased throughput for processing a large amount of
data The proposed method is referred to as curvature-basedpartitioning (CBP) in the remainder of the articleOrganization of the article is as follows Section 2 provides a
brief review of the motivation issues and prior research Section3 discusses details of the experimental design and computationalapproach Section 4 provides validation results on synthetic and
real data and compares performance of CBP with the previoustechniques Section 5 compares morphogenesis of multiple cell
lines in terms of the colony organization Section 6 concludes thearticle
2 BACKGROUND
In Section 1 we reviewed the prior literature to suggest that the3D cell culture models are in fact functional assays As a result
the utility of these model systems have been on the rise Forexample in 2008 the growth rate for the number of publicationsexploiting 3D cell culture models increased by 153 of the pre-
vious year (www3dcellculturecom) ie from approximately370ndash930 publications This trend indicates the growing import-
ance for multicellular segmentation and profiling Challenges forsegmenting the 3D colonies are similar to those involving the 2Dassays they include (i) variation in cellular state and cell shape
and (ii) the traditional issue of the perceptual boundaries be-tween adjacent nuclei Moreover segmentation of 3D coloniesis aggravated by complex volumetric analysis and cellular growth
in the MatrigelThe key concepts in delineating nuclei have been watershed
(Chawla et al 2004) with user intervention active surface
models (Padfield et al 2009) gradient flow tracking (GFT) (Liet al 2007) atlas-based methods (Qu et al 2011) and hybridmethods of seed detection through iterative voting (IV) and geo-
metric partitioning (Han et al 2011) Interactive techniques arenot amenable for large scale data and the watershed method isprone to erroneous partitioning of the image space On the other
hand level set method while having a solid analytical founda-tion requires robust initialization and stopping criterion they
can also benefit from the prior shape models Of course anysegmentation technique can benefit from additional constraintsbut creating the necessary diversity of prior models can add to
the complexity GFT which is conceptually similar at an ab-stract level to the radial centroid transform (Yang and Parvin2003) is sensitive to morphometric aberrations and internal
structure within the nucleus Whereas the atlas-based modelsassume a prior model of organization which is (i) nonexistentfor the growth of 3D cell culture models and (ii) difficult to
generate as a result of cellular and organizational heterogeneityThe general strategy for segmentation has been to detect a dis-tinct seed per nucleus [eg LoG radial centroid transform (IV)]
that is followed through geometric partitioning These techniques
work well in live cell assays and when each cell in a whole or-ganism has a similar morphology In contrast fixed cell assays
may have artifacts that lead to dislocation of constituents and
cancer cells are well known to have aberrant morphologies In
addition multicellular systems cultured in Matrigel can have
higher background intensity within the colony than outside of
the colony which complicates cell-by-cell segmentation The
novelty of our approach is that it incorporates these insights
and overcomes intrinsic barriers associated with the segmenta-
tion of 3D cell culture models
3 APPROACH
One of the barriers in delineating a multicellular colony system
has to do with separating touching nuclei in 3D The basic idea
for segmentation is to use curvature feature to detect perceptual
boundaries (eg touching adjacent nuclei) however curvature
can be noisy as a result of structural nucleoli which is respon-
sible for transcribing ribosomal RNA Therefore the first step is
to interpolate nucleoli (eg smoothing) through harmonic cut
(Yang and Parvin 2003) Furthermore 3D segmentation is in-
trinsically compute intensive which motivates for a more oppor-
tunistic policy for quantitative analysis These insights are thebasis of the organization and integration of filters shown in
Figure 1 Accordingly the method integrates a cascade of filter
operations to eliminate ambiguities in a stepwise fashion (i) The
approach replaces the original image with harmonic cut where
inter-nuclei structural details (eg nucleoli) are interpolated for
smoothness (ii) An initial segmentation delineates isolated nuclei
or clumps of nuclei from the background These segmented re-
gions provide the basis for decomposing the space through
Voronoi partitioning (iii) Simultaneously the clumped nuclei
are separated along their overlapping regions These overlapping
regions are detected using curvature maxima and clustered to
define dissecting planes (iv) The aggregate of dissecting planesand Voronoi partitioning are then combined to define polytopes
where segmentation can be refined locally Lastly each deli-
neated nucleus is validated with its surface curvature properties
Each of these steps is discussed below
31 Materials and methods
3D cell cultures are grown in Matrigel using on-top method (Lee
et al 2007) for one non-transformed line MCF10A (Michigan
Cancer Foundation) and three malignant lines of MCF7 MDA-
MB-231 (Monroe Dunaway Anderson metastatic breast) and
MDA-MB-468 All cell lines are breast epithelial lines that
Fig 1 Steps in segmentation of nuclei in a 3D cell culture model The
partitioning of the clumped nuclei consists of four distinct operations
3088
CCBilgin et al
Dow
nloaded from httpsacadem
icoupcombioinform
aticsarticle29233087248495 by guest on 04 February 2022
have been obtained from American Type Culture CollectionThe malignant lines are selected for their genetic and morpho-
metric diversity From a genetic perspective MCF7 is estrogenand progesterone positive (ERthorn PRthorn) as well as ERBB2
MDA-MB-468 is ERBB2thorn and MDA-MB-231 is triple negative(eg ER PR and ERBB2) From a morphometric perspec-
tive MCF7 MDA-MB-468 and MDA-MB231 maintain alsquomassrsquo lsquogrape-likersquo and lsquostellatersquo colony organization per nomen-
clature (Han et al 2010) All colonies are fixed and stained with406-diamidino-2-phenylindole (DAPI) These diverse cell lines
were specifically selected as they provide a wide range of pheno-typic diversity for validation and sensitivity analysis For
MCF10A and MCF7 samples were collected on days 2 5 7and 12 For MDA-MB-231 and MDA-MB-468 samples were
fixed and stained for days 2 5 and 7 For the latter two lines theexperiment was discontinued after day 7 as a result of nearby
colonies merging because of their invasive growth propertySamples were imaged with a Zeiss LSM710 confocal with pixel
size of 025 in X and Y and 1 micron in Z dimensions All imageswere scaled isotropically for processing and visualization
32 Elliptic features and harmonic cut filtering
The first step is to replace the original scaled image stack (eg
isotropic representation of the image) with a smooth version byremoving the structural heterogeneity It is important that
smoothing is performed at object level as opposed to pixellevel (eg anisotropic diffusion) In this context smoothing
aims at detecting and interpolating subcellular structures suchas nucleoli These structures are detected using elliptic features
and interpolation is performed with the harmonic cuts (Yangand Parvin 2003)
Let I Im and Imn be the image intensity with image partialderivatives in m and mn directions respectively In scale-space
theory the elliptic features are defined by IxxIyy I2xy This def-inition is extended to 3D and the elliptic points are then found
using Ixx Iyy4I2xy ^ Ixx Izz4I2xz ^ Iyy Izz4I2yz These ellipticfeatures correspond to bright punctate regions within the nucleus
when the determinant of the Hessian is negative The bright el-liptic features are interpolated with their immediate background
through harmonic cut which minimizes the functional12
RRRE I
2x thorn I2y thorn I2z dxdydz The EulerndashLagrange solution to this
optimization is the Laplace equation r2I frac14 Ixx thorn Iyy thorn Izz frac14 0which defines a harmonic function This step has a single par-
ameter that corresponds to the scale of smoothing and is set at frac14 4 Figure 2b and c shows the original image and the effect of
harmonic cut respectively The solution to the Laplacian isincluded in the Supplementary Section S2
33 Initial segmentation
To increase computational throughput individual nucleus andclumps of nuclei are delineated from the background using an
initial segmentation The staining is highly variable as a result ofthe cell states The problem is further complicated with hetero-
geneous background signal within and outside of the colonyThese complications hinder any type of global thresholding
(eg Otsu) therefore delineation must be within a local neigh-borhood Simultaneously the initial segmentation increases com-
putational throughput as a complex problem is reduced to
smaller subproblems One strategy for detecting of the initial
seeds is through application of the bright elliptic features asoutlined in section 32 These feature detectors (i) respond to
the local spatial topography (ii) are invariant to the signal
strength (eg variable staining) and (iii) have improved noiseimmunity because of Gaussian smoothing kernel An example
of initial seed detection for one slice of image is shown inFigure 2d These initial seeds are subsequently refined through
geodesic level sets where fragmented blobs within a nucleuscan be merged Let I be in the image intensity u be the impli-
cit representation of the evolving surface g be the image gradi-ent then the initial segmentation of the nuclear regions are
estimated by solving the following evolution equationut frac14 gethITHORNjrujthorn rgethITHORN jruj where g frac14 1
1thornjrethITHORNjp and frac14 divrujruj
(Caselles et al 1997) The net result is that fragmented seedswithin a nucleus are merged subject to the gradient constraint
34 Partitioning clumped nuclei
The partitioning approach builds on the observation that when
two adjacent nuclei overlap they form folds and principle curva-ture along the fold is significantly increased (eg curvature
maxima) These points of maximum curvature are used todetect the boundaries between the overlapping nuclei and separ-
ate them Once identified these points are clustered on the basis
of proximity and coplanarity A plane is then fit to each clusterThese planes are used to partition the volume into subdivisions
whereby a local segmentation could be performed more faith-fully Each of these steps is shown in Figure 3 and summarized in
the next sections
341 Curvature computation Curvature can be estimated either
from 3D volumetric data or calculated from segmented surfacesIn the proposed pipeline curvature features are first estimated
from volumetric data for initial partitioning the space Havingsegmented each nucleus we then use surface curvature in section
36 for validation Volumetric curvature is computed from differ-ential geometric properties (eg partial derivative) of a 3D image
stack (Thirion andGourdon 1995) Once the maximum principalcurvature values are localized they are thresholded to identify the
curvature maxima These maxima points correspond to regionsbetween two overlapping adjacent nuclei The details of curvature
computation are included in the Supplementary Section S3
342 Clustering points of maximum curvature and planefitting Computed curvature maxima convey the boundaries
Fig 2 Harmonic cut filtering and seed detection on a 2D slice (a b)
original 3D volume and a slice in the middle of the stack (c) detection
of dark elliptic regions followed by harmonic cuts removes small punctate
internal structures corresponding to nucleoli and (d) results of initial seed
detection from bright elliptic regions Initial seeds labeled in red are frag-
mented within one of the nuclei however these seeds are merged through
the application of geodesic level set to hypothesize an initial segmentation
3089
Integrated Profiling
Dow
nloaded from httpsacadem
icoupcombioinform
aticsarticle29233087248495 by guest on 04 February 2022
between the touching nuclei Points of maximum curvature form
a ring on a specific plane P for two adjacent nuclei Using this
observation we group points of maximum curvature to find a set
of planes for decomposing the colony into individual nuclei
Geometric grouping is performed on the basis of proximity
and coplanarity of the points using Euclidean clustering and
RANdom SAmple Consensus (RANSAC) (Fischler and Bolles
1981) To fit planes to the points of maximum curvature the
iterative RANSAC method is used In this approach a model
is fitted to the points of maximum curvature using the RANSAC
algorithm the inliers are found and removed from the dataset
The remaining dataset is used for fitting more models when pos-
sible The output of this step is a set of plane models that will be
used to partition the clumps of nuclei
343 Binary space partitioning of clumped nuclei RANSACprovides a natural way to cluster points of maximum curvature
based on coplanarity and proximity The clustered points of
curvature maxima define planes that can partition a clump of
nuclei into individual nucleus It should be noted that the parti-
tioning space is exponential in the number of planes ie for n
planes there are Oeth2nTHORN subdivisions Therefore we use an ap-
proach similar to binary space partitioning with auto-partitions
which allows the partition complexity to become Oethn2THORN (De Berg
et al 2008)Denote the volume to be partitioned by V Also denote each
cluster of points of maximum curvature by C and the set of all
clusters by SC Each cluster of points of maximum curvature
defines a plane P with the set of all the planes defined by the
clusters by SP In our partitioning algorithm the volume V is
divided by a plane Pi 2 Sp into two halves with one half falling
to the negative side of the dividing plane ethVTHORN and the other half
falling on the positive side of the plane ethVthornTHORN The plane Pi also
separates the set SC into two SC and SthornC respectively Each
subdivision is further divided with the planes into their respectedsubspace recursively Within each subdivision defined by theintersecting planes computed from points of maximum curva-
ture connected components are performed and the disconnectedobjects are further partitioned using Voronoi partitioning
344 Adaptive Merging Despite a robust set of geometric op-erations previous steps may lead into fragmentation of a nucleusvia binary space partitioning Therefore a policy to validate each
of the hypothesized subdivisions is needed A dissecting plane fora subdivision is considered invalid when the correspondingpoints of maximum curvature for that plane lie on a different
subdivision For example in Figure 3 polytope 2 is invalid asthere are no curvature maxima on the polytope Partitions withinvalid planes are identified and merged back to an adjacent
partition in the opposite side of the plane
35 Refinement of the initial segmentation
As a result of the (i) variations in the background signal withinand outside of the colony (ii) intrinsic artifacts in imaging a 3Dcolony at different Z positions and (iii) heterogeneity in the cell
states refinement of the initial segmentation is needed for a moreaccurate representation In this step the geodesic level setsmethod is applied one more time within the refined space of
the polytope for improved delineation
36 Validation of geometric constraints
The computational pipeline can benefit from additional valid-ation to assure that geometric constraints are satisfied For ex-ample our analysis reveals that the computation of the image
curvature described in section 341 may miss a clump of nucleibecause of the scale of the fold between two adjacent nuclei Thisproblem is more significant in the Z direction because of its lower
resolution and potential accidental alignment of two overlapping
Fig 3 Steps in delineating the nuclear architecture
3090
CCBilgin et al
Dow
nloaded from httpsacadem
icoupcombioinform
aticsarticle29233087248495 by guest on 04 February 2022
nuclei along the Z direction Validation of the geometric con-
straints is based on building surface meshes and computing sur-
face curvatures The same partitioning strategy as in section342 is also used to partition a polytope further
After building a triangular mesh (eg discrete marching
cubes) the discrete Gaussian surface curvature at vertex v is
found by measuring the excess angle at vertex v made by the
incident triangles Specifically Kv frac14 2Pi
i where i rsquos are
the interior angles of all triangles meeting at vertex v On the
other hand the mean curvature for the surface is the sum of the
dihedral angles at e made by the incident triangle normals
weighted by the edge lengths Hv frac14P
e2E letheTHORNe Having calcu-
lated the mean and Gaussian curvatures the principal curvatures
are calculated these values are then thresholded and if enough
data points exist they are used to partition the polytopes as
described previously Details and visual examples are given in
Supplementary Section S4
4 VALIDATION AND COMPARISON
Quantification of the multicellular organization requires success-
ful delineation of each nucleus The proposed computational
pipeline was (i) evaluated with synthetic and manually annotated
images (ii) compared with alternative methods and (iii) applied
to a dataset of MCF10A MCF7 MDA-MB-231 and MDA-
MB-468 cell lines that are fixed in culture at days 2 5 and 7
for quantifying morphogenesis The importance of this experi-
mental design is that genetically diverse cell lines provide a sig-
nificant phenotypic diversity for proof of concept and validation
Comparison is performed against watershed-based techniquessuch as marker-based watershed IV and GFT (Li et al 2007)
based on the availability of the source code
Synthetic Data The efficacy of the proposed method is eval-
uated using synthetically generated datasets The experimental
setup involves 50 randomly generated colonies where nuclei
with ellipsoidal geometry are placed on the surface of a sphere
that represents a colony Each ellipsoidal nucleus is randomly
placed and rotated on the colony sphere Having constructed a
synthetic volume the images are corrupted with four types of
noise models (i) additive Gaussian noise (ii) speckle noise (iii)
shot noise and (iv) salt and pepper noise A peak signal-to-noise
ratio (PSNR) of 9 dB is used for all the experiments PSNR is
given by 10 log10MAX2
I
MSE
where MAXI is the maximum inten-
sity value and MSE is the mean squared error between the noise
and the input signal The parameter setting for the experiments is
as follows for initial segmentation frac14 20 ts frac14 005 for image
curvature detection frac14 3 and for plane fitting p frac14 50 and
T frac14 3 are used In all four cases the nuclei are correctly deli-
neated from each other A sample of each test case is shown in
Figure 4 along with segmentation using proposed method and
classical watershed technique Table 1 summarizes precision and
recall for all of the experiments subject to multiple noise
conditionsReal Data In all 70 image stacks (eg 70 colonies) were
manually annotated from two independent datasets for valid-
ation and comparative analysis Results are represented at
three levels (i) comparison with the watershed-based techniques
(ii) visualization of colony organization for different cell lines
and (iii) precision and recall over annotated dataset The param-
eter setting for processing the real data was identical to the syn-
thetic dataset as in the previous section Variations up to 20
had no impact on the final outcome (i) Figure 5 shows a sample
of segmentation results and comparison with variants of water-
shed-based method (ii) Figure 6 shows a sample of segmented
colony organization for each of the four cell lines (iii) Table 2
shows superior precision and recall against alternative methods
for the annotated dataset Potential failures are (a) accidental
alignment between two adjacent nuclei that form a partial fold
Fig 4 First column illustrates Gaussian speckle shot and salt and
pepper noise models on four randomly generated colonies The segmen-
tation of each colony is provided in the second column and the water-
shed results are given in the third column
Table 1 Object level precision for synthetic data
Algorithm Gaussian Shot Speckle Median
CBP precision 10 10 10 10
CBP recall 10 10 10 10
CBP F-measure 10 10 10 10
IV precision 096 090 099 093
IV recall 097 10 10 084
IV F-measure 097 095 099 088
GFT precision 084 081 075 091
GFT recall 059 049 050 064
GFT F-measure 069 061 060 075
Note Object level precision recall values for the synthetic datasets with different
noise models are given PSNR is set to 9dB
3091
Integrated Profiling
Dow
nloaded from httpsacadem
icoupcombioinform
aticsarticle29233087248495 by guest on 04 February 2022
with insufficient information for partitioning them (shown in
Supplementary Section S5) and (b) sequential RANSAC infer-
ring incorrect partitioning because of its greedy nature however
multi-RANSAC (Isack and Boykov 2012) should reduce the
frequency of incorrect plane fitting On average each stack is
about 512 512 80 pixels and the processing time is 2min
stack with an 800 Mb of memory usage
5 MORPHOGENESIS COMPARISON
Comparison needs to be performed in context For example it is
well known that MCF10A and MCF7 have a well-contained
symmetrical organization whereas MDA-MB-231 and MDA-
MB-468 have more invasive growth properties Therefore mor-
phogenesis analysis is performed by comparing (i) MCF10A
against MCF7 and (ii) all four lines simultaneously In both
cases colony organization is multiparametrically profiled with
the Delaunay triangulationIn the first case the MCF10A line is a non-transformed line
whereas the MCF7 line is tumorigenic one Non-transformed
lines should form a hollow sphere by day 10 ie cells inside the
colony should go through apoptosis Thus a potential index for
lumen formation is the distribution of distances of nuclei to the
center of the convex hull (CH) in a colony Depending on the type
of cell lines during the colony growth the distance of some of the
nuclei to the center of the CH is increased whereas others may
remain unchanged There are a number of ways to visualize cel-
lular organization for quality control as seen in Figure 7a which
shows a distribution of distance of nuclei to the center of the CH
for MCF10A Our investigation indicates that a preferred index
for lumen formation lumenosity is the volume of the CH that
excludes nuclear information where the CH is generated from the
centroids of nuclei in a colony Computation of CH is supported
by the VTK library The evolutions of the lumenosity indices for
MCF10A andMCF7 are shown in Figure 7b which is consistent
with the published literature asMCF7 does not form a lumen (eg
a hollow sphere) (Kenny et al 2007)In the second case colony organization is quantified across
the four cell lines as shown in Figure 7c and d In contrast to
MCF10A and MCF7 the other two lines have an invasive mor-
phogenesis Among computed colony indices lsquoColony
Elongationrsquo and lsquoMean Edge Lengthrsquo were identified to be dis-
criminative between the four cell lines Colony Elongation is
Fig 6 Two examples of MCF10A (ab) MCF7 (cd) MDA-MB-468
(ef) and MDA-MB-231 (gh) cell lines on day 7
Fig 5 Comparison with watershed-based methods on a stack of
MCF10A cell line (a) An example input is given The results of
watershed marker based watershed and the proposed curvature-based
partitioning (CBP) is provided in (b) (c) and (d) respectively
Table 2 Pixel and object level precision recall values for the annotated
dataset
Measurement Type Watershed Marker-based
watershed
GFT IV CBP
BF precision 095 084 095 097 086
BF recall 044 052 082 079 084
BF F-measure 060 058 088 087 085
Object precision 075 088 088 087 097
Object recall 067 072 087 086 095
Object F-measure 071 080 088 087 096
Note BF stands for BackgroundForeground
3092
CCBilgin et al
Dow
nloaded from httpsacadem
icoupcombioinform
aticsarticle29233087248495 by guest on 04 February 2022
calculated as the ratio of 1=2 where 1 2 3 are thelengths of principal moments of the colony For MCF10A and
MCF7 lines the elongation of the colony is significantly lowercompared with the 231 and 468 cell lines at day 7 There is also a2-fold difference between the 231 and 468 cell lines andMCF10A which indicates invasiveness of these cell lines The
mean edge length of these colonies is used as an index to measurethe dispersion of the nuclei in the colony space Both 231 and 468lines are showing increased mean edge lengths in our experiments
as a result of increased proliferation (Fig 7(d))
6 CONCLUSION
With the increasing demand for high content screening of 3D cell
culture models the CBP method is a highly effective approachfor segmentation and subsequent profiling Evaluation and test-ing of CBP have been tightly coupled with the experimental
design that consists of four cell lines with a significant geneticdiversity and distinct phenotypic signatures Comparison of CBPwith the alternative methods demonstrates superior performance
in terms of the error rates Furthermore multiparametric repre-sentation for the colony organization has identified indices thatcapture aberrant and normal morphogenesis in these four celllines The software has been developed in ITKVTK framework
for improved portability and memory use
ACKNOWLEDGEMENTS
We would like to thank Michelle Scott for her invaluable assis-
tance in microscopy and the Bissell lab for biological reagents
Funding National Institute of Health [grant R01 CA140663] andcarried out at Lawrence Berkeley National Laboratory underContract No DE-AC02-05CH11231
Conflicts of Interest none declared
REFERENCES
AltschulerS and WuL (2010) Cellular heterogenetity do differences make a dif-
ference Cell 141 559ndash563
CasellesV et al (1997) Geodesic active contours Int J Comput Vis 22 61ndash79
ChawlaM et al (2004) 3D-catFISH J Neurosci Methods 139 13ndash24
CoelhoL et al (2009) Nuclear segmentation in microscope cell images In ISBI
IEEE pp 518ndash521
De BergM et al (2008) Computational geometry algorithms and applications
Springer-Verlag New York Inc
FischlerM and BollesR (1981) Random sample consensus a paradigm for model
fitting with applications to image analysis and automated cartography
Commun ACM 24 381ndash395
FournierM et al (2009) Interaction of E-cadherin and PTEN regulates morpho-
genesis and growth and growth arrest in human mammary epithelial cells
Cancer Res 69 4545ndash4552
HanJ et al (2010) Molecular predictors of 3Dmorphogenesis by breast cancer cells
in 3D culture PLoS Comput Biol 6 e1000684
HanJ et al (2011) Multiscale iterative voting for differential analysis of stress
response for 2D and 3D cell culture models J Microsc 87 696ndash710
IsackH and BoykovY (2012) Energy-based geometric multi-model fitting Int J
Comput Vision 97 123ndash147
KennyP et al (2007) The morphologies of breast cancer cell lines in three-dimen-
sional assays correlate with their profiles of gene expression Mol Oncol 1
84ndash96
LeeG et al (2007) Three-dimensional culture models of normal and malignant
breast epithelial cells Nat Methods 4 359ndash365
LiG et al (2007) 3D cell nuclei segmentation based on gradient flow tracking
BMC Cell Biol 8 1ndash10
LiuH et al (2004) Polarity and proliferation are controlled by distinct signaling
pathways downstream of PI3-kinase in breast epithelial tumor cells J Cell Biol
164 603ndash612
PadfieldD et al (2009) Spatio-temporal cell cycle phase analysis using level sets and
fast marching methods Med Image Anal 13 143ndash155
PampaloniF et al (2007) The third dimension bridges the gap between the cell
culture and live tissue Nat Rev Mol Cell Biol 8 839ndash845
ParkC et al (2000) The influence of the micro-environment on the malignant
phenotype Mol Med Today 6 324ndash329
PetersonO et al (1992) Interaction with basement membrane serves to rapidly
distinguish growth and differentiation pattern of normal and malignant
human breast epithelial cells PNAS 89 9064ndash8
QuL et al (2011) Simultaneous recognition and segmentation of cells application
in C Elegans Bioinformatics 27 2895ndash2902
ThirionJ and GourdonA (1995) Computing the differential characteristics of
isointensity surfaces Comput Vis Image Underst 61 190ndash202
WallinE and HeijmeG (1998) Genome-wide analysis of integral membrane pro-
teins from eubacterial archaean and eukaryotic organisms Protein Sci 7
1029ndash1038
WenQ et al (2009) A Delaunay triangulation approach for segmenting clumps of
nuclei In ISBI IEEE pp 9ndash12
YangQ and ParvinB (2003) Harmonic cut and regularized centroid transform for
localization of subcellular structures IEEE Trans Biomed Eng 50 469ndash476
Fig 7 (a) A computed morphogenesis index corresponding to the distance of each nucleus to the center of the CH of the MCF10A colony (b) another
computed index indicating an index that represents percentages of nuclei being at a specific distance to the center of the colony for MCF7 and MCF10A
It is clear that MCF10A forms a lumen but MCF7 does not (c d) MDA-MB-468 and MDA-MB-231 have non-symmetrical growth properties
3093
Integrated Profiling
Dow
nloaded from httpsacadem
icoupcombioinform
aticsarticle29233087248495 by guest on 04 February 2022
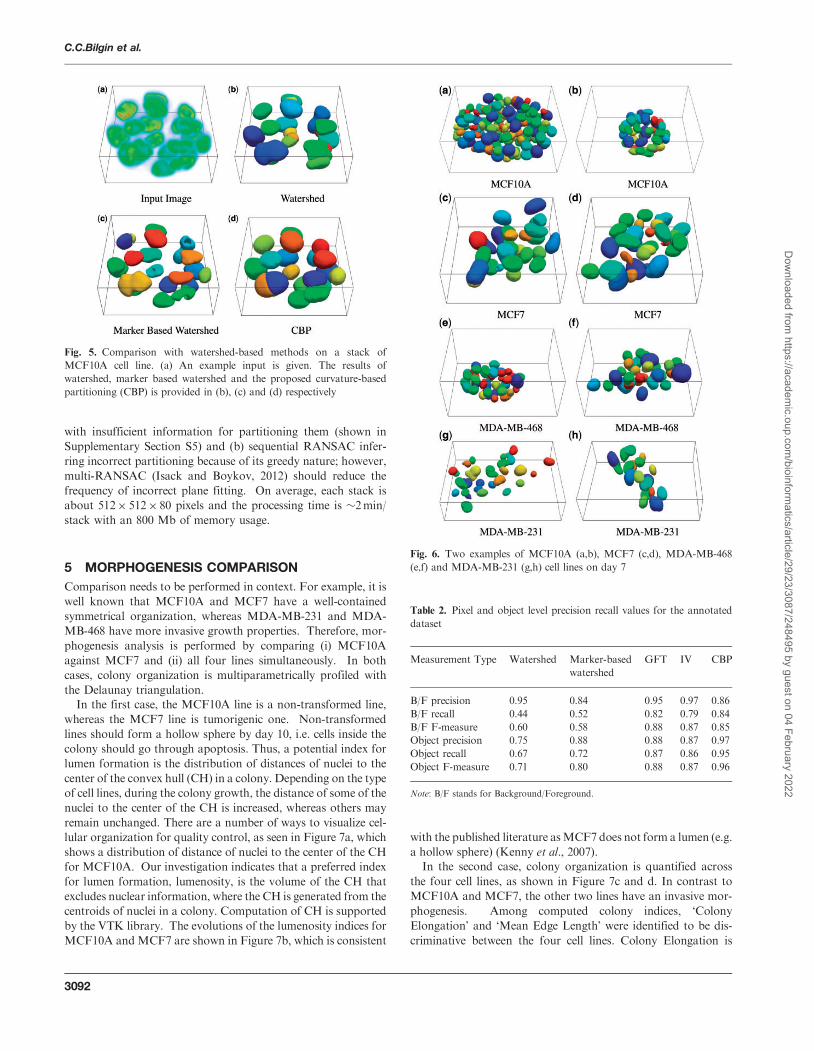