Water Pollution. Point Source Pollution vs. Nonpoint Source Pollution What’s the difference?

Oct
ob
er
27
, 20
15 INTEGRATED PLANNING: USING INNOVATIVE
TECHNOLOGIES TO IDENTIFY AND MITIGATE PRIORITY SOURCES OF POLLUTIONNEWEA CSO/WET WEATHER ISSUES SPECIALTY CONFERENCE
Leah Gaffney, Regional Planning Project LeadDr. Ting Lu, Ph.D., Integrated Planning Lead

INTRODUCTION
NEWEA | CSO/Wet Weather Issues Specialty Conference | October 27, 2015
2
MS4
CSO
WWTPSSO
TMDLMunicipalities and utilities charged with meeting Clean Water Act requirements
Multiple sources contribute to surface water quality degradation
Generalized watershed-wide reduction of wet weather discharges may not address priority sources
It is critical to identify the priority sources of pollutants prior to developing mitigation
Integrated Water Quality Studies form the foundation of a holistic wet weather management plan

WATER QUALITY STRESSORS ARE WATERSHED BASED AND NOT JUST A WET WEATHER PROBLEM
3
Sedimentation/
low flow
Nutrients
ChloridesHabitat alterations
PAH compounds
Dissolved Oxygen
Organic Enrichment
Metals
Siltation Others
??
?
?
Potential Sources
Bio
logi
cal
Re
spo
nse
s
October 27, 2015NEWEA | CSO/Wet Weather Issues Specialty Conference |

INTEGRATED STUDIES WILL HELP ANSWER THE FOLLOWING QUESTIONS
• Is Wet Weather the only source of water pollution?
• What are the other pollution contributions?
• What is impact of water quantity vs. water quality?
• How do we prioritize mitigation projects?
• How do we measure project /program effectiveness?
• How do we assess human health risk when exposed to the impairment of water body?
October 27, 2015
4
NEWEA | CSO/Wet Weather Issues Specialty Conference |
INNOVATIVE TOOLS AND TECHNOLOGIES TO UNDERSTAND SOURCES AND REDUCE IMPLEMENTATION COSTS• Microbial source tracking
• Remote sensing
• Water Quality Modeling
5

MICROBIAL SOURCE TRACKING:
LINKING THE POLLUTANTS WITH THE SOURCE
NEWEA | CSO/Wet Weather Issues Specialty Conference | October 27, 2015
6
Identifies the source of target bacterial pollutants, not just the concentration
• Identify non-wet weather related , non-human sources
Enhances prioritization of improvement projects
• Target priority sources of contamination
Helps focus investments and saves money
• Reduce less effective projects
Facilitates communication and regulatory buy-in
• Data and justification for your approach
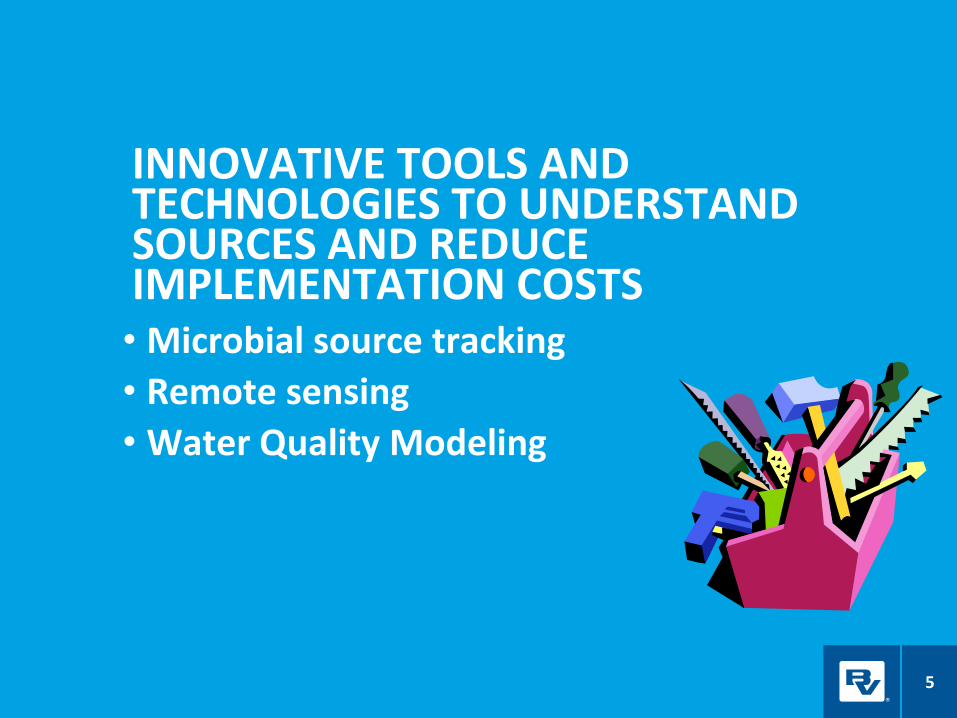
• Remote detection of non-microbial contaminants
• Identifies sources and hotspots on watershed scale
• Documents water quality trends
• Helps guide field investigations
• Focus and target solutions
REMOTE SENSING: COST-EFFECTIVE IDENTIFICATION OF WATERSHED POLLUTION
October 27, 2015NEWEA | CSO/Wet Weather Issues Specialty Conference |
7
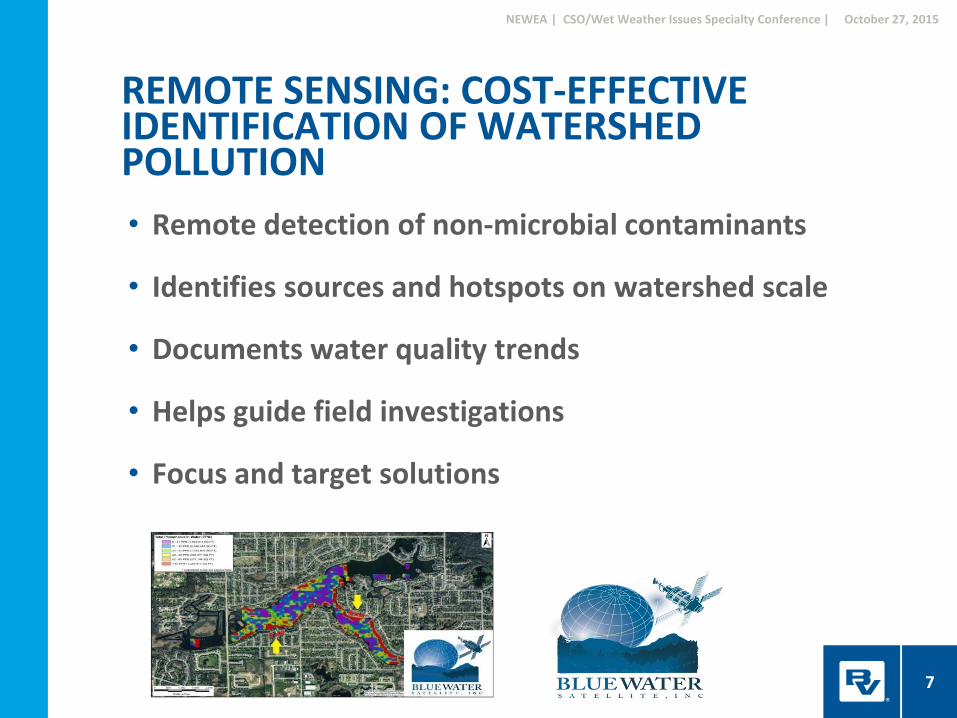
INTEGRATED WATER QUALITY MODELS:HELP PRIORITIZE WET WEATHER PROJECTS
8
NEWEA | CSO/Wet Weather Issues Specialty Conference | October 27, 2015

October 27, 2015NEWEA | CSO/Wet Weather Issues Specialty Conference |
9
CINCINNATI INTEGRATED PLANNING EXAMPLE

WQ non attainment
WET WEATHER DISCHARGES ARE NOT THE ONLY SOURCE OF IMPAIRMENT
DO CSOs/SSOs DRIVE WATER QUALITY?HOW DO PROJECTS GET PRIORITIZED?
NEWEA | CSO/Wet Weather Issues Specialty Conference | October 27, 2015
10
SedimentationNutrient, DO
Sedimentationchloride
Sedimentation
Habitat alteration Sedimentation, nutrient, chloride

CINCINNATI INTEGRATED PLANNING ROADMAP
• Summarize and review existing information
2014
• Develop sampling and modeling plans
2014
• Perform water quality sampling
2014 - 2015
• Develop water quality models
2015
• Calibrate and verify models
2015-2016
• Scenario planning and simulations
2016
NEWEA | CSO/Wet Weather Issues Specialty Conference | October 27, 2015

LINKING THE POLLUTANTS TO THE SOURCES
Pollution origin Pollution detection and causes/reasons
Human Yes, CSO, SSO, and septic tanks
Bovine No, no cattle in the watershed
Canine Yes, pet facility nearby or parks
Avian Yes, wild waterfowl
GIS Mapping
Source Identification
Source Quantification
October 27, 2015
12
NEWEA | CSO/Wet Weather Issues Specialty Conference |
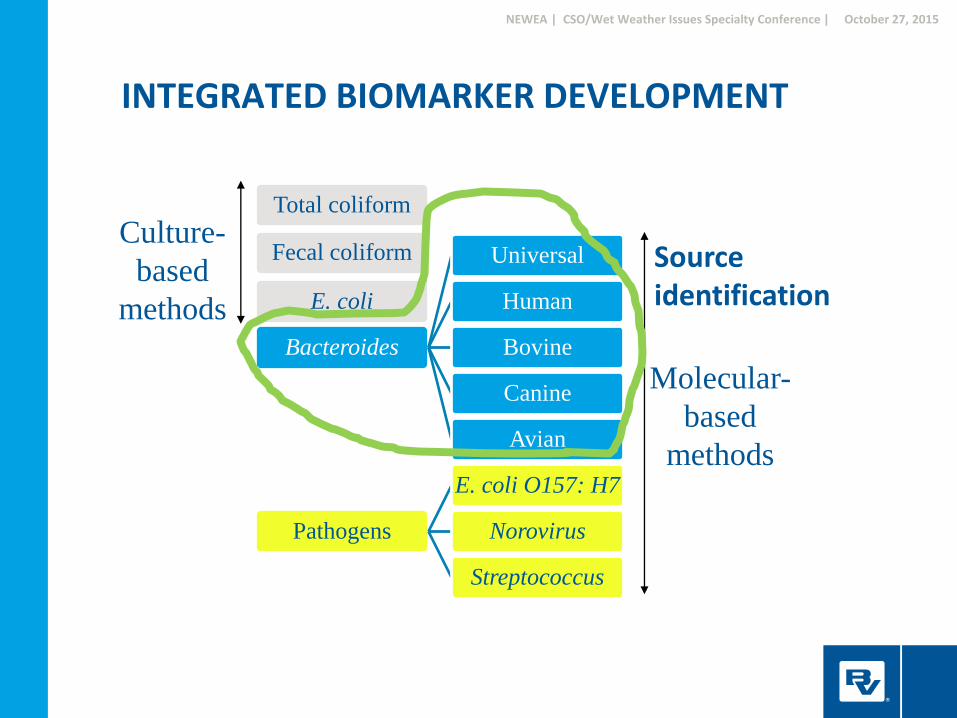
Total coliform
Fecal coliform
E. coli
Bacteroides
Universal
Human
Bovine
Canine
Avian
Pathogens
E. coli O157: H7
Norovirus
Streptococcus
Culture-
based
methods
Molecular-
based
methods
INTEGRATED BIOMARKER DEVELOPMENT
Source identification
NEWEA | CSO/Wet Weather Issues Specialty Conference | October 27, 2015

MICROBIAL SOURCE TRACKING FINDINGS
•Human fecal pollution is the dominant pollution source in the watershed• Identify and address key CSO/SSO areas for
water quality improvement• In addition to sewer overflows, septic tanks
contribute significantly to this problem•Work with other agencies to more effectively
address these pollution problems• Fecal pollution loadings were lower where green
vegetation is present•This tool can be used for green infrastructure
effectiveness measurement
NEWEA | CSO/Wet Weather Issues Specialty Conference | October 27, 2015

REMOTE SENSING: SEEING IS BELIEVING
How: using satellite images, through patented algorism
Outcome:
1.view constitutes concentrations over large geographic areas at ppb level.
2.use in model development or to target field studies for more detailed information
NEWEA | CSO/Wet Weather Issues Specialty Conference | October 27, 2015

7/2/2012 Natural Color
REMOTE SENSING : OHIO RIVER TOTAL PHOSPHORUS IN WATER
OHIO RIVER TPW 2012NORMAL FLOW: LOW TPW
OHIO RIVER TPW 2013HIGH FLOW: HIGH TPW
October 27, 2015NEWEA | CSO/Wet Weather Issues Specialty Conference |
16

OHIO RIVER TPW 2013HIGH FLOW: HIGH TPW
October 27, 2015NEWEA | CSO/Wet Weather Issues Specialty Conference |
17High level clusters of TP downstream of
tributary confluences.
REMOTE SENSING : OHIO RIVER TOTAL PHOSPHORUS IN WATER
OHIO RIVER TPW 2012NORMAL FLOW: LOW TPW

• Gain understanding of what’s really happening across the entire watershed
• Low flow (normal conditions) shows low total phosphorus
• High level clusters of total phosphorus are visible
• High total phosphorus after a major rain event
•Reduced sampling and monitoring costs
•Targeting mitigation investment
REMOTE SENSING OUTCOME
October 27, 2015
18
NEWEA | CSO/Wet Weather Issues Specialty Conference |

HOW DO YOU BRING IT ALL TOGETHER & JUSTIFY WATER QUALITY BENEFITS FROM PROJECTS?
19
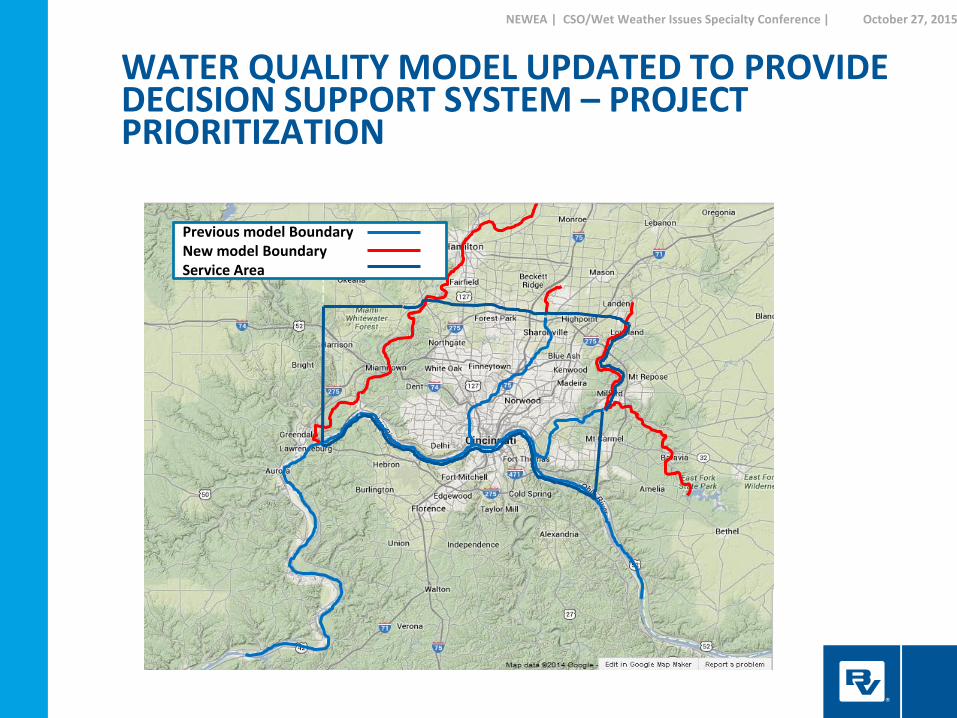
Previous model BoundaryNew model BoundaryService Area
WATER QUALITY MODEL UPDATED TO PROVIDE DECISION SUPPORT SYSTEM – PROJECT PRIORITIZATION
NEWEA | CSO/Wet Weather Issues Specialty Conference | October 27, 2015

ROBUST MONITORING IS KEY TO A SUCCESSFUL INTEGRATED WATER QUALITY BASED STUDY
THREE PRIMARY ELEMENTS
• Routine Sampling: modify existing MSDGC sampling programs. Primarily base flow conditions
• Storm Event Sampling: quantify loads from upstream sources, tributaries, CSOs/SSOs. Measure water quality changes that occur in Mill Creek
• Special Studies: bacterial source tracking, Quantitative Microbial Risk Assessment, remote sensing, continuous in-situ measurements
21
ParametersAmmonia,Nitrate +Nitrite,Total Kjeldahl Nitrogen,Total KjeldahlPhosphorus Total Phosphorus *Carbonaceous Biochemical Oxygen Demand,Total Suspended Solids,Total Dissolved SolidsTotal Organic Carbon
E. coli
Conductivity, Dissolved Oxygen,pH, Temperature
NEWEA | CSO/Wet Weather Issues Specialty Conference | October 27, 2015

STATION LOCATIONS –PRIORITIZING WET WEATHER SAMPLING TO DETERMINE CSO IMPACTS
•Primary – target 5 Mill Creek and 1 tributary stations
• Secondary – target 9 Mill Creek stations
•CSO/SSO – target 5 stations, locations to be determined
• Existing USGS gaging stations
22
NEWEA | CSO/Wet Weather Issues Specialty Conference | October 27, 2015

CUSTOMIZED Receiving Stream
Model
Process model
SWMMWatershed
model
River Hydrographs River Pollutographs
WATER QUALITY MODELING:
BRINGS IT ALL TOGETHER
Sewered area Non-sewered areaWWTP
AFWTF (Liquid)
FCWTF (Liquid)
Shared (Solids)
Dynamic model of all facilities
1. Green solution locator2. H&H
NEWEA | CSO/Wet Weather Issues Specialty Conference | October 27, 2015

INTEGRATED WATER QUALITY PLANNING PROMOTES COORDINATED REGIONAL DECISION MAKING
Water quantity based
Water quality
24
• Provide decision support for implementation projects
• Measure project effectiveness
• Integrated Solutions
• Presumptive approach
Overflow frequencyOverflow volume
• Reactive • Point source solution
• Holistic watershed approach
Water quality based
October 27, 2015NEWEA | CSO/Wet Weather Issues Specialty Conference |

www.bv.com