INTEGRATED PERFORMANCE REPORT - NB . T
73
North Bristol NHS Trust INTEGRATED PERFORMANCE REPORT March 2019 (presenting February 2019 data)
Transcript of INTEGRATED PERFORMANCE REPORT - NB . T
North Bristol NHS Trust
INTEGRATED PERFORMANCE REPORT March 2019 (presenting February 2019 data)

2
CONTENTS
CQC Domain / Report Section Sponsor / s
Page
Number
Chief Operating Officer
Medical Director
Interim Director of Nursing
Director of People and Transformation
Director of Finance
Responsiveness Chief Operating Officer 13
Medical Director
Interim Director of Nursing
Quality Experience Interim Director of Nursing 43
Research and Innovation Medical Director 49
Facilities Director of Facilities 50
Director of People and Transformation
Medical Director
Interim Director of Nursing
Finance Director of Finance 65
Regulatory View Chief Executive 70
Performance Dashboard and Summaries
Safety and Effectiveness
5
30
52Well Led

3
Target lines
Improvement trajectories
Performance improved
Performance maintained
Performance worsened
Upper Quartile
Lower Quartile
5
4
6
REPORT KEY
Unless noted on each graph, all data shown is for period up to,
and including, 31 October 2018.
All data included is correct at the time of publication.
Please note that subsequent validation by clinical teams can alter
scores retrospectively.
Abbreviation Glossary
ASCR Anaesthetics, Surgery, Critical Care and Renal
CCS Core Clinical Services
CEO Chief Executive
Clin Gov
GRR
Clinical Governance
Governance Risk Rating
HoN Head of Nursing
IMandT Information Management
Med Medicine
NMSK Neurosciences and Musculoskeletal
Non-Cons Non-Consultant
Ops Operations
RAP Remedial Action Plan
RCA Root Cause Analysis
WCH Women and Children's Health
MDT Multi-disciplinary Team
PTL Patient Tracking List
NBT Quality Priorities 2018/19
QP1 Eliminate delays in hospital to improve patient safety
and reduce bed occupancy (‘home is best’)
QP2 Enhance the way patient involvement and feedback
is used to influence care and service development
QP3 Continue improving the quality of end of life care
across all specialities
QP4 Strengthen learning and action by embedding quality
governance at specialty, cluster and Divisional level
QP5
Demonstrate a stronger clinical understanding and
application of the Mental Capacity Act and
Deprivation of Liberty Standards
5
4
6

4 EXECUTIVE SUMMARY
February 2019 ACCESS
February reports a deterioration in the 4 hour urgent care standard at 70.74%, underachieving against the Trust trajectory of 80.03%. Staffing gaps are being
addressed. Attendances remained above average throughout the month, exceeding 300 on one occasion. Despite difficult periods, recovery has been prompt
with performance achieving the 95% standard on one occasions. There is however, an improvement from February 2018 where performance was reported at
67.46%
The Trust has marginally underachieved against the agreed recovery trajectory for Referral To Treatment (RTT) incomplete performance for February
(86.95% vs trajectory of 87.37%). The Trust has not achieved the trajectory for the number of patients waiting greater than 52 weeks from Referral to Treatment
(RTT) in December (44 vs trajectory of 5) and has a plan to eliminate 52 ww by end of September 2019.
In February, there was an improvement in diagnostic waiting times, largely for Endoscopy. Ongoing demand and capacity issues in Urodynamics continue to
negatively impact performance. This has resulted in the Trust not meeting the national standard (1.00%) for diagnostic performance with actual
performance of 2.32%, an improvement from 3.88% from last month.
The Trust has delivered one of the seven national cancer targets in January – The 31 Day Subsequent Drug Treatment standard continues to achieve at
100%. The Trust’s Two Week Wait stands at 75.74% in January (standard 93%), Two Week Wait for Breast Symptoms has improved from December and
reports a position of 48.16% (standard 93%), 31 Day First Treatment at 92.28% (standard 96%), 31 Day subsequent Surgery 75.63% (standard 94%) and the 62
Day Treatment standard reports a deterioration at 82.17% (standard 85%). 62 Day Screening standard reports a marginal underperformance of 89.04%
(standard 90%). Cancer performance is impacted by capacity shortfalls, which are remediated in the 2019/20 plan.
SAFETY
Reduction in pressure ulcer incidence is a focus of safety improvement work. In February there were 29 Grade 2 pressure injuries reported and no Grade 3 or
Grade 4 pressure injuries reported. The Trust continues to meet the 20% reduction trajectory for Grade 2 pressure ulcers. There were two serious incidents
reported and one Never Event declared in February, occurring in January. A Thematic Review is being conducted across all Never Events that have happened
from April 2018.
PATIENT EXPERIENCE
The number of overdue complaints remained static at 29 in February, above the Trust’s target of 10. A pilot Patient Advice and Liaison Service (PALS)
commenced on the 13 February 2019 to improve responsiveness to patient concerns. Friends and Family recommend scores remain steady across all areas.
NHS Choices ratings for both Southmead and Cossham Hospitals is 4.5 stars (max 5).
WORKFORCE
The stability (% of staff in post longer than 12 months) of the Trust workforce has improved and is 2% higher than at this time last year (equating to 36 wte
more staff in post with more than one years service). The number of staff leaving the Trust for voluntary reasons has improved overall in 18/19, with 84 wte
lower leaving than the same period. Reduction of proportion of sickness attributed to ‘Stress / Anxiety / Depression / Other psychiatric illnesses’: wte
days lost in the period April – January in 2018/19 was 399 wte days lower than the same period in 2017/18.
FINANCE
The Trust has a planned a deficit of £18.4m for the year in line with the agreed control total with NHS Improvement. At the end of February, the Trust is reporting
a deficit of £19.9m, which is £2.5m adverse to plan. The Trust has a savings target of £34.7m, of which, £27.2m has been forecast at the end February. The
Trust financial risk rating on the NHSI scale is 3 out of 4.

National Rank** Quartile
QP1 95% 79.32% 100/134 77.89% 70.47% 80.03% 6QP1 0 0 21 5
92% *86.73% 109/177 87.61% 86.95% 87.37% 62184 3279 3563 3523 5
0 1 1 40 21 20 67 8 7 60 8 16 5
1% *3.59% 145/203 3.89% 2.32% 60.8% 1.30% 1.45% 5
0 2 3 5QP1 95% 97.11% 98.02% 5
353 346 6QP1 3.50% 4.36% 4.04% 6
93% 91.66% 142/144 80.82% 75.74% 693% 82.83% 105/113 26.00% 48.16% 596% 95.37% 97/122 93.90% 92.28% 694% 90.67% 64/69 87.88% 75.63% 698% 98.79% 1/39 100% 100% 485% 76.24% 54/140 87.04% 82.17% 86.56% 690% 84.65% 30/89 89.13% 89.04% 6
52WW
Diagnostic DM01 - % waiting more than 6 weeks
Other
Patients seen within 2 weeks of urgent GP referral
Patients treated within 62 days of screening
Patients receiving first treatment within 62 days of urgent GP referral
Res
po
nsi
ven
ess
- C
ance
r
(In
arr
ears
)
Patients waiting less than 31 days for subsequent drug treatment
Patients waiting less than 31 days for subsequent surgery
Patients receiving first treatment within 31 days of cancer diagnosis
Patients with breast symptoms seen by specialist within 2 weeks
Ortho-Spinal
MSK
Neurosurgery and Epilepsy
Trust Wide Referral to Treatment Backlog (to achieve 92%)
Stranded Patients (LoS >7 days : Snapshot as at month end)
28 day re-booking breach
Same day - non-clinical reasons
February-19
Key Operational Standards Dashboard
ED 4 Hour Performance
12 Hour Trolley Waits
Referral to Treatment - % incomplete pathways <18 weeks
Cancelled
Operations
Bed Occupancy
Delayed Transfers of Care (DToC)
Previous
month's
performance
IPR
sectionTarget
Performance
direction of
travel from last
month
Performance
against NBT
Trajectory
Performance
against Target
Access StandardR
es
po
ns
ive
ne
ss
5
Description
Benchmarking (*month in arrears)

National Rank** Quartile
0 3 0 698.13% 97.93% 6
95% 97.30% 97.70% 595% 98.00% 95.00% 6164
2018/1921 29 5
02018/19
0 0 40
2018/190 0 4
0 1 1 458
2018/196 6 4
422018/19
1 2 519
2018/195 3 6
95% 95.38% 95.23% 6
Previous
month's
performance
IPR
sectionTarget
Performance
direction of
travel from last
month
Performance
against NBT
Trajectory
Performance
against Target
Access Standard
Description
Benchmarking (*month in arrears)
E. Coli
MRSA
C. Difficile
Venous Thromboembolism Screening (In arrears)
Safety Thermometer - Hospital Compliance
Never Event Occurrence by Month
Qu
alit
y P
atie
nt
Safe
ty a
nd
Eff
ecti
ven
ess
Pressure Injuries
Grade 4
Hand Hygiene Compliance
February-19
Key Operational Standards Dashboard
MSSA
Grade 3
Grade 2
WHO Checklist Compliance

National Rank** Quartile
Emergency Department QP2 *11.91% *22/137 20.93% 21.49% 15.00% 5Inpatient QP2 *23.96% *125/165 18.59% 19.16% 30.00% 5Outpatient QP2 18.71% 14.63% 6.00% 6Maternity (Birth) QP2 *21.85% *63/126 21.43% 18.32% 15.00% 6Emergency Department QP2 *86.03% *68/131 89.55% 88.77% 6Inpatient QP2 *95.61% *129/159 93.62% 92.19% 6Outpatient QP2 *94.05% *97/195 95.80% 95.30% 6Maternity (Birth) QP2 *96.90% *20/76 94.95% 97.59% 5% Overall Response Compliance QP2 49.00% 53.00% 5Complaints acknowledged in <3 days QP2 95% 100% 100% 4Overdue QP2 <10 29 41 5
£299 £1,009 £1,296 55.20% 10.45% 10.42% 61.00% 1.28% 1.12% 64.15% 4.44% 4.93% 5
87.00% 87.68% 88.06% 590%
Nov. 201894.54% 92.68% 6
£18.4m2018/19
£18.5 £19.9 £17.4
3 3 4
Complaints
Previous
month's
performance
IPR
sectionTarget
Performance
direction of
travel from last
month
Performance
against NBT
Trajectory
Performance
against Target
Access Standard
Description
Benchmarking (*month in arrears)
Fin
ance
NHSI Trust Rating
Deficit (£m)
Non - Medical Annual Appraisal Compliance
Trust Mandatory Training Compliance
In Month Sickness Absence (In arrears)
In Month Turnover
Month End Vacancy Factor
Agency Expenditure ('000s)
Qu
alit
y Ex
per
ien
ceW
ell L
ed
FFT - Response
Rates
February-19
Key Operational Standards Dashboard
FFT - % Would
recommend

8 RESPONSIVENESS
SRO: Chief Operating Officer
Overview Urgent Care
February reports a deterioration of the 4 hour urgent care standard at 70.74%, not achieving the Trust trajectory of 80.03%. The decline in performance was
attributable to a combination of staffing challenges, increased demand/acuity and poor flow. The Trust worked actively with partners to ease pressure on the
emergency department, supporting the prompt recovery of waiting times. Attendances remained largely above average throughout the month.
Planned Care
Referral to Treatment (RTT) - In month, the Trust underachieved against the RTT trajectory of 87.37%, with actual performance at 86.95%. The number of
patients exceeding 52 week waits continues above trajectory with February reporting 44; the majority of breaches owing to capacity issues.
The Trust is working towards delivery against a remedial action plan, specifically focusing on the challenged sub-specialties within MSK, Ortho-spinal and in
Plastic Surgery. The Trust is currently reviewing the trajectory for 52 week waits, whilst working to resolve an interoperability issue between the Electronic
Referral System and Lorenzo which is having an adverse impact on the reported incomplete waiting list and is currently reporting 7% less than the actual total
waiting list size.
Cancelled Operations - In month, there were three breaches of the 28 day re-booking target. Root cause analyses has been completed for all patients
breaching the 28 day rebooking standard.
Diagnostic Waiting Times - The Trust has not achieved the national target for diagnostic waiting times with performance of 2.32% in February although is an
improvement from January at 3.88%. Endoscopy continues to breach the standard but has reported a 67% reduction in the number of patients waiting over 6
weeks. The Trust continues to monitor Endoscopy pathways through Remedial Action Plans. Urodynamics has reported a further decline in performance, the
Trust is undertaking a demand and capacity review of the service.
Cancer
Cancer performance remains challenged in January, achieving one of the seven standards. Of the six standards not achieved, the Trust’s Two Week Wait has
reported 75.74% and the breast non-symptomatic Two Week wait reported 48.16% in January against the National standard of 93%. The majority of breaches
relate to breast (349). The breast service have reported significant performance pressures through January against this standard due to capacity issues within
the service. Patients receiving first treatment within 31 days of diagnosis has not achieved the standard and reports a performance of 92.28% against 96%.
Patients waiting less than 31 days for subsequent surgery continues to underperform with a performance of 75.63% against a target of 94%. Patients treated
within 62 days of screening has marginally underachieved against a target of 90% with actual performance reported at 89.04%. The Trust has not achieved
the 62 day standard, with a performance of 82.17% against a trajectory of 86.56%. The Trust continues to meet the national standard of 98% for 31 days
subsequent drug treatment.
Areas of Concern
The system continues to monitor the effectiveness of all actions being undertaken, with daily and weekly reviews. The main risks identified to the delivery of
the Urgent Care Improvement Plan (UCIP) are as follows:
• UCIP Risk: Lack of community capacity and/or pathway delays fail to meet bed savings plans as per the bed model.
• UCIP Risk: Length of Stay reductions and bed occupancy targets in the bed model are not met leading to performance issues.
9 QUALITY PATIENT SAFETY AND EFFECTIVENESS
SRO: Medical Director and Interim Director of Nursing
Overview
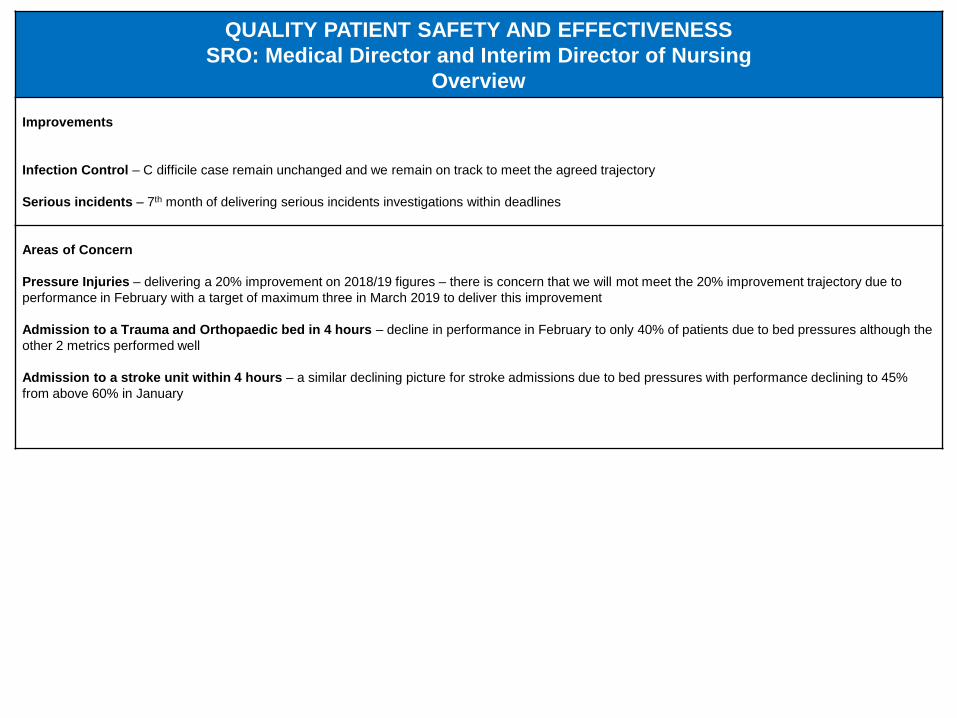
Improvements
Infection Control – C difficile case remain unchanged and we remain on track to meet the agreed trajectory
Serious incidents – 7th month of delivering serious incidents investigations within deadlines
Areas of Concern
Pressure Injuries – delivering a 20% improvement on 2018/19 figures – there is concern that we will mot meet the 20% improvement trajectory due to
performance in February with a target of maximum three in March 2019 to deliver this improvement
Admission to a Trauma and Orthopaedic bed in 4 hours – decline in performance in February to only 40% of patients due to bed pressures although the
other 2 metrics performed well
Admission to a stroke unit within 4 hours – a similar declining picture for stroke admissions due to bed pressures with performance declining to 45%
from above 60% in January

10 QUALITY EXPERIENCE
SRO: Interim Director of Nursing
Overview
Improvements
Complaint and Concerns: The number of complaints received decreased by 2 in February to 48 which is the lowest number since March 2018
A pilot PALS service commenced on 11 February with an initial positive impact
57 PALS concerns received: 52 were raised externally, 3 were raised by inpatients, 2 were raised by NBT employees
Method of contact: 33 received by phone, 20 by email, 4 face to face
Response times: 86% of concerns have been successfully resolved same day .7 % of concerns have been successfully resolved within 1 working day, 7% of
concerns have required <1 working day to resolve
0% of concerns have escalated to formal complaint
Friends and Family Test : The response rate for ED and inpatients have had an overall increase again this month. Maternity ( Birth) have a significant
increase the number of mothers recommending the service
Areas of concern
Complaints and concerns: The number of overdue complaints responses rose again to 41 ( 29 total in January).
Responding to complaints within the agreed time scale is still below the target of 85% . Of the cases closed in February 2019, 82 (53%) were not completed
in the agree time scale .
Recovery plans are being developed with Heads of Nursing and bi weekly dashboards which will include would include risk colours of green, amber, red –
i.e. red (overdue), amber (approaching breach) and green (new/just received). The aim of the recovery meetings would be to reduce the red zone completely
and then we would concentrate our efforts on the amber zone to ensure nothing tips over the central Patient Experience team will help support this .
Friends and Family Test: In patient % recommend has deceased again this month . In those areas that score less that 90 % recommend in February a
‘deep dive’ is undertaken All the negative comments via the FFT were identified relating to the aspects of the patients care that contributed to their decision
to not recommend the service. This was then cross referenced with the complaints and concerns and any overarching themes being identified. The reasoning
behind this is to identify commonality of areas of concern raised by patients, to help in identifying the focus for improvement. Please note if a theme is only
mentioned via one channel, e.g. just FFT, it is discounted from the analysis as it is not overarching so the validity of this is not as strong. Three wards were
identified, wards 34a, 9a and 32b . Matrons are supporting the wards to address the matters of concern. This approach was agreed by the Patient
Experience Group and will continue.

11 WELL LED
SRO: Director of People and Transformation and Medical Director
Overview Strategic Priority 4. Create an exceptional workforce for the future
Staff Engagement
The 2018 staff survey results demonstrate our journey of improvement continuing and the areas which we set as our strategic priorities have improved which
shows that the actions we have taken are having the required effect: staff are reporting that NBT is a better place to work in most respects, and engagement
has again increased. There are a small number of deteriorating results, but overall the results show a clear pattern of progress. Assuming that the current
trajectory of improvement continues, in 2019 we will be in line with or better than the acute average in the majority of areas. In relation to our two corporate
objectives: 4.1 Staff Engagement and 4.2 Staff Health and Wellbeing; we improved our score in both areas, however did not quite achieve the target set.
Stability
The stability (% of staff in post longer than 12 months) of the Trust workforce has improved and is 2% higher than at this time last year (equating to 36 wte
more staff in post with more than one years service). Stability will be developed as a theme within the IPR in 19/20 linking to the current year corporate
objective on staff leaving with less than one years service. Stability in teams supports improved quality of care.
Turnover
The number of staff leaving the Trust for voluntary reasons has improved overall in 18/19, with 84 wte lower leaving than the same period in 17/18 and an
improvement in rolling 12 month turnover of 1%. Nursing and midwifery has not followed the same trend and the stability of this staff group needs to become
our priority focus for 19/20, this is mirrored by national statistical information. The Interim Director of Nursing & Quality is leading the nursing & midwifery
steering group to gain momentum on progress.
Progress against corporate objectives:
• Reduction in proportion of leavers with less than one year service: Year to date 242.5 wte have left the Trust with less than one years service, which
is lower than the year to date position in 2017/18 by 17.5 wte. Band 2 and 3 nursing and midwifery is an outlier and a focussed piece of work to develop
retention actions is being initiated with the People and Transformation stakeholders and the Trust resourcing matrons.
• Reduction in proportion of leavers with reason ‘work life balance’: Year to date 328 wte left due to work life balance, 2 wte less than the same period
last year. Our focus on flexible working will intensify in 2019/20.
Health and Well-being
Sickness absence increased in January following the same trend as last year , although was lower than the same period last year. At Trust level the improved
position in terms of time lost to sickness continues in January but with the key exceptions of unregistered nursing and midwifery, allied health professionals
and medical and dental staff all seeing increases due to long term sickness. Further analysis of this issue and any impact of our very successful staff flu
vaccination campaign will be carried out and reported in year end IPR. Flu vaccination reached 76% of frontline staff vaccinated which will have contributed to
a reduction in time lost to cough, cold and influenza, this winter was 34% lower that the previous year (November to January).
Progress against corporate objective:
• Reduction of proportion of sickness attributed to ‘Stress / Anxiety / Depression / Other psychiatric illnesses’: wte days lost in the period April –
January in 2018/19 was 399 wte days lower than the same period in 2017/18. The work to review long term sickness increases across the staff groups
highlighted above will capture the position in relation to ‘Stress/Anxiety/Depression/Other Psychiatry’.
12 FINANCE
SRO: Director of Finance
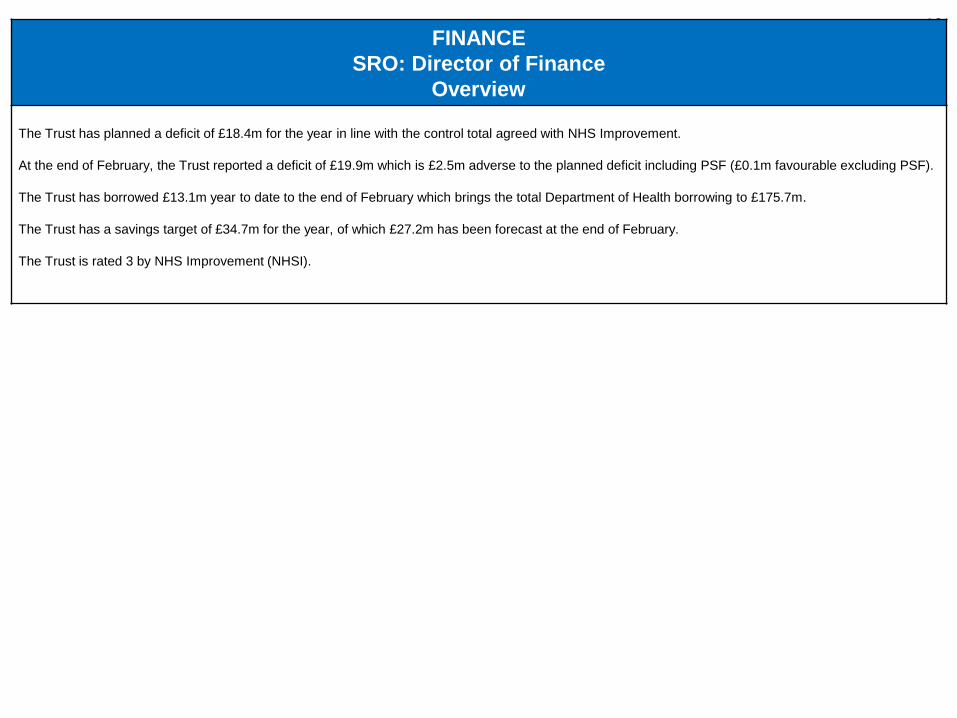
Overview
The Trust has planned a deficit of £18.4m for the year in line with the control total agreed with NHS Improvement.
At the end of February, the Trust reported a deficit of £19.9m which is £2.5m adverse to the planned deficit including PSF (£0.1m favourable excluding PSF).
The Trust has borrowed £13.1m year to date to the end of February which brings the total Department of Health borrowing to £175.7m.
The Trust has a savings target of £34.7m for the year, of which £27.2m has been forecast at the end of February.
The Trust is rated 3 by NHS Improvement (NHSI).

13
RESPONSIVENESS
Board Sponsor: Chief Operating Officer
Evelyn Barker

14 Urgent Care
ED performance deteriorated further in
February, underachieving against the
trajectory of 80.03% with a 4 hour wait
position of 70.74%, but reflects an
improvement on the February 2018
position of 67.46%.
Performance fluctuated throughout the
month with some days being
particularly challenged. Waiting time
performance was negatively impacted
by a combination of staffing
challenges, increased demand and
poor flow resulting from increased
acuity, particularly for infection
prevention control related cases.
Recovery following difficult periods
continues to be prompt, with the Trust
reporting substantial improvements in
waiting times the following day.
Increased demand continued
throughout February with the Trust
receiving peaks in attendances on
some occasions, with an average of
257 attendances per day. Attendances
remained above average relatively
consistently throughout the month.
Significant challenges in achieving the
four hour standard in February have
been reflected across the wider
BNSSG system.

15
4 Hour Performance
Overall waiting time performance was
effected by a decline in both admitted
and non-admitted breach performance
in February. Breaches were largely
attributable to ‘awaiting ED
assessment’ followed by ‘waiting for
bed’.
Reduced flow had the greatest impact
on breaches earlier in the month
where an increase in infective cases
and tertiary capacity needs increased
the demand for beds. The Trust
worked to prioritise the bed demand
and free up capacity for urgent
admissions. The period also saw an
increase in demand for critical care
capacity reflective of the acuity of
patients being admitted.
Staffing challenges and increased
demand/acuity further contributed to
the deterioration in waiting times
towards the end of the month, with a
surge of 67 arrivals within a three hour
period on the 24 February, and a
surge of 37 majors arrivals within a
three hour period on the 25 February.
The Trust worked quickly with system
partners to ease pressure on the
emergency department, supporting the
prompt recovery of the waiting times.

16
Occupancy, Attendances and
Admissions
The Trust started the month with a
deteriorated bed occupancy position of
98.85%. Improved flow resulted in a
favourable position of 93.3% on the 22
February, closing the month with an
occupancy of 97.11%.
Emergency activity has consistently
been higher when compared to last
year. The overall increase can be
attributed to Major attendances which
have increased 8.51% year to date on
last year. This majors growth is also
mirrored in the increase in ambulance
arrivals at the Trust. Minors attendances
are continue to rise with 2.68% more
presentations this year to date.
The number of ED attendances
converting to an admission decreased
as per seasonal trend in February with
average attendances remaining high for
the time of year. Emergency
admissions were seen to reduce in
February but remain up on last year and
were the second highest they have been
in the last three years with a 2%
increase from February 2018.
As a result of increasing demand,
emergency admissions to the main bed
base have increased by 6.83% this year
to date.

17 Ambulance Handovers
The Trust has seen a 2% decrease in
ambulance attendances in February
with an average of 91 arrivals per day.
This reflects a 8.98% increase in
ambulance arrivals this year to date
and a 7.59% increase on February last
year.
Despite the increase in demand this
year, performance against the 15
minute target remained above
trajectory with a performance of 92.4%.
The Trust marginally failed to achieve
the proposed trajectory of 100% for
ambulance handovers within 30
minutes of arrival in February, with
actual performance of 99.10%. This
continues to demonstrate a marked
improvement on last years
performance.
There were no 60 minute handover
breaches in month.
12 Hour Trolley Waits
February reports twenty-one 12 hour
trolley breaches in month occurring on
the 3 and 4 February.
*The recovery trajectory is provisional until agreement is reached with SWASFT.

18
*Owing to submission and data availability dates, the latest month DToC position is unvalidated.
DToCs and North Bristol
Operational Standards
There was a small decrease in the
numbers of Single Referral Forms
(SRFs) received in February, but this
is linked to the shorter month as an
average of 30 SRFs are navigated on
a Monday-Friday.
SRF numbers have increased on
weekends with an average of 16
received on a Saturday. There is
further promotion in the Trust to
further increase this number on
Sundays and Mondays where
numbers have been lower.
The number of bed days linked to
patients outside of operational
standards continues to reduce and
evidence from the Integrated Care
Bureau showing continued reduction
in average length of stay for complex
patients managed by partners
reducing from 31 days in October to
23 days in January.
The additional capacity in the Home
First service from Bristol has also
supported more discharges. However,
there remain constraints on the
availability of reablement which can
delay discharge.

19
North Bristol Operational
Standards
There was a significant impact on
flow with the number of delayed
patients waiting for pathway 2 beds,
both within and out of standards. The
main area impacted in February was
South Glos. There has been some
recovery, but the impact of reduced
care provision in the area is
potentially affecting discharges from
the pathway 2 bed base.
A review or the P3 and P2 bed base
models has been taken forward by
the CCG. The expected report will
identify the future commissioning
model for the community bed base.
However, a time frame for
completion is not yet known.
The fluctuations in demand are also
reviewed by the whole system
operational group to identify areas
where support is required and
models developed to deliver. This
has included the provision of a
peripatetic social work team for
Bristol which has ensured better
capacity to manage the caseloads.
In addition, Sirona are implementing
a mutual aid service to support with
additional reablement workers to
improve flow. A further development
is the introduction of the resilience
service from South Glos council to
reduce the assessment period in an
acute trust bed.
*Heat map data is unvalidated
Operating
StandardsDelay Reason 27 Dec 03 Jan 10 Jan 17 Jan 24 Jan 31 Jan 07 Feb 14 Feb 21 Feb 28 Feb
D2A Pathway 1 7 6 13 9 9 7 9 18 13 10
D2A Pathway 2 3 11 8 6 15 7 9 14 21 7
D2A Pathway 3 4 1 4 3 3 6 0 2 2 5
Awaiting MDT Ward Decision 11 43 25 29 33 28 31 26 29 25
Further Care - NHSE Commissioned 1 3 1 0 2 0 1 1 0 2
Residential Placements - N&RH (All funders) 10 10 8 9 15 13 11 9 10 9
Homecare (All Funders) 5 13 10 8 15 12 8 9 9 12
Managing Expectations (Choice) 1 1 1 2 5 4 5 5 3 4
Rehab 0 0 0 0 0 0 0 0 0 0
Social Care (Assessment) 15 6 28 33 20 19 17 20 22 17
Internal Hospital Delay 2 8 2 4 6 8 3 5 5 2
Further Care - CCG Commissioned 0 1 0 0 0 0 0 0 1 0
Other Categories 5 5 14 14 10 15 11 13 11 8
Not Suitable 0 0 0 0 0 0 0 0 0 0
64 108 114 117 133 119 105 122 126 101
D2A Pathway 1 6 6 1 3 4 7 4 10 3 5
D2A Pathway 2 7 6 7 6 5 16 10 4 6 21
D2A Pathway 3 3 3 3 1 2 2 3 0 0 0
Awaiting MDT Ward Decision 8 10 4 7 10 13 11 7 10 5
Further Care - NHSE Commissioned 4 4 4 4 2 3 1 2 2 3
Residential Placements - N&RH (All funders) 11 7 9 11 9 10 11 11 11 11
Homecare (All Funders) 14 13 14 12 10 12 4 6 7 14
Managing Expectations (Choice) 5 4 2 5 3 5 4 5 2 4
Rehab 0 0 0 0 0 0 0 0 0 0
Social Care (Assessment) 2 10 7 0 0 2 5 0 0 1
Internal Hospital Delay 6 9 3 10 6 8 5 9 8 7
Further Care - CCG Commissioned 0 0 0 0 0 0 2 0 0 1
Other Categories 5 3 4 5 5 6 10 13 16 20
Not Suitable 0 0 0 0 0 0 0 0 0 0
71 75 58 64 56 84 70 67 65 92
Within
Total (within)
Exceeds
Total (exceeds)

20
Referral to Treatment (RTT)
The Trust has marginally underachieved
against the RTT trajectory of 87.37%
with a final position of 86.95%.
Urology performance has demonstrated
sufficient improvements in recent months
to warrant stepping down of intensive
support from the Chief Operating Officer.
Urology continues to be monitored
through Remedial Action Plans.
Trauma and Orthopaedic and Ortho-
Spinal specialties deteriorated slightly in
February, contributing to the overall
underperformance. Remedial action
plans remain in place and continue to be
reviewed at the fortnightly performance
meetings. February reports a decline in
Gastroenterology and Plastic Surgery
performance further contributing to the
underperformance in February. A
refresh of Remedial Action Plans has
been requested.
Due to increased demand for the
service, the waiting times for Clinical
Immunology have increased. The Trust
is working with commissioners to
develop the service in light of the
increased demand.
* Please note that the Trust is working to resolve an interoperability issue between eRS and Lorenzo which is effecting RTT
clock starts for patients referred via eRS. This is having an adverse impact on the reported incomplete waiting list and is
currently reporting 7% less than the actual total waiting list size.

21
Referral to Treatment 52 Week Waits
The Trust has reported a total of 44
breaches in February 2019. These
patients were within the following
specialties:
20 MSK;
9 Plastic Surgery;
7 Urology;
7 Ortho-Spinal and
1 Neurosurgery;
Root cause analyses have been
completed for all patients, with dates for
patients’ operations being agreed at the
earliest opportunity and in line with the
patient’s choice.
Ortho-Spinal have not met a trajectory of
five in month and MSK have not
achieved the trajectory of nil, reporting
20 patients waiting 52ww. This is
improved from 21 reported in January.
All 52ww breaching specialties are being
closely monitored by a remedial action
plan and the Trust is currently reviewing
52ww clearance trajectories.
The Trust has classed patient choice as
any patient choosing to wait beyond 52
weeks when two reasonable offers with
three weeks advance notice have been
made prior to week 28 in their pathway.
The patients will have been clinically
reviewed as per best practice guidance
that the most appropriate course of
action is for them to continue to wait as
per their choice.

22 Cancellations
The same day non-clinical cancellation
rate has deteriorated further in February,
breaching the 0.8% target with a
performance of 1.45%.
In month there were no urgent
operations cancelled for a subsequent
time, with the total remaining at seven
this year to date.
There were three operations that could
not be rebooked within 28 days of
cancellation in February 2019. One
patients operation was cancelled as a
result of equipment failure, the second
was due to capacity and the third was a
result of the theatre list overrunning due
to complications. The three operations
were unable to be rebooked within 28
days due to capacity.
Root cause analyses have been
completed to ensure that there is no
patient harm.

23
Diagnostic Waiting Times
The Trust did not achieve the 1.00% target for diagnostic performance in February 2019 with
actual performance at 2.32%. The underperformance is largely attributable to an increase in
the number of patients waiting more than six weeks for Urodynamic tests.
February reports a significantly improved position for Endoscopy with an 67% reduction in
patients waiting over 6 weeks. This has taken the Endoscopy performance from 21.20% to
7.75%.
Four test types have reported in month underperformance; Colonoscopy, Flexi-Sigmoidoscopy,
Gastroscopy and Urodynamics.
Cystoscopy test position reports a return to standard in February with a position of 0.43% from
5.88% in January. As at February there was one patient waiting more than six weeks for a
Cystoscopy.
The Colonoscopy position has reported an improved position of 16.28%, with 70 patients
waiting over six weeks in month.
Gastroscopy have also further reported an improved position of 2.45%, with nine patients
waiting over six weeks.
Flexi-Sigmoidoscopy test position reports a significant improvement at 7.63% in February, from
37.11% in January with 18 patients breaching the 6 week waiting time standard.
Urodynamics have reported a further deteriorated position in February at 32.31%. There were
116 patients waiting more than 6 weeks in month. The deterioration is attributable to an
increase in referrals in November and December with a corresponding reduction in capacity. A
demand and capacity review is being undertaken to further understand the current needs of the
service and performance is being monitored with a Remedial Action Plan.
All other test types have reported patient diagnostic waiting times within the six week standard.

24
*Where data is unavailable, most recent performance is used for chart purposes.
Clinic Letter Typing
Three of the five Clinical Divisions’
average typing turnaround time
continues to report within the contractual
obligation. Improvements are required in
the ASCR Clinical Division to bring
typing times to within five days.
There are, at month end, 16 specialties,
of the 33 monitored that require
improvement in typing times to meet the
2018/19 contractual standard.
Urology and Plastic Surgery have
improved typing times from last month,
but not sufficiently to achieve the
contractual standard for February.
Within ASCR; Colorectal, Upper GI and
Vascular all reported a deterioration in
clinic letter typing times.
Neuropsychiatry, Neurology,
Neurophysiology, Rheumatology and
Trauma and Orthopaedics have reported
a deterioration in typing times, while
Neurosurgery is within contractual
standards.
Women's and Children’s division has
reported a decline within Antenatal,
Gynaecology and Obstetrics and are
now not meeting the contractual
standard.
Discharge Summaries
83.10% of discharge summaries were
available on ICE within 24 hours in
February 2019.

25 Cancer
The nationally reported cancer position
for January 2019 shows the Trust
achieved one of the seven cancer
waiting times standards.
The Trust failed the TWW standard with
performance of 75.74% which was a
decline in performance from December.
The Trust saw 2128 TWW referrals in
January and there were 516 breaches;
the majority were in Breast (349),
Colorectal (61) and Urology (52).
The breast breaches were due to
capacity issues caused by lack of
breast radiologist staffing. The Trust
also failed the breast non-symptomatic
TWW standard with a performance of
48.16% against the 93% target due to
the same staffing issues.
The performance against both of these
standards will improve significantly
against both of these standards for
February.
The Trust failed the 31 day first
treatment standard with a performance
92.28% against the 96% target. There
were 19 breaches in total; 1 in skin and
18 in urology. All urology breaches
were due to delays to robotic surgery
due to a continued increase in numbers
of patients requiring these procedures
as first and subsequent treatments
which will be resolved when the second
robot is operational and the backlog
cleared.

26 The Trust failed the 62 day treatment standard in January with a performance of
82.17%.
In January, 42 patients breached the 62-day standard, 27 of which started their pathway
at NBT. Of these 27 patients, 19 had their first appointment at NBT after day seven.
Delays in radiology contributed to 5 breaches and delays in pathology contributed to 2.
Urology breaches accounted for 73% of total Trust breaches for January, with the
majority of the internal breaches on the prostate pathway. Capacity issues in radiology,
joint oncology clinics and robotic theatres continue to limit the ability to meet the 62 day
standard in urology during this period.
Due to failing the standard all of the previous months in the financial year the Trust has
been issued with a contract performance notice. The Trust is undertaking a joint
investigation with the CCG with the Trust addressing internal issues and the CCG being
tasked with addressing the impact of tertiary patients being transferred to the Trust
beyond the allowed timescales.
The Urology recovery and sustainability plan has been implemented and the waiting
times for biopsies on the prostate pathway have been reduced from over 7 weeks to
under 2 weeks. This improvement has enabled the Urology department to improve
performance against the standard in each of the past three months with the
improvement forecasted to be sustained from March 2019.
The continued delays for Oncology outpatient appointments will continue to impact
performance for the foreseeable future. The Trust continues to address delays for
Oncology capacity with University Hospitals Bristol.
The continued increase of late tertiary transfer patients from elsewhere in the region and
the clearing of the associated backlog has continued to impact on urology performance.
Of January’s 31 urology breaches, 15 were transferred in from other providers for
treatment, 14 of which were beyond the agreed national transfer date, accounting for 7.5
additional breaches. 10 of these patients had exceeded the 62 day pathway prior to
being referred to the Trust.
As part of performance improvements the Trust has been monitoring it’s internal
performance against the 62 day standard. The Trust treated 87.7% of all patients who
were referred and treated at NBT within the national standard.
NB: The charts show the breakdown of breach reasons for both whole and shared 62 day breaches for the month.
Breakdown of breach reason may not match total published performance due to time of which data was captured. Data
is extracted from a live system.

27
The Trust achieved the 31 day
subsequent treatment for patients
receiving anti-cancer drugs with
performance of 100%.
The Trust failed the 31 day subsequent
treatment target in January 2019 for
patients requiring surgery with a
performance of 75.63% against the 94%
standard. This was a decline in
performance from December.
The continued failure against this
standard has resulted in a contract
performance notice being issued by the
CGG. The Trust has submitted an
action plan to recover this position as a
response with significant improvements
forecasted from September 2019.
There were 29 breaches in total; 18 of
which were in skin and 11 in urology. All
29 breaches were due to lack of theatre
capacity within the specified timeframe.
The Urology position will improve with
the implementation of the second robot.
The Trust failed the 62 day screening
target with a performance of 89.04%
against the target of 90%.
The majority of breaches were in breast
and were due to lack of capacity at
differing parts of the pathways and the
transfer of patients between different
providers within the region.

28
ED 4 Hour Performance
NBT ED performance in February 2019
is 70.47% compared to a national type 1
position of 75.73%. The position reflects
a deterioration from January and reports
less than the national type-1 position of
70.47%. The position continues to be
improved on 2017/18 performance.
RTT Incomplete
The Trust reported a January 2019
position of 86.95%. This improved
position continues to outperform the
national position of 86.73%.
Cancer – 62 Day Standard
NBT has reported 82.17% performance
and continues to outperform the national
position of 76.24% in January 2019.
DM01
NBT, in January 2019, failed to achieve
the National standard of 1% with a
performance position of 3.88% against a
national position 3.59%.
RTT, Cancer and DM01 national performance is reported a month in arrears.

29
ED 4 Hour Performance
In February, NBT further dropped from
a position of #67 to #100 out of 134.
The decline in performance put the
Trust in the third quartile when
compared to other type one providers.
The Trust ranked 7th out of 11 adult
major trauma centres.
RTT Incomplete
RTT performance in January 2019
reports an improved NBT position of
#109 out of 177 reported positions. The
Trust continues to rank 4th out of 11
other adult major trauma centres.
Cancer – 62 Day Standard
At position 54# of 140 reported
positions, NBT reports performance of
82.17%. This represents deterioration
in positioning from December 18 and
continues to rank 1st out of 11 major
trauma centres.
DM01
NBT reports a position of #145 out of
203 reported diagnostic positions, with
a performance of 3.89% in January.
This position continues to rank 6th out
of 11 adult major trauma centres.
RTT, Cancer and DM01 national performance is reported a month in arrears.

30
Safety and Effectiveness
Board Sponsors: Medical Director and Interim Director of Nursing
Chris Burton and Helen Blanchard

31 Maternity Staffing
In February 2019 the maternity unit ‘closed’ on 2
occasions due to high activity and acuity with
women being triaged on a case by case basis. No
women were transferred during these events.
Closure policies are being reviewed across the
South West as no units in fact close fully to
women.
Recruitment
• Recruitment is ongoing to the additional
midwifery posts approved by the Board. Of
23.8wte only 7.8wte are yet to be appointed to.
• Interviews took place on 12th March 2019 for the
Deputy Director of Midwifery/ Head of Nursing
with the post successfully appointed to. Start
date 10th June 2019.
• The post of Matron for Birth Centres and Home
Birth Service is also advertised with interviews
taking place on 20th March 2019.
Closure of Cossham Birth Centre
Work has begun to review the staffing models for
the Freestanding Birth Centre and the Alongside
Birth Centre as well as the Home Birth Service to
ensure we have a sustainable staffing model which
will take into account the need to implement
midwifery continuity of carer (CoC) in line with the
national target of 20% booked onto a CoC pathway
by March 2019 and 35% by March 2020. Cossham
Birth Centre remains temporarily closed to women
in labour until September 2019.
External Peer Review 26th & 27th February
Whilst we await the formal report, initial feedback
was very helpful. Positive comments were
received as well as areas highlighted that need a
focus and further work to help us improve and
make sure we are ‘CQC ready’ when the time
comes.
‘My Pregnancy @ NBT’ smartphone app launched on 04 May 2018 to replace patient information leaflets and give women and families access to evidence based care ‘on-the-go’ wherever and whenever they choose.
Apr-18 May-18 Jun-18 Jul-18 Aug-18 Sep-18 Oct-18 Nov-18 Dec-18 Jan-19 Feb-19 Trend
516 523 511 534 543 515 535 497 491 478 458
01:30 01:30 01:30 01:30 01:33 01:33 01:33 01:30 01:31 01:30 01:30
56.6% 55.8% 56.0% 56.1% 56.4% 60.1% 51.8% 53.1% 51.1% 56.0% 51.1%
30.3% 29.6% 29.1% 28.5% 31.2% 27.3% 34.1% 32.1% 34.4% 32.1% 37.9%
17.2% 17.3% 18.0% 17.3% 17.1% 14.6% 18.7% 19.2% 19.1% 18.0% 23.0%
35.5% 33.9% 34.1% 35.0% 33.1% 35.7% 34.7% 34.9% 33.4% 34.0% 37.7%
18.9% 17.8% 17.8% 19.9% 19.3% 18.8% 13.4% 14.3% 7.9% 14.9% 12.0%
3.1% 4.1% 5.7% 6.1% 6.4% 2.8% 0.2% 0.0% 0.0% 0.0% 0.0%
15.2% 13.3% 11.5% 12.9% 12.1% 14.3% 12.1% 12.9% 6.7% 12.6% 10.7%
0.6% 0.4% 0.6% 0.9% 0.4% 1.4% 3.0% 1.2% 1.2% 2.3% 1.3%
80.1% 81.3% 81.0% 79.2% 80.4% 79.8% 83.7% 84.5% 89.6% 83.7% 86.7%
97.4% 98.1% 96.9% 97.0% 95.7% 95.4% 96.4% 95.4% 95.9% 97.4% 97.7%
Actual 0 1 4 0 1 1 2 1 2 2 3
Rate 0.00% 0.40% 0.80% 0.00% 0.20% 0.20% 0.40% 0.20% 0.40% 0.41% 0.60%
CDS
One to one care in labour
Birth location
Stillbirth
Cossham BC
Mendip BC
Birth
Total Births
Home
Induction of labour rate
Normal birth rate
Caesarean birth rate
Midwife to birth ratio
Total births in midwife led environment
Emergency caesarean birth rate

32 Quality & Patient Safety
Additional Safety Measures Board Sponsor: Director of Nursing
Serious Incidents (SI)
Two serious incidents were reported to STEIS
in February 2019:
• 1 x Treatment or Procedure
• 1 x Maternity & Obstetrics
Three Serious Falls were identified at
Corporate SWARM for investigation with
review at the Trust Falls Group.
Never Events
Three Never Events occurred in January (two
declared in January/one declared in
February). These were all unintentional
connection of a patient requiring oxygen to an
air flowmeter, taking the total number of these
Never Events to four for 2018/2019. Each is
being investigated with a thematic review
being conducted across all four. The thematic
review will also take account of the recent
report published by the Healthcare safety
Investigation Branch (HSIB) into the national
occurrence and learning for this type of Never
Event. The thematic review will report to
Patient Safety and Clinical Risk Committee on
April 5 2019.
SI & Incident Reporting Rates
Incident reporting has remained similar to the
rate in January at 46.0 per 1000 bed days; this
is consistent with national averages for similar
organisations.

33 Quality & Patient Safety
Additional Safety Measures Board Sponsor: Director of Nursing
Incident Reporting Deadlines for
Serious Incident Investigation
submission
No serious incidents breached their
February 2019 reporting deadline to
commissioners. There have been no
breaches since July 2018.
Top SI Types in Rolling 12 Months
Patient Falls remain the most
prevalent reported SIs. These are
monitored through the Trust Falls
Group
This is followed by
• Treatment or Procedure
• Maternity & Obstetrics.
“Other” Category:
• 2 Infection Control
• 2 Appointments
• 2 Medication
• 1 1 Resuscitation Event
• 1 Fluid Management
• 1 Medical Device/Equipment
Data Reporting basis
The data is based on the date a serious incident is
reported to STEIS. Serious incidents are open to being
downgraded if the resulting investigation concludes the
incident did not directly harm the patient i.e. Trolley
breaches. This may mean changes are seen when
compared to data contained within prior Months’ reports
Central Alerting System (CAS) 9 new alerts reported, with none breaching their alert target dates.
CAS Alerts – February 2019
Alert Type Patient
Safety Facilities
Medical
Devices
Supply
Distribution
Alerts
New Alerts 1 1 7 0
Closed Alerts 0 0 4 0
Open alerts (within target date)
1 1 3 0
Breaches of Alert target
0 0 0
0
Breaches of alerts previously issued
0 0 0 0

34 Harm Free Care
The ‘harm free’ care reporting
includes both overall harm free care
and the new harm rates which are
reflective of ‘hospital acquired harm’.
This month shows 98.13% for harm
free care compliance adjusted for
hospital acquired harm.
Falls
In February there were 6 severe falls
reported among the 193 total. Of the
other falls, 8 were moderate, 44 low
and 135 no-harm. The majority of
reported falls occur within the
Medicine Division (108) with the
others occurring in NMSK (52), ASCR
(32) and 1 in CCS.
The falls group plan data collection of
the falls rates since the Move to the
Brunel to assess and explore the
effects of learning and opportunities
for further change.

35
Pressure Injuries
The 2018/19 Trust objectives for the
reduction of pressure injuries remain
a zero tolerance for grade 4 and 3
and a 20% reduction (40 fewer cases
than the previous year) for grade 2.
There were no reported grade 4 or 3
pressure injuries in February.
There were twenty nine reported
grade 2 injuries which occurred within
the NMSK, ASCR and Medicine
Divisions. Of the grade 2 pressure
injuries reported, 34% were heels,
38% sacrum/buttock. 14% were
related to medical devices (4 cases),
Halo brace, oxygen tubing, endo
tracheal tape, naso gastric tube
fixation.
For the Trust to achieve the trajectory
of a 20% reduction of grade two
pressure injury for 2018/19 we must
achieve no more than three cases in
the final month of this financial year.
The final event count down has begun
for the Trust quality improvement
project, led by the Medicine Division
to reduce NBT acquired pressure
injuries.
VTE Risk Assessment
Timely VTE Risk Assessments above
the 95% national standard have
continued.

36
WHO Checklist Compliance
Measured compliance with the WHO checklist was 98% in February.
WHO safer surgery list compliance is led by the theatre management team, linking with
each speciality cluster, the programme is reporting into theatre board.
37
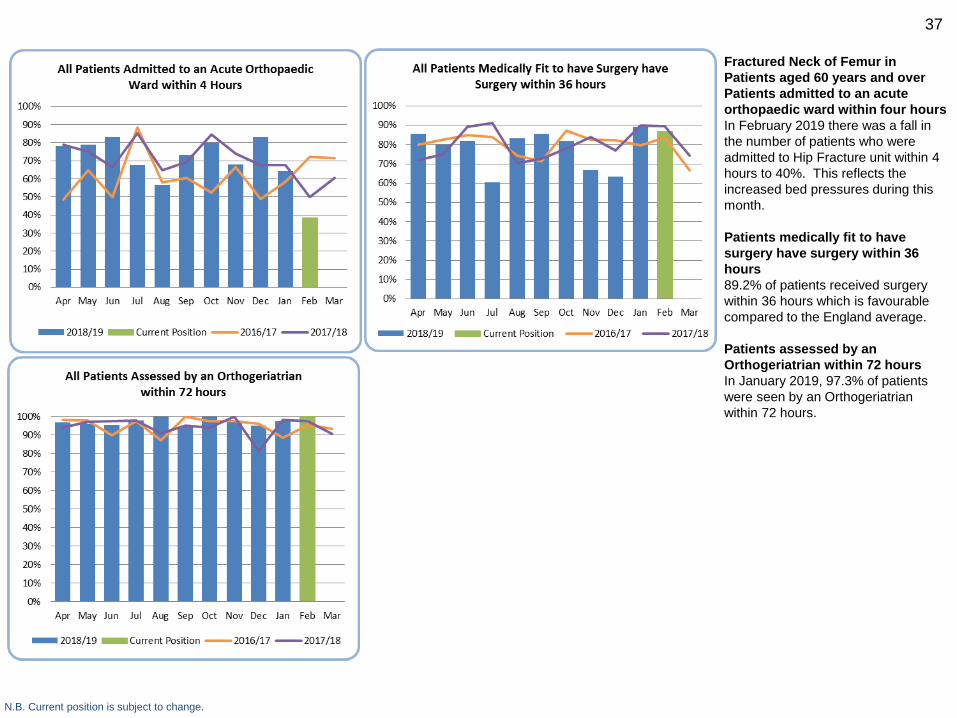
Fractured Neck of Femur in
Patients aged 60 years and over
Patients admitted to an acute
orthopaedic ward within four hours
In February 2019 there was a fall in
the number of patients who were
admitted to Hip Fracture unit within 4
hours to 40%. This reflects the
increased bed pressures during this
month.
Patients medically fit to have
surgery have surgery within 36
hours
89.2% of patients received surgery
within 36 hours which is favourable
compared to the England average.
Patients assessed by an
Orthogeriatrian within 72 hours
In January 2019, 97.3% of patients
were seen by an Orthogeriatrian
within 72 hours.
N.B. Current position is subject to change.

38
Stroke
Stroke activity remains high
compared to previous years
There is still good performance by
national comparison with the
requirement to scan within one hour
and to thrombolyse within one hour.
Admissions to the stroke unit within 4
hours have however reduced as a
result of pressure on bed availability.
N.B. England performance is the latest available position published on SSNAP. Current position is subject to change.

39
High Risk Drugs
Incidents relating to high risk drugs are
closely monitored by the Medicines
Governance team and reported at the
Medicine Governance Group.
Missed Doses
Ward pharmacists meet with the ward
managers of the wards showing an
increase and undertake a more in
depth audit for 2 weeks to help identify
causes of missed doses.
Chemocare Protocols
All NBT patients have their
chemotherapy prescribed via
Chemocare, apart from clinical trials
patients. Clinical trials protocols are in
the process of being built.
Protocol progress to date Mar-19 Jul-18
Released to LIVE 67 40
Validated - ready for release 1 5
Submitted for validation 1 0
Queries 0 4
Build in progress 5 1
Lung to be built 0 5
Trials to be built 3 5
To be built 0 7
To be built - no current NBT use 5 5
To be built - no current use or protocol 3 5
Built corrections required 1 3
Total 86 80

40 MRSA
There has been one reported case of
MRSA bacteraemia in February. The
Trust total is now at nine cases for
18/19. It is not thought that MRSA was
acquired in NBT and the focus is on
preventing skin colonisation becoming
bacteraemia.
The Trust’s improvement plan is
focussed on good management of
indwelling vascular devices. A Trust
quality improvement initiative has been
commenced led by the ASCR and
NMSK divisions and this is being
overseen by the infection control
monitoring group.
MSSA
There were three reported cases of
MSSA bacteraemia in February.
Benchmarking data shows that rates of
MSSA bacteraemia per 100,000 bed
days are as expected.
C. Difficile
The Trust objective for 2018/19 is
fewer than 42 cases. Two cases were
reported in February 2019.
Lapses in care as defined within
National guidance have raised issues
in 21 out of the 35 cases reported from
April to February.

41 E. Coli
There were six cases of E. Coli
bacteraemia reported in February. The
focus for improvement is on the
insertion and ongoing management of
urinary catheters.
Hand Hygiene
Hand Hygiene compliance reported as
95% in February.
National hand hygiene and personal
protective equipment policy was
launched at the 2019 CNO conference.
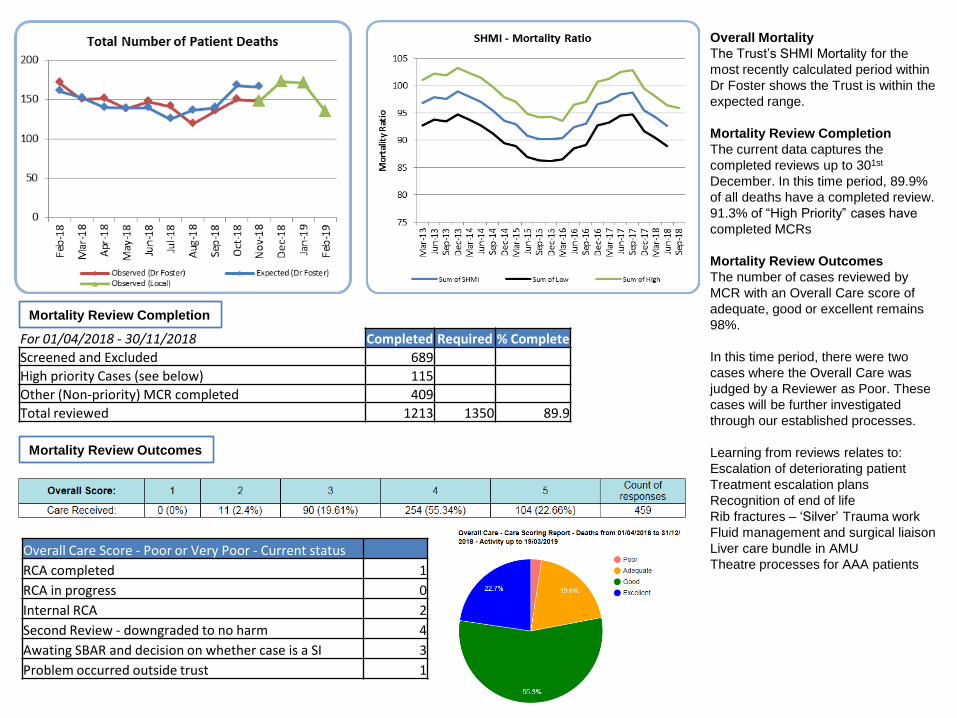
Overall Mortality
The Trust’s SHMI Mortality for the
most recently calculated period within
Dr Foster shows the Trust is within the
expected range.
Mortality Review Completion
The current data captures the
completed reviews up to 301st
December. In this time period, 89.9%
of all deaths have a completed review.
91.3% of “High Priority” cases have
completed MCRs
Mortality Review Outcomes
The number of cases reviewed by
MCR with an Overall Care score of
adequate, good or excellent remains
98%.
In this time period, there were two
cases where the Overall Care was
judged by a Reviewer as Poor. These
cases will be further investigated
through our established processes.
Learning from reviews relates to:
Escalation of deteriorating patient
Treatment escalation plans
Recognition of end of life
Rib fractures – ‘Silver’ Trauma work
Fluid management and surgical liaison
Liver care bundle in AMU
Theatre processes for AAA patients Overall Care Score - Poor or Very Poor - Current status
RCA completed 1
RCA in progress 0
Internal RCA 2
Second Review - downgraded to no harm 4
Awating SBAR and decision on whether case is a SI 3
Problem occurred outside trust 1
For 01/04/2018 - 30/11/2018 Completed Required % Complete
Screened and Excluded 689
High priority Cases (see below) 115
Other (Non-priority) MCR completed 409
Total reviewed 1213 1350 89.9
Mortality Review Completion
Mortality Review Outcomes

43
Quality Experience
Board Sponsor: Interim Director of Nursing
Helen Blanchard

44
N.B. NHS England FFT Official stats publish data one month behind current data presented in this IPR.
May 2018, South West region has been split to SW (North) and SW (South). NBT is now plotting against SW (North).
Owing to technical issues, NHS England have not published
maternity FFT data for November 2017.
Friends and Family Test
The Inpatient response rate increased
again .
The Emergency Department remains
significantly above the National & SW
Regional average.
Outpatient services experienced a
decrease this month. Included in the
Outpatient service improvement
program is the promotion of the FFT
feedback opportunity with those who
use the service
Maternity (Birth) have continued to
report above the 15% target.
ED 15% 21.49%
Inpatients 30% 19.16%
Outpatients 6% 14.63%
Maternity (Birth) 15% 18.32%
FFT Response
RateNBT ActualTarget

45
Owing to technical issues, NHS England have not published
maternity FFT data for November 2017.
N.B. NHS England FFT Official stats publish data one month behind current data presented in this IPR.
May 2018, South West region has been split to SW (North) and SW (South). NBT is now plotting against SW (North).
% recommend rates remain fairly
static . Outpatients remain on an
upwards trajectory above national and
SW regional scores as does ED
Inpatient % recommend remain below
the average below the national &
regional benchmark
What are people saying about our
services?
Across all areas, ‘Staff’ ( attitude ,
caring etc. ) is the area most widely
commented on, reinforcing that the
relationship with staff is a very
important element of their experience.
‘Waiting Time’ is the area most
attributed to a negative experience.
In a more in-depth exploration in to
this, it has been identified that , within
Outpatients, people are often
frustrated about the lack of
communication when there is a delay.
This feedback was also reflected in
the recent engagement event on OP
services . Improvement in this area
would help a good experience be very
good.
In ED poor waiting times related to
patients perceiving the needed
treatment earlier and therefore
required reassurance on this .
Therefore action to continually
reassure patients is vital.
There continues to be more positive
reports of waiting experience than
negative..
Owing to technical issues, NHS England have not published
maternity FFT data for November 2017.
N.B. NHS England FFT Official stats publish data one month behind current data presented in this IPR.
May 2018, South West region has been split to SW (North) and SW (South). NBT is now plotting against SW (North).
ED 90% 88.77%
Inpatients 95% 92.19%
Outpatients 95% 95.30%
Maternity (Birth) 95% 97.59%
Target NBT ActualFFT Recommend
Rate

46 Friends and Family Test
“Please tell us the main reason for the answer you chose.”
Would you recommend? 1. Extremely Likely 2. Likely 3. Neither Likely nor Unlikely 4. Unlikely 5. Extremely Unlikely 6. Don’t know
Inpatient – 33a (1)
Staff kept me informed at all times. Were very supportive, helpful and encouraging
Emergency Department – (3)
The doctors, nurses, and staff were
incredible. Couldn’t ask for anything better.
The facilities on the other hand are poor.
Uncomfortable chairs, expensive and
unhealthy vending machine food, broken
coffee machine Out patients : Gate 36 Neurosurgery
Arrived for appointment only to be told after 45 minutes of waiting that the doctor was on holiday and no-one was aware that they had appointments booked. I was not the only patient in this situation. My partner had to take a day off work to drive me into hospital, so not an inexpensive exercise all round. After excellent care in ICU and on ward, outpatients has let me down.
Out patient : Diabetic I saw a different consultant again -
the second new consultant in two
visits - it seems we spent most of the
time establishing a baseline for the
second time in a row
Out patients trauma and orthopaedics (3)
Appointment was 10.00 wasn’t informed of any delays, was called to a room at 10.55 and still didnt see a doctor until 11.30, the staff nurse who was at reception did not say a word regarding long delays . Eventually I left department at 13.18. And then had to pay extra for car parking not good as it was not my fault
Out patient : Clinical Research
Staff were friendly and welcoming. The trial was clearly explained and options were discussed. There was no pressure to take part

47 Complaints and Concerns
In February there were 48 complaints
received, which is a slight decrease of 2 from
last month. This is the lowest number
received in month since March 2018
35 concerns were received, which is an
decrease of 30 on last month. In total there
were 83 complaints and concerns received.
Overdue cases
The number of cases that were overdue at
the end of February was 41.
Local Resolution Meetings
4 local resolution meetings were undertaken
in February 2019 to resolve ongoing
complaints. A local resolution meeting
provides an opportunity for the patient and
relatives to meet with senior staff to discuss
their concerns and seek mutual resolution to
their concerns in an informal and open
manner.
Final Response Compliance
Of the cases closed in February 2019 to
account for late responses), 82 (53%) were
completed within the agreed timescale.
NHS Choices web posts
No posts were received for February 2019,
Southmead Hospital Overall Rating from the
NHS Choices home page is currently 4.5
stars, against 235 reviews.
The advice and complaints team provide
feedback comments to each reviewer,
usually within a day of receipt.

48 Complaint/Concern Handling
The top three categories of
complaints/concerns currently are
clinical treatment (44),
communication (43) and
delay/cancellation outpatients (24).
Ombudsman cases
No new cases were received from
the Ombudsman in February
2019 and no outcomes were
received.
A Patient Advice and Liaison
Service (PALS) Pilot commended on
11February.
PALS Pilot 2 Week Update (11 -25
February )
The PALS pilot has seen a
successful and positive start
Total amounts of PALS concerns
received: 57
• 52 were raised externally,
• 3 were raised by inpatients,
• 2 were raised by NBT employees
Method of contact
• 33 received by phone ,
• 20 by email
• 4 face to face
Response times
• 86% of concerns have been
successfully resolved same day
• 7 % of concerns have been
successfully resolved within 1
working day
• 7% of concerns have required <1
working day to resolve
• 0% of concerns have escalated to
formal complaint
Q1 18/19 Q2 18/19 Q3 18/19 Jan-19 Feb-19
New Cases referred to PHSO 1 3 0 0 0
No. of cases fully upheld 0 0 1 0 0
No. of cases partially upheld 0 1 0 0 0
No. of cases not upheld 0 1 0 0 0
Fines levied 0 0 0 0 0Corrective Actions Compliant within
timescales0 0 0 0 0
Non- compliant 0 0 0 Nil Nil
Parliamentary Health Service Ombudsman (PHSO) Cases

49
NBT is achieving 102% of the recruitment
target set by the regional network. Over 1000
more patients and staff have had the
opportunity to participate in research
compared to this time last year.
ASSIST: NBT has successfully completed the
first phase in a series of trials which, if
successful could offer women the first viable
alternative device for assist end birth in 50
Years. The trial, funded by the Bill and
Melinda Gates Foundation and led by Tim
Draycott and NBT has successfully recruited
40 women for whom their assisted birth an
ODON device was used. There was no
serious adverse maternal or neonatal
reactions. The team consented over 350
women for this innovative and exciting trial.
The next phase of the programme is due to
start in May / June where we aim to recruit
100 women to use the device, consenting in
excess of 870 women
In February 2019 NBT also saw the
successful end to recruitment of an NBT
sponsored multicentre study LODED. The
study exploring the safety and efficacy of Limit of Detection of Troponin and ECG Discharge in patients presenting in ED with chest pain has successfully recruited nationally, and within target a significant achievement.
NBT is currently setting up ten newly
awarded NIHR grants worth a total of £4.9m,
these will all open by summer 2019, the is the
most NIHR grants NBT has had in set-up at
any one time.
One of the grants in set-up is led by Dr Mike
Whitehouse who recently received an intent
to fund from the NIHR to undertake a national
multicentre trial to evaluate microstructural
scaffold insertion following microfracture for
chondral knee defects (SISMIC), the grant is
worth £1.3m.
Research and Innovation Board Sponsor: Medical Director

50
Facilities
Board Sponsor: Director of Facilities
Simon Wood

51
Very High Risk Areas
Target Score 98%
Audited Weekly
Include: Augmented Care Wards and areas such as ICU, NICU,
AMU, Emergency Department, Renal Dialysis Unit
High Risk Areas
Target Score 95%
Audited Fortnightly
Include: Wards, Inpatient and Outpatient Therapies, Neuro Out
Patient Department, Cardiac/Respiratory Outpatient Department,
Imaging Services
Significant Areas
Target Score 90%
Audited Monthly
Include: Audiology, Plaster rooms, Cotswold Out Patient
Department
Low Risk Areas
Target Score 80%
Audited Every 13 weeks
Include: Christopher Hancock, Data Centre, Seminar Rooms,
Office Areas, Learning and Research Building (non-lab areas)
Operational Services Report on
Cleaning Performance against the
49 Elements of PAS 5748 v.2014
(Specification for the planning,
application, measurement and
review of cleanliness in
hospitals)
Cleaning scores in February have
remained above target across the
four risk categories.
Cleaning performance throughout
2018 and into 2019 has been at it’s
highest and most consistent since all
services moved to Southmead,
continually being on or above target
since May 2018
Between 340 and 420 Deep Cleans
were requested per week throughout
February. Performance against the
4hr completion SLA was at 97%.
Facilities teams continue to work to
embed Perform principles to support
clinical teams across the site and
play an effective role through winter
pressures.
Facilities Management - Board Sponsor: Director of Facilities

52
Well Led
Board Sponsors: Medical Director, Director of People and Transformation
Chris Burton and Jacolyn Fergusson

53
Overall worked wte decreased in
February with a reduction in
substantive and non-medical bank
worked.
Both locum and agency use increased
and this was mirrored in expenditure
increasing in these areas. Agency
expenditure increased in registered
nursing and midwifery and consultants
in February. Administrative staff was
the third largest expenditure.
The resourcing team have been
tasked with developed an agency
expenditure trajectory for 19/20 for the
key staff groups in line with divisional
operational plans for 19/20.

54
Nursing Workforce
The Registered Nursing WTE worked
in February remains below the funded
volumes but the impact on cost
continues to be due to the agency
use required to fill the vacancies.
Actions in place
A number of additional controls have
been implemented to reduce the
demand for agency RNs through the
validation of vacant shifts before
submission to the neutral vendor.
Changes have been made to the
authorisation for additional
unregistered shifts above funded
levels (for enhanced care and
additional activity) which is reflected
in the decrease in unregistered nurse
WTE more closely matching funding.
The nursing and midwifery workforce
group continues to monitor effective
rostering, use of temporary staff,
opportunities for new roles,
international recruitment and
recruitment and retention.
NBT continues to work our partners
GRI to increase the number of
nursing agencies on the supply
panel. Work is taking place to contact
all agency suppliers on all of the
National Frameworks and promote to
opportunity to supply staff through the
contract. In total over 100 agencies
have been contacted.
.
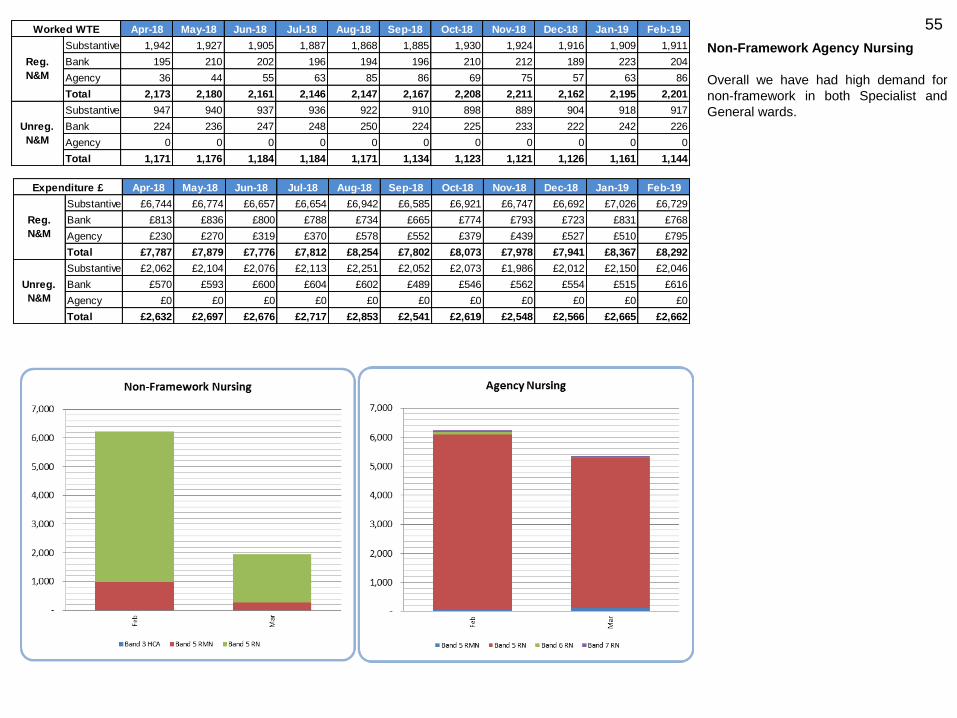
55
Non-Framework Agency Nursing
Overall we have had high demand for
non-framework in both Specialist and
General wards.
Apr-18 May-18 Jun-18 Jul-18 Aug-18 Sep-18 Oct-18 Nov-18 Dec-18 Jan-19 Feb-19
Substantive 1,942 1,927 1,905 1,887 1,868 1,885 1,930 1,924 1,916 1,909 1,911
Bank 195 210 202 196 194 196 210 212 189 223 204
Agency 36 44 55 63 85 86 69 75 57 63 86
Total 2,173 2,180 2,161 2,146 2,147 2,167 2,208 2,211 2,162 2,195 2,201
Substantive 947 940 937 936 922 910 898 889 904 918 917
Bank 224 236 247 248 250 224 225 233 222 242 226
Agency 0 0 0 0 0 0 0 0 0 0 0
Total 1,171 1,176 1,184 1,184 1,171 1,134 1,123 1,121 1,126 1,161 1,144
Unreg.
N&M
Reg.
N&M
Worked WTE
Apr-18 May-18 Jun-18 Jul-18 Aug-18 Sep-18 Oct-18 Nov-18 Dec-18 Jan-19 Feb-19
Substantive £6,744 £6,774 £6,657 £6,654 £6,942 £6,585 £6,921 £6,747 £6,692 £7,026 £6,729
Bank £813 £836 £800 £788 £734 £665 £774 £793 £723 £831 £768
Agency £230 £270 £319 £370 £578 £552 £379 £439 £527 £510 £795
Total £7,787 £7,879 £7,776 £7,812 £8,254 £7,802 £8,073 £7,978 £7,941 £8,367 £8,292
Substantive £2,062 £2,104 £2,076 £2,113 £2,251 £2,052 £2,073 £1,986 £2,012 £2,150 £2,046
Bank £570 £593 £600 £604 £602 £489 £546 £562 £554 £515 £616
Agency £0 £0 £0 £0 £0 £0 £0 £0 £0 £0 £0
Total £2,632 £2,697 £2,676 £2,717 £2,853 £2,541 £2,619 £2,548 £2,566 £2,665 £2,662
Unreg.
N&M
Reg.
N&M
Expenditure £

56
The numbers of hours Registered Nurses (RN) / Registered Midwives (RM) and Care Assistants (CA), planned and actual, on both day and night shifts are collated . CHPPD for Southmead hospital includes ICU, NICU and the Birth Suite where 1:1 care is required. This data is uploaded on UNIFY for NHS Choices and also on our Website showing overall Trust position and each individual gate level. The breakdown for each of the ward areas is available on the external webpage.
Nursing and Midwifery Fill Rates and Care Hours
per Patient Day (CHPPD)
CHPPD has reduced to 8.7 in February from 8.9 in
December reflecting the rise in activity from
December.
Areas below 80% fill rate for Healthcare
Assistants (CA) and Registered Nurses (RN):
NICU: Reduced fill rates for CA on days and nights
with staffing closely monitored and CA staff moved to
support activity from within division as necessary.
32B (SAU): reduced fill rate for CA on days as a
result of vacancies with other wards supporting as
required to deliver safe care.
Gate 19 (IR): Reduced fill rates for CA and RN on
days however the unit uses staff flexibly across the
labs and the recovery area which is not captured in
the data.
31 AMU: Reduced fill rate due to vacancies with
additional support from across the division as
required to deliver safe care
Ward over 175% fill rate:
33A and 34B: Increased CA hours due to skill mix
changes being piloted to reflect changes in speciality
and additional CA hours required for enhanced care.
Rosa Burden: CA on days due to enhanced care for
one patient
Cossham Midwifery Fill Rate and CHPPD:
Cossham remains temporarily closed to deliveries.
Therefore we have not reported for the unit this
month.
RN/RM
Fill rate
CA Fill
rate
RN/RM
Fill rate
CA Fill
rate
Southmead 92.0% 97.2% 99.3% 106.8%
Day shift Night Shift
Feb-19

57 Care Hours per Patient Day (CHPPD)
The chart shows care hours per patient
day for NBT total and split by registered
and unregistered nursing and shows
CHPP for our Model Hospital peers (all
data from Model Hospital)
Safe Care Live
(Electronic Acuity tool)
The acuity of patients is measured three
times daily at ward level. The latest data
for January demonstrates that rostered
hours do not meet the required hours.
The ‘gap’ would also be increased if all
divisions had completed all of their
patient census’ as some hours of
required care are not able to be
presented.
The Safe Care data is triangulated with
numbers of staff on shift and
professional judgement to determine
whether the required hours available for
safe care in a ward/unit aligns with the
rostered hours available.
Staff are redeployed between clinical
areas and Divisions following daily
staffing meetings involving all Divisions,
to ensure safety is maintained in
wards/areas where a significant shortfall
in required hours is identified, to
maintain patient safety.

58
2016/17
Year End
2017/18
Year End Feb-19
WTE WTE WTE
Add Prof Scientif ic and Technic 211 216 226 4.5%
Additional Clinical Services 1,344 1,436 1,403 -2.3%
Administrative and Clerical 1,368 1,349 1,395 3.4%
Allied Health Professionals 359 353 394 11.6%
Estates and Ancillary 673 653 686 5.0%
Healthcare Scientists 349 342 357 4.5%
Medical and Dental 874 894 920 3.0%
Nursing and Midw ifery Registered 2,003 1,985 1,949 -1.8%
Grand Total 7,181.8 7,228.6 7,329.9 1.4%
% Change
2017/18 to
Date
Staff Group
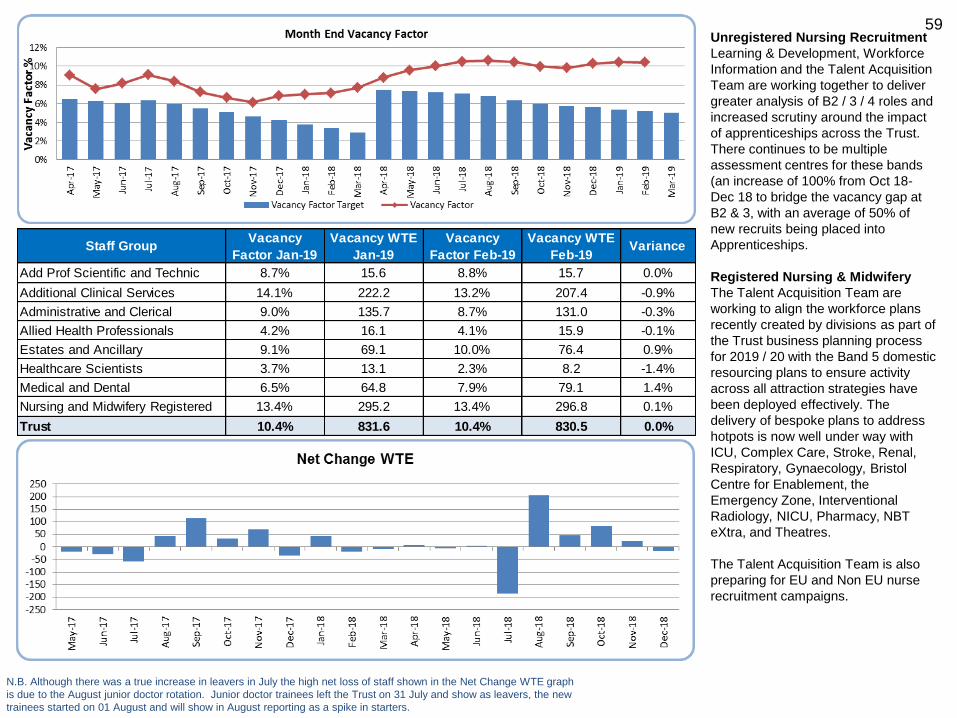
59 Unregistered Nursing Recruitment
Learning & Development, Workforce
Information and the Talent Acquisition
Team are working together to deliver
greater analysis of B2 / 3 / 4 roles and
increased scrutiny around the impact
of apprenticeships across the Trust.
There continues to be multiple
assessment centres for these bands
(an increase of 100% from Oct 18-
Dec 18 to bridge the vacancy gap at
B2 & 3, with an average of 50% of
new recruits being placed into
Apprenticeships.
Registered Nursing & Midwifery
The Talent Acquisition Team are
working to align the workforce plans
recently created by divisions as part of
the Trust business planning process
for 2019 / 20 with the Band 5 domestic
resourcing plans to ensure activity
across all attraction strategies have
been deployed effectively. The
delivery of bespoke plans to address
hotpots is now well under way with
ICU, Complex Care, Stroke, Renal,
Respiratory, Gynaecology, Bristol
Centre for Enablement, the
Emergency Zone, Interventional
Radiology, NICU, Pharmacy, NBT
eXtra, and Theatres.
The Talent Acquisition Team is also
preparing for EU and Non EU nurse
recruitment campaigns.
N.B. Although there was a true increase in leavers in July the high net loss of staff shown in the Net Change WTE graph
is due to the August junior doctor rotation. Junior doctor trainees left the Trust on 31 July and show as leavers, the new
trainees started on 01 August and will show in August reporting as a spike in starters.
Staff GroupVacancy
Factor Jan-19
Vacancy WTE
Jan-19
Vacancy
Factor Feb-19
Vacancy WTE
Feb-19Variance
Add Prof Scientific and Technic 8.7% 15.6 8.8% 15.7 0.0%
Additional Clinical Services 14.1% 222.2 13.2% 207.4 -0.9%
Administrative and Clerical 9.0% 135.7 8.7% 131.0 -0.3%
Allied Health Professionals 4.2% 16.1 4.1% 15.9 -0.1%
Estates and Ancillary 9.1% 69.1 10.0% 76.4 0.9%
Healthcare Scientists 3.7% 13.1 2.3% 8.2 -1.4%
Medical and Dental 6.5% 64.8 7.9% 79.1 1.4%
Nursing and Midwifery Registered 13.4% 295.2 13.4% 296.8 0.1%
Trust 10.4% 831.6 10.4% 830.5 0.0%

60 People and Transformation team
actions to support retention and
include:
• A successful pilot of a revised exit
questionnaire has occurred in ICU
with 100% of new leavers
completing a much simpler and
easier to access electronic
questionnaire via a QR code.
This is now being rolled out to
turnover hot spot areas in all
clinical divisions, with the aim of
improving response rate and
intelligence around why staff are
leaving;
• A new Intranet page is being
developed on the HR Portal,
aimed at staff thinking of leaving
NBT and guiding them to consider
options other than resignation
(e.g. accessing careers advice,
Itchy Feet call, discussion with
line manager, internal transfer).
This page will be launched and
promoted widely in early April
• Drop-ins for EU staff continuing
weekly.
Staff GroupTurnover
Jan-19
Leavers
WTE
Jan-19
Turnover
Feb-19
Leavers
WTE
Feb-19
Variance
Add Prof Scientific and Technic 1.92% 4.3 0.45% 1.0 -1.47%
Additional Clinical Services 2.02% 27.9 1.14% 15.9 -0.88%
Administrative and Clerical 1.17% 16.2 1.46% 20.2 0.29%
Allied Health Professionals 0.52% 2.0 0.39% 1.6 -0.12%
Estates and Ancillary 0.92% 6.4 0.76% 5.3 -0.15%
Healthcare Scientists 0.77% 2.7 0.71% 2.5 -0.06%
Medical and Dental 0.66% 3.0 0.66% 3.0 0.00%
Nursing and Midwifery Registered 1.27% 24.8 1.40% 27.2 0.12%
Trust 1.28% 87.2 1.12% 76.6 -0.16%
December 2018 Benchmarking
Data (based on Headcount)NBT UHB
Model
Hospital
Peers Mean
National
Acute Large
and Teaching
Mean
Rolling 12 Month Turnover 16.6% 15.7% 13.6% 13.8%

61
People and Transformation team
actions to support staff health and
wellbeing include :
• The next P&T webinar on 27th March
will focus on supporting staff with a
critical illness;
• A new workshop has been developed:
undertaking effective return to work and
stage 1 sickness meetings – to be
rolled out to Band 6 nurses as a priority
staff group;
• Joint project underway with the Well-
being team, looking at themes or trends
around stress and anxiety. This will
consider whether there are any
additional measures or steps that could
be taken to reduce the risk of this
occurring in the lead up to the absence
or help facilitate the return to work;
• New ‘Adjustment Passport’ for disabled
staff planned to go to JCNC later this
month.
N.B. Due variance in calculation method the in month sickness absence for NBT in the
comparator may differ slightly from what is internally reported.
November 2018 Benchmarking Data NBT UHB
Model
Hospital
Peers Mean
National
Acute Large
and Teaching
Mean
Rolling 12 Month Absence 4.4% 4.2% 4.4% 4.4%

62
In Month Sickness Absence by Staff Group
Staff Group Variance Dec-18 Jan-19
Add Prof Scientific and Technic 1.03% 2.53% 3.56%
Additional Clinical Services 0.10% 6.61% 6.71%
Administrative and Clerical 1.22% 4.04% 5.26%
Allied Health Professionals 0.10% 2.61% 2.71%
Estates and Ancillary 0.36% 6.36% 6.73%
Healthcare Scientists 0.63% 2.62% 3.25%
Nursing and Midwifery Registered 0.43% 4.92% 5.35%
Medical and Dental 0.10% 1.23% 1.33%
Trust 0.48% 4.44% 4.93%
Rolling 12 Month Sickness Absence Dec-18 Jan-19 Variance
Total Absence 4.2% 4.2% 0.0%
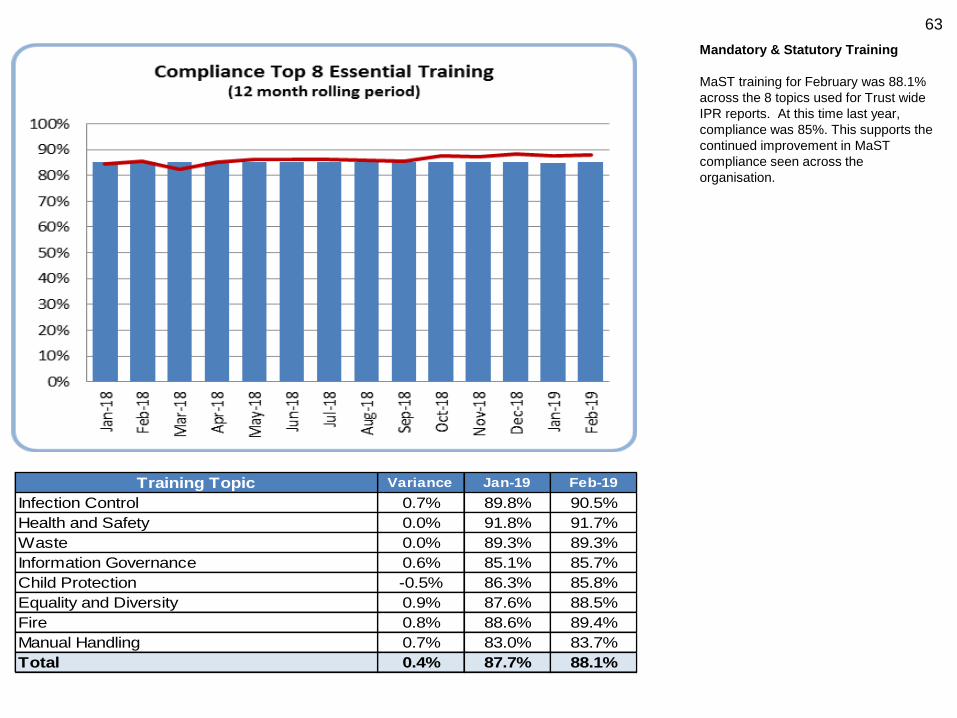
63
Mandatory & Statutory Training
MaST training for February was 88.1%
across the 8 topics used for Trust wide
IPR reports. At this time last year,
compliance was 85%. This supports the
continued improvement in MaST
compliance seen across the
organisation.
Training Topic Variance Jan-19 Feb-19
Infection Control 0.7% 89.8% 90.5%
Health and Safety 0.0% 91.8% 91.7%
Waste 0.0% 89.3% 89.3%
Information Governance 0.6% 85.1% 85.7%
Child Protection -0.5% 86.3% 85.8%
Equality and Diversity 0.9% 87.6% 88.5%
Fire 0.8% 88.6% 89.4%
Manual Handling 0.7% 83.0% 83.7%
Total 0.4% 87.7% 88.1%

64
Medical Appraisal
The current 6th appraisal and revalidation year will run until the 31st March 2019.
At the end of February 2019, 94% of the appraisals that should have been
completed are compliant.
The 6% with a missed appraisal are going through a missed appraisal process.
The Trusts missed appraisal escalation process includes a number of letters from
the Trusts appraiser leads, Deputy Medical Director and Responsible Officer.
Failure to engage beyond this point will lead to a non-engagement communication
from the GMC.
The doctors connected to the Trusts Designated Body for appraisals and
revalidation includes consultants, specialty doctors, associate specialists, clinical
fellows and trust locum doctors. The Trust also provides an appraisal service for
an additional 26 community paediatricians employed by Sirona and a further 11
doctors who have connections to other Designated Bodies. NBT will no longer
provide this service to Sirona after the 31st March 2019. Junior doctors in training
are revalidated by Health Education England.
The Trust has currently deferred 25% of all revalidation recommendations due over
the past 12 months. From March 2019, the GMC will be collecting further
information for the reasons of each deferral.
The PReP system remains the mandatory system for medical appraisals for all
non-training grade doctors employed by the Trust. The contract for PReP is in
place until the 31st March 2019. Following an in depth tender exercise in 2018, a
new supplier known as Fourteen Fish has been chosen to provide an alternative
appraisal and revalidation system to NBT from the 1st April 2019. This new system
has been procured alongside UHBristol and Weston Area Health NHS Trust. The
NBT revalidation support team are working alongside the UHB team in order to roll
out the new system by the 1st April 2019.

65
Finance
Board Sponsor: Director of Finance
Catherine Phillips

66
Statement of Comprehensive Income
Assurances
The financial position at the end of February shows a deficit
of £19.9m, £2.5m adverse to the planned deficit.
The position includes the loss of £2.6m of Provider
Sustainability Funding (PSF) to reflect below target A&E
performance since Qtr 2.
The Trust’s position against the NHSI control total is
measured excluding PSF, and is therefore £0.1m favourable
to plan.
Key Issues
• Contract income is £8.3m favourable with Non elective
over performance offsetting elective under performance.
• Pay is £8m adverse to plan on Nursing and Medical staff.
• The forecast outturn shows a small remaining risk to
delivery of the Trust’s control total and is currently £0.3m
adverse. However, the Trust is forecast to achieve the
control total at the end of March.
Prior year
actual to 28
February 2018 18.19 Plan Actual
Variance
(Adverse) /
Favourable
Forecast
Outturn
£m £m £m £m £m
Income
433.8 Contract Income 445.0 453.3 8.3 494.4
71.3 Other Operating Income 75.7 75.2 (0.5) 83.3
0.9 Donations income for capital acquisitions 0.0 0.1 0.1 0.2
506.0 Total Income 520.7 528.6 7.9 577.9
Expenditure
(309.4) Pay (317.8) (325.8) (8.0) (355.2)
(165.6) Non Pay (171.5) (172.5) (1.0) (189.5)
(5.3) PFI Operating Costs (5.7) (5.5) 0.2 (6.1)
(480.3) (495.0) (503.8) (8.8) (550.8)
25.7 Earnings before Interest & Depreciation 25.7 24.8 (0.9) 27.1
5.6% 4.7%
(21.2) Depreciation & Amortisation (21.0) (20.9) 0.1 (23.1)
(30.8) PFI Interest (31.8) (31.5) 0.3 (34.3)
0.0 Interest receivable 0.0 0.1 0.1 0.1
(5.1) Interest payable (4.6) (4.7) (0.1) (5.1)
0.0 PDC Dividend 0.0 0.0 0.0 0.0
0.0 Other Financing costs 0.0 0.0 0.0 0.0
0.0 Impairment 0.0 0.0 0.0 0.0
(31.4) Operational Retained Surplus / (Deficit) (31.7) (32.2) (0.5) (35.3)
(6.3%) (6.1%)
Add back items excluded for NHS
accountability
(0.9) Donations income for capital acquisitions 0.0 (0.1) (0.1) (0.2)
0.8 Depreciation of donated assets 0.0 0.7 0.7 0.6
0.0 Impairment 0.0 0.0 0.0 0.0
(31.5)Adjusted surplus /(deficit) for NHS
accountability (excl PSF)(31.7) (31.6) 0.1 (34.9)
8.7 PSF 14.3 11.7 (2.6) 9.1
(22.8)Adjusted surplus /(deficit) for NHS
accountability (incl PSF)(17.4) (19.9) (2.5) (25.8)
Note: The forecast PSF figure does not assume the receipt of any PSF (Finance or A&E performance) in Q4. However the ledger position
includes the receipt of Finance PSF as the in-month control total was met.
Position as at 28 February 2019

67
Statement of Financial Position Assurances The Trust received new loan financing in February of £2.6m. This brings total borrowing from the Department of Health and Social Care to £175.7m. The Trust ended the month with cash of £7.1m, compared with a plan of £15.0m. Concerns & Gaps The level of payables is reflected in the Better Payment Practice Code (BPPC) performance for the year which is 74% by volume of payments made within 30 days against the target of 95%.
Actions Planned
The focus continues to be on maintaining
payments to key suppliers, reducing the
level of debts and ensuring cash financing
is available.
31 March
2018 £m
Statement of Financial Position as at
28th February 2019
Plan
£m
Actual
£m
Variance
above /
(below) plan
£m
Non Current Assets
517.7 Property, Plant and Equipment 517.1 512.3 (4.7)
17.3 Intangible Assets 14.7 17.8 3.1
14.0 Non-current receivables 14.0 8.5 (5.5)
549.0 Total non-current assets 545.8 538.6 (7.2)
Current Assets
11.2 Inventories 11.2 12.7 1.5
35.5 Trade and other receivables NHS 26.5 24.5 (2.0)
22.4 Trade and other receivables Non-NHS 22.4 38.1 15.7
17.0 Cash and Cash equivalents 15.0 7.1 (7.9)
86.1 Total current assets 75.1 82.5 7.3
0.0 Non-current assets held for sale 0.0 0.0 0.0
635.1 Total assets 620.9 621.1 0.2
Current Liabilities (< 1 Year)
9.4 Trade and Other payables - NHS 9.4 8.2 (1.2)
71.5 Trade and Other payables - Non-NHS 69.0 67.8 (1.2)
40.1 Borrowings 39.9 61.6 21.8
121.0 Total current liabilities 118.3 137.6 19.3
(34.9) Net current assets/(liabilities) (43.1) (55.1) (12.0)
514.1 Total assets less current liabilites 502.7 483.5 19.1
9.2 Trade payables and deferred income 8.8 8.1 (0.7)
531.4 Borrowings 537.7 521.5 (16.1)
(26.4) Total Net Assets (43.8) (46.2) (2.3)
Capital and Reserves
242.5 Public Dividend Capital 242.5 243.3 0.8
(359.8) Income and expenditure reserve (375.2) (375.2) (0.0)
(15.5)Income and expenditure account - current
year(17.4) (20.5) (3.1)
106.3 Revaluation reserve 106.3 106.3 0.0
(26.4) Total Capital and Reserves (43.8) (46.2) (2.3)
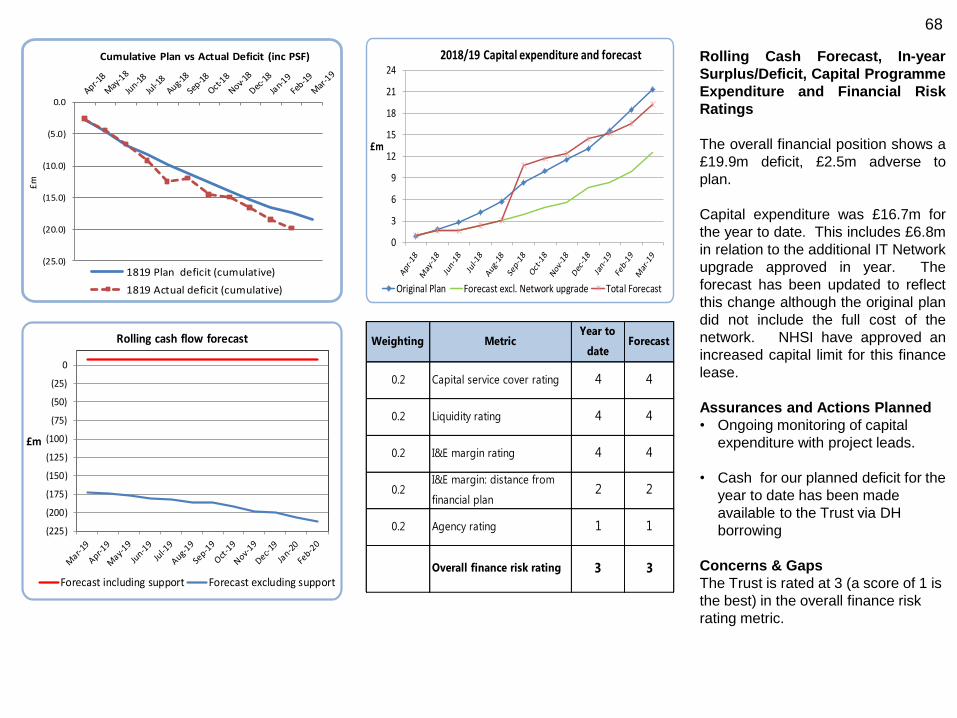
68
Rolling Cash Forecast, In-year
Surplus/Deficit, Capital Programme
Expenditure and Financial Risk
Ratings
The overall financial position shows a
£19.9m deficit, £2.5m adverse to
plan.
Capital expenditure was £16.7m for
the year to date. This includes £6.8m
in relation to the additional IT Network
upgrade approved in year. The
forecast has been updated to reflect
this change although the original plan
did not include the full cost of the
network. NHSI have approved an
increased capital limit for this finance
lease.
Assurances and Actions Planned
• Ongoing monitoring of capital
expenditure with project leads.
• Cash for our planned deficit for the
year to date has been made
available to the Trust via DH
borrowing
Concerns & Gaps
The Trust is rated at 3 (a score of 1 is
the best) in the overall finance risk
rating metric.
Weighting MetricYear to
dateForecast
0.2 Capital service cover rating 4 4
0.2 Liquidity rating 4 4
0.2 I&E margin rating 4 4
0.2I&E margin: distance from
financial plan2 2
0.2 Agency rating 1 1
Overall finance risk rating 3 3
(225)
(200)
(175)
(150)
(125)
(100)
(75)
(50)
(25)
0
£m
Rolling cash flow forecast
Forecast including support Forecast excluding support
0
3
6
9
12
15
18
21
24
£m
2018/19 Capital expenditure and forecast
Original Plan Forecast excl. Network upgrade Total Forecast
(25.0)
(20.0)
(15.0)
(10.0)
(5.0)
0.0
£m
Cumulative Plan vs Actual Deficit (inc PSF)
1819 Plan deficit (cumulative)
1819 Actual deficit (cumulative)

69
Savings
Assurances
The savings target for 2018/19 is £34.7m
(£37.7m recurrently) against which £27.2m has
been identified at the end of February.
Concerns & Gaps
The graph shows the phased forecast in-year
delivery totaling £27.2m of which £27m is rated
as green or amber. This is below the required
level for the year by £7.5m.
Savings delivery is £20m as at the end of
February, £10.6m adverse to plan.
Actions Planned
Continued monitoring of actions required to
deliver required savings in 2018/19.
70
Regulatory
Board Sponsor: Chief Executive
Andrea Young
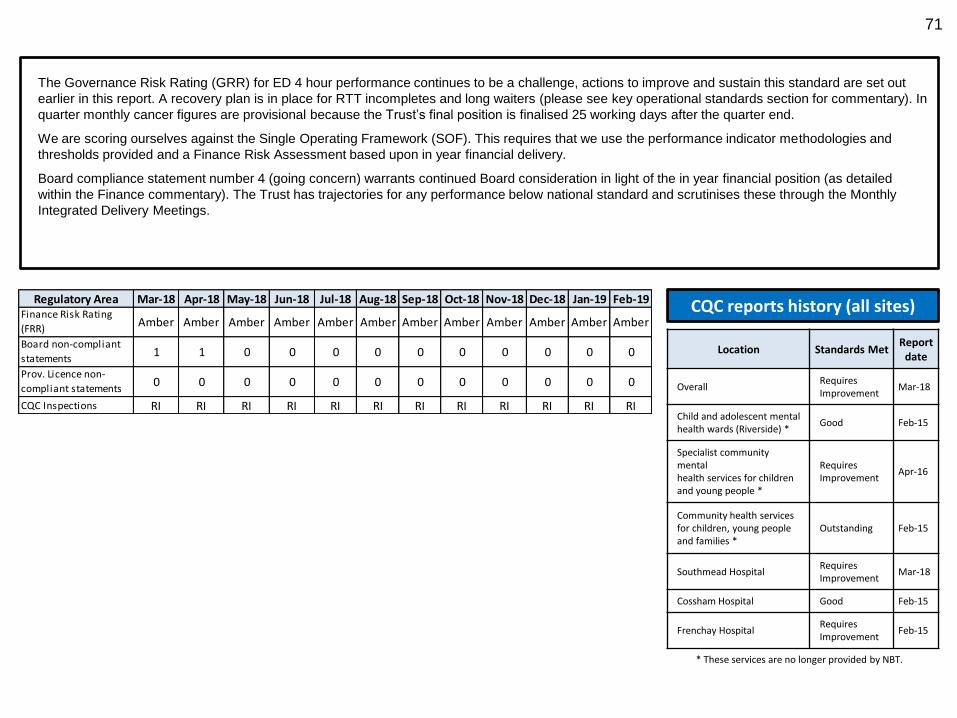
71
The Governance Risk Rating (GRR) for ED 4 hour performance continues to be a challenge, actions to improve and sustain this standard are set out
earlier in this report. A recovery plan is in place for RTT incompletes and long waiters (please see key operational standards section for commentary). In
quarter monthly cancer figures are provisional because the Trust’s final position is finalised 25 working days after the quarter end.
We are scoring ourselves against the Single Operating Framework (SOF). This requires that we use the performance indicator methodologies and
thresholds provided and a Finance Risk Assessment based upon in year financial delivery.
Board compliance statement number 4 (going concern) warrants continued Board consideration in light of the in year financial position (as detailed
within the Finance commentary). The Trust has trajectories for any performance below national standard and scrutinises these through the Monthly
Integrated Delivery Meetings.
CQC reports history (all sites)
* These services are no longer provided by NBT.
Location Standards Met Report
date
Overall Requires Improvement
Mar-18
Child and adolescent mental health wards (Riverside) *
Good Feb-15
Specialist community mental health services for children and young people *
Requires Improvement
Apr-16
Community health services for children, young people and families *
Outstanding Feb-15
Southmead Hospital Requires Improvement
Mar-18
Cossham Hospital Good Feb-15
Frenchay Hospital Requires Improvement
Feb-15
Regulatory Area Mar-18 Apr-18 May-18 Jun-18 Jul-18 Aug-18 Sep-18 Oct-18 Nov-18 Dec-18 Jan-19 Feb-19Finance Risk Rating
(FRR)Amber Amber Amber Amber Amber Amber Amber Amber Amber Amber Amber Amber
Board non-compliant
statements1 1 0 0 0 0 0 0 0 0 0 0
Prov. Licence non-
compliant statements0 0 0 0 0 0 0 0 0 0 0 0
CQC Inspections RI RI RI RI RI RI RI RI RI RI RI RI
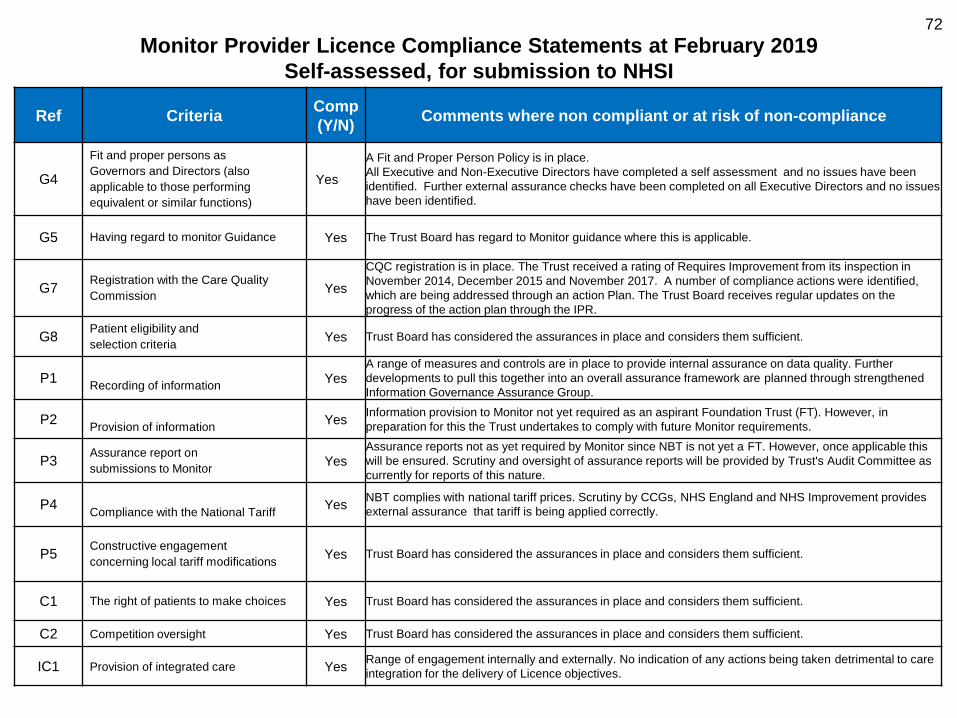
72
Monitor Provider Licence Compliance Statements at February 2019
Self-assessed, for submission to NHSI
Ref Criteria Comp
(Y/N) Comments where non compliant or at risk of non-compliance
G4
Fit and proper persons as
Governors and Directors (also
applicable to those performing
equivalent or similar functions)
Yes
A Fit and Proper Person Policy is in place.
All Executive and Non-Executive Directors have completed a self assessment and no issues have been
identified. Further external assurance checks have been completed on all Executive Directors and no issues
have been identified.
G5 Having regard to monitor Guidance Yes The Trust Board has regard to Monitor guidance where this is applicable.
G7 Registration with the Care Quality
Commission Yes
CQC registration is in place. The Trust received a rating of Requires Improvement from its inspection in
November 2014, December 2015 and November 2017. A number of compliance actions were identified,
which are being addressed through an action Plan. The Trust Board receives regular updates on the
progress of the action plan through the IPR.
G8 Patient eligibility and
selection criteria Yes Trust Board has considered the assurances in place and considers them sufficient.
P1
Recording of information Yes
A range of measures and controls are in place to provide internal assurance on data quality. Further
developments to pull this together into an overall assurance framework are planned through strengthened
Information Governance Assurance Group.
P2
Provision of information Yes
Information provision to Monitor not yet required as an aspirant Foundation Trust (FT). However, in
preparation for this the Trust undertakes to comply with future Monitor requirements.
P3 Assurance report on
submissions to Monitor Yes
Assurance reports not as yet required by Monitor since NBT is not yet a FT. However, once applicable this
will be ensured. Scrutiny and oversight of assurance reports will be provided by Trust's Audit Committee as
currently for reports of this nature.
P4
Compliance with the National Tariff Yes
NBT complies with national tariff prices. Scrutiny by CCGs, NHS England and NHS Improvement provides
external assurance that tariff is being applied correctly.
P5 Constructive engagement
concerning local tariff modifications Yes Trust Board has considered the assurances in place and considers them sufficient.
C1 The right of patients to make choices Yes Trust Board has considered the assurances in place and considers them sufficient.
C2 Competition oversight Yes Trust Board has considered the assurances in place and considers them sufficient.
IC1 Provision of integrated care Yes Range of engagement internally and externally. No indication of any actions being taken detrimental to care
integration for the delivery of Licence objectives.
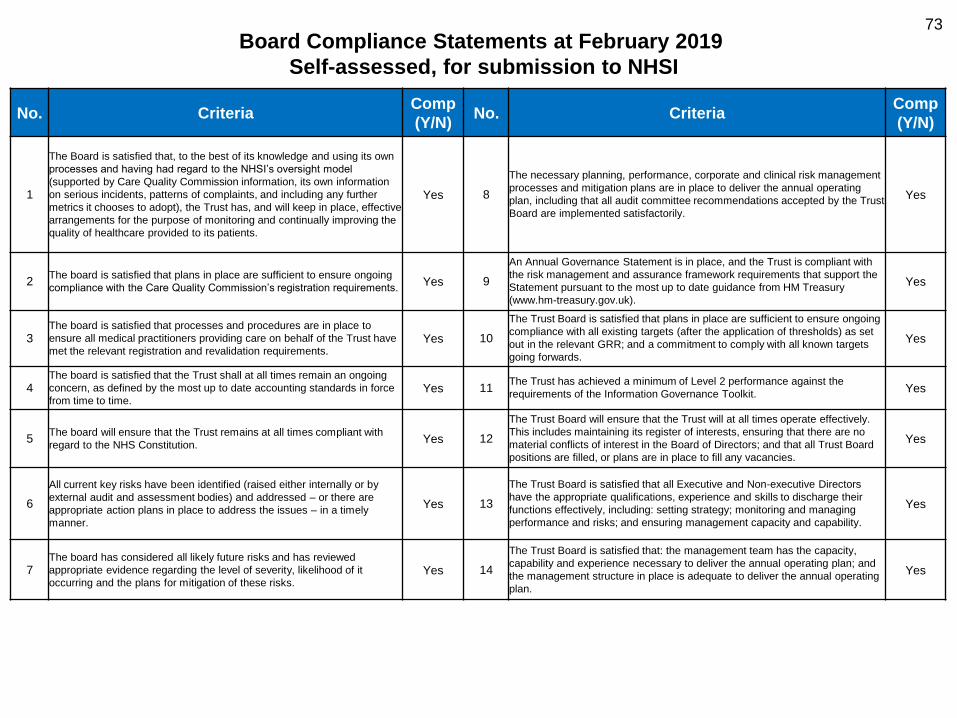
73
Board Compliance Statements at February 2019
Self-assessed, for submission to NHSI
No. Criteria
Comp
(Y/N) No. Criteria
Comp
(Y/N)
1
The Board is satisfied that, to the best of its knowledge and using its own
processes and having had regard to the NHSI’s oversight model
(supported by Care Quality Commission information, its own information
on serious incidents, patterns of complaints, and including any further
metrics it chooses to adopt), the Trust has, and will keep in place, effective
arrangements for the purpose of monitoring and continually improving the
quality of healthcare provided to its patients.
Yes 8
The necessary planning, performance, corporate and clinical risk management
processes and mitigation plans are in place to deliver the annual operating
plan, including that all audit committee recommendations accepted by the Trust
Board are implemented satisfactorily.
Yes
2 The board is satisfied that plans in place are sufficient to ensure ongoing
compliance with the Care Quality Commission’s registration requirements. Yes 9
An Annual Governance Statement is in place, and the Trust is compliant with
the risk management and assurance framework requirements that support the
Statement pursuant to the most up to date guidance from HM Treasury
(www.hm-treasury.gov.uk).
Yes
3 The board is satisfied that processes and procedures are in place to
ensure all medical practitioners providing care on behalf of the Trust have
met the relevant registration and revalidation requirements. Yes 10
The Trust Board is satisfied that plans in place are sufficient to ensure ongoing
compliance with all existing targets (after the application of thresholds) as set
out in the relevant GRR; and a commitment to comply with all known targets
going forwards.
Yes
4 The board is satisfied that the Trust shall at all times remain an ongoing
concern, as defined by the most up to date accounting standards in force
from time to time. Yes 11
The Trust has achieved a minimum of Level 2 performance against the
requirements of the Information Governance Toolkit. Yes
5
The board will ensure that the Trust remains at all times compliant with
regard to the NHS Constitution.
Yes 12
The Trust Board will ensure that the Trust will at all times operate effectively.
This includes maintaining its register of interests, ensuring that there are no
material conflicts of interest in the Board of Directors; and that all Trust Board
positions are filled, or plans are in place to fill any vacancies.
Yes
6
All current key risks have been identified (raised either internally or by
external audit and assessment bodies) and addressed – or there are
appropriate action plans in place to address the issues – in a timely
manner.
Yes 13
The Trust Board is satisfied that all Executive and Non-executive Directors
have the appropriate qualifications, experience and skills to discharge their
functions effectively, including: setting strategy; monitoring and managing
performance and risks; and ensuring management capacity and capability.
Yes
7 The board has considered all likely future risks and has reviewed
appropriate evidence regarding the level of severity, likelihood of it
occurring and the plans for mitigation of these risks. Yes 14
The Trust Board is satisfied that: the management team has the capacity,
capability and experience necessary to deliver the annual operating plan; and
the management structure in place is adequate to deliver the annual operating
plan.
Yes