Inspection of raw materials and chemicals by using Raman ... · chemicals by using Raman...
59
Inspection of raw materials and chemicals by using Raman Spectroscopy October, 2013 Dr Enrique Lozano Sales Director MMS E&A
Transcript of Inspection of raw materials and chemicals by using Raman ... · chemicals by using Raman...
Inspection of raw materials and
chemicals by using Raman
Spectroscopy
October, 2013
Dr Enrique Lozano
Sales Director MMS E&A

Incremental Regulatory Control for Incoming Material
Identification. Regulated markets (pharma, vet, nutr…) •PIC/S recommendations on complete
traceability of incoming materials
•GMP is expanding to new products
Global Supply Chain
•Companies are moving toward a more
delocalized supply chain
•Problems associated with supplier quality
assurance and transportation
Quality Assurance and Cost Reduction
•Increase analytical capabilities
•Reduce operational cost
•Optimize operational efficiencies
Industry Trends and Requirements

Ideal Requirements (5S+C Rules):
Sensitive – capable of detection of deviations How Much?
And….Cheap to implement!
Selective – many peaks/bands, minimal outside
interference
How Far?
Simple – used by spectroscopists and non-specialist
operators
How Low?
Stable – results must be homogenous through samples,
time or environment
How Many?
Specific – designed for or customizable to target
environment
How
Specific?
www.bwtek.com 3

Technology can help
Spectroscopy
Raman
16/Oct/2013 www.bwtek.com 4

What is Raman Spectroscopy ? • Molecular spectroscopy that can be used to provide a
“fingerprint” of a compound based on the chemical bonds
• Based on inelastically scattered light from a molecule
• Not for trace level detection (~ <1%)
• Advantages:
– Can perform analysis directly through transparent
containers
– Samples can be solids, liquid, slurries
– Applicable for both qualitative and quantitative analysis
– Little to no sample preparation required
– Insensitive to aqueous absorption bands
– Doesn’t require large sample volume
– Highly selective
– Fast analysis times
www.bwtek.com 5 Copyright @ B&W TEK
Reproduced from the website of Dr. David Rankin, Univ. of Edinburgh.
Used with permission.

www.bwtek.com 6 Copyright @ B&W TEK

Before introducing handheld Raman in
incoming materials at the warehouse
After introducing handheld Raman
What Are companies and Gov. institutions
Looking For? Compliance with company production
and profitability targets
Compliance with regulations
Optimization of resources
Team development and productivity
Simplification of operating procedures
Full operations traceability
Safety and security © image. Source Web
www.bwtek.com 7

Raman Spectra Raman Shift
Independent of laser output
Excitation wavelength is determined by
analytical and sample needs (avoid
fluorescence interference with longer
wavelength)
Raman Intensity
Depends on laser wavelength
The longer the excitation wavelength the
lower Raman peak counts (at same
power output)
www.bwtek.com 8 Copyright @ B&W TEK

Towards 100% Material
Inspection
Why do we benefits of Identity Testing?
But, keep in mind, Raman isn’t magic, and it has its limitations!
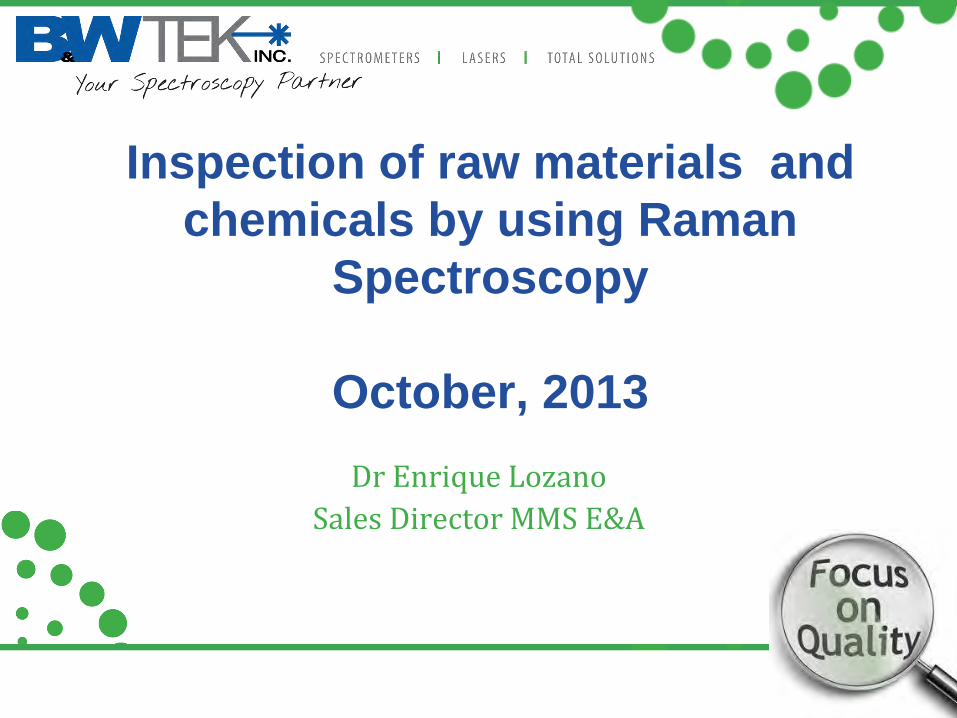
Benefits of Handheld Raman for
ID • Reduced material movement – directly implement in warehouse,
loading dock
• Easy and simple operations- simple training & improved resource
usage
• Reduce chemical exposure – scan through packaging materials &
maximize personnel safety
• Fewer lab delays reduce cycle time – on-time production & higher
throughput; reduce material quarantine time and stocks
• Free up laboratory resources – increases lab capacity
• Reduced transcription – fewer errors; lower personnel and
equipment overhead; control costs
Copyright @ B&W TEK

NanoRam Handheld Innovations
11 www.bwtek.com Copyright @ B&W TEK
• Only handheld with high
resolution touch screen interface
• Only handheld offering easy data
management and reporting
• Best methodologies for robust
analysis
• Fastest in adding Methods and
Libraries
• Only handheld allowing editing
Method
• Full method development and
validation support

Issues and Customer Concerns • Can Raman help my project?
• What are the differences between Raman and other spectroscopy
techniques like NIR?
• Should I really perform 100% container ID test? What are my
options?
• Do I need to validate the Raman method? If yes, what are the
requirements for method validation?
• What is next after the Raman ID becomes a routine method?
• Do I need to know the filing expectations from regulatory agencies,
do they apply to me? (JP/EMA/FDA..)
• Can vendors provide GMP support & related documents?
12

Raman can measure through
packaging: broad class Bottles Manufacturer Thickness
Amber Glass VWR 3 mm
Clear Glass (A) I-Chem 2 mm
Clear Glass (B) VWR 2 mm
High Density
Polyethylene
(HDPE)
VWR 1 mm
Teflon FEP Nalgene 1 mm
Polystyrene Uline 1 mm
Vials
Amber Glass Kimball 1 mm
Clear Glass Kimball 1 mm
Bags
Polypropylene
(PP) Uline 2 mil
Low-Density
Polyethylene
(LDPE)
VWR 2 mil

Some Raman Applications In Use
TODAY • ID
– Identification of raw materials (building up an extensive library of Raman spectra); This is
the application for NanoRam
• Quantitative analysis (iRaman products)
– Quantitative determination of substances in different formulations;
• Polymorphism (iRaman products)
– Supporting polymorphic screenings (polymorphs have different solubility rates, thereby
impacting the effective dosing);
• Process (PAT) (iRaman and MiniRam products)
– Supporting chemical development process scale-up (as process steps are modified and
refined to ascertain whether the desired chemical is being produced or not, and the rate at
which it is formed).
• Identification of unknowns (iRaman and nanoram) – Forensics, military, police, art conservation
• Material characterization (iRaman products) – Define characteristics of materials
– Unique fingerprint

Portable Raman Instruments
Units in each market are designed with key features and
characteristics to address specific needs within the
market.
Some common considerations are:
• High resolution requires a larger footprint
• Handheld instruments require fast on-board
analysis
• Portable instruments require highly
flexible sampling capabilities
www.bwtek.com

16
The Measurement Challenges-
Measure Through Plastic Packaging Implementation advantages of spectroscopic methods
• No cross-contamination (the material inside the bag)
• Safe and easy to implement
• Can be implemented in warehouse, docking area or lab
But…Challenges exist if using e.g. NIR technique
• Spectral profiles include packaging absorptions
• Packaging interferences may reduce the specificity of the method when
identify similar materials
• The library requires assessment or change if the bag changes, i.e., not
suitable for multiple suppliers of same materials
• Packaging could have multiple layers, with different colors or materials

17
No PE bag (pure sample) .4
.6
.8
1
1.2
1.4
1.6
1.8
8500 8000 7500 7000 6500 6000 5500 5000 4500
.4
.6
.8
1
1.2
1.4
1.6
1.8
8500 8000 7500 7000 6500 6000 5500 5000 4500
Wavenumber (cm-1)
Two layer PE bag One layer PE bag
NIR Spectra of material –with plastic bag
Required to evaluate the method specificity in the presence of bag!
NIR Spectra of caffeine (Plastic bag
contribution)

18
Raman Spectra of caffeine (Plastic bag
effect)
0 200 400 600 800 1000 1200 1400 1600 1800 2000 2200 2400
0
900
1800
2700
3600
4500
5400
6300
7200
8100
9000
9900
Raman shift [cm-1]
Inte
nsity No bag
One layer bag
Two layer bag
No significant spectral absorption from PE bag

Raman has greater specificity than
NIR
16/Oct/2013 www.bwtek.com 19

20
Spectroscopic-based Identity
Method
Sample analysis
1. Access Method 2. Scan sample 3. Identify Material
Operators

Tools for different verification modes
of materials.
• Identification vs. defined method
with p-value (significance level)
• Investigation for unknown
samples: HQI
• In general, we recommend the use of p-value
for ID (identification mode).
• The HQI (Investigation mode) may be
considered an additional tool for validation.

Uses statistics, it is used for example to
verify that paracetamol is paracetamol,
independently of the supplier, container or
grades. That variation must be included in
the population of the method.
Uses HQI to recognize which e.g. supplier
of paracetamol is. Here each supplier,
container or grade may have a different
signature. Requires to setup the libraries.
Investigation vs identification on the nanoram

Validation and/or identification by
correlation with a reference, HQI
results: from 0% (no relation) to
100% (perfect match)

What HQI means?
HQI is the spectral correlation coefficient, i.e. a
normalized measure of spectral covariance
Nobel prices/country/population vs. amount of
chocolate/person. Correlation does not imply causation.
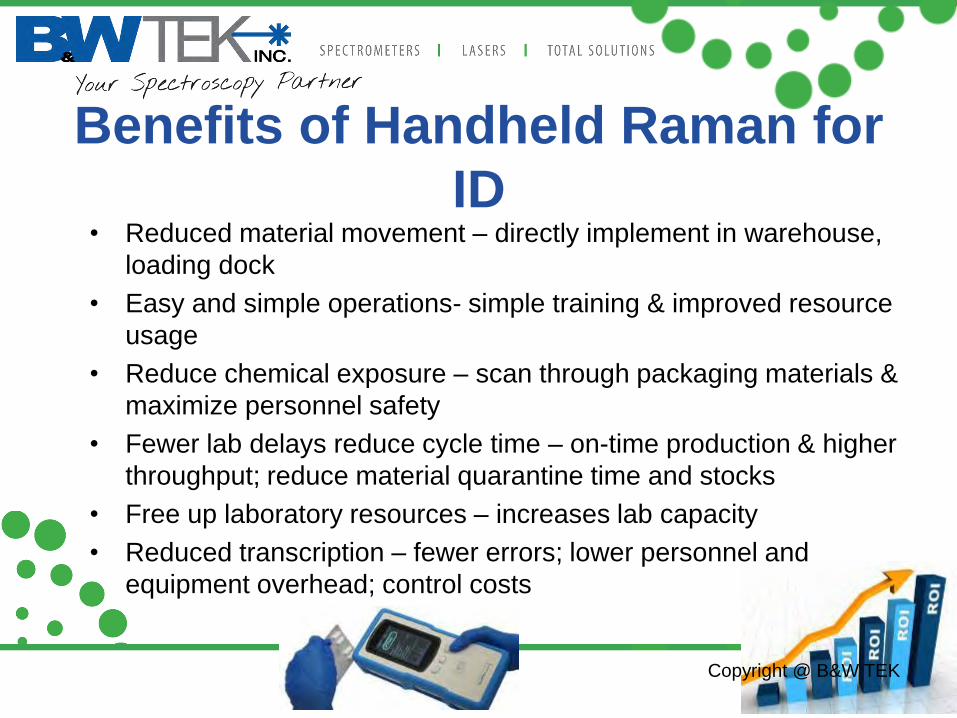
When running IDENTIFICATION
and fails, I have some potential
hits, what is this?
If an identification fails, the system
will automatically run an
investigation of potential matches.

Spectroscopic-based Identity Test • The methods/libraries must be developed and can then
be run on routine basis
26
2. Threshold p-value 0.05
based on PCA of 20 spectra
500060007000800090001000011000
0.2
0.3
0.4
0.5
0.6
0.7
0.8
0.9
Absorb
ance
Units
Method development
1. Measure 3-10 Batches;
NanoRam uses 20 spectra
500060007000800090001000011000
Wavenumber cm-1
0.2
0.3
0.4
0.5
0.6
0.7
0.8
0.9
Absorb
ance U
nits
3. Build & Test Method
•
•
• • •
•
• • •
• • • • •
•
• • • •
• • • •
•
• •
•
•
•
•
• •
•
•
•
Well-trained analysts

27
Powerful Spectroscopy!!!
HQI 100% correlation HQI 99% correlation
Reference in library: Calcium Stearate
Capable to differentiate the smallest changes!!!

28
Samples were analyzed on glass vials to reduce container interference.
The system is powerful enough to identify the small differences on the structure introduced by the
counter ion.
100% correlation with
reference on library
99% correlation with reference
on library

29
Unit A Manitol PVC
Repetition1 99 97
Repetition2 99 97
Repetition3 99 97
Repetition4 99 97
Repetition5 99 97
Unit B
Glutamic acid L-Alanyl-L-
Glutamine
Tryptophan Threonine
Repetition1 99 99 97 97
Repetition2 99 100 98 96
Repetition3 99 100 99 97
Repetition4 99 100 95 97
Repetition5 99 100 99 98
Best-of-kind Data reproducibility Glutamic acid
L-Alanyl-L-Glutamine
Tryptophan
Threonine
PVC
Manitol
Level of HQI can be increased to 100% adjusting the acquisition parameters

30
Unit C Olive Oil
(search
range 175-
2500)
Olive Oil
(search
range 175-
1900)
Repetition1 99 100
Repetition2 99 100
Repetition3 99 100
Repetition4 99 100
Repetition5 99 100
Best-of-kind Data reproducibility

Proximity Matrix
Provides an
overview to
illustrate which
chemicals may
produce:
• False Positive
• False Negative
• good signal
• bad signal…
www.bwtek.com
Proximity Matrix: Testing of all the materials in Identification Mode
using specific methods generated by each of the reference materials
Method
Materials
Method A Method B Method C Method D Method
E
Material A
PASS
Fail
Fail
Fail
Fail
Material B
Fail
PASS
Fail
Fail
Fail
Material C
Fail
Fail
PASS
Fail
Fail
Material D
Fail
Fail
Fail
PASS
Fail
Material E
Fail
Fail
Fail
Fail
PASS
p-value
> 0.05
p-value
0.001 < 0.05
p-value
10-6 - < 10-3
p-value
10-15 - < 10-6
p-value
zero

Common Questions from
Customers…….
32

Q1: What is the difference between
ID and purity tests
“Identity” and “Purity” are two separate specifications. • “Purity” implies some type of quantitative method; typically HPLC
• “Purity” is a test for specific impurities such as low level contaminants/adulterants.
• An identity test says nothing about purity, strength, or composition.
• Usually gives “binary result”: Positive/Negative; Pass/Fail; Yes/No
• Identity verifies it is similar to what has been used in the past
Every proposed method should be validated if it is used for quality decision!

Q2: How long does it take to get a
Raman Method in place • Bottleneck:
– Document preparation & internal review
– Assembling samples
• Example: Develop an ID method for 10 materials:
– Training < 1 week
– Method development 1-2 weeks
– Specificity & robustness tests < 1 week
– Documentation (prepare, review & approve) 2-4 weeks
• The first ID method validation takes 4 - 6 weeks
• The next ID validation project takes only 1-2 weeks
B&W Tek can provide Support Services

Q3: How do traditional vs.
spectroscopic-based methods
compare? • In traditional methods often have a univariate calibration model
• Spectroscopic method based on chemometric modeling or statistical
calculations
– Identification/Qualitative
• Calculate spectral similarity between method and unknown samples
• Specificity test- interval validation evaluation focus on the model
correctness of spectral library
35
Note: Different terminology:
Calibration in chemometrics- method/model calibration
Calibration in GMP environment - e.g., instrument calibration

Raman has proven to be a promising tool to
increase operational capabilities and reduce
cost.
36
Summary

THANK YOU FOR YOUR
ATTENTION
Dr. Enrique Lozano
Sales Director E&A
www.bwtek.com
+447730871095
37

BACK UP SLIDES
38

Raman Related Documents (2) • ASTM E1840 - 96(2007) Standard Guide for Raman Shift Standards
for Spectrometer Calibration
• ASTM E1683 - 02(2007) Standard Practice for Testing the
Performance of Scanning Raman Spectrometers
• ASTM E2529 - 06 Standard Guide for Testing the Resolution of a
Raman Spectrometer
• US FDA Advancing Regulatory Science at FDA: A Strategic Plan
(August 2011): Section 2. Develop new analytical methods:
a) Investigate feasibility and value of using emerging and improved analytical
technologies like Nuclear Magnetic Resonance (NMR), mass spectrometry, or
near infrared or Raman spectroscopy for evaluating product quality of
pharmaceutical agents, and evaluate whether these technologies should
replace existing methods;

USP <1225>Validation of
Compendial Procedures

Regulatory Standards Compliance
• 21 CFR Part 11 Electronic Records; Electronic Signatures
• 21 CFR Part 1040.10 Laser and Laser Systems
• US Pharmacopeia <1120> Raman Spectroscopy
• European Pharmacopeia Ch.2.2.48 guidelines for Raman
Spectroscopy
• ASTM 1840-96(2007) Standard Guide for Raman Shift Standards
for Wavelength Calibration

Why do Raman ID methods fail? (1) • Failure to include lot-to-lot variability
• use numerous non-consecutive lots
• realize material potential variability (particle size, moisture, mechanics
etc.)
• Failure to understand the limitation of Raman
• fluorescence interference
• low Raman scattering signal (e.g., cellulose, salts, metals)
• low concentration (e.g., tablet API)
• Potentially close materials give ambiguous results (pass more
than one method)
• Adjust p-value to narrow acceptance range for material, and limit overlap
of methods

Why do Raman ID methods fail? (2)
• Occasional operational errors
• Sampling/scanning problem
• Quality of sample vials (sealed, glass etc.), plastic bags or
containers
• Method specific to particular sampling accessory and/or
packaging
• Limited knowledge or misuse of identity algorithms
• Performance/sensitivity of identification method (p-value is
based on a PCA model on the 20 scans in the method)

Deficiencies of Filed Spectroscopic
Methods (1) • Absence of instrument description
– Light source, design, detector, sampling module, software
package
• Minimal description of chemometric techniques
– Algorithms for pass/fail results
– Method validation
• Limited results for method validation
– Without acceptance criteria (ID thresholds)
– Detailed results (with predicted values, not just pass or fail)
– Inappropriate selection of negative control samples (material
structurally similar or closely related to the analyte)

Deficiencies of Filed Spectroscopic
Methods (2) • Inadequate SOPs and plan for change control
– Spectroscopic method performance verification?
– Spectroscopic method maintenance plan?
• Lack of information for library/method update plan
– SOPs for method/library update?

Raman Method Development • Raman bands are distinct and can be easily related to chemical structure
-very good for fingerprinting.
• Conduct a feasibility test:
– To ensure sufficient sensitivity for compounds to be included in the reference
library (very weak scatterers)
– Minimize fluorescence interference/impurities
– Laser powers and exposure times
• confirm that the sample is not being altered
– Sampling
• Appropriate sample accessory
• Collect valid representative samples
– Understand the sources of variations
• Glass vial and packaging materials’ variability
• Material lot-to-lot variability
• Supplier variations
– Need to evaluate the performance on testing numerous lots of material

Raman Method Development • Raman bands are distinct and can be easily related to chemical structure
-very good for fingerprinting.
• Raman spectral data collection
– Measure through containers and plastic bags with appropriate accessory;
contribution from the packaging components are usually very minor
– System automatically determines scan time to give sufficient Raman signal for each
sample
– Collect 20 scans for each method – best to use different lots
• Identification Method
– The method is based on the 20 scans of the material
– A multivariate model of the spectra (PCA) with Hotelling’sT2 limit determined (95%
confidence; p = 0.05)
– p-value used as Pass/Fail criterion

Validation
• Process of providing documented evidence that something does what it is intended to do
• Process, system, method
Qualification
• Inspection, testing and documentation review
• Is a part of the validation process which verifies module and system performance prior to being placed in routine use
• Equipment/instrument

Analytical Method Development Prerequisites for analytical method validation-Six “M”s
Quality of
the analytical
method
Man Machine
qualified
calibrated
robust
qualified
Methods
suitable
characterized
documented
Milieu Material Management
Quality
Qualified Material
Tempe-
rature
Analysts´
support
skilled
Humidity
Vibrations Time
Supplies
Irradi-
ation

Analytical Instrument Qualification
USP <1058> Analytical Instrument Qualification


DQ/IQ/OQ and PQ Documents for
NanoRam

Self check: by
performing calibration
validation using ASTM
1840 ref material:
Polystyrene
Calibration Validation:
part of the PQ
53

Method Development- Special
Considerations for Raman Technique
• Fluorescence interference/presence of
impurities
• Baseline shifts and background signal
• Laser power
• Confirm that the sample is not being
altered. We keep information on laser
power in the method.
• Sample-position sensitivity
• Use of appropriate sampling
accessory.

NanoRam: Operation Preset
www.bwtek.com 55 Copyright @ B&W TEK
• Managerial level access to
set Operation Preset
• ADMIN can also
– create user accounts:
Developer and Operator
level users
– Create calibration files

Selecting libraries to use in Investigation
• The libraries against which the
search and match is performed
can be modified.
• Multiple libraries can be selected.
• The Methods also can be
searched to establish a match of
materials using an HQI against
every Method.
www.bwtek.com 56 Copyright @ B&W TEK

NanoRam User Levels
57
User Type User Type
Symbol
User Privileges
Operator Select Method
Perform Material Identification
Select Operation Preset
Data Transfer
Developer All above, plus:
Create /Edit Method
Create/Modify Operation Preset
Create/Modify Data Library
Administrator All above, plus:
Manage User Accounts
Create calibration files
Device Manager Set system clock
Set password expiration
Create calibration file
Reset ADMIN password Copyright @ B&W TEK

User accounts
• ADMIN user can
create other accounts
• Three levels of users:
– Operator
– Developer
– Administrator
www.bwtek.com 58 Copyright @ B&W TEK

Analytical Method Validation
Do we need to perform method validation of
spectroscopic-based techniques ?