Input subsidies vs farm machinary
59
INPUT SUBSIDIES v/s FARM TECHNOLOGY which is more important for Indian Agriculture? Mohit Chauhan Dept. Of Agricultural Economics College Of Agriculture CCS Haryana Agricultural University [email protected] om 9802309547
-
Upload
mohit-chauhan -
Category
Education
-
view
62 -
download
2
Transcript of Input subsidies vs farm machinary

INPUT SUBSIDIES v/s
FARM TECHNOLOGYwhich is more important for Indian Agriculture?
Mohit ChauhanDept. Of Agricultural EconomicsCollege Of AgricultureCCS Haryana Agricultural [email protected] 9802309547

Outlines of Presentation
• Input Subsidies
• Farm Technology
• Effectiveness of both
• Conclusion
INPUT SUBSIDIES

A subsidy, often viewed as the converse of a tax, is an instrument of fiscal policy.
Derived from the Latin word “subsidium”: coming to assistance from behind.
An agricultural subsidy is a governmental financial support paid to farmers and agribusinesses: To supplement their income, Manage the supply of agricultural commodities, Influence the cost and supply of commodities.

Types of Subsidies
On the basis of transmission:• Direct: Subsidies given directly in form of cash grants, interest free loans.• Indirect: Subsidies given indirectly e.g. tax breaks, insurance and low
interest loans etc.
On the basis of nature of support:• Cash: Benefit given by the government to groups or individuals in form of
cash payment or tax reduction.• Kind: Subsidies given in- kind forms e.g. inputs or raw materials.
On the basis of target:• General: Support extended to all economic sectors without discrimination
such as food and fuel subsidies.• Particular: Support extended to a particular economic sector (Institution or
individuals) with the aim of promoting economic and social policy.
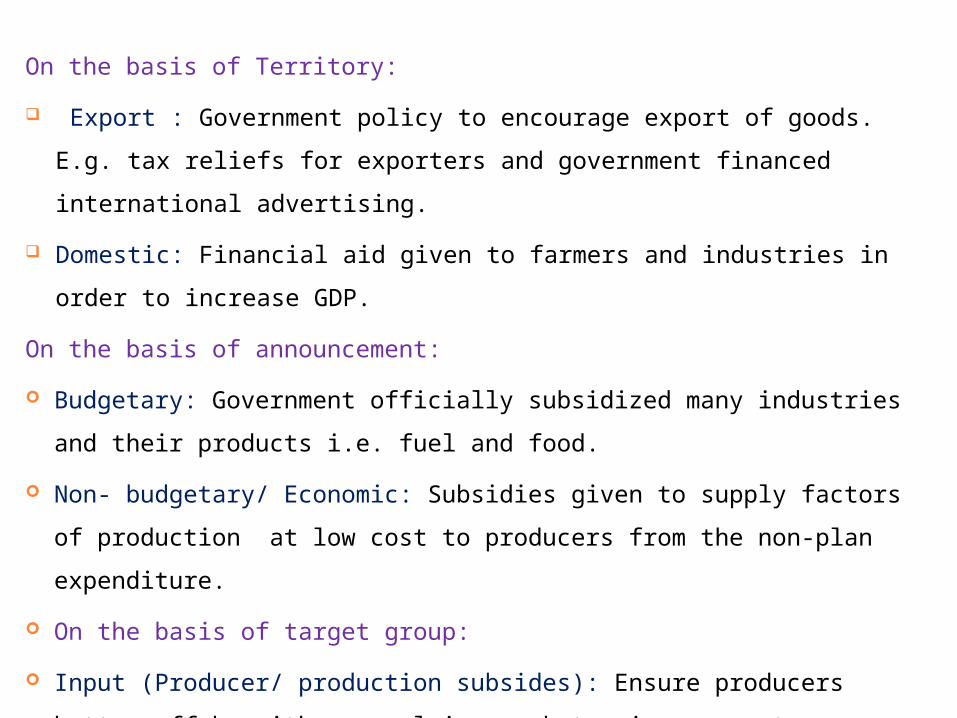
On the basis of Territory:
Export : Government policy to encourage export of goods. E.g. tax reliefs for exporters
and government financed international advertising.
Domestic: Financial aid given to farmers and industries in order to increase GDP.
On the basis of announcement:
Budgetary: Government officially subsidized many industries and their products i.e. fuel
and food.
Non- budgetary/ Economic: Subsidies given to supply factors of production at low cost
to producers from the non-plan expenditure.
On the basis of target group:
Input (Producer/ production subsides): Ensure producers better off by either supplying
market price support or payment to factor of production.
Output (Consumer/ Consumption): Reduces the price of goods and services to the
consumers.

Implicit Subsidies: Inputs whose prices are administratively
determined are priced low as compared to their economic costs.
Farmer does not receive any direct payment but somebody in the economy
accounts for the difference, i.e. input producers.
o Explicit Subsidies: Explicit input subsidies are payments made to the
farmers directly to meet a part of the cost of an input.
These are explicit payments made to the farmer. For example: Subsidy on improved or high yielding variety seeds, Plant protection chemicals and equipments Improved agricultural implements. Supply of minikits containing seeds.
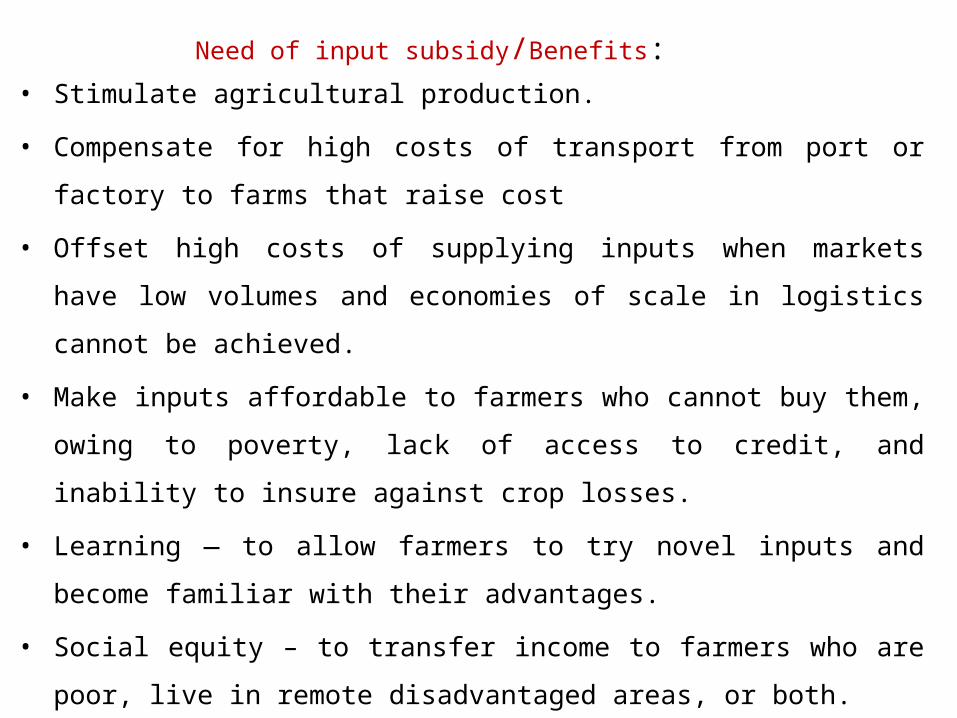
Need of input subsidy/Benefits:
• Stimulate agricultural production.
• Compensate for high costs of transport from port or factory to farms that raise
cost
• Offset high costs of supplying inputs when markets have low volumes and
economies of scale in logistics cannot be achieved.
• Make inputs affordable to farmers who cannot buy them, owing to poverty, lack
of access to credit, and inability to insure against crop losses.
• Learning — to allow farmers to try novel inputs and become familiar with their
advantages.
• Social equity – to transfer income to farmers who are poor, live in remote
disadvantaged areas, or both.
• This may sometimes be difficult to disentangle from the motive of political
patronage – to win favor with voters and reward supporters.

FERTILIZER SUBSIDY• The fertilizers subsidy is computed as the gap between import
parity price and farm gate sale of fertilizer times the quantity of fertilizers utilized by the agriculture sector accordingly.
FS = QF (PI – PT ) where FS = Fertilizer subsidy QF = Quantity of fertilizers utilized by the agriculture sector PI = Import parity price, i.e. CIF price + dealer margin + pool handling expense PT = Farm gate sale price of fertilizersNutrient based subsidy:• 2010 with objective to promote balanced use of fertilizers and to li
mit fertilizer subsidy of the government.

FERTILIZER SUBSIDIES:Year Subsidies on different fertilizers: Total
fertilizers subsidy
(Rs. Crore)
Nitrogen(N) Phosphorus(P) Potassium(P) Others
1970-71 350.90 (87.99%) 41.76 (10.47%) - 6.1 (1.52) 398.76 1980-81 1400.30 (88.40%) 121.34 (7.66%) - 62.56 (3.08) 1583.90 1990-91 2990.09 (98.33%) -88.18 (-2.89%) 22.52 (0.74) 116.4 ) (3.82 3040.74 2000-01 5211.85 (81.45%) 486.18 (7.59%) 493.38 (7.71) 207.06 (3.23) 6398.47 2007-08 6301.84 (74.42%) 976.71 ( 11.53%) 538.42 (6.35%) 650 (7.67) 8466.97 2008-09 6400.34 (67.54%) 1201.83 (12.68%) 572.99 (6.04%) 1300 (13.70) 9475.16 2009-10 7949.09 (46.65%) 2075.04 (12.82%) 816.54 (5.04%) 5341.33 (33.00) 16182 2010-11 8617.81 (43.86%) 2675.70 (13.62%) 689.96 (3.51%) 7661.43 (39.00) 19644 2011-12 10694.84 (42.90%) 3431.30 (13.76%) 794.93 (3.18%) 10002.91 (40.13) 24924 2012-13 12131.52 (48.69%) 4484.22 (18%) 739.69 (2.96%) 7556.57 (30.33) 24912 2013-14 12185.02 (48.71%) 5129.61 (20.50%) 663.07 (2.65%) 7036.3 (28.12) 25014 2014-15 12084.30 (49.04%) 5104.09 (20.71%) 706.78 (2.86%) 6741.83 (27.36) 24637
Note: Per cent of total subsidies are given in the parentheses.Source: Economic Survey of India, 2015.

FERTILIZER CONSUMPTION:
Note: Per cent of total fertilizer consumption are given in parentheses. Source: Agriculture Statistics at a glance. 2015
(100%)

CREDIT SUBSIDIES:• To procure all other inputs such as seeds, fertilizers, agricultural lab
or for tilling/weeding/sowing and other agronomic operations.• The credit subsidy is measured to the differential rate of interest
between the market lending rate of interest on advances and the rate charged from the farmers for their short term loans to agriculture sector.
• It is defined as: CS = AL (RM - RF ) CS = Credit subsidy AL = Amount of short-term loans to agriculture sector. RM = Marketing lending rate of interest on advance RF = Rates charged from the farmers for their short-term loans.

Note: Percent of total credit disbursement is given in parentheses.Source: Economic Survey of India, Agriculture Statistics at a glance. 2015
Credit distribution in India:Year Short term
credit (Rs. Crore)
Long term Credit (Rs.
Crore)
Total
2000-01 28965 (62.6) 17303 (37.39) 46268 2005-06 74064 (59.10) 51245 (40.89) 125309 2010-11 297159 (63.45) 1o5255 (22.47) 468291 2011-12 396158 (77.52) 114871(22.47) 511029 2012-13 473500 (77.95) 133875 (22.04) 607375 2013-14 573001(81.22) 138620 (19.47) 711621 2014-15 635412 (75.16) 209916 (24.83) 845328
( 100%)
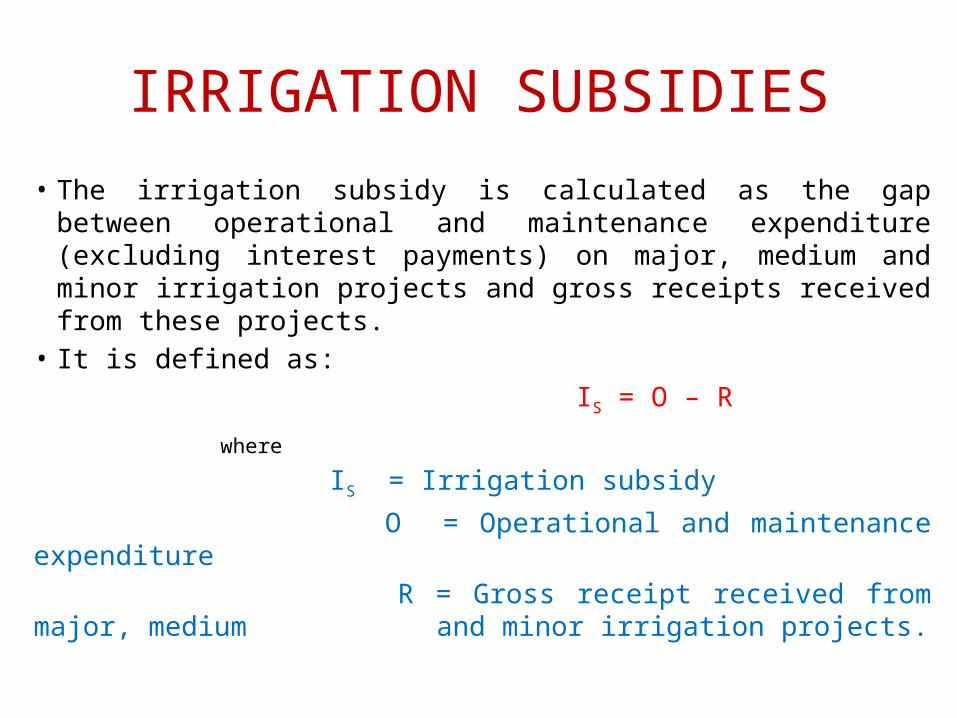
IRRIGATION SUBSIDIES• The irrigation subsidy is calculated as the gap between
operational and maintenance expenditure (excluding interest payments) on major, medium and minor irrigation projects and gross receipts received from these projects.
• It is defined as: IS = O – R
where
IS = Irrigation subsidy O = Operational and maintenance expenditure R = Gross receipt received from major, medium and minor irrigation projects.
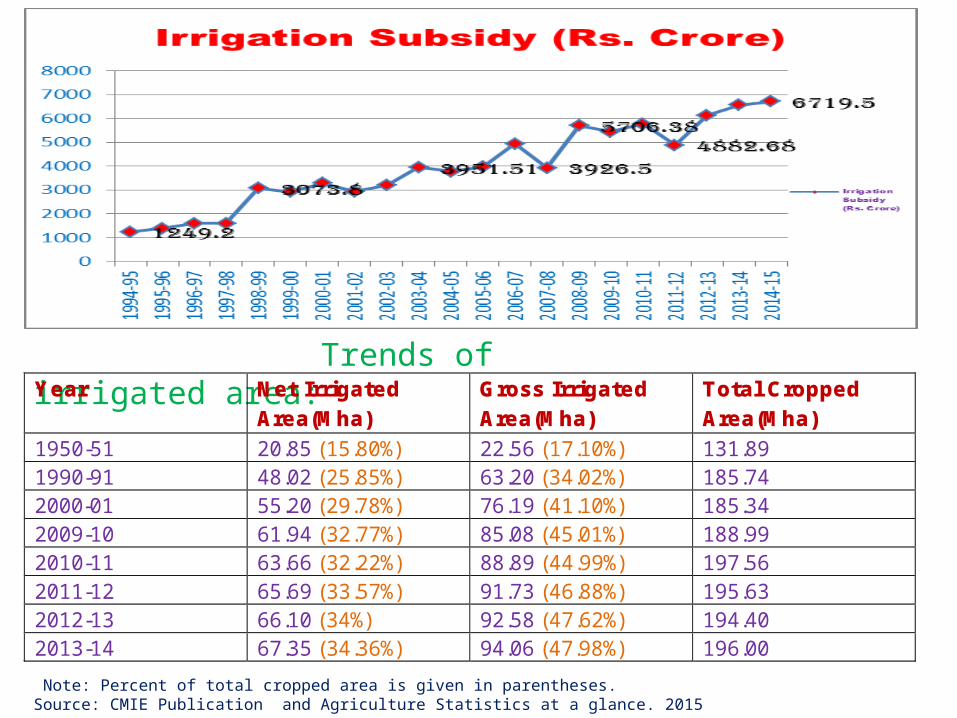
Note: Percent of total cropped area is given in parentheses.Source: CMIE Publication and Agriculture Statistics at a glance. 2015
Trends of irrigated area:Year Net Irrigated
Area(Mha) Gross Irrigated Area(Mha)
Total Cropped Area(Mha)
1950-51 20.85 (15.80%) 22.56 (17.10%) 131.89 1990-91 48.02 (25.85%) 63.20 (34.02%) 185.74 2000-01 55.20 (29.78%) 76.19 (41.10%) 185.34 2009-10 61.94 (32.77%) 85.08 (45.01%) 188.99 2010-11 63.66 (32.22%) 88.89 (44.99%) 197.56 2011-12 65.69 (33.57%) 91.73 (46.88%) 195.63 2012-13 66.10 (34%) 92.58 (47.62%) 194.40 2013-14 67.35 (34.36%) 94.06 (47.98%) 196.00
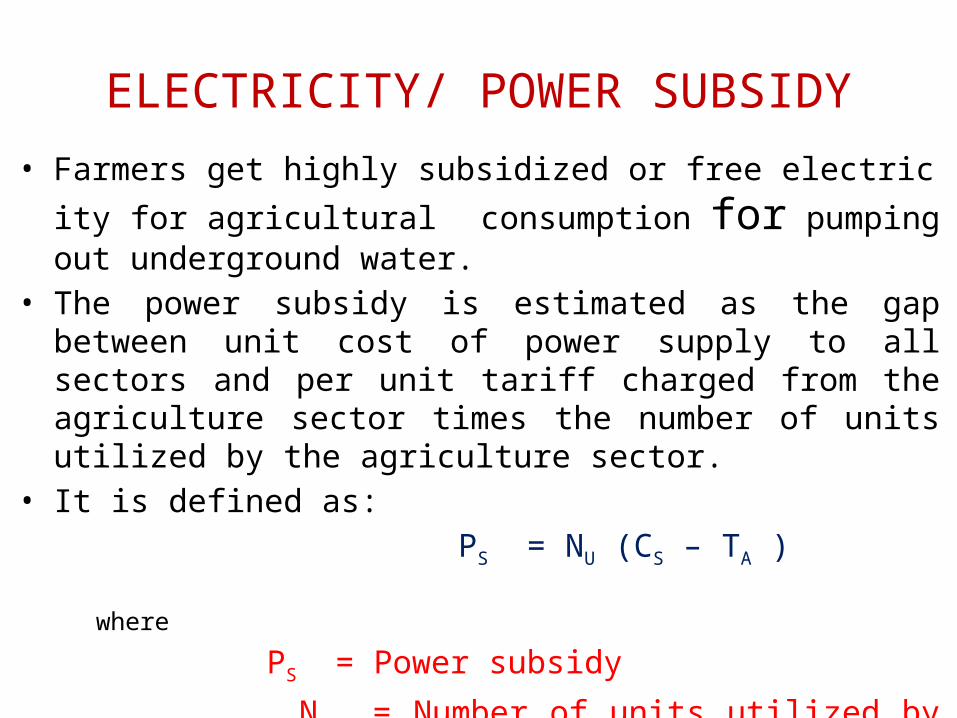
ELECTRICITY/ POWER SUBSIDY• Farmers get highly subsidized or free electricity for agricultural
consumption for pumping out underground water.• The power subsidy is estimated as the gap between unit cost of
power supply to all sectors and per unit tariff charged from the agriculture sector times the number of units utilized by the agriculture sector.
• It is defined as: PS = NU (CS – TA )
where
PS = Power subsidy NU = Number of units utilized by the agriculture sector CS = Per unit cost of power supply to all sectors. TA = Per unit tariff for agricultural sector.

Source: Economic Survey of India, Agriculture Statistics at a glance. 2015

SEED SUBSIDY• The seed subsidy is measured as the gap between the annual income and expenditure of the
National Seed Corporation limited, i.e. the amount of revenue fore gone for the provision of seeds.
S = Y – E where
S = Seed subsidy in the year
Y = Income of NSC in the given year.
E = Expenditure of NSC.
Many schemes provide subsidized seed: Rashtriya Krishi Vikas Yojna (RKVY) Macro Management of Agriculture (MMA) Integrated Scheme for oilseeds, pulses, oil palm and maize (ISOPOM) Technology missions for cotton, National food security Mission etc.
New Policy on Seed Development (NPSD) permits 100 per cent foreign direct investment (FDI) under the automatic route.

Source: Economic Survey of India, Agriculture Statistics at a glance. 2015
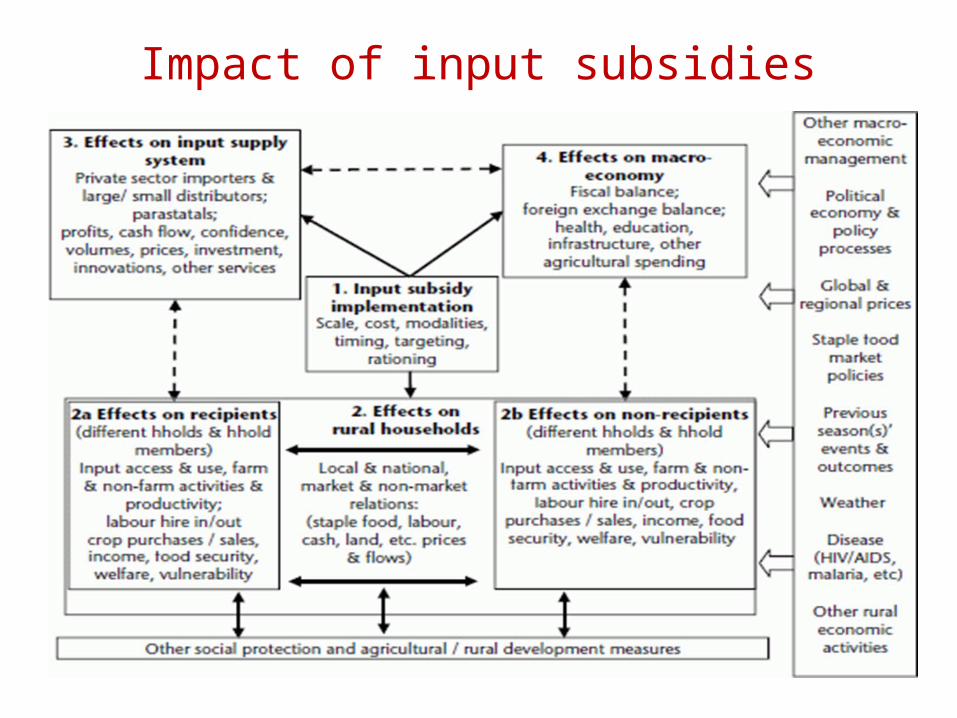
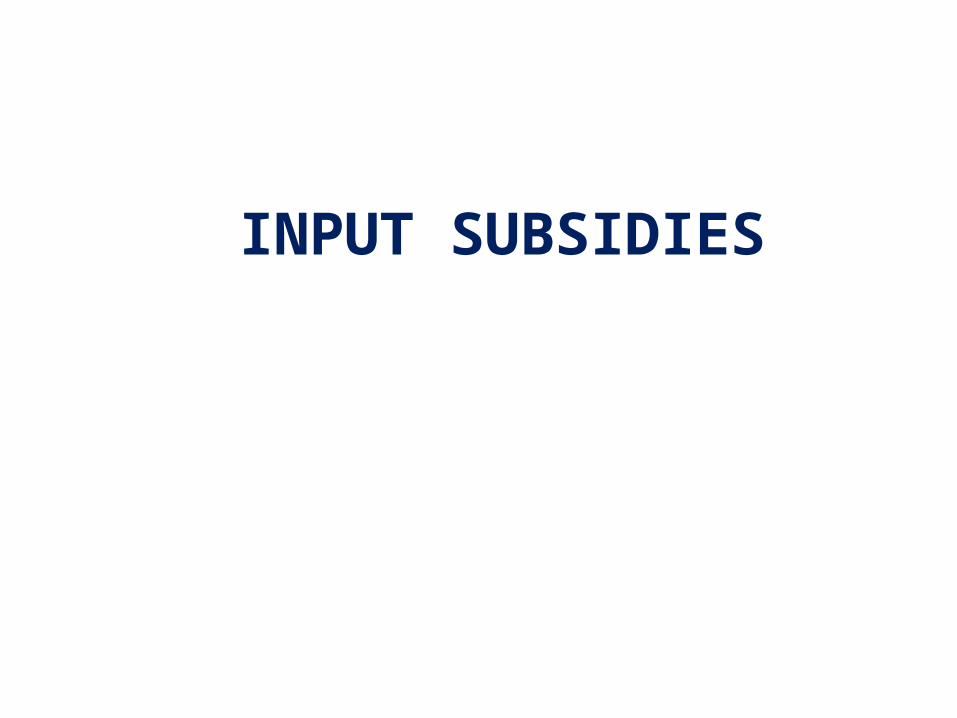
Impact of input subsidies

FARM TECHNOLOGY

Technology is the application of organized and scientific knowledge to solve practical problems.
In agriculture, the success of a technology can be measured only when it gets transferred for increased crop production.
Crop production could be increased (all other factors remaining the same) :
a) use of quality seeds of high yielding varieties a) By judicious use of appropriate Technologies for value addition b) Using appropriate agronomic innovations
Therefore we have most of the agricultural technology focusing on Seed, the most vital and critical agricultural input Water management Farm power Agronomic practices Information availability
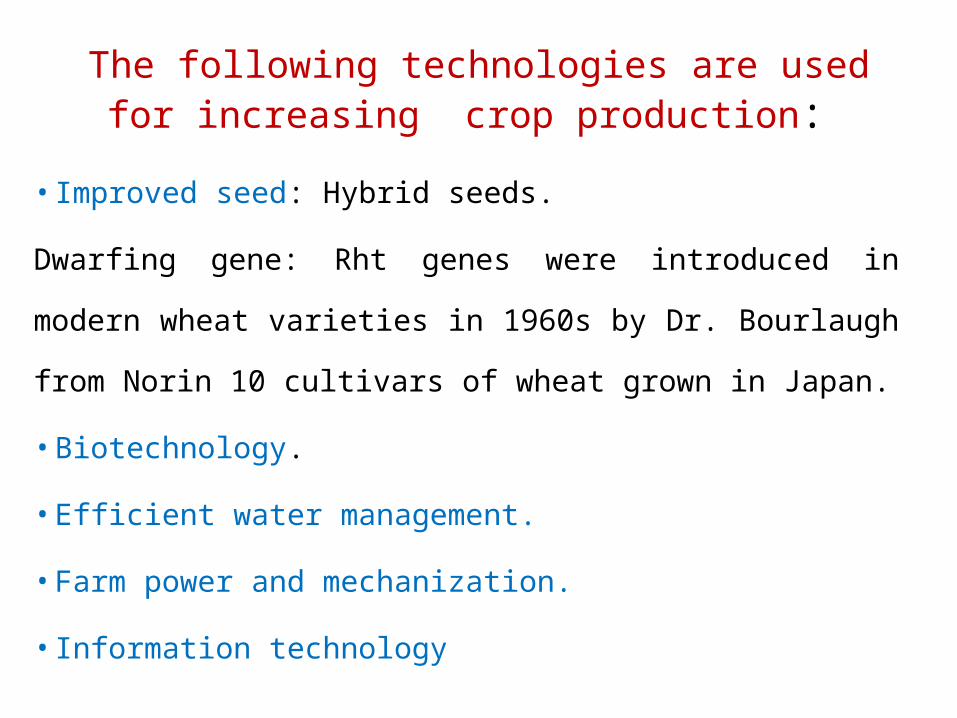
The following technologies are used for increasing crop production:
• Improved seed: Hybrid seeds.
Dwarfing gene: Rht genes were introduced in modern wheat varieties
in 1960s by Dr. Bourlaugh from Norin 10 cultivars of wheat grown in
Japan.
• Biotechnology.
• Efficient water management.
• Farm power and mechanization.
• Information technology

Hybrid Seed • Main contributors to the dramatic rise in agricultural
output during the last half of the 20th century.
• The private sector is the dominant (200 private players
as compared to 14 govt. organizations).
• In spite of the availability of several hybrids, limited area
under cultivation of a few crops: 60-70 % in vegetables crop, 100 % sunflower, 30 % in cotton, 55 % in maize, 80 % in bajra, 10-15 % in rice.
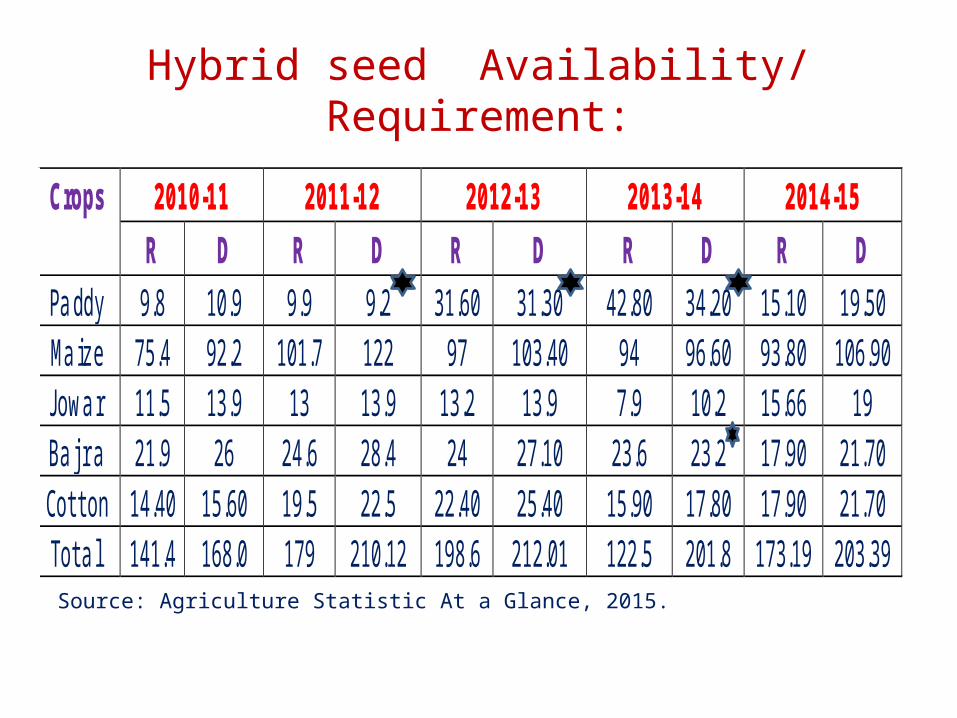
Hybrid seed Availability/ Requirement:
Crops 2010-11 2011-12 2012-13 2013-14 2014-15 R D R D R D R D R D
Paddy 9.8 10.9 9.9 9.2 31.60 31.30 42.80 34.20 15.10 19.50 Ma ize 75.4 92.2 101.7 122 97 103.40 94 96.60 93.80 106.90 J owar 11.5 13.9 13 13.9 13.2 13.9 7.9 10.2 15.66 19 Ba j r a 21.9 26 24.6 28.4 24 27.10 23.6 23.2 17.90 21.70 Cot t on 14.40 15.60 19.5 22.5 22.40 25.40 15.90 17.80 17.90 21.70 Tot a l 141.4 168.0 179 210.12 198.6 212.01 122.5 201.8 173.19 203.39 Source: Agriculture Statistic At a Glance, 2015.

BIOTECHNOLOGYAdvantage of using Biotech Crops:
Increased Production
More friendly to environment.
Mitigating some of the challenges associated with climate change.
Optimize use of fertilizers and encourage the use of micronutrients.
Minimize the need for pesticides and herbicides.
Increase the efficient use of soil moisture.
Minimize drudgery for labor, especially women. Socio-economic
benefit to farmers particularly small scale farmers.

BIOTECH CROPS: COTTON • 2002: Commercialization of cotton on March 26.
• Cotton is the only Biotech crop commercialized in India. The Bt brinjal event
EE-1 (Cry 1Ac ) developed by M/s Maharashtra Hybrid Seeds Company Ltd,
India approved for commercialization by the Genetic Engineering Approval
Committee but the Government refused citing public health concerns.
• The presence of Cry 1Ac decreases insecticide requirement by as much as
80%.
• Since 2002, tremendous progress in cotton production has been achieved
which is shown in the next slide.

BT-Cotton adoption in India
Source: Bt-Cotton in India, Bhagirath Choudhary and Kadamini Kaur, 2014-15.
1.77
13.6

Micro- irrigation• To achieve required food production with increasing
population, India has to enhance the current irrigation potential of 91 Mha to 160 Mha.
• But, the total water resources estimated are for 230 Mha. • Therefore, technologies for water harvesting and saving
i.e. precision water application methods need to be adopted such as:
Sprinkler irrigation system. Drip irrigation system. Rain water harvesting.

Water usage efficiencies under various Irrigation System
Impact on the water usage and productivity

Area covered under Micro-irrigation:
Year Area(Mha) 2005 3.09 2010 4.94 2014 6.14 2015 7.73
Country % Area under Micro-irrigation system
Israel 90 Russia 78 Spain 65 USA 55
Brazil 52 China 10 India 5.5
Comparison with other countries:
Source: Accelerating growth of Indian Agriculture: Micro-irrigation an efficient Solution, FICCI and Agriculture Statistics At a Glance, 2015.

FARM MECHANIZATION
• Utilization of modern power drawn implements and
equipment for different operations at the farm.
ADVANTAGES OF FARM MECHANIZATION:
Improves utilization efficiency of inputs.
Ensures timeliness of farm operations.
Reduced cost of production.
Reduces drudgery and increase safety in operations.
Helps in conserving natural resources.
Substitute for labour.

Current status of Farm Mechanization in India:
Process/ Practices % of Mechanization Soil working/ Seed Bed preparation 40 Seeding/ Planting 29 Plant Protection 34 Irrigation 37 Harvesting/ Threshing( Rice/ Wheat) 60-70 Harvesting/ Threshing (other crops) 5 Source: Farm mechanization in India, IIM, Ahemdabad,2014.

Source: World Agriculture, V. Stillers,2014.
COMPARISON WITH OTHER COUNTRIES:
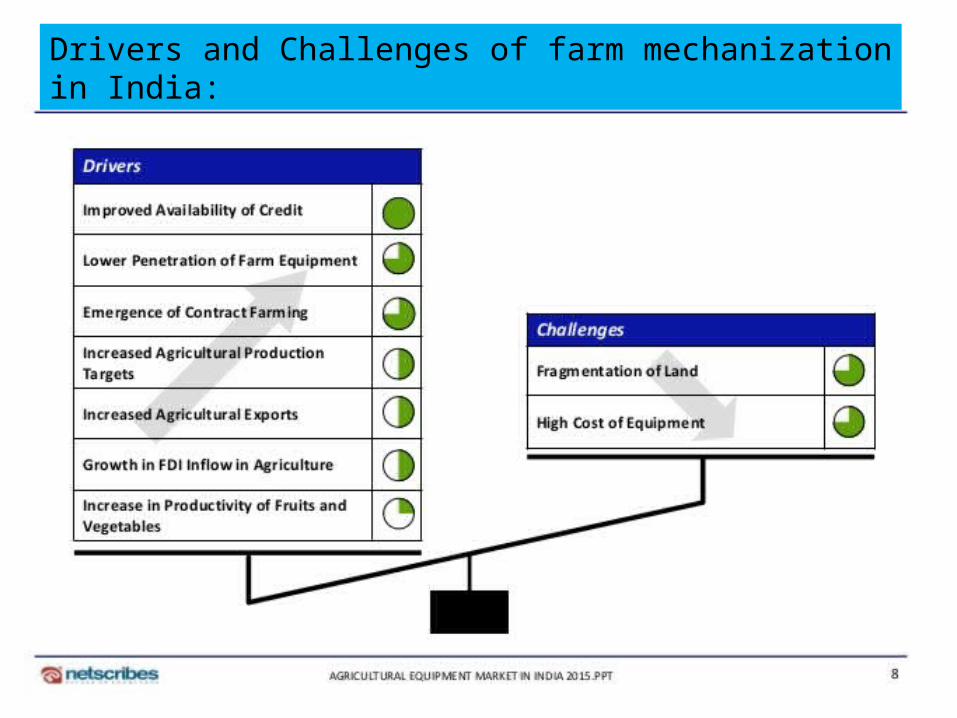
Drivers and Challenges of farm mechanization in India:
Source: Agricultural Mechanization in India: Status and future perspective, Gajendra Singh, 2014.
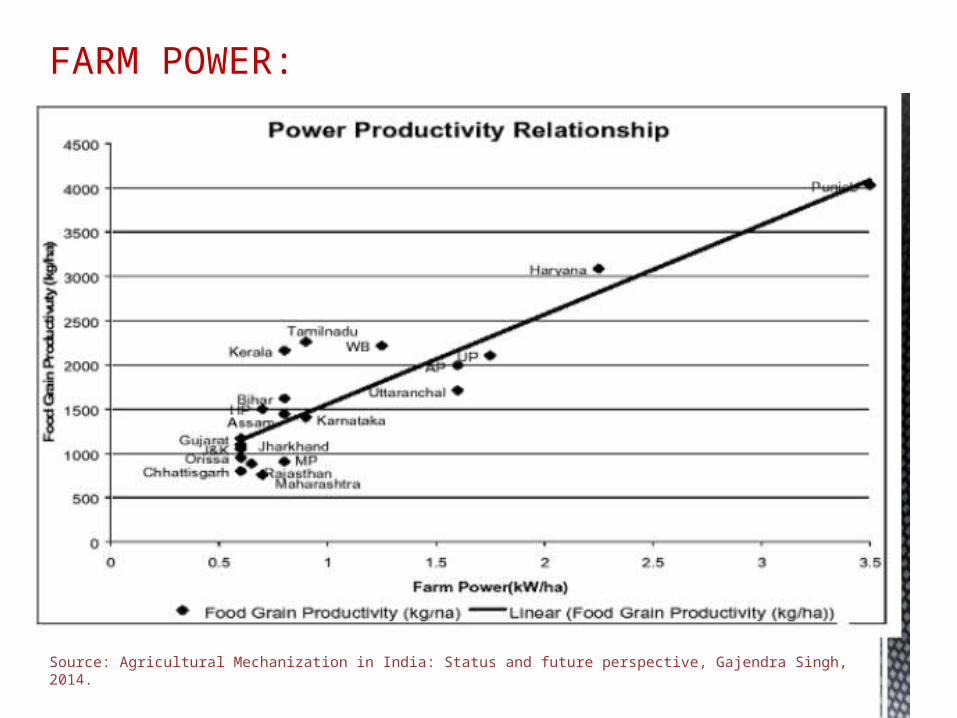
FARM POWER:

Increase in the farm power in India:
Source: Transforming Agriculture through mechanization, FICCI.

Trend in the use of Farm Power since 1970s:
Source: Transforming Agriculture through mechanization, FICCI, 2015.
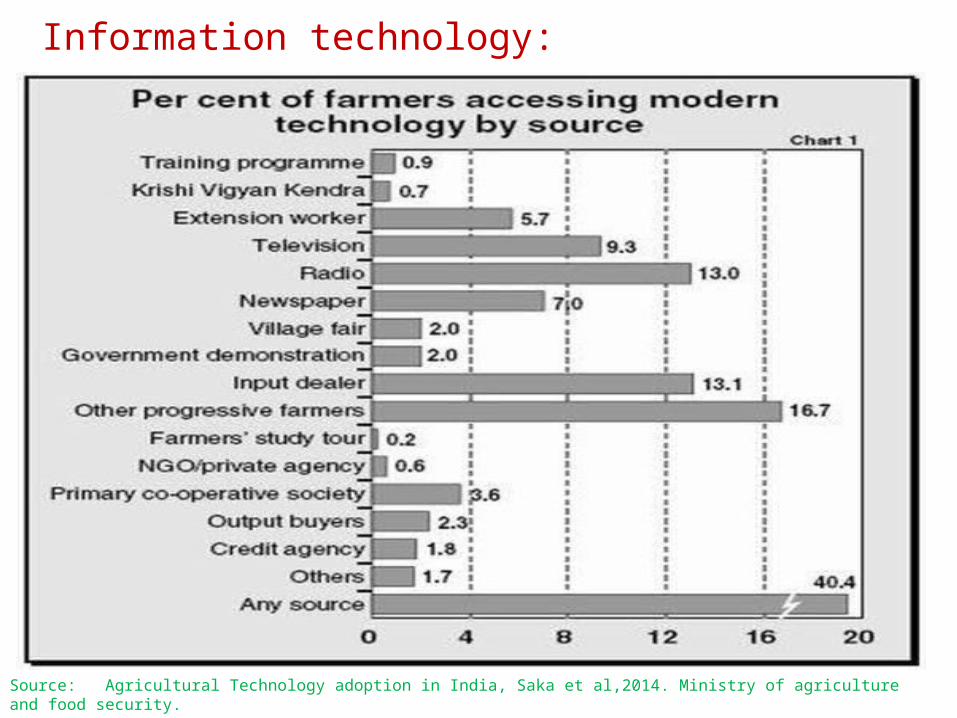
Source: Agricultural Technology adoption in India, Saka et al,2014. Ministry of agriculture and food security.
Information technology:
ICT (information and communications technology - or technologies):
• ICT refers to all equipment, applications and services that involve communication.
• ICT can enhance the contribution to agriculture and rural development tremendously
by establishing:
Information Centre
Farmer's Call Centre
GIS based soil mapping
GIS based weather prediction
Improved Radio/ TVs station
Agriculture data base
Encyclopedia

EFFECTIVENESS OF SUBSIDIES AND TECHNOLOGY

• Technology is an integral part of agriculture, and will remain a key
factor for agriculture in the future.
• There is a need to progressively transform the agricultural sector
away from subsistence-oriented household-level production towards
an integrated economy fueled by agricultural productivity growth
which can be achieved only through technological adoption.
To achieve following objectives:
Ensuring food security,
Reducing poverty and hunger,
Without irreversible degradation of the natural resource base.
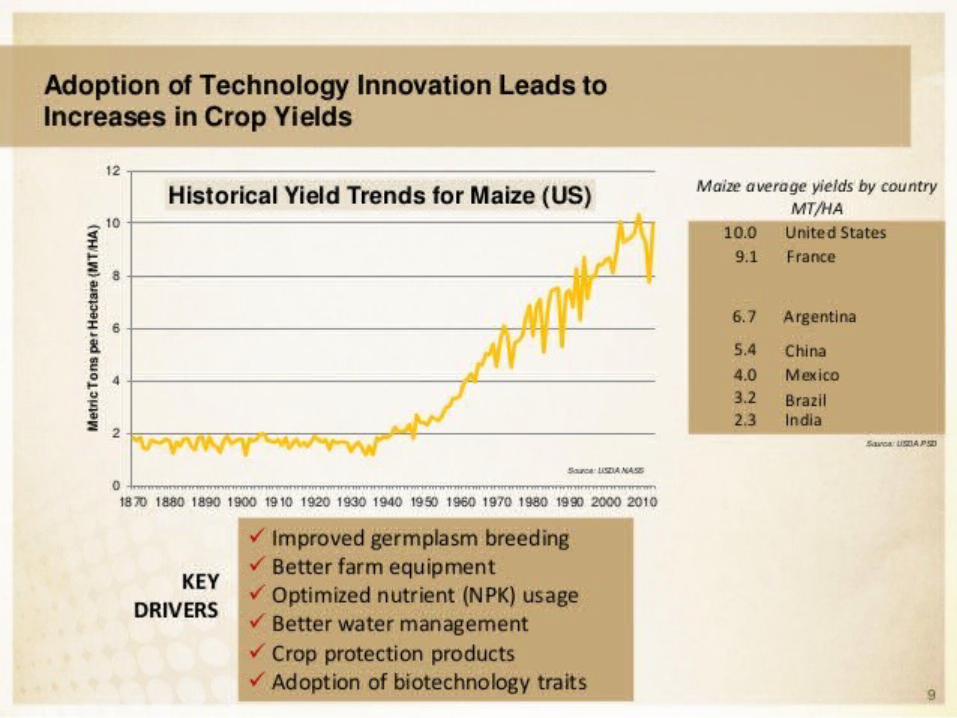
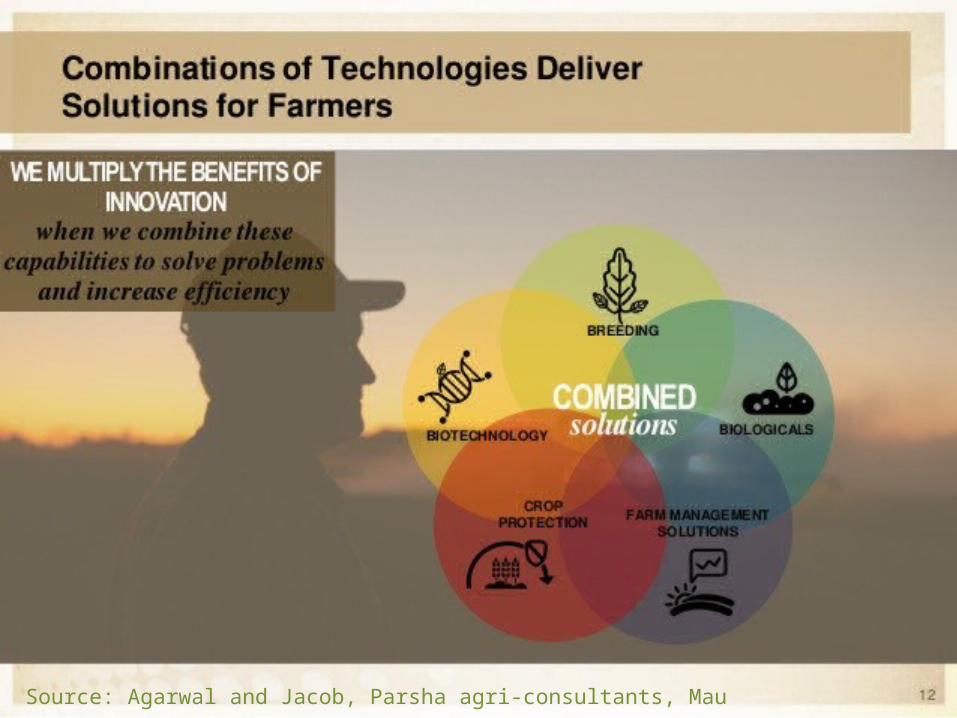
Source: Agarwal and Jacob, Parsha agri-consultants, Mau
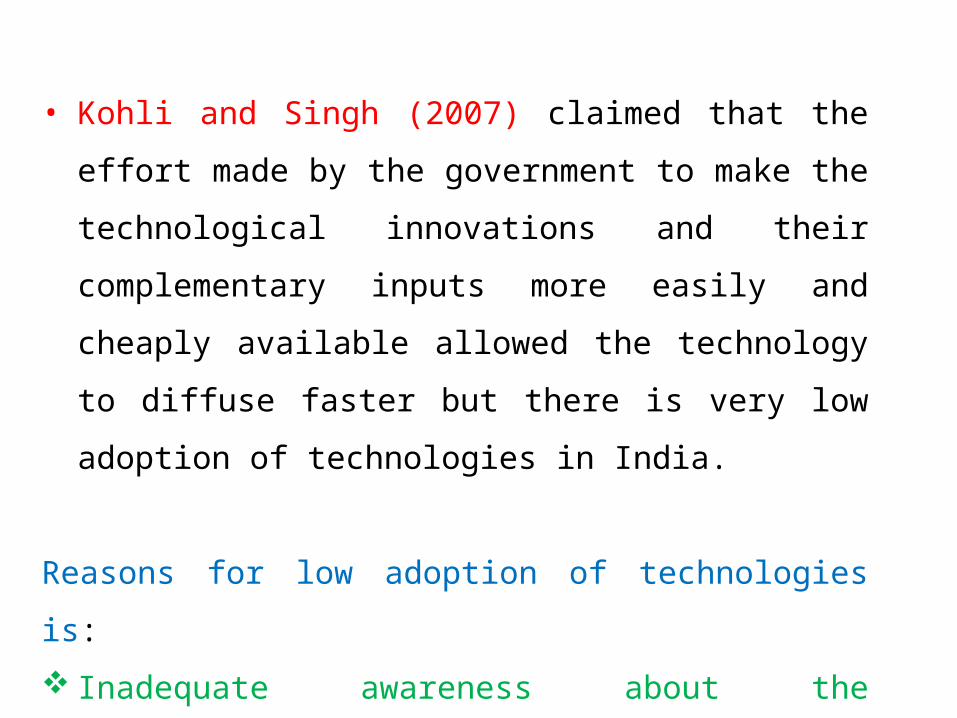
• Kohli and Singh (2007) claimed that the effort made by the
government to make the technological innovations and their
complementary inputs more easily and cheaply available
allowed the technology to diffuse faster but there is very low
adoption of technologies in India.
Reasons for low adoption of technologies is:
Inadequate awareness about the technology,
Economic viability and
Lack of easy access to credit.

Problem with subsidies
• Controlling costs, as there tend to be strong political pressures for the expansion of subsidies, and
only weak pressures for their control.
• ‘Exits’, as there is strong political resistance to scaling down or termination of subsidies.
• Effectiveness of targeting of input subsidies to particular farmer types, with the problems of
diversion and leakage noted above both expanding program cost and reducing efficiency.
• Over use of inputs, or adoption of input intensive production methods, as a result of artificially low
input prices.
• Regressive benefits favoring larger farmers who can afford subsidized inputs (the poorest farmers
may not be able to afford inputs even where they are subsidized).
• Market distortions, and particularly parastatal involvement in subsidized input delivery, tending to
crowd out and inhibit private sector investment in input supply systems and hence impede
sustainable development.

Non- Product Specific Support: The non- product specific support is defined as the sum of the subsidies on various agricultural inputs like credit, seed, fertilizers, canal irrigation and electricity.
Product- Specific Support: The product-specific support is defined as the market price support through minimum support price (MSP) and computed with reference to the world / International prices.
Aggregate Measurement of Support: The AMS is defined as the sum of all non- exempted domestic annual level of support, expressed in monetary terms, provided in the favour of agricultural producers. The AMS consists of both product-specific support and non- product specific support. Total AMS = Product-specific support + Non- product specific support.

Effectiveness of input subsidies
Year Product specific support
Non-product specific support
Total AMS
1994-96 -33624.10 4359.60 -29264.5 1997-98 -41949.20 3292.42 -38656.8 1998-99 -37992.30 4292.57 -33699.7 1999-00 -47395.30 4331.78 -43063.5 2001-02 -45213.60 4291.28 -40922.3 2002-03 -49541.10 3591.38 -45959.6 2003-04 -46376.90 4742.91 -41634.00 2004-05 -49252.20 6060.98 -43191.2 2005-06 -48973.00 6287.21 -42685.8 2006-07 -45736.20 6126.13 -39610.1 2007-08 -50078.20 5909.51 -44169.2 2008-09 -50294.90 5655.56 -44638.4 2009-10 -46662.30 5597.80 -41064.5 2010-11 -47497.90 5534.81 -41963.3 2011-12 -39841.50 5799.08 -34042.4 2012-13 -42422.80 6565.67 -35857.1
Source: Economic Survey of India and Mohan et al, 2014.Note: Input subsidies going to small and marginal farmers are counted up in non-product specific support and product specific support are computed on the base year 1996-97 world references prices.
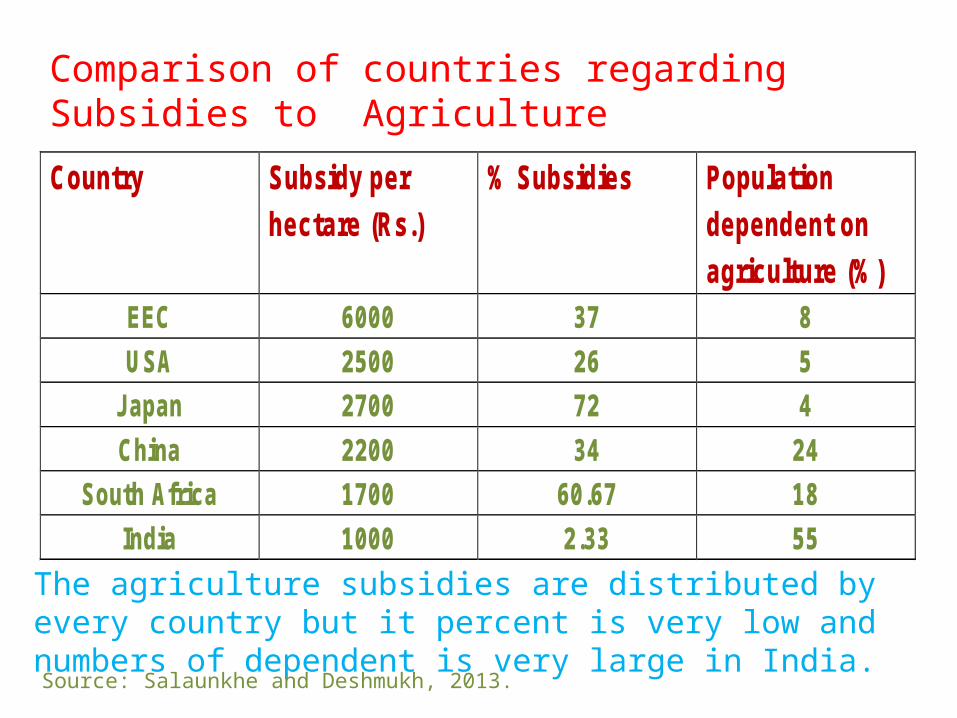
Comparison of countries regarding Subsidies to Agriculture
The agriculture subsidies are distributed by every country but it percent is very low and numbers of dependent is very large in India.
Source: Salaunkhe and Deshmukh, 2013.
Country Subsidy per hectare (Rs.)
% Subsidies Population dependent on agriculture (%)
EEC 6000 37 8 USA 2500 26 5
J apan 2700 72 4 China 2200 34 24
South Africa 1700 60.67 18 India 1000 2.33 55

Comparison of subsidies with public investment:
Source: Economic Survey of India, Agriculture statistic At a Glance, 2015

Since the mid-1990s agricultural production increases have slowed,
apparently for lack of investment in physical infrastructure, research and
extension due to higher cost of the subsidies which crowded out other public
investment.
These concerns led that input subsidies had been ineffective and inefficient
policy instruments and that they had contributed to government over-spending
and fiscal and macro-economic problems.
But, Fan et al. (2009) estimate a significant contribution of input subsidies to growth
and poverty reduction in India in the early stages of the Green Revolution as the
reduced costs of subsidized inputs :
Increase their profitability and
Reduce the risks perceived by farmers
With a limited knowledge of input benefits and of correct usage.
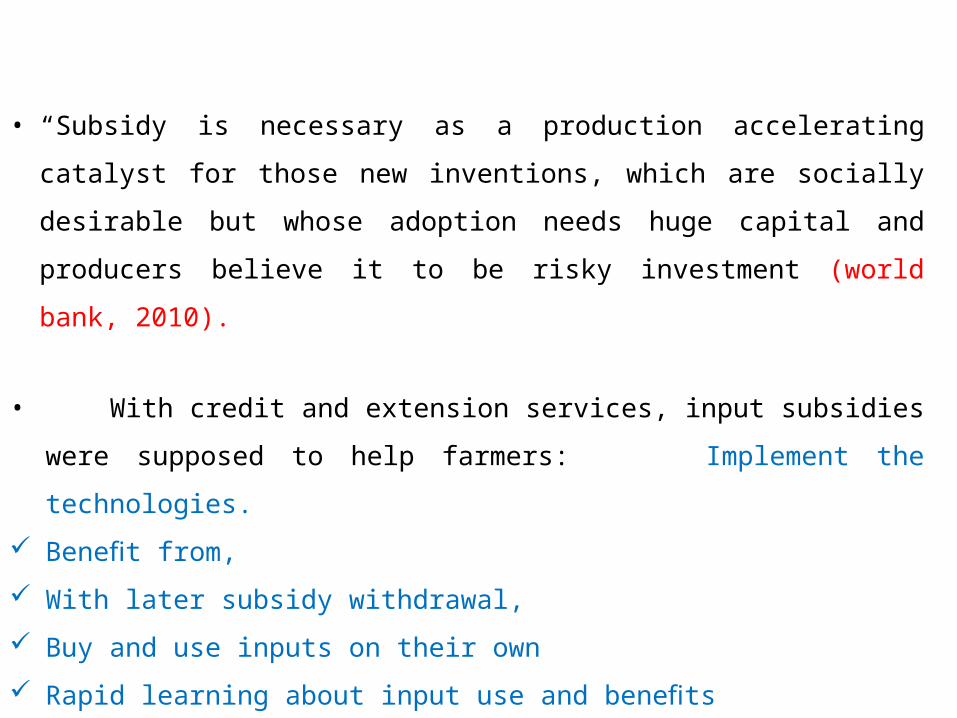
• “Subsidy is necessary as a production accelerating catalyst for those new
inventions, which are socially desirable but whose adoption needs huge capital
and producers believe it to be risky investment (world bank, 2010).
• With credit and extension services, input subsidies were supposed to help
farmers: Implement the technologies.
Benefit from,
With later subsidy withdrawal,
Buy and use inputs on their own
Rapid learning about input use and benefits
would mean that subsidies should be needed for only a short time and could be
rapidly phased out as shown in next slide.

Allocation of fund released under Micro-irrigation Subsidy:
Year Allocation of funds (Rs. Crore)
Utilized (Rs. Crore)
2009-10 808 479.14 (59.3%) 2010-11 1103 996.00 (90.3%) 2011-12 1377 1227.31 (89%) 2012-13 1494 1202.67 (80.5%) 2013-14 1559.2 1170.95 (75.1%) 2014-15 1111.8 714.88 (64.3%) 2015-16 1o75 -
Source: Accelerating growth of Indian Agriculture: Micro-irrigation an efficient Solution, FICCI .

CONCLUSION

• There were early returns during the Green Revolution, but the subsidies
became increasingly ineffective as they were not complemented by deeper and
complementary investments.
• Adoption of improved technology with better allocation of resources
significantly increases the net returns and are urgently needed in the face of
shrinking land and water resources.
• But, the ultimate challenge in the technology development and dissemination
process is adoption and utilization by farming communities.
Technology adoption is influenced by:
Information imperfections, which lead to a need for learning about new
technologies
Credit constraints especially for small farmers.
Insurance and risk management against failures.
Which can be possible only through subsidy disbursement.

Dorward et al. (2007a) states that state interventionist approaches regarding input
subsidies require :
(a) Technologies, management, and agro-ecological conditions that generate
sufficient productivity gains and
(b) Complementary infrastructure and institutions to support extension services and
market activities.
To sum up, during the initial stages of adoption of new technology in agriculture,
subsidies were justified as front up costs.
Hence, Subsidies in agriculture focused on promoting agricultural productivity by
making adoption of new technologies are urgently needed (Ellis, 2011).
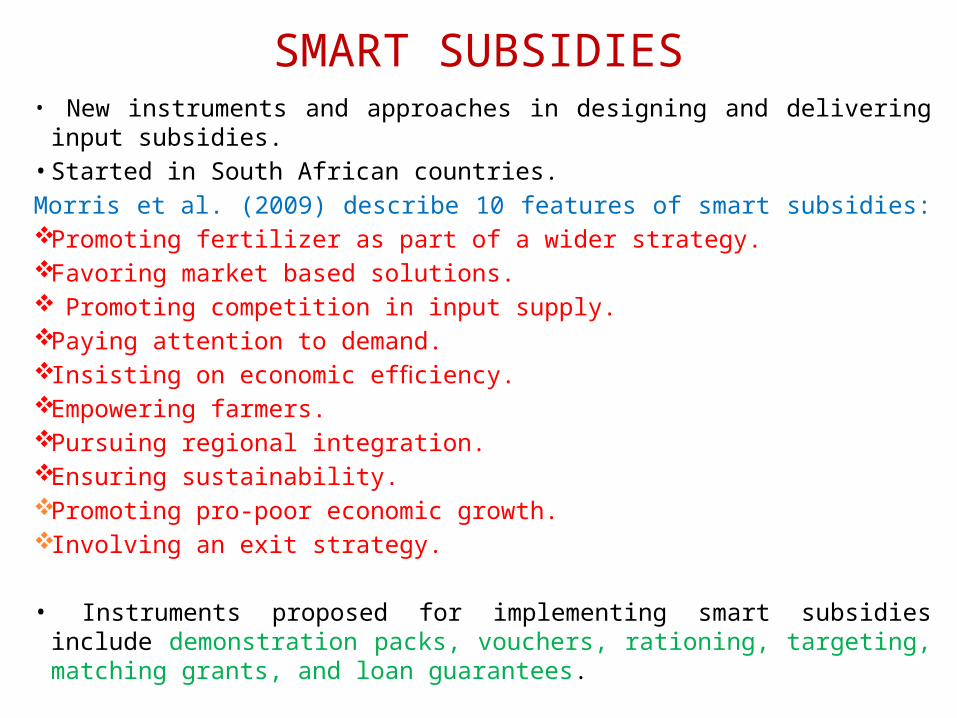
SMART SUBSIDIES• New instruments and approaches in designing and delivering input subsidies.• Started in South African countries.Morris et al. (2009) describe 10 features of smart subsidies: Promoting fertilizer as part of a wider strategy. Favoring market based solutions. Promoting competition in input supply. Paying attention to demand. Insisting on economic efficiency. Empowering farmers. Pursuing regional integration. Ensuring sustainability. Promoting pro-poor economic growth. Involving an exit strategy.
• Instruments proposed for implementing smart subsidies include demonstration packs, vouchers, rationing, targeting, matching grants, and loan guarantees.

THANK YOULike it share it and spread the word E REVOLUTION everywhere