Innovative Employer Benefits Strategies and the...
36
Innovative Employer Benefits Strategies and the Business Value of Health Bruce Sherman, MD, FCCP, FACOEM Medical Director, Employers Health Coalition October 10, 2013
Transcript of Innovative Employer Benefits Strategies and the...

Innovative Employer Benefits Strategies and the Business Value of Health
Bruce Sherman, MD, FCCP, FACOEM Medical Director, Employers Health Coalition
October 10, 2013

Presentation content Business value of a healthy workforce Benefits innovations – demand-side strategies Benefits innovations – supply-side strategies Integrating demand and supply approaches Summary: employer action steps

Traditional view of employee value
Value Work output Cost
Responsible department Operations Human Resources
Components Business productivity Supply chain management
Wages, health benefits, WC costs, recruitment, vacation…
Representative metrics - Labor hours per unit - Waste as % of total output - Revenue per employee
- PEPY healthcare costs - Employee engagement - Turnover rate
© 2010 Bruce Sherman, MD. All rights reserved.
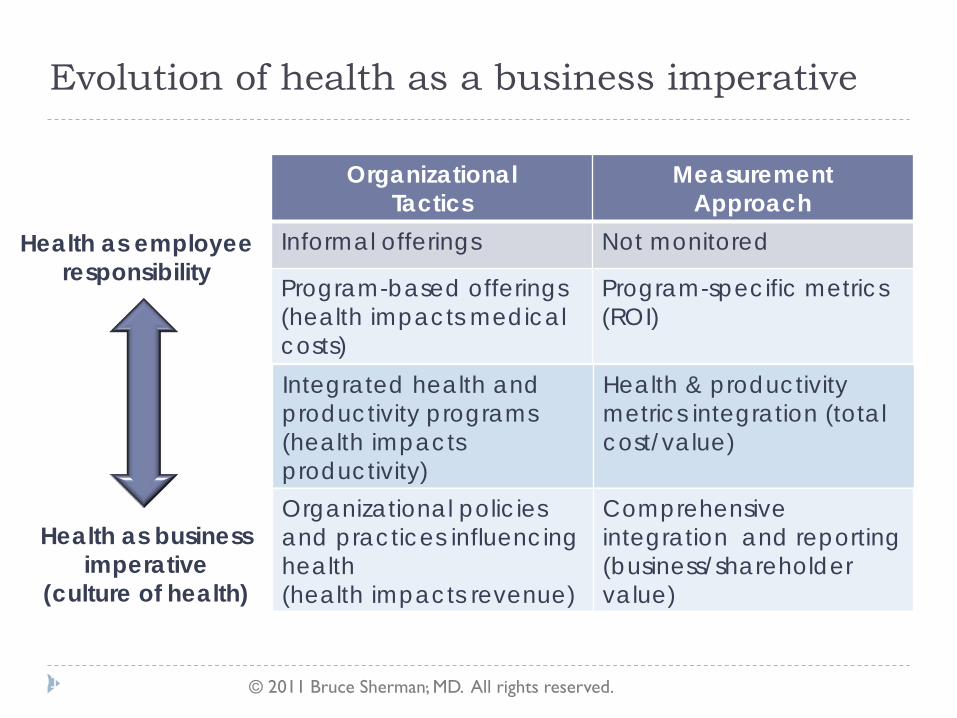
Evolution of health as a business imperative
Organizational Tactics
Measurement Approach
Informal offerings Not monitored
Program-based offerings (health impacts medical costs)
Program-specific metrics (ROI)
© 2010 Bruce Sherman, MD. All rights reserved..
Health as employee responsibility
4
Health as business imperative
(culture of health)
Integrated health and productivity programs (health impacts productivity)
Health & productivity metrics integration (total cost/value)
Organizational policies and practices influencing health (health impacts revenue)
Comprehensive integration and reporting (business/shareholder value)
© 2011 Bruce Sherman, MD. All rights reserved.

What’s the value of a healthy workforce?
Triple Aim goals Improved quality Better health outcomes Lower healthcare costs
Lies in alignment of health management strategy with company business strategy Increased worker productivity Enhanced worker performance Increased company profitability
Optimal services generate optimal value

Higher well-being is associated with improved workplace performance
Healthways, 2011.
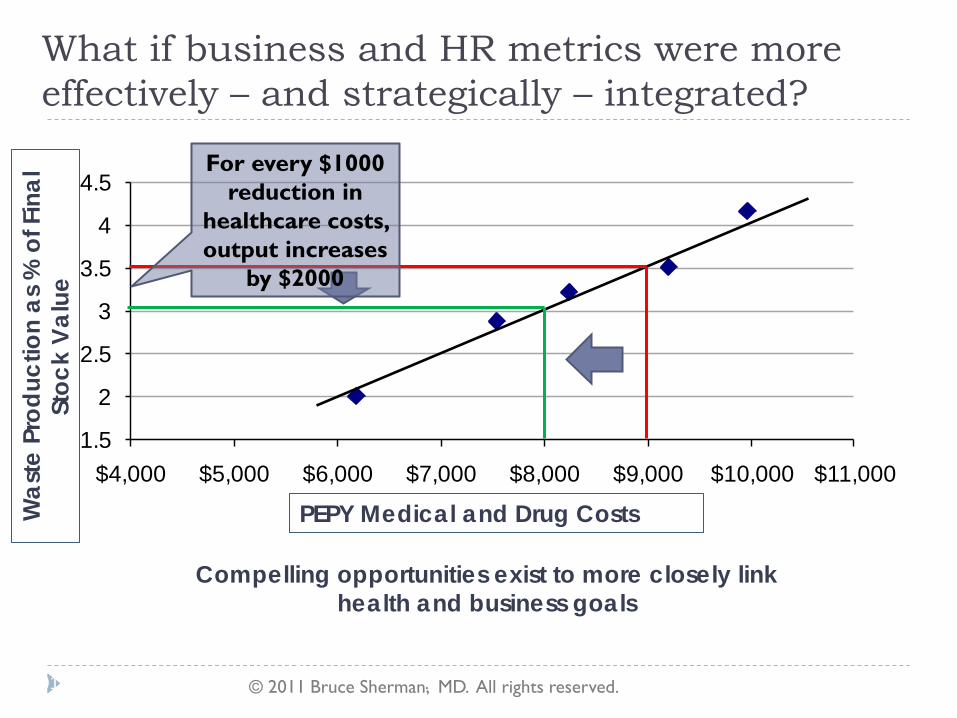
What if business and HR metrics were more effectively – and strategically – integrated?
Compelling opportunities exist to more closely link health and business goals
© 2010 Bruce Sherman, MD. All rights reserved..
1.5
2
2.5
3
3.5
4
4.5
$4,000 $5,000 $6,000 $7,000 $8,000 $9,000 $10,000 $11,000
Was
te P
rodu
ctio
n as
% o
f Fin
al S
tock
Va
lue
PEPY medical/drug costPEPY Medical and Drug Costs Was
te P
rodu
ctio
n as
% o
f Fin
al
Stoc
k Va
lue
7 Source: A Fortune 150 Company. © 2011 Bruce Sherman, MD. All rights reserved.
For every $1000 reduction in
healthcare costs, output increases
by $2000

Companies with health as a business imperative achieve significantly better financial outcomes and lower employee turnover
BETTER MARKET PREMIUM REDUCED TURNOVER RATES
Towers Watson 2009/2010 Staying@Work Report.
Companies that do NOT effectively link health to business imperatives
Companies that effectively treat health as a business imperative
Health as a business imperative
8

Representative business metrics Industry Individual business
performance metrics Aggregate business
performance metrics All industries Supervisor performance evaluation
Workplace accident rate Employee engagement
Voluntary turnover rate OSHA injury rate and WC costs Net income Customer satisfaction
Insurance Average handling time of claims Net written premium amount Number of new insurance policies
Average insurance policy size Average handling time of claims Net written premium Number of new insurance policies
Manufacturing Quantity of merchandise produced Value of merchandise produced Occupational injury prevalence
Throughput/work unit Defects per million opportunities Production plan variance Man-hour per equivalent unit
Retail Shelf stocking efficiency Sales transactions per selling hour
Comp stores sales growth year over year Customer satisfaction Profit per customer visit Sales per selling hour
Call center First call resolution rate Average time to answer calls Calls handled per hour
First call resolution rate Contact quality Customer satisfaction
Adapted from Healthy Employees, Healthy Profits, Optum 2012. Used with permission.

The value of data… Data analysis can focus investment strategies to maximize
not just health, but business value Merge health/productivity and business metrics to
strengthen business case for investments in workforce health and well-being Individual level – health, well-being, and work performance Organization level – business performance and profitability
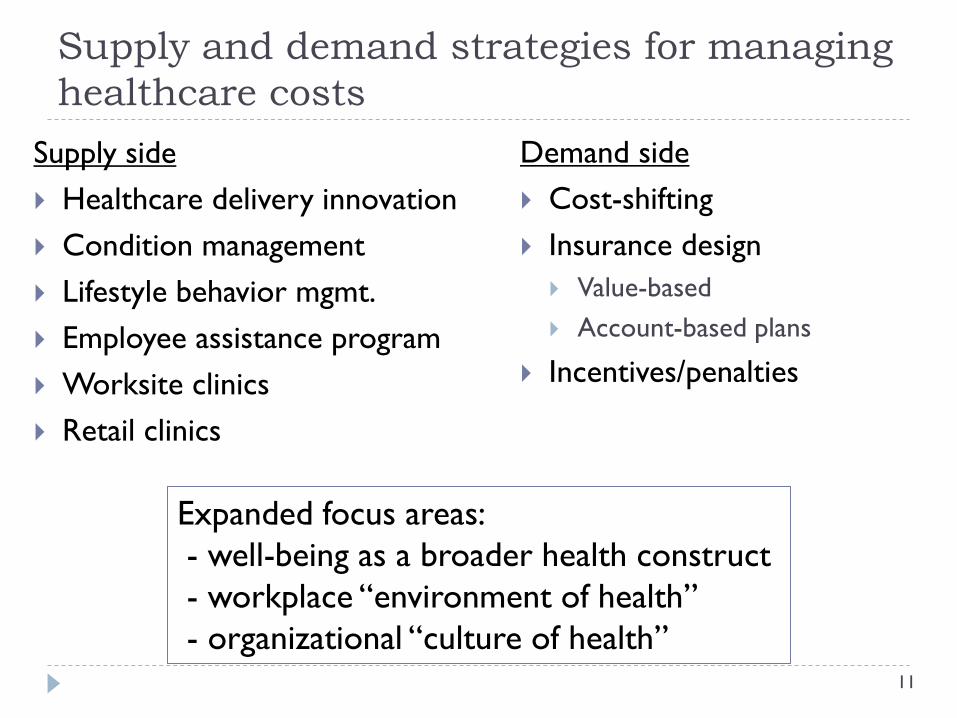
Supply and demand strategies for managing healthcare costs
Supply side Healthcare delivery innovation Condition management Lifestyle behavior mgmt. Employee assistance program Worksite clinics Retail clinics
Demand side Cost-shifting Insurance design Value-based Account-based plans
Incentives/penalties
Expanded focus areas: - well-being as a broader health construct - workplace “environment of health” - organizational “culture of health”
11

Unhealthy Behavior/ Health
Risks
Chronic Conditions
Utilization
Health Care Costs
• Unhealthy behaviors and health risks lead to chronic conditions
• Chronic conditions drive healthcare utilization
• Healthcare utilization drives healthcare costs
More than 75% of healthcare costs are the result of chronic conditions1. About 70% of healthcare costs are due to unhealthy behaviors2.
1 www.cdc.gov/chronicdisease/resources/publications/AAG/chronic.htm 2 The Costs of Unhealthy Behaviors. WELCOA, 2007
The health – cost connection

Employer focus continues to be cost-based
25%
23%17%
12%
6%5%
4%
14%16%
8%
19%3%
12%
6%
10%31%
12%
10%8%
9%9%
1%
4%1%
4%
3%3%
19%
1%
5%
1%
1%3%
Increased employee cost-sharing
Consumer–directed health plan (CDHP)
Wellness initiatives to improve employee health
Care management
Pharmacy benefit design changes
Utilization management
Disease/condition management
Dependent eligibility audit
Specialty drug management initiative
Quality-focused tier networks
Other
Most Effective Tactic Second Most Effective Tactic Third Most Effective Tactic
Q: What do you consider the top 3 most effective steps you have taken or will take to control health care cost increases?

Demand-side strategies Historically focused on cost control Current approaches promote use of high-value services Preventive care Generic medications Incentives Value-based insurance design (VBID/VBBD)
Issues: Can’t manage costs by managing cost Approach assumes healthcare services are commoditized Quality has not been a significant focus

Employer top challenges
These concerns impact employer decision-making regarding benefits strategic planning
Aon Hewitt 2012 Health Care Survey

Unhealthy behaviors are a major focus
2012 Health Care Survey. Aon Hewitt Web site. aon.com/human-capital-consulting/thought-leadership/healthcare/2012_Health_Care_Survey.jsp. Accessed Oct ber 22 2012

Use of financial incentives in wellness programs is becoming more prevalent
1. The 2012 Towers Watson/National Business Group on Health. Employer survey on purchasing value in health care. Towers Watson Web Site. towerswatson.com/assets/pdf/6556/Towers-Watson-NBGH-2012.pdf. Accessed October 23, 2012.

Median incentive amounts for healthy lifestyles are increasing
National Business Group on Health. Large employers’ 2013 health plan design survey. Survey Report, August 2012. National Business Group on Health. Large Employers’ 2013 Health Plan Design Survey

Sample multi-year incentive design Category Year 1
Wellness Goals Year 2
Wellness Goals Year 3
Wellness Goals
Participation in HRA Mandatory Mandatory Mandatory
Tobacco/Nicotine:
Affidavit: Tobacco Free -or-
Completion of Smoking Cessation Program
Negative Test Result -or-
Completion of Smoking Cessation Program
Negative Test Result -or-
Completion of Smoking Cessation Program
Physical Activity Completion of Walking Challenge
Completion of Challenge
Log a minimum of 90 minutes of exercise per week
Age Appropriate Screenings Mandatory Mandatory Mandatory
Blood Pressure: Participate <135/90 <120/80
Glucose: Participate < 125 < 100
Cholesterol: Participate <4.0 (Cardiac Ratio) <4.0 (Cardiac Ratio)
Body Mass Index: Participate <30.0 <27.0
Coaching: Participate Complete Complete
Impact Qualify for Incentive Up to 20% Reduction
in Premium Contribution
Up to 20% Reduction in Premium Contribution
Adapted from Provant Health Solutions, 2012. Used with permission.

PPACA: expanding the role for incentives in benefit design Currently, employers may use up to 20% of the total
amount of an employee’s health insurance premium to provide outcome-based wellness incentives.
In 2014, this will increase to 30% (up to 50% discretion per HHS)
Outcomes-based incentives for healthy behaviors Essential components: Organizational assessment, goals, target
population, design Penalties vs. rewards People may be more motivated to avoid loss (i.e., penalties)
than to make equivalent gains. Rewards for healthy behavior are more consistent with a long-
term strategy of creating a partnership culture.

Supply-side strategies Newer focus for employers/plan sponsors Focus on service delivery efficiency and effectiveness Reflects intent to move “upstream” in the delivery chain
to improve outcomes
What do employers understand about healthcare quality?

Employers aren’t happy with health plan vendors, but don’t appear to be demanding change
16th Annual National Business Group on Health/Towers Watson Employer Survey, 2011.

Employers and the healthcare supply chain Business supply chain vs. healthcare supply chain How have employers impacted the healthcare supply chain? Understanding and incentivizing quality
eValue8 Pay for performance/Bridges to Excellence Leapfrog Community quality reporting initiatives
High performance networks/Centers of Excellence Direct contracting Worksite clinics
23

Employer tactics to improve care quality
16th Annual National Business Group on Health/Towers Watson Employer Survey, 2011.

Employer strategies for monitoring supply-side services
16th Annual National Business Group on Health/Towers Watson Employer Survey, 2011.

Innovative employer strategies to improve quality and lower costs Evolving specialized approaches Consumerism tools Centers of Excellence and direct contracting with bundled
pricing Tiered networks Narrow networks Reference-based pricing Outcomes-based clinician/facility incentive payments Direct contracting with ACOs and worksite clinics

Managing cost and reducing unnecessary expense
Aon Hewitt 2012 Health Care Survey

Employers offering price transparency tools
Large Employers’ 2013 Health Plan Design Survey, NBGH
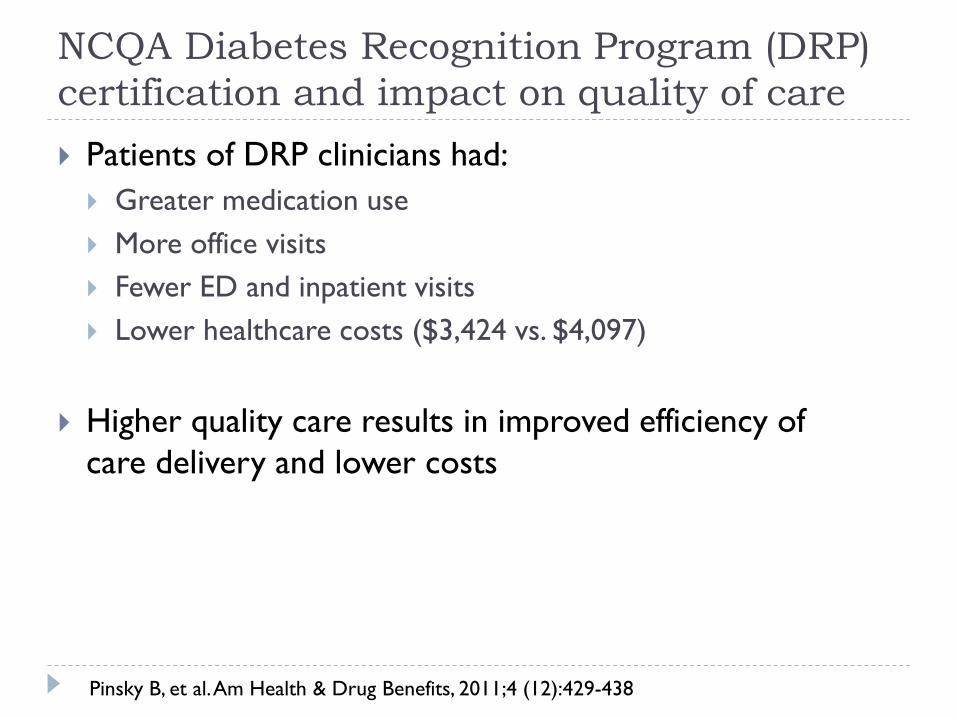
NCQA Diabetes Recognition Program (DRP) certification and impact on quality of care Patients of DRP clinicians had: Greater medication use More office visits Fewer ED and inpatient visits Lower healthcare costs ($3,424 vs. $4,097)
Higher quality care results in improved efficiency of care delivery and lower costs
Pinsky B, et al. Am Health & Drug Benefits, 2011;4 (12):429-438

Direct contracting with providers
Large Employers’ 2013 Health Plan Design Survey, NBGH

Use of COEs and second opinion services
Large Employers’ 2013 Health Plan Design Survey, NBGH

Investments in primary care provide the highest value to the healthcare system
• Wellness programs and retail clinics were not valued as highly • Prescription drugs were rated above hospitals
Large Employers’ 2013 Health Plan Design Survey, NBGH

Typical US employer healthcare cost distribution
6%
39%
34%
19%
Primary care InpatientOutpatient PharmacyEmergency dept.
• By improving care quality with a PCMH, primary care costs will increase • However, implementation of PCMH has been shown to result in lower
hospitalization rates – leading to lower overall health care costs.
15%
31%32%
20%
Current state PCMH implementation
Thomson Reuters and MarketScan and Milliman databases, 2010

Putting it all together: Integrate supply and demand strategies to maximize value Identify high-value services; steer individuals accordingly
Offering Supply strategy Utilization incentive
Centers of Excellence Use quality facilities Waived co-pay
Generic medications Chronic meds Waived co-pay if DM participation
Lifestyle management Outcomes-based, participation-driven
Higher benefit tier for non-participants
Minimally invasive surgery Specific experience Waived co-pay
Reference-based pricing Low cost service use Cap coverage at low cost pricing
Patient-centered medical home
NCQA-recognized practices
Reduced co-pay

Summary: Employer action steps Data drives decision-making Demand actionable data from health plans – identify issues and
opportunities Supply chain strategies: Incorporate meaningful performance metrics into plan contracts Demand system improvements in care delivery – or take independent
action Identify efficient, high quality clinicians and hospitals, and promote use
Demand-side (benefit design) strategies: Understand population health profile and utilization patterns to identify
improvement opportunities – condition management, primary care Prioritize interventions based on anticipated value to the organization
Integrate supply and demand management strategies to maximize value of healthcare investments [expenditures]
Don’t forget to review HR policies to ensure they’re aligned with promoting a healthy workforce

Thanks for your attention! Bruce Sherman, MD [email protected] 216-337-4457