Employer Health Benefits 2005 Annual Survey - Report
140
5.3%* 12.9%* 11.2%* 9.2%* 13.9%† 1999 1998 2001 2000 2002 2003 2004 2005 2005 -and- the kaiser family foundation - AND - health research and educational trust 2005 Annual Survey Employer Health Benefits
Transcript of Employer Health Benefits 2005 Annual Survey - Report

0%
2%
4%
6%
8%
10%
12%
14%
16%
18%
1993 19941988 1989 1990 1991 1992 1995 1996
5.3%*
8.5%
12.0%
18.0%
14.0%12.9%*
11.2%*
9.2%*
13.9%†
0.8%
19991997 1998 20012000 2002 2003 2004 2005
200
5
The Henry J. Kaiser Family Foundation2400 Sand Hill Road
Menlo Park, CA 94025Phone: 650-854-9400 Fax: 650-854-4800
Washington Office:
1330 G Street NW
Washington, DC 20005
Phone: 202-347-5270 Fax: 202-347-5274
www.kff.org
Individual copies of this publication (#7315)
are available on the Kaiser Family Foundation’s website at www.kff.org.
Multiple copies may be obtained from HRET by calling 1-800-242-2626 (order #097514).
The Kaiser Family Foundation is a nonprofit, private operating foundation dedicated to providing information and
analysis on health care issues to policymakers, the media, the health care community, and the general public.
The Foundation is not associated with Kaiser Permanente or Kaiser Industries.
September 2005
Employer H
ealth Benefits 20
05
an
nu
al
su
rv
ey
T
HE
KA
ISE
R F
AM
ILY F
OU
ND
AT
ION
-AN
D- H
EA
LTH
RE
SE
AR
CH
AN
D E
DU
CA
TIO
NA
L T
RU
ST
-and-
the kaiser family foundation- A N D -
health research and educational trust
2 0 0 5 A n n u a l S u r v e y
E m p l o y e rH e a l t h
B e n e f i t s
Graphic design and production: LoganFrancis, Inc., Waldorf, MD
(www.loganfrancis.com)
The Kaiser Family Foundation is a nonprofit, private operating foundation dedicated to providing information and analysis on health care issues to policymakers, the media, the health care community, and the general public. The Foundation is not associated with Kaiser Permanente or Kaiser Industries.
Health Research and Educational Trust is a private, not-for-profit organization involved in research, education, and demonstration programs addressing health management and policy issues. Founded in 1944, HRET, an affiliate of the American Hospital Association, collaborates with health care, government, academic, business, and community organizations across the United States to conduct research and disseminate findings that help shape the future of health care.
Copyright © 2005 Henry J. Kaiser Family Foundation, Menlo Park, California, and Health Research and Educational Trust, Chicago, Illinois. All rights reserved.
Printed in the United States of America.
ISBN 1-55648-329-5
American Hospital Association/Health Research and
Educational Trust Catalog Number 097514
Primary Authors:
kaiser family foundationGary ClaxtonIsadora GilBenjamin Finder
health research and educational trustJon GabelJeremy PickreignHeidi WhitmoreSamantha Hawkins

-and-
the kaiser family foundation- A N D -
health research and educational trust
2 0 0 5 A n n u a l S u r v e y
E m p l o y e r H e a l t h
B e n e f i t s


iii
T H E K A I S E R F A M I LY F O U N D AT I O N - A N D - H E A LT H R E S E A R C H A N D E D U C AT I O N A L T R U S T
T A B L E O F C O N T E N T S
LIST OF EXHIBITS v
SUMMARY OF FINDINGS 1
SURVEY DE SIGN AND METHODS 9
SECTION 1
Cost of Health Insurance 15
SECTION 2
Health Benefits Offer Rates 31
SECTION 3
Employee Coverage, Eligibility, and Participation 39
SECTION 4
Health Plan Choice 49
SECTION 5
Market Shares of Health Plans 55
SECTION 6
Employee Contributions for Premiums 59
SECTION 7
Employee Cost Sharing 75
SECTION 8
High-Deductible Health Plans and Savings Account Options 89
SECTION 9
Prescription Drug Benefits 99
SECTION 10
Plan Funding 107
SECTION 11
Retiree Health Benefits 113
SECTION 12
Employer Opinions and Health Management Programs 119


v
T H E K A I S E R F A M I LY F O U N D AT I O N - A N D - H E A LT H R E S E A R C H A N D E D U C AT I O N A L T R U S T
SURVEY DE SIGN AND METHODS
Exhibit M.1 13Selected Characteristics of Firms in the Survey Sample, 2005
Exhibit M.2 14Distribution of Employers, Workers, and Workers Covered by Health Benefits, by Firm Size, 2005
COST OF HEALTH INSURANCE
Exhibit 1.1 17Increases in Health Insurance Premiums Compared to Other Indicators, 1988-2005
Exhibit 1.2 18Increases in Health Insurance Premiums from the Previous Year, by Plan Type, 1988-2005
Exhibit 1.3 18Increases in Health Insurance Premiums for Covered Workers, by Firm Size, 2005
Exhibit 1.4 19Distribution of Premium Increases for Covered Workers, by Firm Size, 2005
Exhibit 1.5 19Increases in Health Insurance Premiums, by Firm Size and Plan Type, 2005
Exhibit 1.6 20Increases in Health Insurance Premiums, by Plan Type and Funding Arrangement, 2005
Exhibit 1.7 21Increases in Health Insurance Premiums, by Funding Arrangement, 1998-2005
Exhibit 1.8 22Increases in Health Insurance Premiums, by Firm Size, 1996-2005
Exhibit 1.9 23Increases in Health Insurance Premiums, by Region, 1996-2005
Exhibit 1.10 24Increases in Health Insurance Premiums, by Industry, 1996-2005
Exhibit 1.11 25Average Monthly Premiums for Covered Workers, Single and Family Coverage, by Plan Type, 2005
Exhibit 1.12 25Distribution of Single and Family Monthly Premiums for Covered Workers, 2001-2005
Exhibit 1.13 26Monthly and Annual Average Premiums for Covered Workers, by Plan Type and Firm Size, 2005
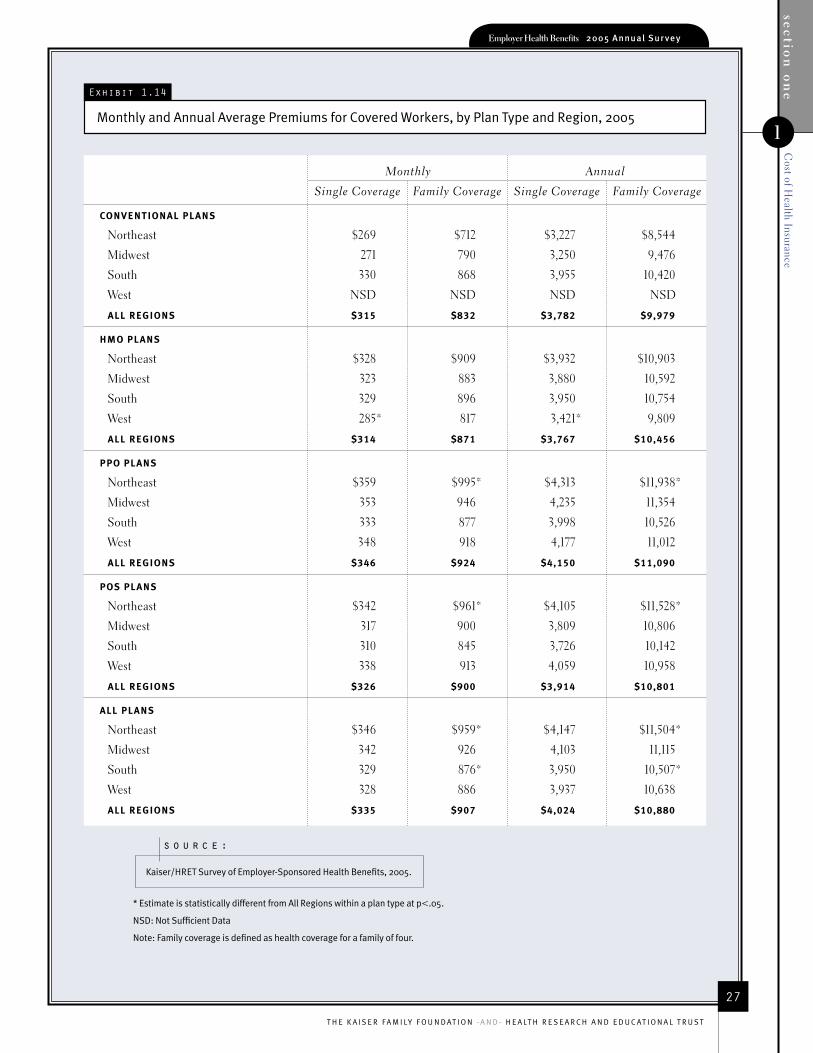
Exhibit 1.14 27Monthly and Annual Average Premiums for Covered Workers, by Plan Type and Region, 2005
Exhibit 1.15 28Monthly and Annual Average Premiums for Covered Workers, by Plan Type and Industry, 2005
HEALTH BENEFITS OFFER RATE S
Exhibit 2.1 34Percentage of Firms Offering Health Benefits, 1996-2005
Exhibit 2.2 35Percentage of Firms Offering Health Benefits, by Firm Size, 1996-2005
Exhibit 2.3 36Percentage of Firms Offering Health Benefits, by Firm Characteristics, 2005
Exhibit 2.4 36Percentage of Firms Offering Health Benefits That Offer Them to Part-Time Workers, by Firm Size, 1999-2005
Exhibit 2.5 37Percentage of Firms Offering Health Benefits That Offer Them to Temporary Workers, by Firm Size, 1999-2005
Exhibit 2.6 37Among Firms Not Offering Health Benefits, Reasons for Not Offering, 2005
L I S T O F E X H I B I T S

T H E K A I S E R F A M I LY F O U N D AT I O N - A N D - H E A LT H R E S E A R C H A N D E D U C AT I O N A L T R U S T
vi
Exhibit 2.7 38Distribution of Firms by the Amounts They Believe They and Their Employees Could Afford to Pay for Health Insurance and by Their Estimate of the Cost of Coverage, Per Month, 2005
Exhibit 2.8 38Among Firms Not Offering Health Benefits, Beliefs About Employees’ Preferences for Higher Wages or Health Insurance Benefits, 2003 and 2005
EMPLOYEE COVERAGE, ELIGIBILIT Y, AND PARTICIPATION
Exhibit 3.1 41Percentage of Workers Covered by Their Employers’ Health Benefits, in Firms Both Offering and Not Offering Health Benefits, by Firm Size, 2000-2005
Exhibit 3.2 42Eligibility, Take-up Rates, and Coverage in Firms Offering Health Benefits, by Firm Size, Region, and Industry, 2005
Exhibit 3.3 43Percentage of Workers Eligible For Health Benefits Offered By Their Employer, by Firm Size, 1999-2005
Exhibit 3.4 43Percentage of Workers in Firms Offering Health Benefits Who Participate in (Take-up) Their Employers’ Health Plan, by Firm Size, 1999-2005
Exhibit 3.5 44Percentage of Workers in Firms Offering Health Benefits Who Are Covered by Their Employers’ Health Plan, by Firm Size, 1999-2005
Exhibit 3.6 44Average Waiting Period for New Employees to be Eligible for Health Coverage, 1999-2005
Exhibit 3.7 45Percentage of Covered Workers in Firms with a Waiting Period for New Employees to Be Covered, by Firm Size, Region, and Industry, 2005
Exhibit 3.8 46Average Waiting Period For New Employees to be Eligible for Health Coverage, by Firm Size, Region, and Industry, 2005
Exhibit 3.9 47Distribution of Covered Workers Electing Single Coverage, Single Plus One Coverage, or Family Coverage, by Firm Size, 2001-2005
HEALTH PLAN CHOICE
Exhibit 4.1 51Percentage of Covered Workers With a Choice of Conventional, HMO, PPO, or POS Plans, 1988-2005
Exhibit 4.2 52Distribution of Firms Providing a Choice of Health Plans, by Firm Size, 2005
Exhibit 4.3 52Distribution of Covered Workers With a Choice of Health Plans, 1988-2005
Exhibit 4.4 53Distribution of Covered Workers With a Choice of Health Plans, by Firm Size, 1996-2005
Exhibit 4.5 54Distribution of Covered Workers With a Choice of Health Plans, by Region, 2005
Exhibit 4.6 54Distribution of Covered Workers With One or More Options of the Same Plan Type, by Firm Size, 2005
MARKET SHARE S OF HEALTH PLANS
Exhibit 5.1 57Distribution of Health Plan Enrollment for Covered Workers, by Plan Type, 1988-2005
Exhibit 5.2 58Health Plan Enrollment, by Firm Size, Region, and Industry, 2005
EMPLOYEE CONTRIBUTIONS FOR PREMIUMS
Exhibit 6.1 61Average Monthly Worker Premium Contributions for Single and Family Coverage, 1988-2005
Exhibit 6.2 61Average Percentage of Premium Paid by Covered Workers for Single and Family Coverage, 1988-2005
Exhibit 6.3 62Average Annual Premiums for Covered Workers for Single and Family Coverage, by Plan Type, 2005

vii
T H E K A I S E R F A M I LY F O U N D AT I O N - A N D - H E A LT H R E S E A R C H A N D E D U C AT I O N A L T R U S T
Exhibit 6.4 63Average Monthly Worker Premium Contributions for Single and Family Coverage, by Plan Type and Firm Size, 2005
Exhibit 6.5 64Average Monthly Worker Premium Contributions for Single and Family Coverage, by Plan Type and Firm Size, 2005
Exhibit 6.6 65Average Monthly Worker Premium Contributions for Single and Family Coverage in Conventional and HMO Plans, 1988-2005
Exhibit 6.7 65Monthly Worker Contributions for Single and Family Coverage in PPO and POS Plans, 1988-2005
Exhibit 6.8 66Distribution of Covered Workers by Percentage of Single Premium Contributed by Their Firm, by Firm Size, 2001-2005
Exhibit 6.9 67Distribution of Covered Workers by Percentage of Family Premium Contributed by Their Firm, by Firm Size, 2005
Exhibit 6.10 68Average Percentage of Single and Family Premiums Paid by Covered Workers, by Firm Characteristics, 2005
Exhibit 6.11 69Average Percentage of Premium Paid by Firm for Covered Workers, by Plan Type and Firm Size, 2005
Exhibit 6.12 70Average Percentage of Premium Paid by Covered Workers in Conventional and HMO Plans, 1988-2005
Exhibit 6.13 70Average Percentage of Premium Paid by Covered Workers in PPO and POS Plans, 1988-2005
Exhibit 6.14 71Average Percentage of Premium Paid by Firm for Covered Workers, by Plan Type and Region, 2005
Exhibit 6.15 72Percentage of Premium Paid by Firm for Covered Workers, by Plan Type and Industry, 2005
Exhibit 6.16 74Percentage of Covered Workers in Firms That Vary Worker Premium Contributions by Wage Level or by Participation in Wellness Program, by Firm Size and Region, 2005
EMPLOYEE COST SHARING
Exhibit 7.1 78Percentage of Covered Workers With the Following Types of Cost Sharing for Health Benefits, 2005
Exhibit 7.2 79Average Annual Deductibles for Covered Workers With Single Coverage, by Plan Type, 1988-2005
Exhibit 7.3 79Average Annual Deductibles for Covered Workers With Family Coverage, by Plan Type, 1988-2005
Exhibit 7.4 80Average Annual Deductibles for Covered Workers for Single and Family Coverage, by Plan Type and Firm Size, 2005
Exhibit 7.5 81Average Annual Deductibles for Covered Workers for Single and Family Coverage, by Plan Type and Region, 2005
Exhibit 7.6 82Distribution of Covered Workers With the Following Annual Deductibles for PPO Plans, Single and Family Coverage, 2000-2005
Exhibit 7.7 82Distribution of Covered Workers With the Following Annual Deductibles for POS Plans, Single and Family Coverage, 2000-2005
Exhibit 7.8 83Among Covered Workers Facing Copayments for Physician Office Visits, Distribution of Copayments by Plan Type, 2004-2005
Exhibit 7.9 83Among Covered Workers in HMOs Facing Copayments for Physician Office Visits, Percentage with Various Copayments, 1996-2005
T H E K A I S E R F A M I LY F O U N D AT I O N - A N D - H E A LT H R E S E A R C H A N D E D U C AT I O N A L T R U S T
viii
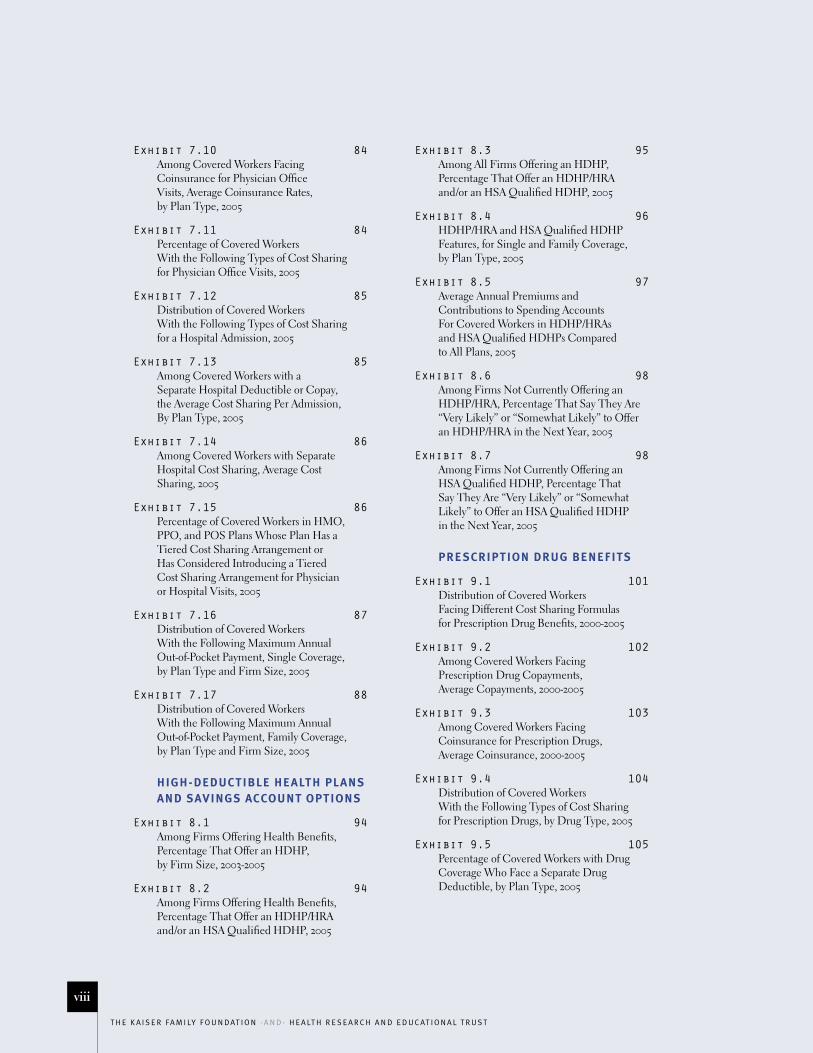
Exhibit 7.10 84Among Covered Workers Facing Coinsurance for Physician Office Visits, Average Coinsurance Rates, by Plan Type, 2005
Exhibit 7.11 84Percentage of Covered Workers With the Following Types of Cost Sharing for Physician Office Visits, 2005
Exhibit 7.12 85Distribution of Covered Workers With the Following Types of Cost Sharing for a Hospital Admission, 2005
Exhibit 7.13 85Among Covered Workers with a Separate Hospital Deductible or Copay, the Average Cost Sharing Per Admission, By Plan Type, 2005
Exhibit 7.14 86Among Covered Workers with Separate Hospital Cost Sharing, Average Cost Sharing, 2005
Exhibit 7.15 86Percentage of Covered Workers in HMO, PPO, and POS Plans Whose Plan Has a Tiered Cost Sharing Arrangement or Has Considered Introducing a Tiered Cost Sharing Arrangement for Physician or Hospital Visits, 2005
Exhibit 7.16 87Distribution of Covered Workers With the Following Maximum Annual Out-of-Pocket Payment, Single Coverage, by Plan Type and Firm Size, 2005
Exhibit 7.17 88Distribution of Covered Workers With the Following Maximum Annual Out-of-Pocket Payment, Family Coverage, by Plan Type and Firm Size, 2005
HIGH-DEDUCTIBLE HEALTH PLANS AND SAVINGS ACCOUNT OPTIONS
Exhibit 8.1 94Among Firms Offering Health Benefits, Percentage That Offer an HDHP, by Firm Size, 2003-2005
Exhibit 8.2 94Among Firms Offering Health Benefits, Percentage That Offer an HDHP/HRA and/or an HSA Qualified HDHP, 2005
Exhibit 8.3 95Among All Firms Offering an HDHP, Percentage That Offer an HDHP/HRA and/or an HSA Qualified HDHP, 2005
Exhibit 8.4 96HDHP/HRA and HSA Qualified HDHP Features, for Single and Family Coverage, by Plan Type, 2005
Exhibit 8.5 97Average Annual Premiums and Contributions to Spending Accounts For Covered Workers in HDHP/HRAs and HSA Qualified HDHPs Compared to All Plans, 2005
Exhibit 8.6 98Among Firms Not Currently Offering an HDHP/HRA, Percentage That Say They Are “Very Likely” or “Somewhat Likely” to Offer an HDHP/HRA in the Next Year, 2005
Exhibit 8.7 98Among Firms Not Currently Offering an HSA Qualified HDHP, Percentage That Say They Are “Very Likely” or “Somewhat Likely” to Offer an HSA Qualified HDHP in the Next Year, 2005
PRE SCRIPTION DRUG BENEFITS
Exhibit 9.1 101Distribution of Covered Workers Facing Different Cost Sharing Formulas for Prescription Drug Benefits, 2000-2005
Exhibit 9.2 102Among Covered Workers Facing Prescription Drug Copayments, Average Copayments, 2000-2005
Exhibit 9.3 103Among Covered Workers Facing Coinsurance for Prescription Drugs, Average Coinsurance, 2000-2005
Exhibit 9.4 104Distribution of Covered Workers With the Following Types of Cost Sharing for Prescription Drugs, by Drug Type, 2005
Exhibit 9.5 105Percentage of Covered Workers with Drug Coverage Who Face a Separate Drug Deductible, by Plan Type, 2005

ix
T H E K A I S E R F A M I LY F O U N D AT I O N - A N D - H E A LT H R E S E A R C H A N D E D U C AT I O N A L T R U S T
PLAN FUNDING
Exhibit 10.1 109Percentage of Covered Workers in Partially or Completely Self-Funded Plans, by Firm Size, 1999-2005
Exhibit 10.2 110Percentage of Covered Workers in Partially or Completely Self-Funded Plans, by Plan Type, 1999-2005
Exhibit 10.3 111Percentage of Covered Workers in Partially or Completely Self-Funded HMO Plans, by Firm Size, 1999-2005
Exhibit 10.4 111Percentage of Covered Workers in Partially or Completely Self-Funded PPO Plans, by Firm Size, 1999-2005
Exhibit 10.5 112Percentage of Covered Workers in Partially or Completely Self-Funded POS Plans, by Firm Size, 1999-2005
Exhibit 10.6 112Percentage of Covered Workers With Different Funding Arrangements, by Industry, 2005
RETIREE HEALTH BENEFITS
Exhibit 11.1 115Percentage of All Large Firms (200 or More Workers) Offering Retiree Health Benefits, 1988-2005
Exhibit 11.2 116Percentage of Firms Offering Retiree Health Benefits, by Firm Size, Region, and Industry, 2005
Exhibit 11.3 117Percentage of All Large Firms (200 or More Workers) Offering Retiree Health Benefits, by Firm Characteristics, 2005
Exhibit 11.4 117Among All Large Firms (200 or More Workers) Offering Retiree Coverage, Percentage Offering Health Benefits to Early and Medicare-Age Retirees, 1999-2005
Exhibit 11.5 118Among All Large Firms (200 or More Workers) Offering Retiree Health Coverage, Percentage Offering Retiree Benefits to Early and Medicare-Age Retirees, by Firm Size, Region, and Industry, 2005
EMPLOYER OPINIONS AND HEALTH MANAGEMENT PROGRAMS
Exhibit 12.1 122Among Firms That Offer Health Benefits, Percentage That Shopped for a New Plan or Insurance Carrier, and the Percentage of These Firms That Changed Plan Types or Insurance Carriers in the Last Year, by Firm Size, 2005
Exhibit 12.2 123Among All Firms Both Offering and Not Offering Health Benefits, Percentage Offering Wellness Programs To Their Employees, by Firm Size, Region, and Industry, 2005
Exhibit 12.3 124Percentage of Covered Workers in Plans with Utilization Management Provisions, by Firm Size, Plan Type, Region, and Industry, 2005
Exhibit 12.4 125Percentage of Covered Workers in Plans With A Disease Management Program and, Among Those, Percentage with Specific Programs, 2005
Exhibit 12.5 126Among All Firms Both Offering and Not Offering Health Benefits, Distribution of Firms’ Opinions on the Effectiveness of the Following Strategies to Contain Health Insurance Costs, 2005
Exhibit 12.6 127Distribution of Firms Reporting The Likelihood of Making the Following Changes in the Next Year, by Firm Size, 2005


T H E K A I S E R F A M I LY F O U N D AT I O N - A N D - H E A LT H R E S E A R C H A N D E D U C AT I O N A L T R U S T
1
The key findings from this year’s survey
show that the rate of growth of health
insurance premiums declined for the
second straight year, slowing to 9.2%
in 2005, and that the percentage of all
firms offering health benefits to their
employees has fallen significantly from
69% to 60% over the last 5 years.
The 2005 findings also show growth in
the percentage of firms offering health
benefits that offer a highdeductible
health plan (HDHP) to at least some
of their employees. Twenty percent of
firms that offer health benefits offer a
highdeductible health plan. These firms
are beginning to look at new consumer-
driven arrangements. Among all firms
that offer health benefits, 1.9% offer an
HDHP with a health reimbursement
arrangement (HRA), covering 1.6 million
workers, and 2.3% offer an HDHP that
meets federal requirements enabling
a worker to establish a health savings
account (HSA), covering 810,000
workers.
H E A L T H I N S U R A N C E
P R E M I U M S
Between spring of 2004 and spring of 2005, premiums for employersponsored health insurance rose by 9.2%, lower than
the 11.2% increase in 2004 and the 13.9% increase in 2003 (EXHIBIT A).2 Despite this slowdown, premiums continued to increase much faster than overall inflation (3.5%) and wage gains (2.7%). Since 2000, premiums for family coverage
have increased by 73%, compared with inflation growth of 14% and wage growth of 15%. Average annual premiums for employer-sponsored coverage rose to $4,024 for single coverage and $10,880 for family coverage (EXHIBIT B).
E X H I B I T AIncreases in Health Insurance Premiums Compared to Other Indicators,1988-2005
0%
2%
4%
6%
8%
10%
12%
14%
16%
18%
19991996 1997 19981993 1994 19951988 1989 1990 1991 1992 20012000 2002 2003 2004 2005
5.3*
0.8
8.5
12.0
18.0
14.0
8.2*
10.9*
12.9*
9.2*
11.2*
13.9†
HEALTH INSURANCEPREMIUMS
WORKERS’ EARNINGS
OVERALL INFLATION
1988
12.0
3.9
3.1
1989
18.0
5.1
4.2
1990
14.0
4.7
3.9
1993
8.5
3.2
2.5
1996
0.8
2.9
3.3
1999
5.3*
2.3
3.6
2000
8.2*
3.1
3.9
2001
10.9*
3.3
4.0
2002
12.9*
1.6
2.6
2003
13.9†
2.2
2.9
2004
11.2*
2.3
2.2
2005
9.2*
3.5
2.7
* Estimate is statistically different from the previous year shown at p<.05. No statistical tests were conducted for years prior to 1999.
† Estimate is statistically different from the previous year shown at p<.10.
Note: Data on premium increases reflect total health insurance premiums for a family of four. Historical estimates of workers’ earnings have been updated to reflect new industry classifications (NAICS).
Source: Kaiser/HRET Survey of Employer-Sponsored Health Benefi ts: 1999-2005; KPMG Survey of Employer-Sponsored Health Benefits: 1993, 1996; The Health Insurance Association of America (HIAA): 1988, 1989, 1990; Bureau of Labor Statistics, Consumer Price Index, U.S. City Average of Annual Inflation (April to April), 1988-2005; Bureau of Labor Statistics, Seasonally Adjusted Data from the Current Employment Statistics Survey (April to April),1988-2005.
S u m m a r y o f F i n d i n g s
E M P L O Y E R - S P O N S O R E D H E A L T H I N S U R A N C E P R O V I D E S C O V E R A G E F O R 1 6 0 M I L L I O N A M E R I C A N S , R E A C H -
I N G N E A R L Y T H R E E O F E V E R Y F I V E O F T H E N O N E L D E R L Y . 1 T O P R O V I D E C U R R E N T I N F O R M A T I O N A B O U T T H E
N A T U R E O F E M P L O Y E R - S P O N S O R E D H E A L T H B E N E F I T S , T H E K A I S E R F A M I L Y F O U N D A T I O N ( K F F ) A N D T H E
H E A L T H R E S E A R C H A N D E D U C A T I O N A L T R U S T ( H R E T ) C O N D U C T A N A N N U A L N A T I O N A L S U R V E Y O F P R I V A T E
A N D P U B L I C E M P L O Y E R S O F T H R E E O R M O R E W O R K E R S .

2
T H E K A I S E R F A M I LY F O U N D AT I O N - A N D - H E A LT H R E S E A R C H A N D E D U C AT I O N A L T R U S T
E X H I B I T B
Average Annual Premiums for Covered Workers for Single and Family Coverage, by Plan Type, 2005
CONVENTIONAL
SINGLE
FAMILY
HMO
SINGLE
FAMILY
ALL PLANS
SINGLE
FAMILY
PPO
SINGLE
FAMILY
POS
SINGLE
FAMILY
$0 $2,000 $4,000 $6,000 $8,000 $10,000 $12,000
$498 $3,284 $3,782
$2,321 $7,658 $9,979
$563 $3,203 $3,767*
$2,604 $7,852 $10,456*
$603 $3,548 $4,150*
$2,641 $8,449 $11,090
$731 $3,183 $3,914
$3,250 $7,551 $10,801
$610 $3,413 $4,024
$2,713 $8,167 $10,880
WORKER CONTRIBUTION
FIRM CONTRIBUTION
* Estimate of total premium is statistically different from All Plans by coverage type shown at p<.05.
Note: Family coverage is defined as health coverage for a family of four.
Source: Kaiser/HRET Survey of Employer-Sponsored Health Benefits, 2005.
E X H I B I T C
Distribution of Covered Workers by Percentage of Premium Contributed by Their Firm for Single and FamilyCoverage, by Firm Size, 2005
LESS THAN 50%
GREATER THAN OR EQUAL TO 50%, LESS THAN 75%
GREATER THAN OR EQUAL TO 75%, LESS THAN 100%
100%
0% 10% 20% 30% 40% 50% 60% 70% 80% 90% 100%
SINGLE COVERAGE
FAMILY COVERAGE
ALL SMALL FIRMS(3–199 WORKERS)
ALL LARGE FIRMS(200 OR MORE WORKERS)
ALL FIRMS
ALL SMALL FIRMS(3–199 WORKERS)
ALL LARGE FIRMS(200 OR MORE WORKERS)
ALL FIRMS
6% 18% 36% 41%
1% 20% 67% 12%
19% 57% 21%
23% 37% 22% 18%
7% 30% 57% 5%
32% 9%
3%
13% 46%
Note: Family coverage is defi ned as health coverage for a family of four.
Source: Kaiser/HRET Survey of Employer-Sponsored Health Benefits, 2005.

T H E K A I S E R F A M I LY F O U N D AT I O N - A N D - H E A LT H R E S E A R C H A N D E D U C AT I O N A L T R U S T
3
Although the average premium increase for 2005 is 9.2%, many covered workers are in firms that experienced premium changes that were substantially above or below the average: 32% of covered workers work for firms where premiums increased by 5% or less, while 17% of covered workers work for firms where premiums increased by more than 15%. Premiums in fully insured plans and premium equivalents in selffunded plans grew at similar rates.
Preferred provider organizations (PPOs) cover a majority of covered workers, but health maintenance organizations (HMOs) remain less expensive. The average annual PPO premium is $4,150 for single coverage and $11,090 for family coverage, compared to average annual HMO premiums of $3,767 for single coverage and $10,456 for family coverage.
Almost 80% of covered workers with single coverage, and over 90% of covered workers with family coverage make a contribution toward premiums in
2005 (EXHIBIT C). Workers on average contribute $610 of the $4,024 annual cost of single coverage and $2,713 of the $10,880 annual cost of family coverage (EXHIBIT B). Covered workers in small firms (3–199 workers) on average make a significantly higher contribution toward family coverage than covered workers in large firms (200 or more workers) ($3,170 vs. $2,487). The average percentage of premiums paid by workers is statistically unchanged over the last several years, at 16% for single coverage and 26% for family coverage (EXHIBIT D).
E M P L O Y E E C O S T S H A R I N G
In addition to their premium contributions, most workers make payments when they use health care services. Fifty-six percent of covered workers are in a health plan that requires that a deductible be met for single coverage before most plan benefits are provided. In PPOs, the most common plan type, the average deductible for in-network services is $323 for single
coverage and $679 for family coverage. Across all plan types, average deductibles for single coverage in small firms (3–199 workers) are substantially higher than average deductibles in large firms (200 or more workers).
More than half of covered workers face separate cost sharing when they are admitted to a hospital. Thirtysix percent of covered workers face a separate deductible or copayment for each hospital admission, with an average payment of $241. Ten percent of workers face separate coinsurance when they are hospitalized, with an average coinsurance rate of 16%. An additional 3% of workers face both a deductible or copayment and coinsurance when hospitalized.
The vast majority of covered workers face copayments when they go to the doctor or fill a prescription. Copayments for physician office visits changed little in 2005. Fortyfour percent of covered workers are in a plan with a $20 or $25
0%
5%
10%
15%
20%
25%
30%
35%
FAMILY COVERAGESINGLE COVERAGE
11%
21%
26%
1988
1996
1999
2001
2003
2004
2005
27%
29%
16% 16% 16%14%*
27%
14%
26%28% 28%
E X H I B I T D
Average Percentage of Premium Paid by Covered Workers for Single and Family Coverage, 1988–2005
* Estimate is statistically different from the previous year shown at p<.05. No statistical tests were conducted for years prior to 1999.
Note: Family coverage is defined as health coverage for a family of four.
Source: Kaiser/HRET Survey of Employer-Sponsored Health Benefits, 1999-2005; KPMG Survey of Employer-Sponsored Health Benefits, 1996; The Health Insurance Association of America (HIAA), 1988.

4
T H E K A I S E R F A M I LY F O U N D AT I O N - A N D - H E A LT H R E S E A R C H A N D E D U C AT I O N A L T R U S T
copayment. For workers covered by multi-tier drug plans, the average copayments are $10 for generic drugs, $22 for preferred drugs, and $35 for nonpreferred drugs. A small percentage of plans have added a fourth tier of prescription drug cost sharing, with an average copayment in that tier of $74.
A V A I L A B I L I T Y O F E M P L O Y E R -
B A S E D C O V E R A G E
While the percentage of firms offering health benefits is statistically unchanged from last year, it has declined over the last few years. Annual changes have been small, but the cumulative result is a statistically significant decline in
the percentage of firms offering health benefits, from 69% in 2000 to 60% in 2005. This drop is driven largely by a significant decline in the percentage of small firms (3–199 workers) offering coverage, which has fallen from 68% to 59% over the same period.
0%
20%
40%
60%
80%
100%
3-9 WORKERS 10-24 WORKERS 25-49 WORKERS 50-199 WORKERS(3-199 WORKERS)
ALL SMAL FIRMS(3-199 WORKERS)
ALL LARGE FIRMS(200 OR MORE WORKERS)
53 5247
74 74 72
9086
9187 87
9397*97 95 92 93
1996
1999
2000
2002
2004
2005
57
70*
99 99 99 98†99 98
5965† 68 66 63 5956
78 8086
58
E X H I B I T E
Percentage of Firms Offering Health Benefits, by Firm Size, 1996-2005
* Estimate is statistically different from the previous year shown at p<.05.
† Estimate is statistically different from the previous year shown at p<.10.
Source: Kaiser/HRET Survey of Employer-Sponsored Health Benefits, 1999-2005; KPMG Survey of Employer-Sponsored Health Benefits, 1996.
E X H I B I T F
Among Firms Offering Health Benefits, Percentage That Offer an HDHP, by Firm Size, 2003-2005
2003
2004
2005
0%
20%
40%
60%
80%
100%
ALL SMALL FIRMS(3-199 WORKERS)
MIDSIZE FIRMS(200-999 WORKERS)
LARGE FIRMS(1,000-4,999 WORKERS)
JUMBO FIRMS(5,000 OR MORE WORKERS)
ALL FIRMS
5%10%
20%*
5% 7%
20%*
5%9%*
20%* 17% 20%
33%*
5%10%
20%*
* Estimate is statistically different from the previous year shown at p<.05. We note that the definition of an HDHP has changed somewhat over the past three surveys (see endnote 4).
Note: The prevalence shown above is for all HDHPs, regardless of whether they are offered with an HRA, are HSA qualified, or neither.
Source: Kaiser/HRET Survey of Employer-Sponsored Health Benefits, 2003-2005.
T H E K A I S E R F A M I LY F O U N D AT I O N - A N D - H E A LT H R E S E A R C H A N D E D U C AT I O N A L T R U S T
5
The health benefits offer rate continues to vary substantially by firm size: only 47% of the smallest companies (3–9 workers) offer health benefits, compared to 72% of firms with 10–24 workers, 87% of firms with 25–49, and over 90% of firms with 50 or more workers (EXHIBIT E).
Even when a firm offers health insurance, not all workers get covered. Some workers are not eligible to enroll as a result of waiting periods or minimum work-hour rules, and others choose not to enroll because they must pay a share of the premium or can get coverage through a spouse. Within offering firms, 80% of workers are eligible for coverage, and 83% of those eligible elect to enroll.
H E A LT H P L A N E N R O L L M E N T
Enrollment in PPOs grew over the last year, while HMO enrollment declined. PPOs continue to be the most common
plan in 2005, enrolling 61% of employees with health coverage, up from 55% in 2004.3 HMO enrollment fell to 21% of covered workers from 25% in 2004. POS enrollment, which has been declining in recent years, remained stable this year at 15%.
U T I L I Z A T I O N M A N A G E M E N T
A N D D I S E A S E M A N A G E M E N T
About eight-in-ten workers (81%) with job-based coverage are in a health plan that uses case management for large claims. Prior certification for inpatient services (75% of covered workers) and outpatient surgery (55% of covered workers) also apply to most covered workers.
Over half of covered workers (56%) are in a plan with at least one disease management program. Among workers in these plans, virtually all are in a plan that provides management for diabetes,
and high percentages are in plans that provide management for asthma (86%), hypertension (82%), and high cholesterol (66%).
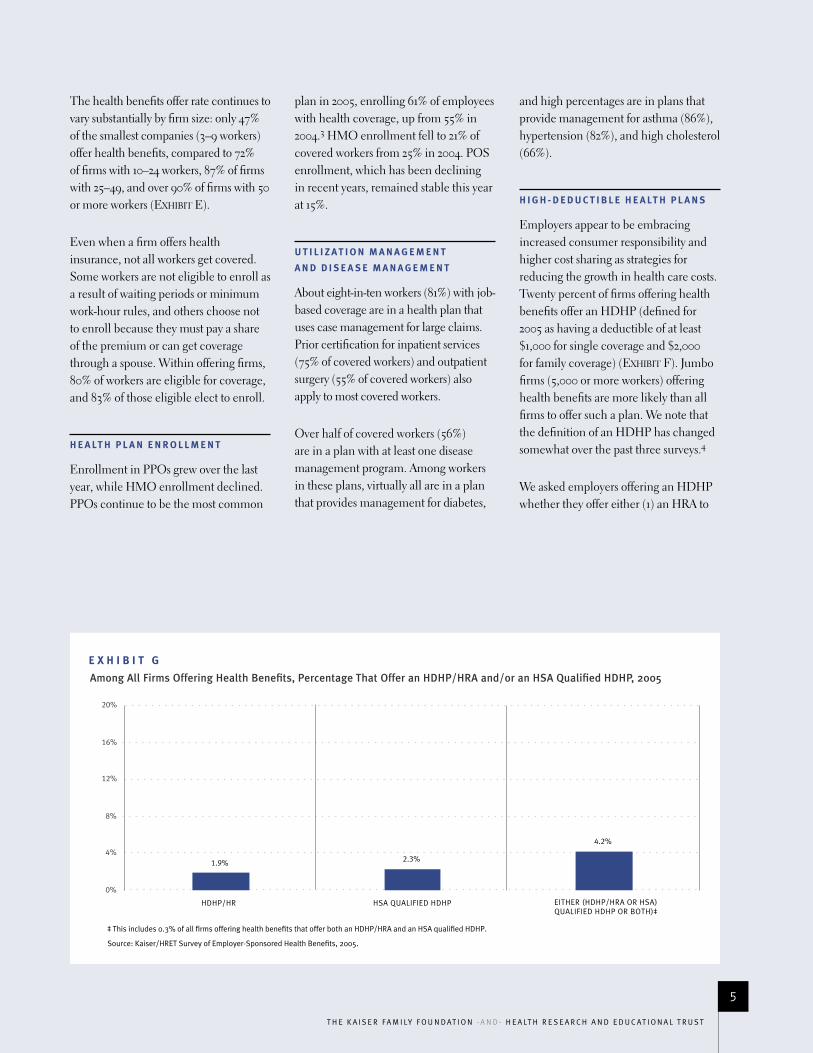
H I G H - D E D U C T I B L E H E A LT H P L A N S
Employers appear to be embracing increased consumer responsibility and higher cost sharing as strategies for reducing the growth in health care costs. Twenty percent of firms offering health benefits offer an HDHP (defined for 2005 as having a deductible of at least $1,000 for single coverage and $2,000 for family coverage) (EXHIBIT F). Jumbo firms (5,000 or more workers) offering health benefits are more likely than all firms to offer such a plan. We note that the definition of an HDHP has changed somewhat over the past three surveys.4
We asked employers offering an HDHP whether they offer either (1) an HRA to
0%
4%
8%
12%
16%
20%
HDHP/HR HSA QUALIFIED HDHP EITHER (HDHP/HRA OR HSA)QUALIFIED HDHP OR BOTH)‡
1.9% 2.3%
4.2%
E X H I B I T G
Among All Firms Offering Health Benefits, Percentage That Offer an HDHP/HRA and/or an HSA Qualified HDHP, 2005
‡ This includes 0.3% of all firms offering health benefits that offer both an HDHP/HRA and an HSA qualified HDHP.
Source: Kaiser/HRET Survey of Employer-Sponsored Health Benefits, 2005.

6
T H E K A I S E R F A M I LY F O U N D AT I O N - A N D - H E A LT H R E S E A R C H A N D E D U C AT I O N A L T R U S T
their employees (referred to here as an “HDHP/HRA”) or (2) an HDHP that permits their employees to establish an HSA (referred to here as an “HSA qualified HDHP”). Among all firms offering health benefits, 1.9% offer an HDHP/HRA, with 1.6 million workers enrolled in the HDHP/HRA, and 2.3% offer an HSA qualified HDHP, with 810,000 workers enrolled in the HSA qualified HDHP (EXHIBIT G).5 About 25% of workers offered an HDHP/HRA and about 15% of workers offered an HSA qualified HDHP participate in the arrangement that is offered.
As expected, deductibles in these arrangements are relatively high: in HDHP/HRAs, annual deductibles average $1,870 for single coverage and $3,686 for family coverage; in HSA qualified HDHPs, annual deductibles
average $1,901 for single coverage and $4,070 for family coverage. The average premiums for the HDHPs in these arrangements are generally lower than average health plan premiums overall, although these differences lessen or disappear when employer contributions to the spending accounts are added to the premium. The average total annual spending for HDHP/HRAs (premiums plus employer contributions to the HRA) is not statistically different than average annual health plan premiums for either single or family coverage. In contrast, the average total annual spending for HSA qualified HDHPs is significantly lower for both single and family coverage than annual average premiums for health plans generally (EXHIBIT H).
On average, workers enrolled in an HDHP/HRA receive an annual
employer contribution to their HRA of $792 for single coverage and $1,556 for family coverage. Workers enrolled in an HSA qualified HDHP on average receive an annual employer contribution to their HSA of $553 for single coverage and $1,185 for family coverage.6 About one-in-three employers offering an HSA qualified HDHP (covering about 35% of workers enrolled in these plans) does not contribute to HSAs established by their employees.
R E T I R E E C O V E R A G E
The implementation of the new Medicare Part D drug benefit, combined with cutbacks in coverage by several large national firms, has put a spotlight on retiree health benefits. In 2005, 33% of large firms (200 or more workers) offer retiree health coverage, virtually
E X H I B I T H
Average Annual Premiums and Contributions to Spending Accounts for Covered Workers in HDHP/HRAs and HSA Qualified HDHPs Compared to All Plans, 2005
H SA QUALIFIED HDHP ALL PLANS‡
Single Family Single Family Single Family
Total Annual Premium $3,503* $8,530* $2,700* $7,909* $4,024 $10,880
Worker Contribution to Premium $423 $2,654 $431 $1,664* $610 $2,713
Firm Contribution to Premium $3,080 $5,876* $2,270* $6,245* $3,413 $8,167
TOTAL ANNUAL FIRM CONTRIBUTION
(F I RM SHAR E OF PR E M I U M PLUS $3,872* $7,538 $2,850 $7,337 $3,413 $8,167
CONTR I B UTION TO H RA O R HSA)
TOTAL ANNUAL SPENDING
(TOTAL PR E M I U M PLUS F I RM $4,295 $10,193 $3,280* $9,001* $4,024 $10,880
CONTR I B UTION TO H RA O R HSA)
* Estimate is statistically different from All Plans by coverage type at p<.05.
‡ All Plans refers to all conventional, HMO, PPO, and POS plans in the survey, not just HDHP/HRAs or HSA qualified HDHPs.
Note: Average Firm Contributions to the HSA or HRA cannot be calculated by subtracting the average Total Annual Premium from the average Total Annual Spending due to varying sample sizes. Some firms provided data for premiums and worker contributions that were inconsistent with other data they provided about their HDHP/HRA or HSA qualified HDHP. These data were excluded from estimates of the average premium, worker contribution, and firm contribution for the HDHP; therefore there are fewer cases used in calculating those averages than for the average firm contribution to the HSA or HRA.
Source: Kaiser/HRET Survey of Employer-Sponsored Health Benefits, 2005.

T H E K A I S E R F A M I LY F O U N D AT I O N - A N D - H E A LT H R E S E A R C H A N D E D U C AT I O N A L T R U S T
7
the same percentage as last year, but down from 66% in 1988. Among large firms offering retiree benefits, virtually all (94%) offer benefits to early retirees, while just over 81% offer benefits to Medicare-age retirees.
O U T L O O K F O R T H E F U T U R E
Although growth in health insurance premiums has moderated in each of the last two years, it continues to outpace inflation and average wage growth by wide margins. Over the last five years (since 2000), health insurance premiums have grown by 73%, compared with cumulative inflation of around 14% and cumulative wage growth of 15%.
This rapid growth of health care premiums relative to the rest of the economy appears to be placing significant strains on the employer sponsored health insurance system. Over the past five years, the percentage
of employers offering health benefits has fallen from 69% to 60%, with the decline occurring predominantly among small firms (3- 199 workers). This decline has helped drive a reduction in the percentage of workers covered by health insurance offered through their own employer, which has fallen from 63% of workers in 2000 to 60% in 2005.
To address cost issues, employers are broadly making use of disease management and utilization management, but continue to move away from HMOs, whose premiums are generally below more prevalent PPOs. Employers also have looked to higher cost sharing over the past few years, first through increases in deductibles and copayments, and more recently in the form of new plan types. While cost sharing grew little on average over the past year, we do see an increase in the offering of HDHPs and the emergence of new consumer-driven plans. We expect the prevalence of
these consumer-driven approaches to grow, despite the fact that only 16% of employers say that they believe that these plans will be “very effective” in controlling health care costs.
Health insurance premiums for a family of four now average almost $11,000 a year, about equal to the full time earnings for a minimum wage worker.7 It is not surprising then that firms with a relatively high percentage of lower-wage workers are less likely to offer health insurance—given the cost of coverage relative to what their workers earn; nor is it surprising that smaller firms, who on average pay their workers less than larger firms, are having an increasingly hard time offering health benefits to their workers. Unless cost increases moderate substantially, or new ways are found to finance health care for lower income workers, we may well see the downward trends in offer rates and coverage continue.
1 Kaiser Family Foundation, Kaiser Commission on Medicaid and the Uninsured. Health Insurance Coverage in America, 2003 Data Update, November 2004.
2 Data on premiums reflect the cost of health insurance premiums for a family of four.
3 A portion of the change in enrollment is likely attributable to incorporating more recent Census Bureau estimates of the number of state and local workers and removing federal workers from the weights. See the Survey Design and Methods section in the full report for additional information.
4 In 2003 and 2004 the survey used a different definition and asked firms if they offered a health plan with a deductible of more than $1,000 for single coverage. The 2003 and 2004 surveys did not specify a minimum deductible for family coverage. Some of the change in the percentage of firms offering an HDHP between 2003 and 2005 may be due to this change in the definition of an HDHP.
5 This estimate of the number of workers enrolled in an HDHP/HRA or an HSA qualified HDHP does not include federal workers because the federal government is not included in the survey.
6 The average firm contributions to HSAs for single coverage ($553) and family coverage ($1,183) include covered workers whose firm makes no contribution to the account. Average Firm Contributions to the HSA or HRA cannot be calculated by subtracting the average Total Annual Premium from the average Total Annual Spending (Exhibit H) due to varying sample sizes. Some firms provided data for premiums and worker contributions that were inconsistent with other data they provided about their HDHP/HRA or HSA qualified HDHP. These data were excluded from estimates of the average premium, worker contribution, and firm contribution for the HDHP; therefore there are fewer cases used in calculating those averages than for the average firm contribution to the HSA or HRA.
7 Gross earnings for someone earning the federal minimum wage in 2005 and working 2,080 hours are $10,712.


73%
9.2%$10,
880
810,000Employer Health Benefits
2005 Annual Survey
s e c t i o n
E m p l o y e e
C o v e ra g e ,
E l i g i b i l i t y, a n d
Pa r t i c i p a t i o n
3
73%
9.2%$10,
880
810,000Employer Health Benefits
2005 Annual Survey
S u r v e y
D e s i g n
a n d
M e t h o d s

Employer Health Benefits 2 0 0 5 A n n ua l S u rve y
10
T H E K A I S E R F A M I LY F O U N D AT I O N - A N D - H E A LT H R E S E A R C H A N D E D U C AT I O N A L T R U S T
section
on
eSurvey D
esign and Methods
SURVEY DESIGN AND METHODS
T H E K A I S E R F A M I L Y F O U N D A T I O N A N D T H E H E A L T H R E S E A R C H A N D E D U C A T I O N A L T R U S T ( K F F /
H R E T ) C O N D U C T T H I S S U R V E Y O F E M P L O Y E R - S P O N S O R E D H E A L T H B E N E F I T S . F O R M A N Y Y E A R S
T H E I N T E R N A T I O N A L C O N S U L T I N G A N D A C C O U N T I N G F I R M , B E A R I N G P O I N T ( F O R M E R L Y K N O W N
A S K P M G ) , S U P P O R T E D T H E S T U D Y . I N 1 9 9 8 , K P M G D I V E S T E D I T S E L F O F I T S C O M P E N S A T I O N
A N D B E N E F I T S P R A C T I C E , A N D P A R T O F T H A T D I V E S T I T U R E I N C L U D E D D O N A T I N G T H E A N N U A L
S U R V E Y O F H E A L T H B E N E F I T S T O H R E T . H R E T I S A N O N P R O F I T R E S E A R C H O R G A N I Z A T I O N
A F F I L I A T E D W I T H T H E A M E R I C A N H O S P I T A L A S S O C I A T I O N . T H E K A I S E R F A M I L Y F O U N D A T I O N
P R O V I D E S F I N A N C I A L S U P P O R T A N D C O N D U C T S T H I S S U R V E Y I N P A R T N E R S H I P W I T H H R E T . T H E
F O U N D A T I O N P R O V I D E S I N D E P E N D E N T R E S E A R C H A N D A N A L Y S I S O N H E A L T H P O L I C Y I S S U E S , A N D
I S N O T A F F I L I A T E D I N A N Y W A Y W I T H T H E K A I S E R P E R M A N E N T E H E A L T H P L A N .
Kaiser/HRET asked each participating company as many as 400 questions about its largest conventional or indemnity, health maintenance organization (HMO), preferred provider organization (PPO) and point-of service (POS) health plans. This year’s survey included questions on the cost of health insurance, offer rates, coverage, eligibility, health plan choice, enrollment patterns, premiums, employee cost sharing, covered benefits, prescription drug benefits, retiree health benefits and general policy perceptions and activities. Throughout this report, we use the term ‘in-network’ to refer to services received from a preferred provider and ‘out-of-network’ to refer to services received from a nonpreferred provider. This year Kaiser/HRET survey added two additional sections to the questionnaire to collect information about high-deductible health plans (HDHP) that are offered along with a health reimbursement account (HRA) or are health savings account (HSA) qualified.1 Questions in these sections were asked of all firms offering these plan types, regardless of enrollment.
Kaiser/HRET retained National Research LLC (NR), a Washington, D.C.-based survey research
firm, to conduct telephone interviews with human resource and benefits managers. NR conducted interviews from January to May 2005.
R E S P O N S E R A T E
Kaiser/HRET drew its sample from a Dun & Bradstreet list of the nation’s private and public employers with three or more workers. To increase precision, Kaiser/HRET stratified the sample by industry and the number of workers in the firm. Kaiser/ HRET attempted to repeat interviews with prior years’ survey respondents (with at least ten employees) who also participated in 2003 and/or 2004. As a result, 1,122 firms in this year’s total sample of 2,013 firms participated in either the 2003 and 2004 surveys.2 The overall response rate was 48%.
The vast majority of questions are asked only of firms that offer health benefits. A total of 1,832 responding firms indicated that they offered health benefits. The overall response rate of firms that offer health benefits was 51%.
From previous years’ experience, we have learned that firms that decline to participate in the study are more likely not to offer health benefits. Therefore, we asked one question to all
1 See Section 8 for specific definitions of HDHPs, HRAs, and HSAs. Although HRAs can be offered along with a health plan that is not an HDHP, the survey only collected information on HRAs that are offered along with HDHPs.
2 In total, 233 firms participated in 2003 and 2005, 106 firms participated in 2004 and 2005, and 783 firms participated in 2003, 2004, and 2005.
n o t e :

Employer Health Benefits 2 0 0 5 A n n ua l S u rve y
11
T H E K A I S E R F A M I LY F O U N D AT I O N - A N D - H E A LT H R E S E A R C H A N D E D U C AT I O N A L T R U S T
Survey Design and M
ethods
firms in the study with which we made phone contact where the firm declined to participate. The question was, “Does your company offer or contribute to a health insurance program as a benefit to your employees?” A total of 2,995 firms responded to this question (including 2,013 who responded to the full survey and 982 who responded to this one question). Their responses are included in our estimates of the percentage of firms offering health benefits.3 The response rate for this question was 72%.
F I R M S I Z E D E F I N I T I O N S , R O U N D I N G , A N D I M P U T A T I O N
Throughout the report, exhibits categorize data by industry, size of firm, and region. Firm size definitions are as follows: 3-199, All Small; and 200 or more workers, All Large. Occasionally, firm size categories will be broken into finer groups. The All Small group may be categorized by: 3-24 workers and 25-199 workers; or 3-9 workers, 10-24 workers, 25- 49 workers, and 50-199 workers. The All Large group may be categorized by: 200-999 workers, midsize; 1,000-4,999 workers, large; and 5,000 or more workers, jumbo. EXHIBIT M.1 shows detailed characteristics of the sample.
EXHIBIT M.2 displays the distribution of the nation’s firms, workers, and covered workers (of employees receiving coverage from their employer). Among the over three million firms nationally, approximately 60% are firms employing 3-9 workers. In contrast, jumbo firms, defined as firms with 5,000 or more workers, employ and cover about 35% of employees. Therefore, the smallest firms dominate any national statistics about what employers in general are doing. In contrast, jumbo employers are the most important employer group in calculating statistics regarding covered workers, since they employ the largest percentage of the nation’s workforce.
Some exhibits in Health Benefits 2005 do not sum up to totals due to rounding effects. Also due to rounding, numbers in the text may be slightly different from those in the exhibits. Throughout the report, while overall totals as well as totals for size and industry are statistically valid, some breakdowns may not be available due to limited
sample sizes. In instances where the sample size is less than 30, exhibits include the notation NSD (Not Sufficient Data).
To control for item nonresponse bias, Kaiser/HRET has identified a set of variables as needing complete information from all surveyed firms. These variables include percentage changes in premium costs for family coverage, premium amounts, worker contribution amounts, self-insurance status, level of benefits, prescription drug cost sharing, copay and coinsurance amounts for prescription drugs, and firm workforce characteristics such as average income and part-time status. On average, less than five percent of these observations are imputed for any given variable. The imputed values are determined based on the distribution of the reported values within stratum defined by firm size and region.
W E I G H T I N G A N D S T A T I S T I C A L S I G N I F I C A N C E
Because Kaiser/HRET selects firms randomly, it is possible through the use of statistical weights to extrapolate the results to national (as well as regional, industry, and firm size) averages. These weights allow Kaiser/HRET to present findings based on the number of workers covered by health plans, the number of total workers, and the number of firms. Specific weights were created to analyze the HDHP plans that are offered along with HRAs or are HSA qualified. These weights represent the proportion of employees enrolled in each of these arrangements.
Calculation of the weights follows a common approach. First, the basic weight is determined, followed by a nonresponse adjustment. As part of this nonresponse adjustment, Kaiser/HRET again conducted a small follow-up survey of those firms with 3-49 workers that refused to participate in the full survey. We applied an additional nonresponse adjustment to the weight to reflect the findings of this survey.
Next we trimmed the weights in order to reduce the influence of weight outliers. First, the weights were ranked from largest to smallest based on their proportion of the total weight sum. Next, we identified trimming cut points such that the
3 Estimates for Exhibits 2.1 and 2.2 are based on the sample of 2,995 firms.
n o t e :

Employer Health Benefits 2 0 0 5 A n n ua l S u rve y
12
T H E K A I S E R F A M I LY F O U N D AT I O N - A N D - H E A LT H R E S E A R C H A N D E D U C AT I O N A L T R U S T
section
on
eSurvey D
esign and Methods
observations to be trimmed contribute no more than five percent towards the total weight sum. We also minimized the number of nontrimmed observations that exceed the cut point after the trimming adjustment. This method reduced the variability in the weights and maintained, with few exceptions, the ordinal integrity of the observation weights.
Finally, we applied a post-stratification adjustment. We used the Statistics of the U.S. Census Bureau as the basis for the stratification and the post-stratification adjustment for firms in the private sector, and we used the Census of U.S. Governments as the basis for post stratification for public sector firms. This year we updated our data to reflect the 2002 Census of Governments. We also removed federal government employee counts from our post-stratification. Although these updates had only a small impact on the number of government firms, they reduced the number of government workers in the weights by approximately 7 million. This may have a small effect on our coverage and enrollment estimates.
The data are analyzed with SUDAAN, which computes appropriate standard error estimates by controlling for the complex design of the survey. All statistical tests are performed at the .05 level unless otherwise noted. For figures with multiple years, statistical tests are conducted for each year against the previous year shown. No statistical tests are conducted for years prior to 1999, meaning that the year prior to 1999 shown on the exhibits is the last year for which standard errors are available.
Two types of significance tests performed are the t-Test and the Chi-square test.
H I S T O R I C A L D A T A
Data in this report focus primarily on findings from surveys jointly authored by the Kaiser Family Foundation and the Health Research and Educational Trust, which have been conducted since 1999. Prior to 1999, the survey was conducted by the Health Insurance Association of America (HIAA) and KPMG using the same survey instrument, but data is not available for all the intervening years. Following the survey’s introduction in 1988, HIAA conducted the survey through 1990, but some data are not available to us. KPMG also conducted the survey from 1991-1998. However, in 1991, 1992, 1994, and 1997, only larger firms were sampled. In 1993, 1995, 1996, and 1998, KPMG interviewed both large and small firms.
This report uses data from the 1993, 1996, and 1998 KPMG Surveys of Employer-Sponsored Health Benefits and the 1999-2004 Kaiser/HRET Survey of Employer-Sponsored Health Benefits. For a longer-term perspective, we also use the 1988 survey of the nation’s employers conducted by the HIAA, on which the KPMG and Kaiser/ HRET surveys are based. Many questions in the HIAA, the KPMG, and Kaiser/HRET surveys are identical. The survey designs among the three surveys are also similar.

Survey Design and M
ethodsEmployer Health Benefits 2005 Annual Sur vey
13
T H E K A I S E R F A M I LY F O U N D AT I O N - A N D - H E A LT H R E S E A R C H A N D E D U C AT I O N A L T R U S T
Sample Sample Distribution Percentage of Total Size After Weighting for Weighted Sample
FIRM SIZE
Small (3 - 9 Workers) 164 1,960,811 60.0%
Small (10 - 24 Workers) 221 758,725 23.2
Small (25 - 49 Workers) 168 271,636 8.3
Small (50 - 199 Workers) 278 199,191 6.1
Midsize (200 - 999 Workers) 439 55,733 1.7
Large (1,000 - 4,999 Workers) 403 15,838 .5
Jumbo (5,000+ Workers) 340 7,692 .2
ALL FIRM SIZE S 2,013 3,269,626 100.0%
REGION
Northeast 437 654,523 20.0%
Midwest 562 777,443 23.8
South 655 1,099,390 33.6
West 359 738,270 22.6
ALL REGIONS 2,013 3,269,626 100.0%
INDUSTRY
Mining/Construction/Wholesale 215 592,617 18.1%
Manufacturing 228 218,394 6.7
Transportation/Communications/Utility 102 126,107 3.9
Retail 170 442,321 13.5
Finance 138 218,605 6.7
Service 704 1,362,695 41.7
State/Local Government 241 48,465 1.5
Health Care 215 260,423 8.0
ALL INDUSTRIE S 2,013 3,269,626 100.0%
Kaiser/HRET Survey of Employer-Sponsored Health Benefits, 2005.
s o u r c e :
Exhibit M.1
Selected Characteristics of Firms in the Survey Sample, 2005

Survey Design and M
ethods
Employer Health Benefits 2005 Annual Sur vey
14
T H E K A I S E R F A M I LY F O U N D AT I O N - A N D - H E A LT H R E S E A R C H A N D E D U C AT I O N A L T R U S T
Exhibit M.2
Distribution of Employers, Workers, and Workers Covered by Health Benefits, by Firm Size, 2005
0%
10%
20%
30%
40%
50%
60%
70%
80%
90%
100%
employers workers covered workers
3-9 workers
10-24 workers
25-49 workers
50-199 workers
200-999 workers
1,000-4,999 workers
5,000 or more workers
<1%
6%
8%
23%
60%
34%
13%
13%
14%
8%
10%
9%
37%
15%
14%
14%
7%
8%
5%
<1%2%
Note: Data are based on a special data request from the U.S. Census Bureau’s most recent Statistics of U.S. Businesses. State and local government data are from the Census of Governments.
Kaiser/HRET Survey of Employer-Sponsored Health Benefits, 2005.
s o u r c e :

73%
9.2%$10,
880
810,000Employer Health Benefits
2005 Annual Survey
s e c t i o n
E m p l o y e e
C o v e ra g e ,
E l i g i b i l i t y, a n d
Pa r t i c i p a t i o n
3
73%
9.2%$10,
880
810,000Employer Health Benefits
2005 Annual Survey
s e c t i o n
C o s t o f
H e a l t h
I n s u ra n c e
1

section
on
eC
ost of Health Insurance
1
Employer Health Benefits 2 0 0 5 A n n ua l S u rve y
16
T H E K A I S E R F A M I LY F O U N D AT I O N - A N D - H E A LT H R E S E A R C H A N D E D U C AT I O N A L T R U S T
COST OF HEALTH INSURANCE
I N 2 0 0 5 , P R E M I U M S F O R F A M I L Y C O V E R A G E I N C R E A S E D 9 . 2 % . T H I S I S T H E F I R S T Y E A R O F
S I N G L E D I G I T I N C R E A S E S S I N C E 2 0 0 0 . T H I S I S T H E S E C O N D C O N S E C U T I V E Y E A R T H A T P R E -
M I U M I N C R E A S E S W E R E L E S S T H A N T H E Y W E R E I N T H E P R E V I O U S Y E A R . 1
W H I L E L O W E R T H A N I N R E C E N T Y E A R S , T H E 9 . 2 % I N C R E A S E I N T H E C O S T O F C O V E R A G E
E X C E E D S T H E O V E R A L L R A T E O F I N F L A T I O N B Y N E A R L Y 6 P E R C E N T A G E P O I N T S A N D T H E
I N C R E A S E I N W O R K E R S ’ E A R N I N G S B Y O V E R 6 P E R C E N T A G E P O I N T S . S I N C E 2 0 0 0 , T H E C O S T
O F H E A L T H I N S U R A N C E H A S I N C R E A S E D B Y 7 3 % .
T H E A V E R A G E C O S T O F F A M I L Y C O V E R A G E I S $ 1 0 , 8 8 0 A Y E A R , W H I C H E X C E E D S T H E A N N U A L
G R O S S E A R N I N G S O F A M I N I M U M W A G E W O R K E R W H O I S F U L L Y E M P L O Y E D T H R O U G H O U T T H E
Y E A R . 2
P R E M I U M I N C R E A S E S
• The cost of health insurance rose 9.2% in 2005, less than the 11.2% increase in 2004, but much higher than the overall rate of inflation of 3.5% and the increase in workers’ earnings of 2.7% (EXHIBIT 1.1).
• Covered workers in small firms (3-199 workers) and large firms (200 or more workers) experienced similar premium increases (9.8% vs. 8.9%) (EXHIBIT 1.3).
• There is considerable variation in premium increases across workers and firms: 7% of covered workers work in firms that experienced premium increases of greater than 20%, while 32% of covered workers work in firms that experienced premium increases of less than or equal to 5% (EXHIBIT 1.4).
M O N T H LY P R E M I U M C O S T S F O R S I N G L E
A N D FA M I LY C O V E R A G E
• The average cost of single coverage for covered workers in 2005 is $335 per month or $4,024 per year. This figure includes both the employer and employee contribution. The average cost of family coverage is $907 per month or $10,880 per year (EXHIBIT 1.13).
• Covered workers in PPO plans, the plan type with the highest enrollment, face higher average premiums for both single and family coverage than covered workers in HMO plans. The average annual premium for covered workers in PPO plans is $4,150 for single coverage and $11,090 for family coverage, while the average annual premium for covered workers in HMO plans is $3,767 for single coverage and $10,456 for family coverage (EXHIBIT 1.13).
1 Data on premium increases reflect the cost of health insurance premiums for a family of four.
2 Gross earnings for someone earning the federal minimum wage in 2005 and working 2,080 hours are $10,712.
n o t e :

section
on
e
1
Cost of H
ealth InsuranceEmployer Health Benefits 2005 Annual Sur vey
17
T H E K A I S E R F A M I LY F O U N D AT I O N - A N D - H E A LT H R E S E A R C H A N D E D U C AT I O N A L T R U S T
Exhibit 1.1
Increases in Health Insurance Premiums Compared to Other Indicators, 1988-2005
0%
2%
4%
6%
8%
10%
12%
14%
16%
18%
1988 1989 1990 1991 1992 1993 1994 1995 1996 1997 1998 1999 2000 2001 2002 2003 2004 2005
5.3*
0.8
8.5
12.0
18.0
14.0
8.2*
10.9*
12.9*
9.2*
11.2*
13.9†
healthinsurancepremiums
workers’earnings
overallinflation
1988
12.0 18.0 14.0 8.5 0.8 5.3* 8.2* 10.9* 12.9* 13.9† 11.2* 9.2*
3.9 5.1 4.7 3.2 2.9 2.3 3.1 3.3 1.6 2.2 2.3 3.5
3.1 4.2 3.9 2.5 3.3 3.6 3.9 4.0 2.6 2.9 2.2 2.7
1989 1990 1993 1996 1999 2000 2001 2002 2003 2004 2005
* Estimate is statistically different from the previous year shown at p.05. No statistical tests were conducted for years prior to 1999.
† Estimate is statistically different from the previous year shown at p.10.
Note: Data on premium increases reflect the cost of health insurance premiums for a family of four. Historical estimates of workers’ earnings have been updated to reflect new industry classifications (NAICS).
Kaiser/HRET Survey of Employer-Sponsored Health Benefits: 1999-2005; KPMG Survey of Employer-Sponsored Health Benefits: 1993, 1996; The Health Insurance Association of America (HIAA), 1988, 1989, 1990; Bureau of Labor Statistics, Consumer Price Index, U.S. City Average of Annual Inflation (April to April), 1988-2005; Bureau of Labor Statistics, Seasonally Adjusted Data from the Current Employment Statistics Survey (April to April), 1988-2005.
s o u r c e :
section
on
eC
ost of Health Insurance
1
Employer Health Benefits 2005 Annual Sur vey
18
T H E K A I S E R F A M I LY F O U N D AT I O N - A N D - H E A LT H R E S E A R C H A N D E D U C AT I O N A L T R U S T
1988 1993 1996 2000 2002 2003 2004 2005
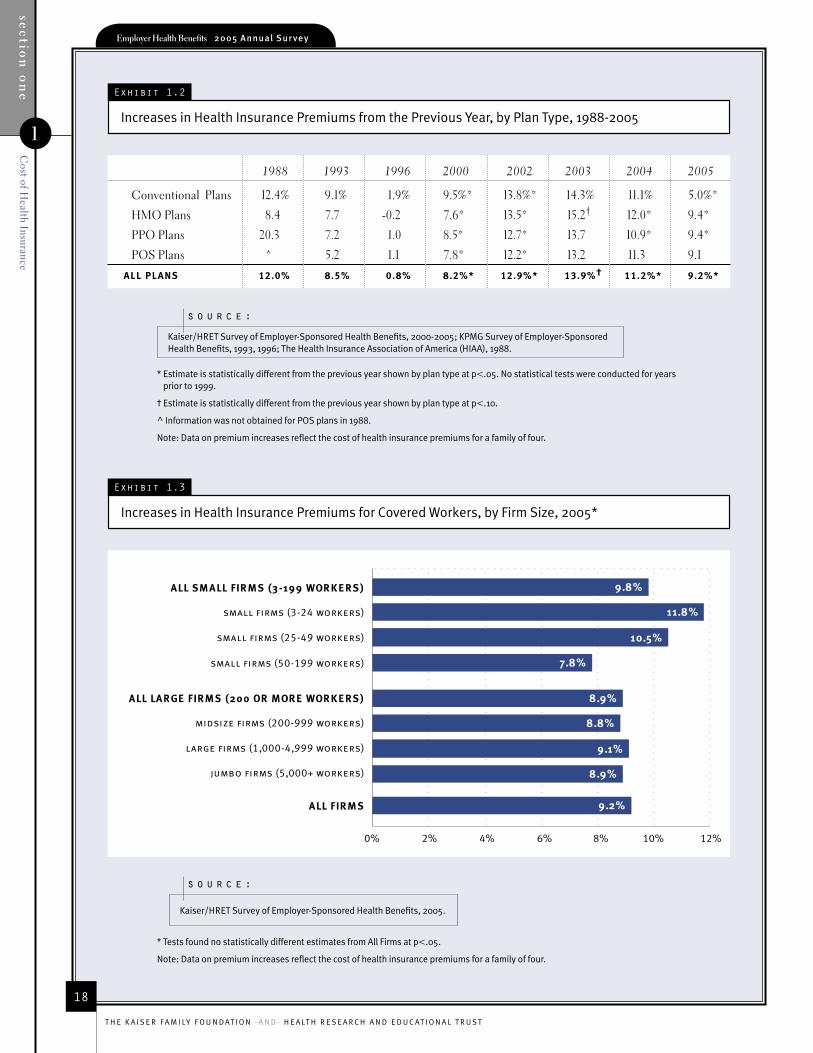
Conventional Plans 12.4% 9.1% 1.9% 9.5%* 13.8%* 14.3% 11.1% 5.0%*
HMO Plans 8.4 7.7 -0.2 7.6* 13.5* 15.2† 12.0* 9.4*
PPO Plans 20.3 7.2 1.0 8.5* 12.7* 13.7 10.9* 9.4*
POS Plans ^ 5.2 1.1 7.8* 12.2* 13.2 11.3 9.1
ALL PLANS 12.0% 8.5% 0.8% 8.2%* 12.9%* 13.9%† 11.2%* 9.2%*
Exhibit 1.2
Increases in Health Insurance Premiums from the Previous Year, by Plan Type, 1988-2005
* Estimate is statistically different from the previous year shown by plan type at p.05. No statistical tests were conducted for years prior to 1999.
† Estimate is statistically different from the previous year shown by plan type at p.10.
^ Information was not obtained for POS plans in 1988.
Note: Data on premium increases reflect the cost of health insurance premiums for a family of four.
Kaiser/HRET Survey of Employer-Sponsored Health Benefits, 2000-2005; KPMG Survey of Employer-Sponsored Health Benefits, 1993, 1996; The Health Insurance Association of America (HIAA), 1988.
s o u r c e :
Exhibit 1.3
Increases in Health Insurance Premiums for Covered Workers, by Firm Size, 2005*
0% 2% 4% 6% 8% 10% 12%
jumbo firms (5,000+ workers)
large firms (1,000-4,999 workers)
midsize firms (200-999 workers)
small firms (50-199 workers)
small firms (25-49 workers)
small firms (3-24 workers)
9.2%
8.9%
9.1%
8.8%
8.9%
7.8%
10.5%
11.8%
9.8%ALL SMALL FIRMS (3-199 WORKERS)
ALL LARGE FIRMS (200 OR MORE WORKERS)
ALL FIRMS
* Tests found no statistically different estimates from All Firms at p.05.
Note: Data on premium increases reflect the cost of health insurance premiums for a family of four.
Kaiser/HRET Survey of Employer-Sponsored Health Benefits, 2005.
s o u r c e :

section
on
e
1
Cost of H
ealth InsuranceEmployer Health Benefits 2005 Annual Sur vey
19
T H E K A I S E R F A M I LY F O U N D AT I O N - A N D - H E A LT H R E S E A R C H A N D E D U C AT I O N A L T R U S T
Conventional HMO PPO POS All Plans
FIRM SIZE
All Small Firms (3 - 199 Workers) 3.7% 7.5% 10.8% 10.0% 9.8%
All Large Firms (200 or More Workers) 5.8* 10.1 8.8 8.3 8.9
ALL FIRM SIZE S 5.0%* 9.4% 9.4% 9.1% 9.2%
Exhibit 1.4
Distribution of Premium Increases for Covered Workers, by Firm Size, 2005
Exhibit 1.5
Increases in Health Insurance Premiums, by Firm Size and Plan Type, 2005
0% 10% 20% 30% 40% 50% 60% 70% 80% 90% 100%
all large firms(200 or more workers)
all small firms*(3-199 workers)
less than or equal to 5%greater than 5%, less than or equal to 10%greater than 10%, less than or equal to 15%greater than 15%, less than or equal to 20%greater than 20%
33%
31%
32%
24% 17% 15% 11%
30% 26% 8% 5%
28% 23% 10% 7%all firms
* Distribution is statistically different from All Firms at p.05.
Note: Data on premium increases reflect the cost of health insurance premiums for a family of four.
Kaiser/HRET Survey of Employer-Sponsored Health Benefits, 2005.
s o u r c e :
Kaiser/HRET Survey of Employer-Sponsored Health Benefits, 2005.
s o u r c e :
* Estimate is statistically different from All Plans within a firm size at p.05.
Note: Data on premium increases reflect the cost of health insurance premiums for a family of four.

section
on
eC
ost of Health Insurance
1
Employer Health Benefits 2005 Annual Sur vey
20
T H E K A I S E R F A M I LY F O U N D AT I O N - A N D - H E A LT H R E S E A R C H A N D E D U C AT I O N A L T R U S T
Exhibit 1.6
Increases in Health Insurance Premiums, by Plan Type and Funding Arrangement, 2005*
* Tests found no statistically different estimates between Fully Insured and Self-Funded plans within a plan type at p.05.
Fully Insured plan: An insurance arrangement in which the employer contracts with a health plan to assume financial responsibility for the costs of enrollees’ medical claims.
Self-Funded plan: An insurance arrangement in which the employer assumes direct financial responsibility for the costs of enrollees’ medical claims. Employers sponsoring self-funded plans typically contract with a third-party administrator or insurer to provide administrative services for the self-funded plan.
Note: Data on premium increases reflect the cost of health insurance premiums for a family of four.
Kaiser/HRET Survey of Employer-Sponsored Health Benefits, 2005.
s o u r c e :
0%
2%
4%
6%
8%
10%
conventional hmo ppo pos all plans
4.7%
5.2%
10.0%
8.0%
9.9%
9.2%9.6%
8.1%
9.3%9.1%
fully insured
self-funded

section
on
e
1
Cost of H
ealth InsuranceEmployer Health Benefits 2005 Annual Sur vey
21
T H E K A I S E R F A M I LY F O U N D AT I O N - A N D - H E A LT H R E S E A R C H A N D E D U C AT I O N A L T R U S T
Exhibit 1.7
Increases in Health Insurance Premiums, by Funding Arrangement, 1998-2005
0%
2%
4%
6%
8%
10%
12%
14%
16%
18%
fully insured self-funded
9.4%
6.1%
12.4%*
15.6%*
11.4%*
9.3%*
4.5% 4.5%
9.3%*
12.4%*
11.1%
9.1%*
1998
1999
2001
2003
2004
2005
* Estimate is statistically different from previous year shown at p.05.
Fully Insured plan: An insurance arrangement in which the employer contracts with a health plan to assume financial responsibility for the costs of enrollees’ medical claims.
Self-Funded plan: An insurance arrangement in which the employer assumes direct financial responsibility for the costs of enrollees’ medical claims. Employers sponsoring self-funded plans typically contract with a third-party administrator or insurer to provide administrative services for the self-funded plan.
Note: Data on premium increases reflect the cost of health insurance premiums for a family of four.
Kaiser/HRET Survey of Employer-Sponsored Health Benefits, 1999-2005; KPMG Survey of Employer-Sponsored Health Benefits, 1998.
s o u r c e :

section
on
eC
ost of Health Insurance
1
Employer Health Benefits 2005 Annual Sur vey
22
T H E K A I S E R F A M I LY F O U N D AT I O N - A N D - H E A LT H R E S E A R C H A N D E D U C AT I O N A L T R U S T
Exhibit 1.8
Increases in Health Insurance Premiums, by Firm Size, 1996-2005
0%
3%
6%
9%
12%
15%
18%
all small firms(3-199 workers)
midsize firms(200-999 workers)
large firms(1,000-4,999 workers)
jumbo firms(5,000 or more workers)
1996
1998
2001
2003
2004
2005
2.1
12.8*
15.5*
11.5*
1.1
3.5
10.3*
12.4
10.3
0.5
4.4*
9.1*
14.1*
10.7*
0.3
2.6*
10.0*
13.2*
11.6
9.8
8.8 9.1 8.9*
5.2
* Estimate is statistically different from the previous year shown at p.05. No statistical tests were conducted for years prior to 1999.
Note: Data on premium increases reflect the cost of health insurance premiums for a family of four.
Kaiser/HRET Survey of Employer-Sponsored Health Benefits, 2001-2005; KPMG Survey of Employer-Sponsored Health Benefits, 1996, 1998.
s o u r c e :

section
on
e
1
Cost of H
ealth InsuranceEmployer Health Benefits 2005 Annual Sur vey
23
T H E K A I S E R F A M I LY F O U N D AT I O N - A N D - H E A LT H R E S E A R C H A N D E D U C AT I O N A L T R U S T
Exhibit 1.9
Increases in Health Insurance Premiums, by Region, 1996-2005
0%
3%
6%
9%
12%
15%
18%
northeast midwest south west
1996
1998
2001
2003
2004
2005
1.0
10.9*
13.7*
11.3*
1.5
4.0
11.8*
13.8
12.5
0.6
2.9
10.5*
12.9*
9.9*
0.0
4.3
10.4*
16.3*
12.1*
9.3* 9.1*
10.1
7.9*
4.0
* Estimate is statistically different from the previous year shown at p.05. No statistical tests were conducted for years prior to 1999. In 2005, the average premium increase in the West (7.9%) is not significantly different from the average overall increase of 9.2%. Other years were not tested accross regions.
Note: Data on premium increases reflect the cost of health insurance premiums for a family of four.
Kaiser/HRET Survey of Employer-Sponsored Health Benefits, 2001-2005; KPMG Survey of Employer-Sponsored Health Benefits, 1996, 1998.
s o u r c e :
section
on
eC
ost of Health Insurance
1
Employer Health Benefits 2005 Annual Sur vey
24
T H E K A I S E R F A M I LY F O U N D AT I O N - A N D - H E A LT H R E S E A R C H A N D E D U C AT I O N A L T R U S T
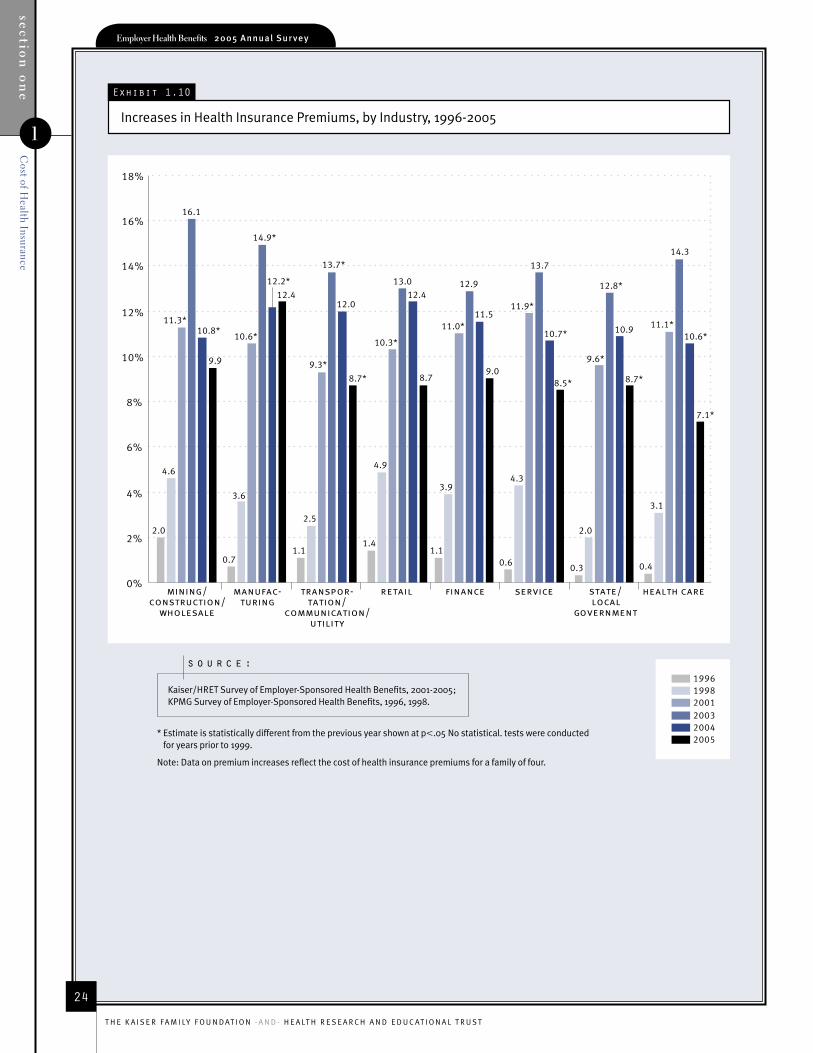
Exhibit 1.10
Increases in Health Insurance Premiums, by Industry, 1996-2005
0%
2%
4%
6%
8%
10%
12%
14%
16%
18%
199619982001200320042005
retail finance service health caremining/construction/
wholesale
transpor-tation/
communication/utility
manufac-turing
state/local
government
2.0
4.6
11.3*
16.1
10.8*
0.7
3.6
10.6*
14.9*
12.2*
1.1
2.5
9.3*
13.7*
12.0
1.4
4.9
10.3*
13.0
12.4
1.1
3.9
11.0*
12.9
11.5
0.6
4.3
11.9*
13.7
10.7*
0.3
2.0
9.6*
12.8*
10.9
0.4
3.1
11.1*
14.3
10.6*
12.4
9.9
8.7* 8.79.0
8.5* 8.7*
7.1*
* Estimate is statistically different from the previous year shown at p.05 No statistical. tests were conducted for years prior to 1999.
Note: Data on premium increases reflect the cost of health insurance premiums for a family of four.
Kaiser/HRET Survey of Employer-Sponsored Health Benefits, 2001-2005; KPMG Survey of Employer-Sponsored Health Benefits, 1996, 1998.
s o u r c e :
section
on
e
1
Cost of H
ealth InsuranceEmployer Health Benefits 2005 Annual Sur vey
25
T H E K A I S E R F A M I LY F O U N D AT I O N - A N D - H E A LT H R E S E A R C H A N D E D U C AT I O N A L T R U S T
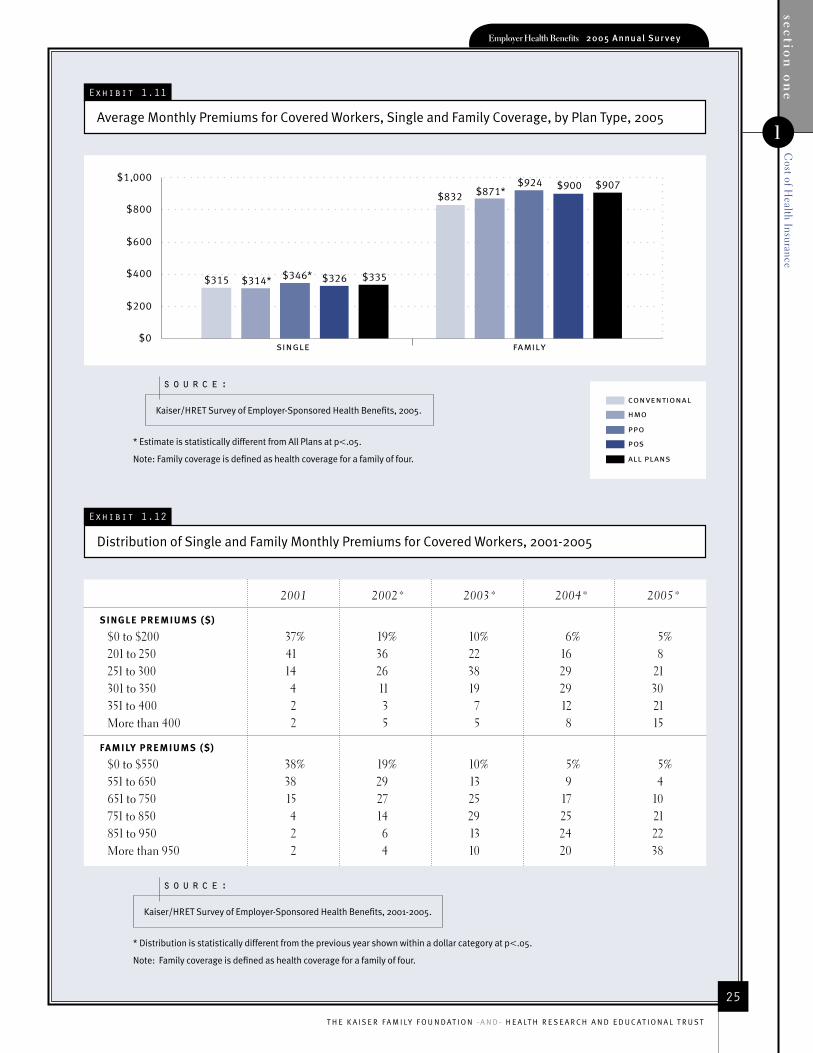
2001 2002* 2003* 2004* 2005*
SINGLE PREMIUMS ($)
$0 to $200 37% 19% 10% 6% 5%201 to 250 41 36 22 16 8251 to 300 14 26 38 29 21301 to 350 4 11 19 29 30351 to 400 2 3 7 12 21More than 400 2 5 5 8 15
FAMILY PREMIUMS ($)
$0 to $550 38% 19% 10% 5% 5%551 to 650 38 29 13 9 4651 to 750 15 27 25 17 10751 to 850 4 14 29 25 21851 to 950 2 6 13 24 22More than 950 2 4 10 20 38
Exhibit 1.11
Average Monthly Premiums for Covered Workers, Single and Family Coverage, by Plan Type, 2005
Kaiser/HRET Survey of Employer-Sponsored Health Benefits, 2001-2005.
s o u r c e :
Exhibit 1.12
Distribution of Single and Family Monthly Premiums for Covered Workers, 2001-2005
$0
$200
$400
$600
$800
$1,000
single family
conventional
hmo
ppo
pos
all plans
$315 $314* $346* $326 $335
$832 $871*$924 $900 $907
* Estimate is statistically different from All Plans at p.05.
Note: Family coverage is defined as health coverage for a family of four.
Kaiser/HRET Survey of Employer-Sponsored Health Benefits, 2005.
s o u r c e :
* Distribution is statistically different from the previous year shown within a dollar category at p.05.
Note: Family coverage is defined as health coverage for a family of four.

section
on
eC
ost of Health Insurance
1
Employer Health Benefits 2005 Annual Sur vey
26
T H E K A I S E R F A M I LY F O U N D AT I O N - A N D - H E A LT H R E S E A R C H A N D E D U C AT I O N A L T R U S T
Monthly Annual
Single Coverage Family Coverage Single Coverage Family Coverage
CONVENTIONAL PLANS
All Small Firms (3 - 199 Workers) $325 $830 $3,895 $9,963
All Large Firms (200 or More Workers) 309 833 3,709 9,990
ALL FIRM SIZE S $315 $832 $3,782 $9,979
HMO PLANS
All Small Firms (3 - 199 Workers) $310 $845 $3,720 $10,140
All Large Firms (200 or More Workers) 315 881 3,784 10,574
ALL FIRM SIZE S $314 $871 $3,767 $10,456
PPO PLANS
All Small Firms (3 - 199 Workers) $349 $900 $4,189 $10,797
All Large Firms (200 or More Workers) 344 935 4,132 11,224
ALL FIRM SIZE S $346 $924 $4,150 $11,090
POS PLANS
All Small Firms (3 - 199 Workers) $323 $874 $3,874 $10,483
All Large Firms (200 or More Workers) 329 924 3,950 11,083
ALL FIRM SIZE S $326 $900 $3,914 $10,801
ALL PLANS
All Small Firms (3 - 199 Workers) $336 $882 $4,032 $10,587
All Large Firms (200 or More Workers) 335 919 4,020 11,025
ALL FIRM SIZE S $335 $907 $4,024 $10,880
Exhibit 1.13
Monthly and Annual Average Premiums for Covered Workers, by Plan Type and Firm Size, 2005*
* Tests found no statistically different estimates from All Firm Sizes within a plan type at p.05.
Note: Family coverage is defined as health coverage for a family of four.
Kaiser/HRET Survey of Employer-Sponsored Health Benefits, 2005.
s o u r c e :
section
on
e
1
Cost of H
ealth InsuranceEmployer Health Benefits 2005 Annual Sur vey
27
T H E K A I S E R F A M I LY F O U N D AT I O N - A N D - H E A LT H R E S E A R C H A N D E D U C AT I O N A L T R U S T
Kaiser/HRET Survey of Employer-Sponsored Health Benefits, 2005.
s o u r c e :
Exhibit 1.14
Monthly and Annual Average Premiums for Covered Workers, by Plan Type and Region, 2005
* Estimate is statistically different from All Regions within a plan type at p.05.
NSD: Not Sufficient Data
Note: Family coverage is defined as health coverage for a family of four.
Monthly Annual
Single Coverage Family Coverage Single Coverage Family Coverage
CONVENTIONAL PLANS
Northeast $269 $712 $3,227 $8,544
Midwest 271 790 3,250 9,476
South 330 868 3,955 10,420
West NSD NSD NSD NSD
ALL REGIONS $315 $832 $3,782 $9,979
HMO PLANS
Northeast $328 $909 $3,932 $10,903
Midwest 323 883 3,880 10,592
South 329 896 3,950 10,754
West 285* 817 3,421* 9,809
ALL REGIONS $314 $871 $3,767 $10,456
PPO PLANS
Northeast $359 $995* $4,313 $11,938*
Midwest 353 946 4,235 11,354
South 333 877 3,998 10,526
West 348 918 4,177 11,012
ALL REGIONS $346 $924 $4,150 $11,090
POS PLANS
Northeast $342 $961* $4,105 $11,528*
Midwest 317 900 3,809 10,806
South 310 845 3,726 10,142
West 338 913 4,059 10,958
ALL REGIONS $326 $900 $3,914 $10,801
ALL PLANS
Northeast $346 $959* $4,147 $11,504*
Midwest 342 926 4,103 11,115
South 329 876* 3,950 10,507*
West 328 886 3,937 10,638
ALL REGIONS $335 $907 $4,024 $10,880
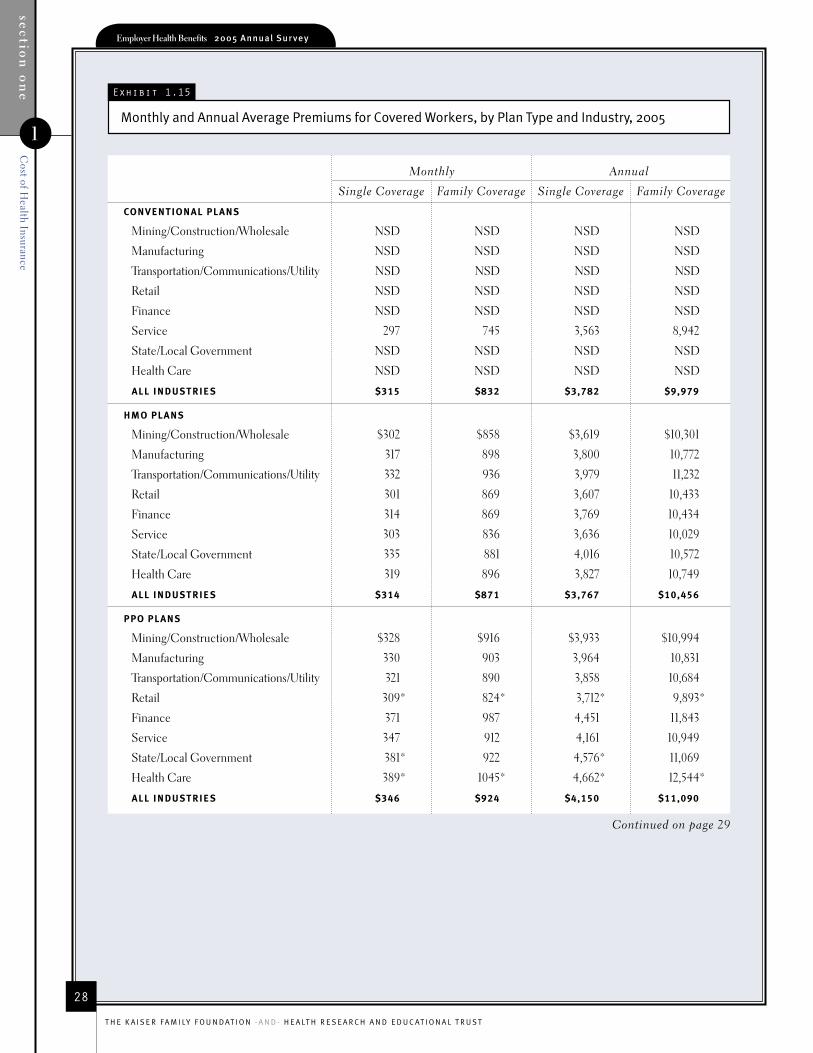
section
on
eC
ost of Health Insurance
1
Employer Health Benefits 2005 Annual Sur vey
28
T H E K A I S E R F A M I LY F O U N D AT I O N - A N D - H E A LT H R E S E A R C H A N D E D U C AT I O N A L T R U S T
Monthly Annual
Single Coverage Family Coverage Single Coverage Family Coverage
CONVENTIONAL PLANS
Mining/Construction/Wholesale NSD NSD NSD NSD
Manufacturing NSD NSD NSD NSD
Transportation/Communications/Utility NSD NSD NSD NSD
Retail NSD NSD NSD NSD
Finance NSD NSD NSD NSD
Service 297 745 3,563 8,942
State/Local Government NSD NSD NSD NSD
Health Care NSD NSD NSD NSD
ALL INDUSTRIE S $315 $832 $3,782 $9,979
HMO PLANS
Mining/Construction/Wholesale $302 $858 $3,619 $10,301
Manufacturing 317 898 3,800 10,772
Transportation/Communications/Utility 332 936 3,979 11,232
Retail 301 869 3,607 10,433
Finance 314 869 3,769 10,434
Service 303 836 3,636 10,029
State/Local Government 335 881 4,016 10,572
Health Care 319 896 3,827 10,749
ALL INDUSTRIE S $314 $871 $3,767 $10,456
PPO PLANS
Mining/Construction/Wholesale $328 $916 $3,933 $10,994
Manufacturing 330 903 3,964 10,831
Transportation/Communications/Utility 321 890 3,858 10,684
Retail 309* 824* 3,712* 9,893*
Finance 371 987 4,451 11,843
Service 347 912 4,161 10,949
State/Local Government 381* 922 4,576* 11,069
Health Care 389* 1045* 4,662* 12,544*
ALL INDUSTRIE S $346 $924 $4,150 $11,090
Exhibit 1.15
Monthly and Annual Average Premiums for Covered Workers, by Plan Type and Industry, 2005
Continued on page 29

section
on
e
1
Cost of H
ealth InsuranceEmployer Health Benefits 2005 Annual Sur vey
29
T H E K A I S E R F A M I LY F O U N D AT I O N - A N D - H E A LT H R E S E A R C H A N D E D U C AT I O N A L T R U S T
* Estimate is statistically different from All Industries within a plan type at p.05.
NSD: Not Sufficient Data
Note: Family coverage is defined as health coverage for a family of four.
Kaiser/HRET Survey of Employer-Sponsored Health Benefits, 2005.
s o u r c e :
Exhibit 1.15
Monthly and Annual Average Premiums for Covered Workers, by Plan Type and Industry, 2005
Monthly Annual
Single Coverage Family Coverage Single Coverage Family Coverage
POS PLANS
Mining/Construction/Wholesale $305 $826 $3,666 $9,911
Manufacturing 352 1,004* 4,230 12,045*
Transportation/Communications/Utility NSD NSD NSD NSD
Retail 301 831 3,616 9,976
Finance NSD NSD NSD NSD
Service 324 902 3,887 10,826
State/Local Government 372* 947 4,463* 11,365
Health Care 325 865 3,895 10,382
ALL INDUSTRIE S $326 $900 $3,914 $10,801
ALL PLANS
Mining/Construction/Wholesale $318 $892 $3,819 $10,702
Manufacturing 329 910 3,948 10,925
Transportation/Communications/Utility 328 914 3,941 10,963
Retail 309* 833* 3,704* 9,992*
Finance 349 940 4,186 11,279
Service 331 889 3,977 10,672
State/Local Government 365* 915 4,377* 10,974
Health Care 366* 991* 4,393* 11,887*
ALL INDUSTRIE S $335 $907 $4,024 $10,880
Continued from page 28


73%
9.2%$10,
880
810,000Employer Health Benefits
2005 Annual Survey
s e c t i o n
H e a l t h
B e n e f i t s
O f f e r R a t e s
2

Employer Health Benefits 2 0 0 5 A n n ua l S u rve y
sec
tion
two
Health B
enefits Offer R
ates
2
32
T H E K A I S E R F A M I LY F O U N D AT I O N - A N D - H E A LT H R E S E A R C H A N D E D U C AT I O N A L T R U S T
HEALTH BENEFITS OFFER RATES
A L T H O U G H N E A R L Y A L L L A R G E F I R M S ( 2 0 0 O R M O R E W O R K E R S ) O F F E R H E A L T H B E N E F I T S ,
F I R M S W I T H F E W E R T H A N 2 0 0 W O R K E R S A R E S I G N I F I C A N T L Y L E S S L I K E L Y T O D O S O .
S I N C E 2 0 0 0 , T H E P E R C E N T A G E O F F I R M S O F F E R I N G H E A L T H B E N E F I T S H A S D R O P P E D B Y
9 P E R C E N T A G E P O I N T S . W H I L E T H E Y E A R - T O - Y E A R C H A N G E S H A V E B E E N R E L A T I V E L Y S M A L L
A N D N O T S T A T I S T I C A L L Y S I G N I F I C A N T , T H E C U M U L A T I V E E F F E C T H A S B E E N A L A R G E A N D S T A -
T I S T I C A L L Y S I G N I F I C A N T C H A N G E O V E R T H I S F I V E - Y E A R P E R I O D . T H I S C H A N G E I S D R I V E N
L A R G E L Y B Y A D E C R E A S E I N T H E P E R C E N T A G E O F S M A L L F I R M S ( 3 - 1 9 9 W O R K E R S ) O F F E R I N G
C O V E R A G E , A N D M A Y R E F L E C T S E V E R A L Y E A R S O F H I G H P R E M I U M G R O W T H C O M B I N E D W I T H A
S L U G G I S H J O B M A R K E T .
• Ninety-eight percent of large firms (200 or more workers) offer health benefits in 2005, essentially unchanged from 2004. In contrast, only 59% of small firms (3-199 workers) offer health benefits. This is comparable to the offer rate among all small firms in 2004, but represents a drop in the offer rate for small firms from 68% in 2000. Driven largely by this decline among small firms, the offer rate among all firms has dropped from 69% to 60% over the same time period (EXHIBIT 2.2).
• The likelihood that a firm offers health benefits to its workers varies considerably with the firm’s characteristics, such as firm size, whether the firm is higher wage, the proportion of part-time workers in the firm, and whether workers are unionized (EXHIBIT 2.3).
• The smallest firms are least likely to offer health insurance. Only 47% of firms with 3-9 workers offer coverage, compared to 72% of firms with 10-24 workers and 87% of firms with 25-49 workers. Nearly all firms with 50 or more employees offer health insurance coverage (EXHIBIT 2.2).
• Higher wage firms – where fewer than 35% of workers earn $20,000 or less annually – are more likely to offer health insurance than lower wage firms – where 35% or more of workers earn $20,000 or less annually. Sixty-five percent of higher wage firms offer health benefits compared to 43% of lower wage firms (EXHIBIT 2.3).
• Firms with fewer part-time workers – where less than 35% of employees work part-time - are also more likely to offer coverage to their workers than firms with many part-time workers. Among firms with fewer part-time workers, 68% offer health insurance, compared to 36% of firms with a higher percentage of part-time workers (EXHIBIT 2.3).
• Firms that employ union workers are much more likely than firms without union workers to offer health benefits to their employees. Ninety percent of firms with union workers offer health benefits, whereas only 59% of firms that do not have union employees offer health coverage (EXHIBIT 2.3).
• Among firms offering health benefits, few offer benefits to their part-time and temporary workers. Twenty-eight percent of firms offer health benefits to part-time workers and 3% of firms offer benefits to temporary workers (EXHIBITS 2.4, 2.5).
• In 2005, 28% of all firms that offer health benefits offer them to part-time workers. Larger firms are more likely than smaller firms to do so. Only 27% of firms with 3-24 workers that offer health benefits offer them to part-time workers, while 61% of jumbo firms (5,000 or more workers) do so. (EXHIBIT 2.4).

Employer Health Benefits 2 0 0 5 A n n ua l S u rve yse
ctio
n tw
oH
ealth Benefits O
ffer Rates
2
33
T H E K A I S E R F A M I LY F O U N D AT I O N - A N D - H E A LT H R E S E A R C H A N D E D U C AT I O N A L T R U S T
• Regardless of firm size, very few firms that offer health benefits (3%) offer them to temporary workers. The percentage of firms offering health benefits to temporary workers has remained Exhibit unchanged over the last several years (EXHIBIT 2.5).
• Despite a slowing of health insurance cost growth in 2005, the cost of health insurance remains the main reason cited by firms for not offering health benefits.
• Of firms not offering health benefits, 73% cite high premiums as a “very important” reason for not doing so. Other factors frequently cited by all firms as “very important” reasons for not offering coverage include: employees are covered elsewhere (33%) and firm can attract good employees without offering health insurance (22%) (EXHIBIT 2.6).
• Among firms not offering health benefits, 41% report shopping for coverage in the past year. Twenty-three percent of firms not offering coverage report that they have offered coverage at some point in the past five years.
• Although cost is often identified as the primary reason that many firms do not offer health benefits, their decisions may also reflect their views about their employees’ preferences for higher wages over health benefits. When non-offering employers were asked to assess whether their employees would prefer an additional $2 per hour in wages (approximately the cost of health insurance per worker) or health benefits, over 70% answered that their employees would prefer higher compensation rather than receiving health benefits (EXHIBIT 2.8).
• Consistent with past years, very few employers indicate that they are likely to drop coverage in the near future. Three percent of all firms say that they are either “very likely” or “somewhat likely” to drop coverage in the next year. Similarly, just under 2% of employers say that they are “very likely” to restrict eligibility for benefits in the next year, with an additional 9% indicating that they are “somewhat likely” to do so. Responses to these questions vary little by firm size (see Section 12).

Employer Health Benefits 2005 Annual Sur vey
34
T H E K A I S E R F A M I LY F O U N D AT I O N - A N D - H E A LT H R E S E A R C H A N D E D U C AT I O N A L T R U S T
sec
tion
two
Health B
enefits Offer R
ates
2
Exhibit 2.1
Percentage of Firms Offering Health Benefits, 1996-2005
0%
10%
20%
30%
40%
50%
60%
70%
80%
90%
100%
1996 1998 2000 2001 2002 2003 2004 2005
59%55%
66%*69%
68%66% 66%
63%60%
1999
* Estimate is statistically different from the previous year shown at p.05. No statistical tests were conducted for years prior to 1999.
Note: Data for years prior to 1999 do not reflect several methodological changes that were made to the survey, including standardizing survey weights to U.S. Census data.
Kaiser/HRET Survey of Employer-Sponsored Health Benefits, 1999 - 2005; KPMG Survey of Employer-Sponsored Health Benefits, 1996, 1998.
s o u r c e :

sec
tion
two
Health B
enefits Offer R
atesEmployer Health Benefits 2005 Annual Sur vey
35
T H E K A I S E R F A M I LY F O U N D AT I O N - A N D - H E A LT H R E S E A R C H A N D E D U C AT I O N A L T R U S T
2
Exhibit 2.2
Percentage of Firms Offering Health Benefits, by Firm Size, 1996-2005
0%
10%
20%
30%
40%
50%
60%
70%
80%
90%
100%
3-9 workers 10-24 workers 25-49 workers 50-199 workers all smallfirms
(3-199 workers)
all largefirms (200 or
more workers)
1996199819992000200220042005
5356†5758
52
47
78
74
80
70*
7472
90
86
91
86 8787
93
97*9795
9293
59
65*68
6663
59
99 99*9998†
9998
48
71
84
95
54
100†
* Estimate is statistically different from the previous year shown at p.05.
† Estimate is statistically different from the previous year shown at p.10.
Note: The percentage of all large firms (200 or more workers) offering health benefits in 1999 was 99%, not 100% as reported last year. Data prior to 1999 do not reflect several methodological changes that were made to the survey, including standardizing survey weights to U.S. Census data.
Kaiser/HRET Survey of Employer-Sponsored Health Benefits, 1999-2005; KPMG Survey of Employer-Sponsored Health Benefits, 1996, 1998.
s o u r c e :
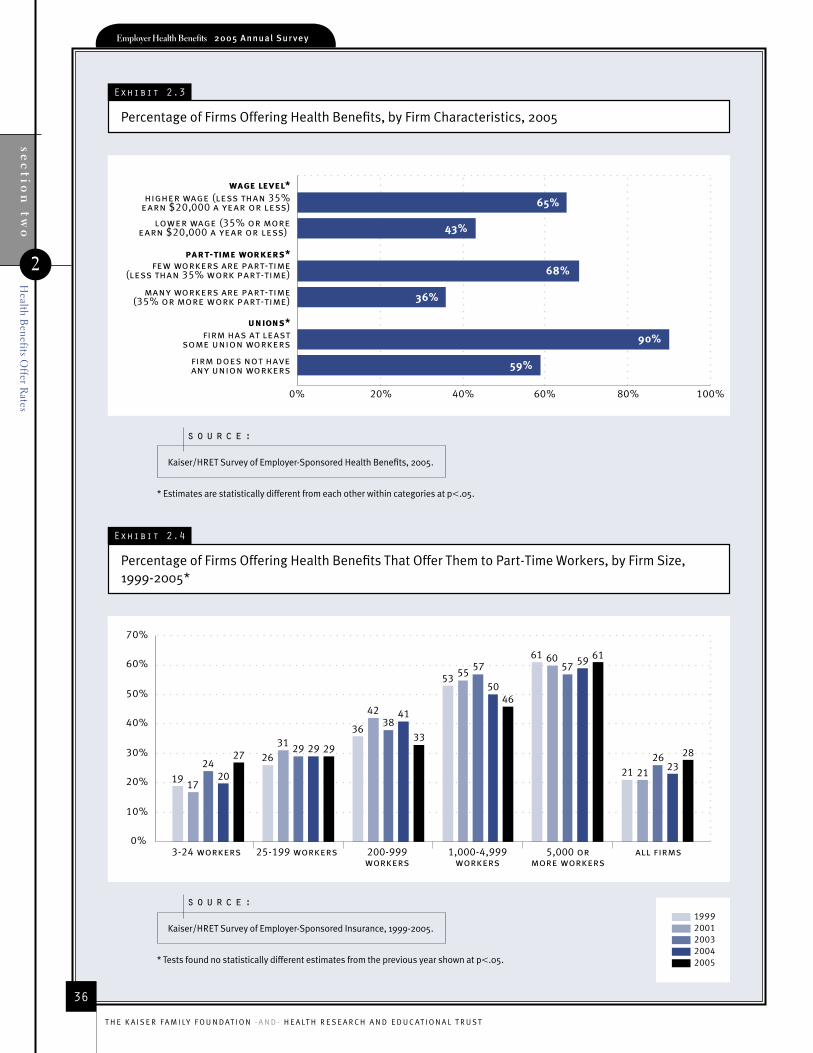
Employer Health Benefits 2005 Annual Sur vey
36
T H E K A I S E R F A M I LY F O U N D AT I O N - A N D - H E A LT H R E S E A R C H A N D E D U C AT I O N A L T R U S T
sec
tion
two
Health B
enefits Offer R
ates
2
Exhibit 2.3
Percentage of Firms Offering Health Benefits, by Firm Characteristics, 2005
0% 20% 40% 60% 80% 100%
59%
90%
36%
68%
43%
65%higher wage (less than 35%earn $20,000 a year or less)
lower wage (35% or moreearn $20,000 a year or less)
few workers are part-time(less than 35% work part-time)
many workers are part-time(35% or more work part-time)
wage level*
part-time workers*
unions*firm has at least
some union workers
firm does not haveany union workers
Exhibit 2.4
Percentage of Firms Offering Health Benefits That Offer Them to Part-Time Workers, by Firm Size, 1999-2005*
0%
10%
20%
30%
40%
50%
60%
70%
3-24 workers 25-199 workers 200-999workers
1,000-4,999workers
5,000 ormore workers
all firms
19992001200320042005
19 17
2420
27 2631 29 29 29
36
4238
41
33
53 5557
5046
61 6057 59 61
21 21
2623
28
* Estimates are statistically different from each other within categories at p.05.
Kaiser/HRET Survey of Employer-Sponsored Health Benefits, 2005.
s o u r c e :
* Tests found no statistically different estimates from the previous year shown at p.05.
Kaiser/HRET Survey of Employer-Sponsored Insurance, 1999-2005.
s o u r c e :

sec
tion
two
Health B
enefits Offer R
atesEmployer Health Benefits 2005 Annual Sur vey
37
T H E K A I S E R F A M I LY F O U N D AT I O N - A N D - H E A LT H R E S E A R C H A N D E D U C AT I O N A L T R U S T
2
Exhibit 2.5
Percentage of Firms Offering Health Benefits That Offer Them to Temporary Workers, by Firm Size, 1999-2005*
0%
5%
10%
15%
20%
25%
3-24 workers 25-199 workers 200-999workers
1,000-4,999workers
5,000 ormore workers
all firms
19992001200320042005
54
1
4
23 3 3 3
5
3
6
98
56
9
76
5
87
10
7
9
4 4
2
43
Exhibit 2.6
Among Firms Not Offering Health Benefits, Reasons for Not Offering, 2005
* Tests found no statistically different estimates from the previous year shown at p.05.
Kaiser/HRET Survey of Employer-Sponsored Insurance, 1999-2005.
s o u r c e :
Kaiser/HRET Survey of Employer-Sponsored Insurance, 2005.
s o u r c e :
Very Somewhat Not Too Not At All Don’t Important Important Important Important Know
High Premiums 73% 13% 5% 9% <1%
Employees Covered Elsewhere 33 26 13 25 3
High Turnover 16 13 23 49 0
Obtain Good Employees Without Offering A Health Plan 22 32 18 27 2
Administrative Hassle 14 29 25 28 3
Firm Too Newly Established 2 9 9 80 0
Firm Is Too Small 52 21 9 19 0
Firm Has Seriously Ill Employee 4 6 5 82 3

Employer Health Benefits 2005 Annual Sur vey
38
T H E K A I S E R F A M I LY F O U N D AT I O N - A N D - H E A LT H R E S E A R C H A N D E D U C AT I O N A L T R U S T
sec
tion
two
Health B
enefits Offer R
ates
2
Exhibit 2.7
Distribution of Firms‡ by the Amounts They Believe They and Their Employees Could Afford to Pay for Health Insurance and by Their Estimate of the Cost of Coverage, Per Month, 2005
0% 10% 20% 30% 40% 50% 60% 70% 80% 90% 100%
2005*
2003
employees would prefer higher wages
employees would prefer health insurance
don’t know
72% 19% 9%
71% 26% 4%
Exhibit 2.8
Among Firms Not Offering Health Benefits, Beliefs About Employees’ Preferences for Higher Wages or Health Insurance Benefits, 2003 and 2005‡
‡ Among firms that do not offer health benefits to active workers.
Note: Average premiums for single coverage in 2005 are $335 per month, with a monthly worker contribution of $51. Average premiums for family coverage in 2005 are $907 per month, with a monthly worker contribution of $226.
Kaiser/HRET Survey of Employer-Sponsored Health Benefits, 2005.
s o u r c e :
‡ The survey asks firms, “To the best of your knowledge, if your firm could afford to pay your employees an additional $2 per hour (approximately $4,000 a year), in which way do you think your employees would prefer to receive the additional funds?”
* Distribution is statistically different from previous year shown at p.05.
Kaiser/HRET Survey of Employer-Sponsored Health Benefits, 2003, 2005.
s o u r c e :
Distribution of Firms Distribution of Firms Distribution of Firms by Amount They Think by Amount They Think Their by Their Estimate They Could Afford to Pay Employees Could Afford of the Cost Amount Per Month for Health Insurance to Pay for Health Insurance of Health Insurance
Less than $100 22% 36% 8%
$100-$199 19% 27% 27%
$200-$299 23% 16% 23%
$300-$399 8% 1% 15%
$400 or more 4% 3% 22%
Don’t Know 24% 17% 5%

73%
9.2%$10,
880
810,000Employer Health Benefits
2005 Annual Survey
s e c t i o n
E m p l o y e e
C o v e ra g e ,
E l i g i b i l i t y, a n d
Pa r t i c i p a t i o n
3
73%
9.2%$10,
880
810,000Employer Health Benefits
2005 Annual Survey
s e c t i o n
E m p l o y e e
C o v e ra g e ,
E l i g i b i l i t y, a n d
Pa r t i c i p a t i o n
3
Employer Health Benefits 2 0 0 5 A n n ua l S u rve y
section
three
Em
ployee Coverage, E
ligibility, and Participation
3
40
T H E K A I S E R F A M I LY F O U N D AT I O N - A N D - H E A LT H R E S E A R C H A N D E D U C AT I O N A L T R U S T
EMPLOYEE COVERAGE, ELIGIBILITY, AND PARTICIPATION
E M P L O Y E R S A R E T H E P R I N C I P A L S O U R C E O F H E A L T H I N S U R A N C E I N T H E U N I T E D S T A T E S ,
P R O V I D I N G H E A L T H B E N E F I T S T O O V E R 6 0 % O F N O N E L D E R L Y P E O P L E I N 2 0 0 3 . 3 S I X T Y - S I X
P E R C E N T O F E M P L O Y E E S W O R K I N G I N F I R M S T H A T O F F E R B E N E F I T S A R E C O V E R E D B Y T H E I R
F I R M S ’ H E A L T H C O V E R A G E . M O S T W O R K E R S A R E O F F E R E D H E A L T H C O V E R A G E A T W O R K , A N D
T H E V A S T M A J O R I T Y O F W O R K E R S W H O A R E O F F E R E D C O V E R A G E T A K E I T . W O R K E R S M A Y N O T
B E C O V E R E D B Y T H E I R O W N E M P L O Y E R F O R S E V E R A L R E A S O N S : T H E I R E M P L O Y E R M A Y N O T
O F F E R C O V E R A G E , T H E Y M A Y B E I N E L I G I B L E F O R B E N E F I T S O F F E R E D B Y T H E I R F I R M , O R T H E Y
M A Y R E F U S E A N O F F E R O F C O V E R A G E F R O M T H E I R F I R M .
• In firms offering health benefits, 66% of workers are covered by their firms’ health plan (EXHIBIT 3.2). The rate of coverage varies by certain characteristics of the firm, such as industry and the percentage of part-time and low wage employees.
• Coverage rates in firms offering health benefits do not differ significantly by firm size, but they do vary by industry, likely due to differences in eligibility. The coverage rate for workers in the retail industry is 46%, compared to 83% for state and local government workers and 79% for those working in the transportation, communication, and utility industries, and 79% in the manufacturing industry (EXHIBIT 3.2).
• Among firms offering health benefits, higher wage firms—where fewer than 35% of workers earn $20,000 or less annually—have higher coverage rates than lower wage firms—where 35% or more of workers earn $20,000 or less annually. Seventy percent of workers in higher wage firms that offer health benefits are covered, compared to 49% of workers in lower wage firms offering benefits.
• Even in firms that offer coverage, not all employees are eligible for their firm’s health benefits. Additionally, not all eligible employees with an offer of health coverage take the offer of coverage. The number of workers covered is a product of both the percentage of workers who are actually eligible for the firm’s health
insurance and the percentage who choose to “take-up” (i.e., elect to participate in) the benefit.
• Eligibility for health benefits does not vary by firm size and is unchanged from last year. Overall, 80% of workers in firms offering health benefits are eligible for coverage (EXHIBIT 3.2).
• Employees who are offered coverage through their employer generally elect to take the offer. Eighty percent of workers in small firms (3-199 workers) and 84% of workers in large firms (200 or more workers) take-up coverage. These numbers are statistically unchanged from 2004 (EXHIBIT 3.2).
• The likelihood of accepting a firm’s offer of coverage varies by firm wage level. Employees in higher wage firms—where fewer than 35% of workers earn $20,000 or less annually—are more likely to take-up coverage (84%) than employees in lower wage firms (74%) – where 35% or more of workers earn $20,000 or less annually.
• Most covered workers work in firms that impose a waiting period before coverage is available to new employees. Seventy-five percent of covered workers face a waiting period before coverage is available (EXHIBIT 3.7).
• The average waiting period among all covered workers is essentially unchanged from last year at 1.7 months (EXHIBIT 3.6).
3 Kaiser Family Foundation, Kaiser Commission on Medicaid and the Uninsured. Health Insurance Coverage in America: 2003 Data Update, November 2004.
n o t e :

Employer Health Benefits 2005 Annual Sur vey
41
T H E K A I S E R F A M I LY F O U N D AT I O N - A N D - H E A LT H R E S E A R C H A N D E D U C AT I O N A L T R U S T
section
three
Em
ployee Coverage, E
ligibility, and Participation
3
2000 2001 2002 2003 2004 2005
FIRM SIZE
3 - 24 Workers 50% 49% 45% 44% 43% 41%
25 - 49 Workers 63 62 57 59 56 55
50 - 199 Workers 62 67 64 61 56 59
200 - 999 Workers 69 71 69 68 69 65
1,000 - 4,999 Workers 68 69 70 69 68 69
5,000 or More Workers 66 69 68 68 67 66
ALL SMALL FIRMS (3 - 199 W ORKERS) 57% 58% 54% 53% 50% 50%
ALL LARGE FIRMS (200 OR MORE W ORKERS) 67% 69% 69% 68% 68% 66%
ALL FIRMS 63% 65% 63% 62% 61% 60%
Exhibit 3.1
Percentage of Workers Covered by Their Employers’ Health Benefits, in Firms Both Offering and Not Offering Health Benefits, by Firm Size, 2000-2005*
* Tests found no statistically different estimates from the previous year shown at p.05.
Note: The total percentage of covered workers in this figure is calculated from the universe of all workers – including those in firms that do not offer coverage.
Kaiser/HRET Survey of Employer-Sponsored Health Benefits, 2000-2005.
s o u r c e :

Employer Health Benefits 2005 Annual Sur vey
42
T H E K A I S E R F A M I LY F O U N D AT I O N - A N D - H E A LT H R E S E A R C H A N D E D U C AT I O N A L T R U S T
section
three
Em
ployee Coverage, E
ligibility, and Participation
3
Percentage of Workers Percentage of Workers Percentage of Workers Eligible For Health Who Participate in Covered by Benefits Offered Their Employers’ Plan Their Employers’ By Their Employer (Take-up Rate) Health Benefits
FIRM SIZE
Small (3 - 24 Workers) 84% 79% 67%
Small (25 - 49 Workers) 84 77* 64
Small (50 - 199 Workers) 78 83 65
ALL SMALL FIRMS (3 - 199 W ORKERS) 81% 80% 65%
Midsize (200 - 999 Workers) 78 83 66
Large (1,000 - 4,999 Workers) 81 85* 69
Jumbo (5,000 or More Workers) 78 84 66
ALL LARGE FIRMS (200 OR MORE WORKERS) 79% 84% 67%
REGION
Northeast 80% 83% 67%
Midwest 80 80 64
South 81 84 68
West 77 84 65
INDUSTRY
Mining/Construction/Wholesale 80% 81% 64%
Manufacturing 91* 86 79*
Transportation/Communications/Utility 88* 90* 79*
Retail 61* 77* 46*
Finance 87* 83 73*
Service 77 80* 62*
State/Local Government 89* 93* 83*
Health Care 77 84 65
ALL FIRM SIZES, REGIONS, AND INDUSTRIES 80% 83% 66%
Exhibit 3.2
Eligibility, Take-up Rates, and Coverage in Firms Offering Health Benefits, by Firm Size, Region, and Industry, 2005
* Estimate is statistically different from All Firm Sizes, Regions, and Industries at p.05.
Take-up rate: The percentage of eligible workers who choose to participate in health benefits offered by their employer.
Kaiser/HRET Survey of Employer-Sponsored Health Benefits, 2005.
s o u r c e :

Employer Health Benefits 2005 Annual Sur vey
43
T H E K A I S E R F A M I LY F O U N D AT I O N - A N D - H E A LT H R E S E A R C H A N D E D U C AT I O N A L T R U S T
section
three
Em
ployee Coverage, E
ligibility, and Participation
3
Exhibit 3.3
Percentage of Workers Eligible For Health Benefits Offered By Their Employer, by Firm Size, 1999-2005
10%
20%
30%
40%
50%
60%
70%
80%
90%
100%
all small firms(3-199 workers)
all large firms(200 or more workers)
all firms
1999
2001
2003
2004
2005
81%85%* 84%
80% 81% 78%82%* 80% 81% 79% 79%
83%* 81% 80% 80%
Exhibit 3.4
Percentage of Workers in Firms Offering Health Benefits Who Participate in (Take-up) Their Employers’ Health Plan, by Firm Size, 1999-2005*
10%
0%
20%
30%
40%
50%
60%
70%
80%
90%
100%
all small firms(3-199 workers)
all large firms(200 or more workers)
all firms
1999
2001
2003
2004
2005
83% 84% 81% 80% 80%84% 83% 84% 83% 84% 84% 83% 83% 82% 83%
* Tests found no statistically different estimates from the previous year shown at p.05.
Take-up rate: The percentage of eligible workers who choose to participate in health benefits offered by their employer.
Kaiser/HRET Survey of Employer-Sponsored Health Benefits, 1999-2005.
s o u r c e :
* Estimate is statistically different from the previous year shown at p.05.
Kaiser/HRET Survey of Employer-Sponsored Health Benefits, 1999-2005.
s o u r c e :

Employer Health Benefits 2005 Annual Sur vey
44
T H E K A I S E R F A M I LY F O U N D AT I O N - A N D - H E A LT H R E S E A R C H A N D E D U C AT I O N A L T R U S T
section
three
Em
ployee Coverage, E
ligibility, and Participation
3
Exhibit 3.5
Percentage of Workers in Firms Offering Health Benefits Who Are Covered by Their Employers’ Health Plan, by Firm Size, 1999-2005
10%
0%
20%
30%
40%
50%
60%
70%
80%
90%
100%
all small firms(3-199 workers)
all large firms(200 or more workers)
all firms
1999
2001
2003
2004
2005
67%71%* 68%
64% 65% 66% 69% 68% 68% 67% 66%70%* 68% 67% 66%
Exhibit 3.6
Average Waiting Period for New Employees to be Eligible for Health Coverage, 1999-2005*
0
0.5
1.0
1.5
2.0
1999 2000 2001 2002 2003 2004 2005
1.51.6 1.6
1.7 1.71.6
1.7
MONTHS
* Tests found no statistically different estimates from the previous year shown at p.05.
Note: Average waiting period includes those who have no waiting period to be eligible for health coverage.
Kaiser/HRET Survey of Employer-Sponsored Health Benefits, 1999-2005.
s o u r c e :
* Estimate is statistically different from the previous years shown at p.05.
Kaiser/HRET Survey of Employer-Sponsored Health Benefits, 1999-2005.
s o u r c e :

Employer Health Benefits 2005 Annual Sur vey
45
T H E K A I S E R F A M I LY F O U N D AT I O N - A N D - H E A LT H R E S E A R C H A N D E D U C AT I O N A L T R U S T
section
three
Em
ployee Coverage, E
ligibility, and Participation
3
Percentage of Covered Workers in Firms With Waiting Period
FIRM SIZE
All Small Firms (3 - 199 Workers) 80%
All Large Firms (200 or More Workers) 72%
REGION
Northeast 73%
Midwest 74
South 74
West 78
INDUSTRY
Mining/Construction/Wholesale 84%*
Manufacturing 75
Transportation/Communications/Utility 64
Retail 92*
Finance 71
Service 71
State/Local Government 66
Health Care 81
ALL FIRM SIZE S, REGIONS, AND INDUSTRIE S 75%
Exhibit 3.7
Percentage of Covered Workers in Firms with a Waiting Period for New Employees to Be Covered, by Firm Size, Region, and Industry, 2005
* Estimates are statistically different from All Firm Sizes, Regions, and Industries at p.05.
Kaiser/HRET Survey of Employer-Sponsored Health Benefits, 2005.
s o u r c e :

Employer Health Benefits 2005 Annual Sur vey
46
T H E K A I S E R F A M I LY F O U N D AT I O N - A N D - H E A LT H R E S E A R C H A N D E D U C AT I O N A L T R U S T
section
three
Em
ployee Coverage, E
ligibility, and Participation
3
Average Wait for Health Coverage (Months)
FIRM SIZE
ALL SMALL FIRMS (3 -199 W ORKERS) 2.0*
Midsize (200 - 999 Workers) 1.7
Large (1,000 - 4,999 Workers) 1.6
Jumbo (5,000 or More Workers) 1.4
ALL LARGE FIRMS (200 OR MORE W ORKERS) 1.5
REGION
Northeast 1.6
Midwest 1.4*
South 1.7
West 2.0
INDUSTRY
Mining/Construction/Wholesale 2.1*
Manufacturing 1.4
Transportation/Communications/Utility 1.4
Retail 3.0*
Finance 1.4
Service 1.6
State/Local Government 1.2*
Health Care 1.6
ALL FIRM SIZE S, REGIONS, AND INDUSTRIE S 1.7 MONTH S
Exhibit 3.8
Average Waiting Period For New Employees to be Eligible for Health Coverage, by Firm Size, Region, and Industry, 2005
* Estimates are statistically different from All Firm Sizes, Regions, and Industries at p.05.
Note: Average waiting period includes covered workers who have no waiting period to be eligible for health coverage.
Kaiser/HRET Survey of Employer-Sponsored Health Benefits, 2005.
s o u r c e :

Employer Health Benefits 2005 Annual Sur vey
47
T H E K A I S E R F A M I LY F O U N D AT I O N - A N D - H E A LT H R E S E A R C H A N D E D U C AT I O N A L T R U S T
section
three
Em
ployee Coverage, E
ligibility, and Participation
3
Exhibit 3.9
Distribution of Covered Workers Electing Single Coverage, Single Plus One Coverage, or Family Coverage, by Firm Size, 2001-2005
0% 10% 20% 30% 40% 50% 60% 70% 80% 90% 100%
2005
2003*
2001
2005
2003
2001
2005
2003*
2001
all small firms(3-199 workers)
all large firms(200 or more workers)
single coverage
single plus one coverage
family coverage
all firms
51% 10% 39%
54% 13% 33%
54% 13% 32%
41% 16% 43%
41% 18% 41%
40% 19% 41%
45% 14% 41%
45% 16% 39%
45% 17% 38%
* Distribution is statistically different from previous year shown at p.05.
Note: Single Plus One coverage includes either an employee plus a spouse or an employee with a child.
Kaiser/HRET Survey of Employer-Sponsored Health Benefits, 2001-2005.
s o u r c e :


73%
9.2%$10,
880
810,000Employer Health Benefits
2005 Annual Survey
s e c t i o n
H e a l t h
P l a n
C h o i c e
4

Employer Health Benefits 2 0 0 5 A n n ua l S u rve y
sec
tion
fou
rH
ealth Plan Choice
4
50
T H E K A I S E R F A M I LY F O U N D AT I O N - A N D - H E A LT H R E S E A R C H A N D E D U C AT I O N A L T R U S T
HEALTH PLAN CHOICE
M O S T C O V E R E D W O R K E R S C A N C H O O S E A M O N G S E V E R A L T Y P E S O F H E A L T H P L A N S , I N C L U D -
I N G C O N V E N T I O N A L , H M O , P P O , A N D P O S . P P O S R E M A I N T H E M O S T C O M M O N P L A N T Y P E
A V A I L A B L E T O C O V E R E D W O R K E R S W H O H A V E A C H O I C E O F P L A N S .
• PPOs are the most common health plan offered to workers, followed by HMO plans, POS plans, and conventional plans.
• The percentage of covered workers that have the option of electing a PPO plan is essentially unchanged from last year at 82%. The percentage of covered workers with the option to enroll in a POS plan (28%) is also similar to last year (EXHIBIT 4.1).
• The option of enrolling in an HMO has decreased slightly since last year. Forty-four percent of covered workers have the option of enrolling in an HMO, compared with 54% in 2004 (EXHIBIT 4.1).
• The percentage of covered workers who can choose from multiple health plans (63%) has remained relatively stable since 1996 (EXHIBIT 4.3).
• Health plan choice varies by firm size, with covered workers in large firms (200 or more workers) more likely than covered workers in small firms (3-199 workers) to have a choice between two or more health plans. Seventy-eight percent of covered workers in large firms have a choice of health plans, compared with 33% of covered workers in small firms (EXHIBIT 4.4).
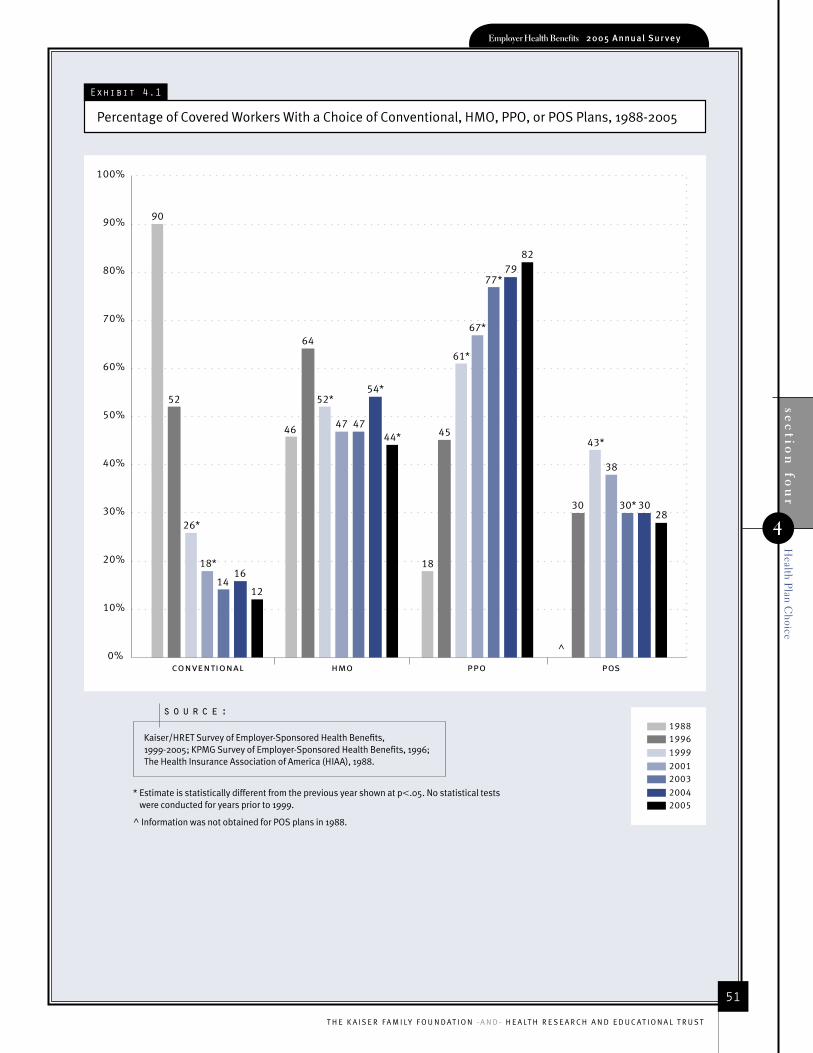
sec
tion
fou
rH
ealth Plan Choice
Employer Health Benefits 2005 Annual Sur vey
51
T H E K A I S E R F A M I LY F O U N D AT I O N - A N D - H E A LT H R E S E A R C H A N D E D U C AT I O N A L T R U S T
4
Exhibit 4.1
Percentage of Covered Workers With a Choice of Conventional, HMO, PPO, or POS Plans, 1988-2005
0%
10%
20%
30%
40%
50%
60%
70%
80%
90%
100%
conventional hmo ppo pos
19881996
1999
20012003
20042005
90
52
26*
18*
1416
12
46
64
52*
47 47
54*
44*
18
45
61*
67*
7982
30
43*
38
30* 3028
^
77*
* Estimate is statistically different from the previous year shown at p.05. No statistical tests were conducted for years prior to 1999.
^ Information was not obtained for POS plans in 1988.
Kaiser/HRET Survey of Employer-Sponsored Health Benefits, 1999-2005; KPMG Survey of Employer-Sponsored Health Benefits, 1996; The Health Insurance Association of America (HIAA), 1988.
s o u r c e :
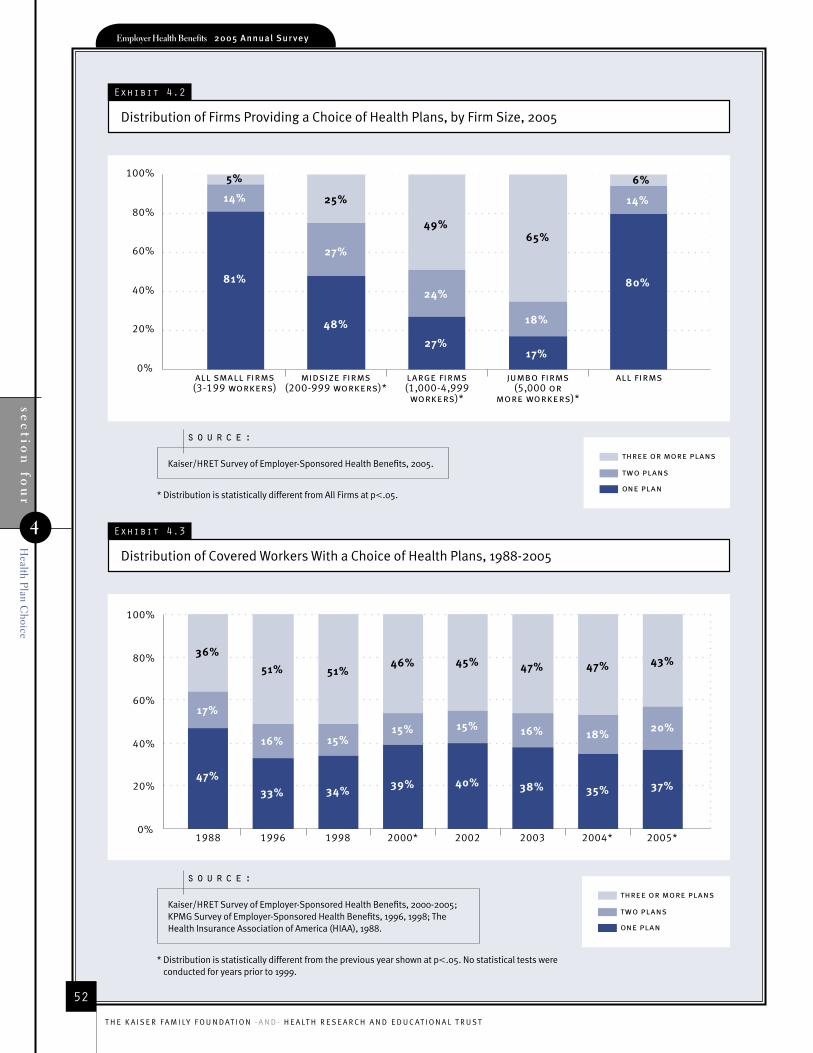
Employer Health Benefits 2005 Annual Sur vey
52
T H E K A I S E R F A M I LY F O U N D AT I O N - A N D - H E A LT H R E S E A R C H A N D E D U C AT I O N A L T R U S T
sec
tion
fou
rH
ealth Plan Choice
4
Exhibit 4.2
Distribution of Firms Providing a Choice of Health Plans, by Firm Size, 2005
0%
20%
40%
60%
80%
100%
all small firms(3-199 workers)
midsize firms(200-999 workers)*
large firms(1,000-4,999
workers)*
jumbo firms(5,000 or
more workers)*
all firms
three or more plans
two plans
one plan
5%
25%
49%65%
6%
14%
81%
27%
48%
24%
27%
18%
17%
14%
80%
Exhibit 4.3
Distribution of Covered Workers With a Choice of Health Plans, 1988-2005
0%
20%
40%
60%
80%
100%
1988 1996 1998 2000* 2002 2003 2004* 2005*
three or more plans
two plans
one plan
36%
51% 51%46% 45% 47% 47% 43%
17%
47%
16%
33%
15%
34%
15%
39%
15%
40%
16%
38%
18%
35%
20%
37%
* Distribution is statistically different from the previous year shown at p.05. No statistical tests were conducted for years prior to 1999.
Kaiser/HRET Survey of Employer-Sponsored Health Benefits, 2000-2005; KPMG Survey of Employer-Sponsored Health Benefits, 1996, 1998; The Health Insurance Association of America (HIAA), 1988.
s o u r c e :
* Distribution is statistically different from All Firms at p.05.
Kaiser/HRET Survey of Employer-Sponsored Health Benefits, 2005.
s o u r c e :

sec
tion
fou
rH
ealth Plan Choice
Employer Health Benefits 2005 Annual Sur vey
53
T H E K A I S E R F A M I LY F O U N D AT I O N - A N D - H E A LT H R E S E A R C H A N D E D U C AT I O N A L T R U S T
4
One Plan Two Plans Three or More Plans
1996
All Small Firms (3 - 199 Workers)* 79% 15% 6%
All Large Firms (200 or More Workers)* 21 17 63
ALL FIRM SIZE S 33% 16% 51%
1999
All Small Firms (3 - 199 Workers)* 76% 16% 8%
All Large Firms (200 or More Workers)* 20 18 62
ALL FIRM SIZE S 39% 17% 44%
2000
All Small Firms (3 - 199 Workers)* 77% 14% 9%
All Large Firms (200 or More Workers)* 20 15 65
ALL FIRM SIZE S 39% 15% 46%
2001
All Small Firms (3 - 199 Workers)* 76% 15% 9%
All Large Firms (200 or More Workers)* 23 16 61
ALL FIRM SIZE S 41% 16% 43%
2002
All Small Firms (3 - 199 Workers)* 76% 15% 10%
All Large Firms (200 or More Workers)* 23 15 62
ALL FIRM SIZE S 40% 15% 45%
2003
All Small Firms (3 - 199 Workers)* 62% 17% 21%
All Large Firms (200 or More Workers)* 26 15 59
ALL FIRM SIZE S 38% 16% 47%
2004
All Small Firms (3 - 199 Workers)* 73% 17% 10%
All Large Firms (200 or More Workers)* 18 18 63
ALL FIRM SIZE S 35% 18% 47%
2005
All Small Firms (3 - 199 Workers)* 67% 21% 12%
All Large Firms (200 or More Workers)* 22 19 59
ALL FIRM SIZE S 37% 20% 43%
Exhibit 4.4
Distribution of Covered Workers With a Choice of Health Plans, by Firm Size, 1996-2005
* Distribution is statistically different from All Firm Sizes within a year at p.05.
Kaiser/HRET Survey of Employer-Sponsored Health Benefits, 1999-2005; KPMG Survey of Employer-Sponsored Health Benefits, 1996.
s o u r c e :
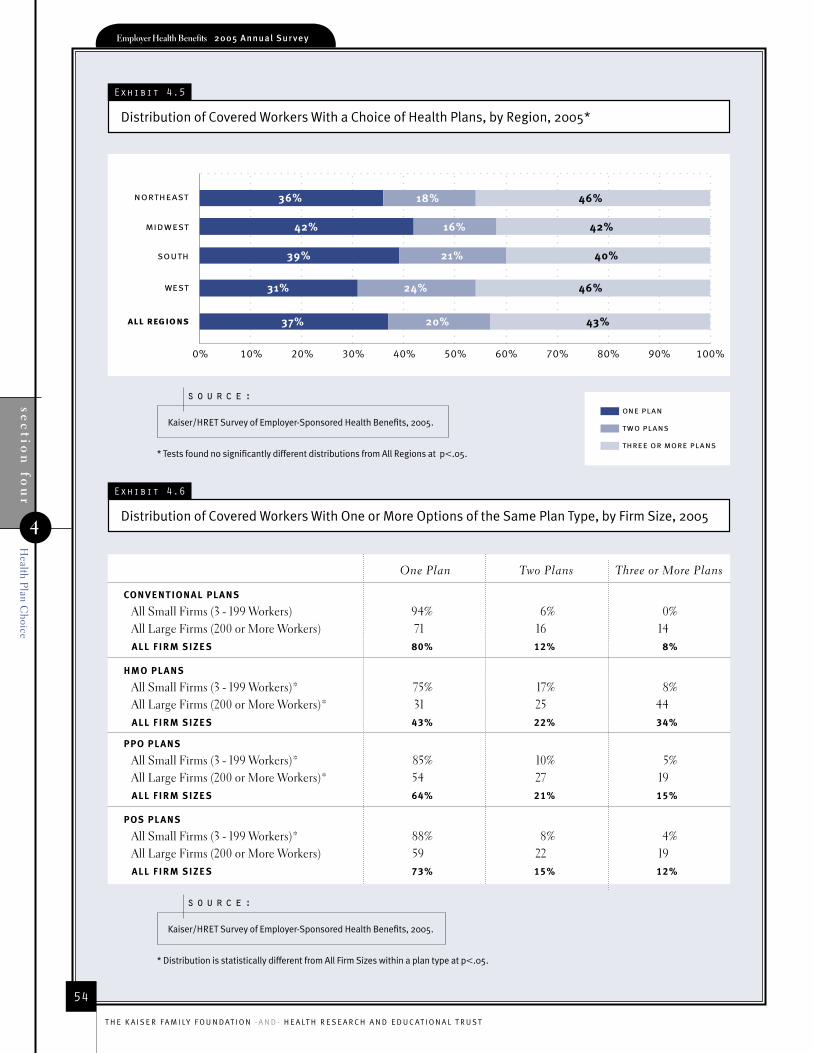
Employer Health Benefits 2005 Annual Sur vey
54
T H E K A I S E R F A M I LY F O U N D AT I O N - A N D - H E A LT H R E S E A R C H A N D E D U C AT I O N A L T R U S T
sec
tion
fou
rH
ealth Plan Choice
4
Exhibit 4.5
Distribution of Covered Workers With a Choice of Health Plans, by Region, 2005*
0% 10% 20% 30% 40% 50% 60% 70% 80% 90% 100%
one plan
two plans
three or more plans
36% 18%
42% 16%
39% 21%
31% 24%
37% 20%
46%
42%
40%
46%
43%
west
south
midwest
northeast
all regions
Exhibit 4.6
Distribution of Covered Workers With One or More Options of the Same Plan Type, by Firm Size, 2005
* Distribution is statistically different from All Firm Sizes within a plan type at p.05.
Kaiser/HRET Survey of Employer-Sponsored Health Benefits, 2005.
s o u r c e :
* Tests found no significantly different distributions from All Regions at p.05.
Kaiser/HRET Survey of Employer-Sponsored Health Benefits, 2005.
s o u r c e :
One Plan Two Plans Three or More Plans
CONVENTIONAL PLANS
All Small Firms (3 - 199 Workers) 94% 6% 0%All Large Firms (200 or More Workers) 71 16 14ALL FIRM SIZE S 80% 12% 8%
HMO PLANS
All Small Firms (3 - 199 Workers)* 75% 17% 8%All Large Firms (200 or More Workers)* 31 25 44ALL FIRM SIZE S 43% 22% 34%
PPO PLANS
All Small Firms (3 - 199 Workers)* 85% 10% 5%All Large Firms (200 or More Workers)* 54 27 19ALL FIRM SIZE S 64% 21% 15%
POS PLANS
All Small Firms (3 - 199 Workers)* 88% 8% 4%All Large Firms (200 or More Workers) 59 22 19ALL FIRM SIZE S 73% 15% 12%

73%
9.2%$10,
880
810,000Employer Health Benefits
2005 Annual Survey
s e c t i o n
M a rk e t
S h a re s o f
H e a l t h P l a n s
5

Employer Health Benefits 2 0 0 5 A n n ua l S u rve y
Market Shares of H
ealth Plansse
ctio
n fiv
e
5
56
T H E K A I S E R F A M I LY F O U N D AT I O N - A N D - H E A LT H R E S E A R C H A N D E D U C AT I O N A L T R U S T
MARKET SHARES OF HEALTH PLANS
P P O P L A N S E N R O L L T H R E E - I N - F I V E C O V E R E D W O R K E R S , F O L L O W E D B Y H M O P L A N S , P O S
P L A N S , A N D T H E N C O N V E N T I O N A L P L A N S . E N R O L L M E N T I N P P O P L A N S G R E W S I G N I F I C A N T L Y
I N 2 0 0 5 , W H I L E E N R O L L M E N T I N H M O P L A N S D R O P P E D B Y 4 P E R C E N T A G E P O I N T S .
• With the highest enrollment, PPO plans cover 61% of covered workers, up from 55% in 2004. HMOs, the plan with the second highest enrollment, fell to 21% of total covered workers from 25% last year. Conventional plans remain at the lowest level of enrollment, covering just 3% of covered workers in 2005 (EXHIBIT 5.1).4
• There are slight regional differences in plan enrollment. PPO plans have higher enrollment in the Midwest (70%). HMO enrollment is highest in the West (32%) (EXHIBIT 5.2).
4 A portion of the change in enrollment for 2005 is likely attributable to incorporating more recent Census Bureau estimates of the number of state and local government workers and removing federal workers from the weights. See the Survey Design and Methods section for additional information.
n o t e :

Market Shares of H
ealth PlansEmployer Health Benefits 2005 Annual Sur vey
57
T H E K A I S E R F A M I LY F O U N D AT I O N - A N D - H E A LT H R E S E A R C H A N D E D U C AT I O N A L T R U S T
sec
tion
five
5
Exhibit 5.1
Distribution of Health Plan Enrollment for Covered Workers, by Plan Type, 1988-2005
0% 10% 20% 30% 40% 50% 60% 70% 80% 90% 100%
2005*
2004
2003*
2002*
2001*
2000*
1999*
1998
1996
1993
1988^
conventional
hmo
ppo
pos
73% 16% 11%
46% 21% 26%
27% 31% 28%
14% 27% 35%
10% 28% 39%
8% 29% 42%
7% 24% 46%
4% 27% 52%
5% 24% 54%
5% 25% 55%
3% 21% 61%
7%
14%
24%
24%
21%
23%
18%
17%
15%
15%
* Distribution is statistically different from the previous year shown at p.05. No statistical tests were conducted for years prior to 1999.
^ Information was not obtained for POS plans in 1988.
Note: A portion of the change in enrollment for 2005 is likely attributable to incorporating more recent Census Bureau estimates of the number of state and local government workers and removing federal workers from the weights. See the Survey Design and Methods section for additional information.
Kaiser/HRET Survey of Employer-Sponsored Health Benefits, 1999-2005; KPMG Survey of Employer-Sponsored Health Benefits, 1993, 1996, 1998; The Health Insurance Association of America (HIAA), 1988.
s o u r c e :

Market Shares of H
ealth Plans
Employer Health Benefits 2005 Annual Sur vey
58
T H E K A I S E R F A M I LY F O U N D AT I O N - A N D - H E A LT H R E S E A R C H A N D E D U C AT I O N A L T R U S T
sec
tion
five
5
Conventional HMO PPO POS
FIRM SIZE
Small (3 - 24 Workers) 4% 13%* 57% 26%*
Small (25 - 49 Workers) 4 22 48* 26*
Small (50 - 199 Workers) 3 19 65 14
ALL SMALL FIRMS (3 - 199 W ORKERS) 3% 18% 58% 21%*
Midsize (200 - 999 Workers) 3 20 66 11
Large (1,000 - 4,999 Workers) 1* 23 67* 9*
Jumbo (5,000 or More Workers) 3 24 60 13
ALL LARGE FIRMS (200 OR MORE W ORKERS) 3% 23% 63% 12%
REGION
Northeast 4% 23% 54%* 19%
Midwest 3 16* 70* 11
South 3 17* 66 14
West 2 32* 51* 15
INDUSTRY
Mining/Construction/Wholesale 5% 13%* 66% 16%
Manufacturing 3 19 66 12
Transportation/Communications/Utility 3 20 71 6*
Retail 4 19 56 22
Finance 3 22 64 11
Service 2 22 56 20*
State/Local Government 3 35* 52 11
Health Care 2 20 69 10
ALL FIRM SIZE S, REGIONS, AND INDUSTRIE S 3% 21% 61% 15%
Exhibit 5.2
Health Plan Enrollment, by Firm Size, Region, and Industry, 2005
* Estimate is statistically different from All Firm Sizes, Regions, and Industries at p.05.
Kaiser/HRET Survey of Employer-Sponsored Health Benefits: 2005.
s o u r c e :

73%
9.2%$10,
880
810,000Employer Health Benefits
2005 Annual Survey
s e c t i o n
E m p l o y e e
C o v e ra g e ,
E l i g i b i l i t y, a n d
Pa r t i c i p a t i o n
3
73%
9.2%$10,
880
810,000Employer Health Benefits
2005 Annual Survey
s e c t i o n
E m p l o y e e
C o n t r i b u t i o n s
f o r P re m i u m s
6

Em
ployee Con
tribution
s for Prem
ium
sse
ctio
n six
6
Employer Health Benefits 2 0 0 5 A n n ua l S u rve y
60
T H E K A I S E R F A M I LY F O U N D AT I O N - A N D - H E A LT H R E S E A R C H A N D E D U C AT I O N A L T R U S T
EMPLOYEE CONTRIBUTIONS FOR PREMIUMS
T H E S H A R E O F T O T A L P R E M I U M S P A I D B Y C O V E R E D W O R K E R S I S E S S E N T I A L L Y U N C H A N G E D I N
2 0 0 5 . A C R O S S A L L P L A N T Y P E S , O N A V E R A G E , W O R K E R S P A Y 1 6 % O F P R E M I U M S F O R S I N G L E
C O V E R A G E A N D 2 6 % O F P R E M I U M S F O R F A M I L Y C O V E R A G E . T H E A V E R A G E M O N T H L Y W O R K E R
C O N T R I B U T I O N F O R S I N G L E C O V E R A G E I S $ 5 1 I N 2 0 0 5 . F O R F A M I L Y C O V E R A G E , T H E A V E R A G E
M O N T H L Y W O R K E R C O N T R I B U T I O N I S $ 2 2 6 .
• The average percentage of total premiums that workers pay is essentially unchanged from last year: 16% across plan types for single coverage and 26% for family coverage. Percentage contributions for family coverage have been stable over time, while those for single coverage declined between 1996 and 1999 (from 21% to 14%) and have been stable since that time (EXHIBIT 6.2).
• The average monthly worker contribution for single coverage is $51 in 2005. For family coverage, the average monthly worker contribution is $226 (EXHIBIT 6.1).
• On an annual basis, the average worker contribution averages $610 for single coverage and $2,713 for family coverage. Workers in small firms (3 to 199 workers) contribute significantly more ($3,170 annually) on average towards family coverage than workers in large firms (200 or more workers) contribute ($2,487 annually) (EXHIBIT 6.3, 6.4).
• Virtually all covered workers receive a premium contribution of 50% or more from their employer. The majority of covered workers receive a premium contribution from their firm of between 75% and 100% for single coverage and between 50% and 100% for family coverage (EXHIBIT 6.8, 6.9).
• The percentage of covered workers whose employers pay the full cost of single coverage is 21% and the percentage of covered workers whose employers pay the full cost of family coverage is 9% (EXHIBIT 6.8, 6.9).
• Covered workers in small firms (3-199 workers) are more likely to have their employer pay the full cost of coverage than covered workers in large firms (200 or more workers) for both single and family coverage. Forty-one percent of covered workers in small firms have an employer that pays the entire premium for single coverage, compared to 12% of covered workers in large firms. For family coverage, 18% percent of covered workers in small firms have an employer that pays the entire premium for single coverage compared to 5% of covered workers in large firms (EXHIBIT 6.8, 6.9).
• Covered workers in lower wage firms—where 35% or more earn $20,000 or less per year— pay a higher percentage of their premium costs than covered workers in higher wage firms—where fewer than 35% earn $20,000 or less per year. On average, covered workers in low wage firms contribute 20% for single coverage and 36% of the premium for family coverage while covered workers in high wage firms contribute 15% for single coverage and 25% of the family premium. Covered workers in firms that partially or entirely self fund their health benefits pay a higher share of the premium for family coverage (32%) than covered workers in firms that are fully insured (21%) (EXHIBIT 6.10).
• Just 10% of covered workers are in firms that vary the employee’s premium contribution based on the employee’s wage level. Small firms (3-199 workers) are much less likely to do so, at 2%, versus 14% for workers in all large firms (200 or more workers). Varying the employee’s premium contribution based on participation in a wellness program is even less common, affecting just 3% of covered workers (EXHIBIT 6.16).

sec
tion
sixE
mployee C
ontribu
tions for P
remiu
ms
6
Employer Health Benefits 2005 Annual Sur vey
61
T H E K A I S E R F A M I LY F O U N D AT I O N - A N D - H E A LT H R E S E A R C H A N D E D U C AT I O N A L T R U S T
Exhibit 6.1
Average Monthly Worker Premium Contributions for Single and Family Coverage, 1988-2005
$0
$50
$100
$150
$200
$250
single coverage family coverage
19881996
19992000
20012003
20042005
$8
$37$27* $30
$42*$52
$122 $129
$149*
$201*
$47
$222*
$51
$226
$28
$135
Exhibit 6.2
Average Percentage of Premium Paid by Covered Workers for Single and Family Coverage, 1988-2005
0%
5%
10%
15%
20%
25%
30%
35%
single coverage family coverage
19881996
19992000
20012003
20042005
11%
21%
14%* 14%16%
29% 28% 27% 26% 27%
16%
28%
16%
26%
14%
26%
* Estimate is statistically different from the previous year shown at p.05. No statistical tests were conducted for years prior to 1999.
Note: Family coverage is defined as health coverage for a family of four.
Kaiser/HRET Survey of Employer-Sponsored Health Benefits, 1999-2005; KPMG Survey of Employer-Sponsored Health Benefits, 1996; The Health Insurance Association of America (HIAA), 1988.
s o u r c e :

Em
ployee Con
tribution
s for Prem
ium
sse
ctio
n six
6
Employer Health Benefits 2005 Annual Sur vey
62
T H E K A I S E R F A M I LY F O U N D AT I O N - A N D - H E A LT H R E S E A R C H A N D E D U C AT I O N A L T R U S T
Exhibit 6.3
Average Annual Premiums for Covered Workers for Single and Family Coverage, by Plan Type, 2005
$0 $2,000 $4,000 $6,000 $8,000 $10,000 $12,000
family
single
family
single
family
single
family
single
family
single
worker contribution
firm contribution
conventionalplans
hmo plans
ppo plans
pos plans
all plans
$498
$2,321
$563
$2,604
$603
$2,641
$731
$3,250
$610
$2,713
$3,284
$7,658
$3,203
$7,852
$3,547
$8,449
$3,183
$7,551
$3,413
$8,167
$3,782
$9,979
$3,767*
$10,456*
$4,150*
$11,090
$3,914
$10,801
$4,024
$10,880
* Estimate of total premium is statistically different from All Plans by coverage type shown at p.05.
Note: Family coverage is defined as health coverage for a family of four.
Kaiser/HRET Survey of Employer-Sponsored Health Benefits, 2005.
s o u r c e :

sec
tion
sixE
mployee C
ontribu
tions for P
remiu
ms
6
Employer Health Benefits 2005 Annual Sur vey
63
T H E K A I S E R F A M I LY F O U N D AT I O N - A N D - H E A LT H R E S E A R C H A N D E D U C AT I O N A L T R U S T
Exhibit 6.4
Average Monthly Worker Premium Contributions for Single and Family Coverage, by Plan Type and Firm Size, 2005
Monthly Annual
Single Coverage Family Coverage Single Coverage Family Coverage
CONVENTIONAL PLANS
All Small Firms (3 - 199 Workers) $37 $220 $440 $2,635
All Large Firms (200 or More Workers) 45 176 535 2,115
ALL FIRM SIZE S $41 $193 $498 $2,321
HMO PLANS
All Small Firms (3 - 199 Workers) $44 $269* $531 $3,227*
All Large Firms (200 or More Workers) 48 198 576 2,370
ALL FIRM SIZE S $47 $217 $563 $2,604
PPO PLANS
All Small Firms (3 - 199 Workers) $40* $254* $480* $3,050*
All Large Firms (200 or More Workers) 55 204 660 2,453
ALL FIRM SIZE S $50 $220 $603 $2,641
POS PLANS
All Small Firms (3 - 199 Workers) $67 $296 $805 $3,547
All Large Firms (200 or More Workers) 55 249 663 2,988
ALL FIRM SIZE S $61 $271 $731 $3,250
ALL PLANS
All Small Firms (3 - 199 Workers) $46 $264* $556 $3,170*
All Large Firms (200 or More Workers) 53 207* 638 2,487*
ALL FIRM SIZE S $51 $226 $610 $2,713
* Estimate is statistically different from All Firm Sizes within a plan type at p.05.
Note: Family coverage is defined as health coverage for a family of four.
Kaiser/HRET Survey of Employer-Sponsored Health Benefits, 2005.
s o u r c e :

Em
ployee Con
tribution
s for Prem
ium
sse
ctio
n six
6
Employer Health Benefits 2005 Annual Sur vey
64
T H E K A I S E R F A M I LY F O U N D AT I O N - A N D - H E A LT H R E S E A R C H A N D E D U C AT I O N A L T R U S T
Exhibit 6.5
Average Monthly Worker Premium Contributions for Single and Family Coverage, by Plan Type and Firm Size, 2005
Monthly Annual
Single Coverage Family Coverage Single Coverage Family Coverage
CONVENTIONAL PLANS
Northeast $20* $58* $235* $695*
Midwest 47 211 567 2,528
South 48 226 576 2,716
West NSD NSD NSD NSD
ALL REGIONS $41 $193 $498 $2,321
HMO PLANS
Northeast $59* $203 $708* $2,430
Midwest 49 179 591 2,146
South 55 268* 665 3,210*
West 30* 204 355* 2,444
ALL REGIONS $47 $217 $563 $2,604
PPO PLANS
Northeast $54 $173* $648 $2,073*
Midwest 55 202 660 2,429
South 54 263* 650 3,154*
West 31* 205 367* 2,454
ALL REGIONS $50 $220 $603 $2,641
POS PLANS
Northeast $70 $241 $837 $2,895
Midwest 57 226 681 2,707
South 59 346* 703 4,154*
West 57 225 680 2,699
ALL REGIONS $61 $271 $731 $3,250
ALL PLANS
Northeast $57 $188* $684 $2,260*
Midwest 54 201* 649 2,417*
South 55 274* 658 3,294*
West 35* 210 416* 2,514
ALL REGIONS $51 $226 $610 $2,713
* Estimate is statistically different from All Regions within a plan type at p.05.
Note: Family coverage is defined as health coverage for a family of four.
Kaiser/HRET Survey of Employer-Sponsored Health Benefits, 2005.
s o u r c e :

sec
tion
sixE
mployee C
ontribu
tions for P
remiu
ms
6
Employer Health Benefits 2005 Annual Sur vey
65
T H E K A I S E R F A M I LY F O U N D AT I O N - A N D - H E A LT H R E S E A R C H A N D E D U C AT I O N A L T R U S T
Exhibit 6.6
Average Monthly Worker Premium Contributions for Single and Family Coverage in Conventional and HMO Plans, 1988-2005
19881996
1999
20012003
20042005
conventional single conventional family hmo single hmo family$0
$40
$80
$120
$160
$200
$240
11
3321*
32 39
60
117112
198 198
9
4628*
42* 4658
151 150*
179*
223*
193
46
217
4126
134
32
124*
* Estimate is statistically different from the previous year shown at p.05. No statistical tests were conducted for years prior to 1999.
Note: Family coverage is defined as health coverage for a family of four.
Kaiser/HRET Survey of Employer-Sponsored Health Benefits, 1999-2005; KPMG Survey of Employer-Sponsored Health Benefits, 1996; The Health Insurance Association of America (HIAA), 1988.
s o u r c e :
Exhibit 6.7
Average Monthly Worker Premium Contributions for Single and Family Coverage in PPO and POS Plans, 1988-2005
19881996
199920012003
20042005
ppo single ppo family pos single pos family
7
4427*
44* 48
83
146128
210*224
^
4027*
41* 45
^
129143
206*218220
61*
271*
5029
153*
29
141
$0
$50
$100
$150
$200
$250
$300
* Estimate is statistically different from the previous year shown at p.05. No statistical tests were conducted for years prior to 1999.
^ Information was not obtained for POS plans in 1988.
Note: Family coverage is defined as health coverage for a family of four.
Kaiser/HRET Survey of Employer-Sponsored Health Benefits, 1999-2005; KPMG Survey of Employer-Sponsored Health Benefits, 1996; The Health Insurance Association of America (HIAA), 1988.
s o u r c e :

Em
ployee Con
tribution
s for Prem
ium
sse
ctio
n six
6
Employer Health Benefits 2005 Annual Sur vey
66
T H E K A I S E R F A M I LY F O U N D AT I O N - A N D - H E A LT H R E S E A R C H A N D E D U C AT I O N A L T R U S T
Exhibit 6.8
Distribution of Covered Workers by Percentage of Single Premium Contributed by Their Firm, by Firm Size, 2001-2005
0% 10% 20% 30% 40% 50% 60% 70% 80% 90% 100%
all small firms(3-199 workers)
all large firms(200 or more workers)
all firms
less than 50%greater than or equal to 50%, less than 75%greater than or equal to 75%, less than 100%100%
2005
2004*
2003*
2002*
2001
2005*
2004*
2003*
2002*
2001
2005
2004
2003
2002*
2001 5% 13% 25%
6% 14% 35%
2% 16% 63%
1% 18% 67%
3% 15% 50%
3% 17% 57%
6% 18% 36%
1% 20% 67%
3% 19% 57%
8% 13% 35%
5% 17% 35%
4% 14% 69%
1% 23% 65%
5% 13% 58%
2% 21% 56%
57%
45%
19%
14%
32%
24%
41%
12%
21%
45%
42%
14%
11%
24%
21%
* Distributions are statistically different from the previous year shown at p.05.
Kaiser/HRET Survey of Employer-Sponsored Health Benefits, 2001-2005.
s o u r c e :
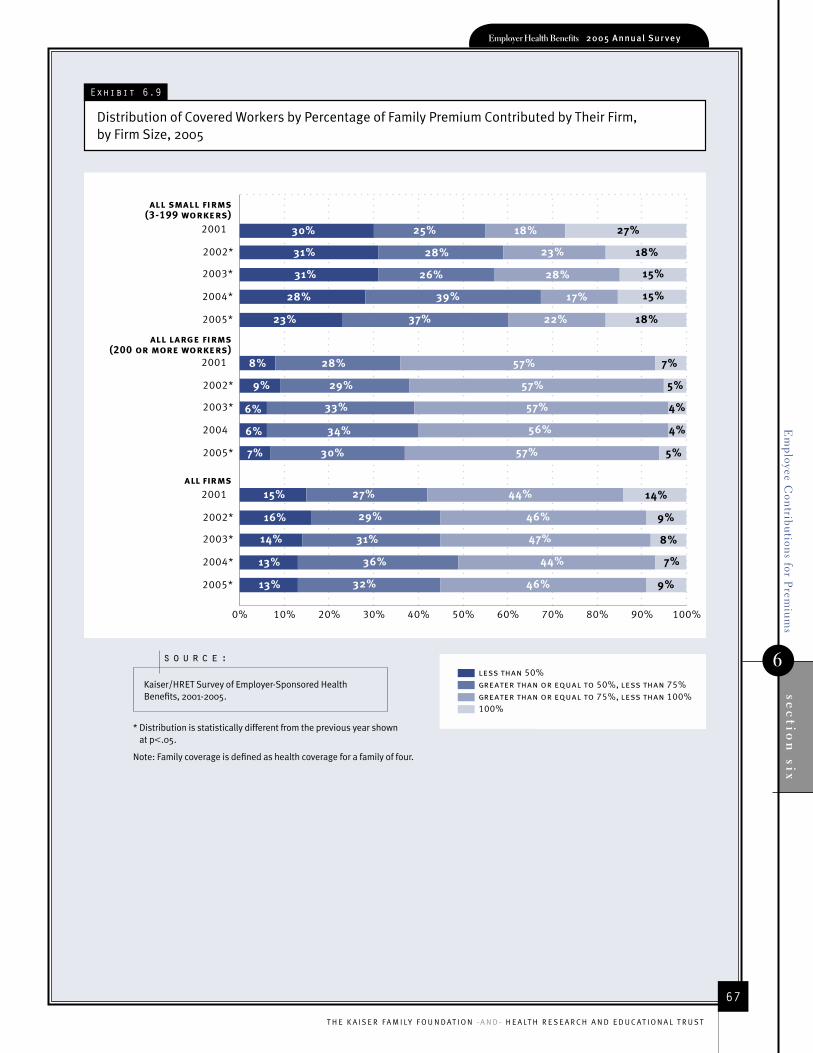
sec
tion
sixE
mployee C
ontribu
tions for P
remiu
ms
6
Employer Health Benefits 2005 Annual Sur vey
67
T H E K A I S E R F A M I LY F O U N D AT I O N - A N D - H E A LT H R E S E A R C H A N D E D U C AT I O N A L T R U S T
Exhibit 6.9
Distribution of Covered Workers by Percentage of Family Premium Contributed by Their Firm, by Firm Size, 2005
0% 10% 20% 30% 40% 50% 60% 70% 80% 90% 100%
all small firms(3-199 workers)
all large firms(200 or more workers)
all firms
less than 50%greater than or equal to 50%, less than 75%greater than or equal to 75%, less than 100%100%
2005*
2004*
2003*
2002*
2001
2005*
2004
2003*
2002*
2001
2005*
2004*
2003*
2002*
2001 30% 25% 18%
31% 26% 28%
8% 28% 57%
6% 33% 57%
15% 27% 44%
14% 31% 47%
23% 37% 22%
7% 30% 57%
13% 32% 46%
31% 28% 23%
28% 39% 17%
9% 29% 57%
6% 34% 56%
16% 29% 46%
13% 36% 44%
27%
15%
7%
4%
14%
8%
18%
5%
9%
18%
15%
5%
4%
9%
7%
* Distribution is statistically different from the previous year shown at p.05.
Note: Family coverage is defined as health coverage for a family of four.
Kaiser/HRET Survey of Employer-Sponsored Health Benefits, 2001-2005.
s o u r c e :

Em
ployee Con
tribution
s for Prem
ium
sse
ctio
n six
6
Employer Health Benefits 2005 Annual Sur vey
68
T H E K A I S E R F A M I LY F O U N D AT I O N - A N D - H E A LT H R E S E A R C H A N D E D U C AT I O N A L T R U S T
Exhibit 6.10
Average Percentage of Single and Family Premiums Paid by Covered Workers, by Firm Characteristics, 2005
Single Coverage Family Coverage
PERCENT OF W ORKFORCE EARNING $20,000 OR LE SS PER YEAR
Less Than 35% (Higher Wage Firms) 15% 25%
35% or More (Lower Wage Firms) 20* 36*
PLAN FUNDING
Self-Funded 16% 32%*
Fully Insured 16 21*
UNION
Firm Has At Least Some Union Workers 15% 21%*
Firm Does Not Have Any Union Workers 17 29*
ALL FIRMS 16% 26%
* Estimate is significantly different from All Firms at p.05.
Self-funded plan: An insurance arrangement in which the employer assumes direct financial responsibility for the costs of enrollees’ medical claims. Employers sponsoring self-funded plans typically contract with a third-party administrator or insurer to provide administrative services for the self-funded plan.
Note: Family coverage is defined as health coverage for a family of four.
Kaiser/HRET Survey of Employer-Sponsored Health Benefits, 2005.
s o u r c e :

sec
tion
sixE
mployee C
ontribu
tions for P
remiu
ms
6
Employer Health Benefits 2005 Annual Sur vey
69
T H E K A I S E R F A M I LY F O U N D AT I O N - A N D - H E A LT H R E S E A R C H A N D E D U C AT I O N A L T R U S T
Exhibit 6.11
Average Percentage of Premium Paid by Firm for Covered Workers, by Plan Type and Firm Size, 2005
Single Coverage Family Coverage
CONVENTIONAL PLANS
All Small Firms (3 - 199 Workers) 88% 74%
All Large Firms (200 or More Workers) 85 78
ALL FIRM SIZE S 86% 76%
HMO PLANS
All Small Firms (3 - 199 Workers) 85% 67%*
All Large Firms (200 or More Workers) 84 77
ALL FIRM SIZE S 84% 74%
PPO PLANS
All Small Firms (3 - 199 Workers) 87%* 70%*
All Large Firms (200 or More Workers) 83 77
ALL FIRM SIZE S 85% 75%
POS PLANS
All Small Firms (3 - 199 Workers) 80% 66%
All Large Firms (200 or More Workers) 82 72
ALL FIRM SIZE S 81% 69%
ALL PLANS
All Small Firms (3 - 199 Workers) 86% 69%*
All Large Firms (200 or More Workers) 83 77*
ALL FIRM SIZE S 84% 74%
* Estimate is statistically different from All Firm Sizes within a plan type at p.05.
Note: Family coverage is defined as health coverage for a family of four.
Kaiser/HRET Survey of Employer-Sponsored Health Benefits, 2005.
s o u r c e :

Em
ployee Con
tribution
s for Prem
ium
sse
ctio
n six
6
Employer Health Benefits 2005 Annual Sur vey
70
T H E K A I S E R F A M I LY F O U N D AT I O N - A N D - H E A LT H R E S E A R C H A N D E D U C AT I O N A L T R U S T
Exhibit 6.12
Average Percentage of Premium Paid by Covered Workers in Conventional and HMO Plans, 1988-2005
0%
5%
10%
15%
20%
25%
30%
35%
40%
conventional single conventional family hmo single hmo family
19881996
19992001
20032004
2005
15
19
10* 11 1013 14
36
29
24 23
27* 2724
29
16*18 17 16 16
38
28* 2926
2926
11
27
p ta nwohs raey suoiverp eht morf tnereffid yllacitsitats si etamitsE * < .05. No statistical tests were conducted for years prior to 1999.
Note: Family coverage is defined as health coverage for a family of four.
Kaiser/HRET Survey of Employer-Sponsored Health Benefits, 1999-2005; KPMG Survey of Employer-Sponsored Health Benefits, 1996; The Health Insurance Association of America (HIAA), 1988.
s o u r c e :
Exhibit 6.13
Average Percentage of Premium Paid by Covered Workers in PPO and POS Plans, 1988-2005
0%
5%
10%
15%
20%
25%
30%
35%
40%
ppo single ppo family pos single pos family
19881996
19992001
20032004
2005
8
26
13* 1316 1616 15
39
35
26* 2628 27
25 24
15*13
1619
3028
2528 28
31
^ ^
p ta nwohs raey suoiverp eht morf tnereffid yllacitsitats si etamitsE * < .05. No statistical tests were conducted for years prior to 1999.
^ Information was not obtained for POS plans in 1988.
Note: Family coverage is defined as health coverage for a family of four.
Kaiser/HRET Survey of Employer-Sponsored Health Benefits, 1999-2005; KPMG Survey of Employer-Sponsored Health Benefits, 1996; The Health Insurance Association of America (HIAA), 1988.
s o u r c e :

sec
tion
sixE
mployee C
ontribu
tions for P
remiu
ms
6
Employer Health Benefits 2005 Annual Sur vey
71
T H E K A I S E R F A M I LY F O U N D AT I O N - A N D - H E A LT H R E S E A R C H A N D E D U C AT I O N A L T R U S T
Exhibit 6.14
Average Percentage of Premium Paid by Firm for Covered Workers, by Plan Type and Region, 2005
Single Coverage Family Coverage
CONVENTIONAL PLANS
Northeast 92% 91%*
Midwest 80* 86
South 86 73
West NSD NSD
ALL REGIONS 86% 76%
HMO PLANS
Northeast 82% 78%*
Midwest 84 79*
South 82 69*
West 89* 73
ALL REGIONS 84% 74%
PPO PLANS
Northeast 84% 82%*
Midwest 84 78*
South 83 69*
West 91* 77
ALL REGIONS 85% 75%
POS PLANS
Northeast 79% 75%*
Midwest 81 73
South 82 59*
West 84 75
ALL REGIONS 81% 69%
ALL PLANS
Northeast 83% 80%*
Midwest 83 77*
South 83 68*
West 89* 75
ALL REGIONS 84% 74%
* Estimate is statistically different from All Regions within a plan type at p.05.
NSD: Not Sufficient Data.
Note: Family coverage is defined as health coverage for a family of four.
Kaiser/HRET Survey of Employer-Sponsored Health Benefits: 2005.
s o u r c e :
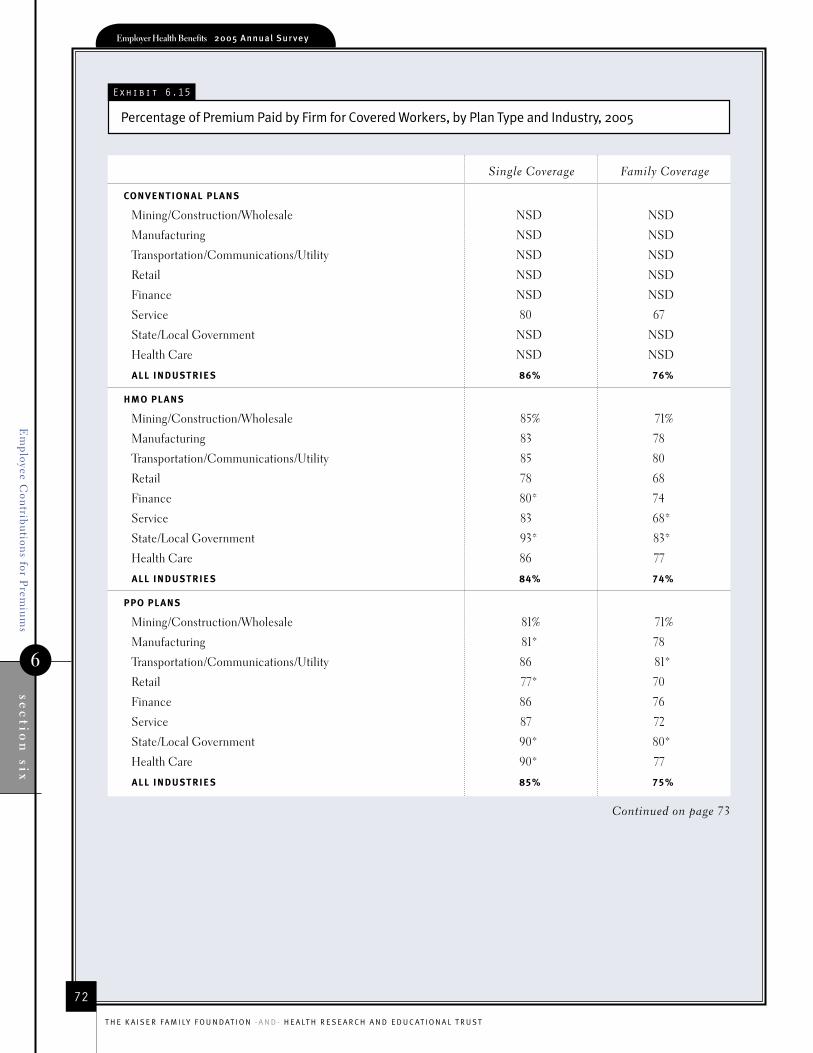
Em
ployee Con
tribution
s for Prem
ium
sse
ctio
n six
6
Employer Health Benefits 2005 Annual Sur vey
72
T H E K A I S E R F A M I LY F O U N D AT I O N - A N D - H E A LT H R E S E A R C H A N D E D U C AT I O N A L T R U S T
Exhibit 6.15
Percentage of Premium Paid by Firm for Covered Workers, by Plan Type and Industry, 2005
Single Coverage Family Coverage
CONVENTIONAL PLANS
Mining/Construction/Wholesale NSD NSD
Manufacturing NSD NSD
Transportation/Communications/Utility NSD NSD
Retail NSD NSD
Finance NSD NSD
Service 80 67
State/Local Government NSD NSD
Health Care NSD NSD
ALL INDUSTRIE S 86% 76%
HMO PLANS
Mining/Construction/Wholesale 85% 71%
Manufacturing 83 78
Transportation/Communications/Utility 85 80
Retail 78 68
Finance 80* 74
Service 83 68*
State/Local Government 93* 83*
Health Care 86 77
ALL INDUSTRIE S 84% 74%
PPO PLANS
Mining/Construction/Wholesale 81% 71%
Manufacturing 81* 78
Transportation/Communications/Utility 86 81*
Retail 77* 70
Finance 86 76
Service 87 72
State/Local Government 90* 80*
Health Care 90* 77
ALL INDUSTRIE S 85% 75%
Continued on page 73

sec
tion
sixE
mployee C
ontribu
tions for P
remiu
ms
6
Employer Health Benefits 2005 Annual Sur vey
73
T H E K A I S E R F A M I LY F O U N D AT I O N - A N D - H E A LT H R E S E A R C H A N D E D U C AT I O N A L T R U S T
Exhibit 6.15
Percentage of Premium Paid by Firm for Covered Workers, by Plan Type and Industry, 2005
Single Coverage Family Coverage
POS PLANS
Mining/Construction/Wholesale 86% 80%*
Manufacturing 79 74
Transportation/Communications/Utility NSD NSD
Retail 72 66
Finance NSD NSD
Service 82 64
State/Local Government 87 78*
Health Care 81 63
ALL INDUSTRIE S 81% 69%
ALL PLANS
Mining/Construction/Wholesale 82% 73%
Manufacturing 81* 78*
Transportation/Communications/Utility 86 80*
Retail 77* 68
Finance 84 75
Service 85 69*
State/Local Government 91* 81*
Health Care 88* 76
ALL INDUSTRIE S 84% 74%
* Estimate is statistically different from All Industries within a plan type at p.05.
NSD: Not Sufficient Data.
Note: Family coverage is defined as health coverage for a family of four.
Kaiser/HRET Survey of Employer-Sponsored Health Benefits: 2005.
s o u r c e :
Continued from page 72

Em
ployee Con
tribution
s for Prem
ium
sse
ctio
n six
6
Employer Health Benefits 2005 Annual Sur vey
74
T H E K A I S E R F A M I LY F O U N D AT I O N - A N D - H E A LT H R E S E A R C H A N D E D U C AT I O N A L T R U S T
Exhibit 6.16
Percentage of Covered Workers in Firms That Vary Worker Premium Contributions by Wage Level or by Participation in Wellness Program, by Firm Size and Region, 2005
Percentage of Covered Workers Percentage of Covered Workers in Firms That Vary Worker in Firms That Vary Premium Contributions Worker Premium Contributions by by Wage Level Participation in Wellness Program
FIRM SIZE
ALL SMALL FIRMS (3 - 199 WORKERS) 2.4%* 1.0%*
Midsize (200 - 999 Workers) 7.7 4.2
Large (1,000 - 4,999 Workers) 15.8 4.8
Jumbo (5,000 or More Workers) 16.3 4.4
ALL LARGE FIRMS (200 OR MORE WORKERS) 14.3% 4.4%
REGION
Northeast 20.2%* 6.0%
Midwest 9.1 3.9
South 8.1 2.3
West 5.5* 1.4
ALL FIRM SIZE S AND REGIONS 10.3% 3.3%
* Distribution is statistically different from All Firm Sizes and Regions at p.05.
Kaiser/HRET Survey of Employer-Sponsored Health Benefits: 2005.
s o u r c e :

73%
9.2%$10,
880
810,000Employer Health Benefits
2005 Annual Survey
s e c t i o n
E m p l o y e e
C o s t S h a r i n g
7

Em
ployee Cost S
harin
g7
section
seven
Employer Health Benefits 2 0 0 5 A n n ua l S u rve y
76
T H E K A I S E R F A M I LY F O U N D AT I O N - A N D - H E A LT H R E S E A R C H A N D E D U C AT I O N A L T R U S T
EMPLOYEE COST SHARING
W O R K E R S F A C E M A N Y D I F F E R E N T F O R M S O F C O S T S H A R I N G . A S R E P O R T E D I N S E C T I O N 6 , M O R E
T H A N T H R E E - I N - F O U R W O R K E R S ( 7 9 % ) W I T H S I N G L E C O V E R A G E A N D M O R E T H A N N I N E - I N - T E N
W O R K E R S ( 9 1 % ) W I T H F A M I L Y C O V E R A G E C O N T R I B U T E T O T H E I R M O N T H L Y H E A L T H I N S U R A N C E
P R E M I U M . I N A D D I T I O N , M A N Y C O V E R E D W O R K E R S F A C E C O S T S H A R I N G S U C H A S D E D U C T I B L E S
A N D C O P A Y M E N T S A N D / O R C O I N S U R A N C E F O R P H Y S I C I A N O F F I C E V I S I T S , H O S P I T A L C A R E , A N D
P R E S C R I P T I O N D R U G S . R E S E A R C H H A S D E M O N S T R A T E D T H A T H I G H E R C O S T S H A R I N G R E D U C E S
S P E N D I N G O N H E A L T H C A R E , B U T M A Y A L S O D I S C O U R A G E U S E O F N E E D E D S E R V I C E S , P A R T I C U -
L A R L Y A M O N G L O W E R I N C O M E I N D I V I D U A L S . 5
A S I N P R E V I O U S Y E A R S , C O V E R E D W O R K E R S I N S M A L L F I R M S ( 3 - 1 9 9 W O R K E R S ) F A C E H I G H E R
A V E R A G E A N N U A L D E D U C T I B L E S F O R S I N G L E C O V E R A G E T H A N W O R K E R S I N L A R G E F I R M S ( 2 0 0 O R
M O R E W O R K E R S ) A C R O S S A L L P L A N T Y P E S . C O P A Y M E N T S R E M A I N M O R E C O M M O N T H A N C O I N S U R -
A N C E F O R P H Y S I C I A N O F F I C E V I S I T S , A N D M O S T C O V E R E D W O R K E R S ( 5 2 % ) F A C E S E P A R A T E C O S T
S H A R I N G W H E N A D M I T T E D T O A H O S P I T A L .
P L A N D E D U C T I B L E S
• Average annual deductibles across all plan types have not increased significantly over the past year.
• Seventy-one percent of covered workers in PPO plans, the plan type with the highest enrollment, face an annual deductible for both single and family coverage (EXHIBIT 7.6). The average annual deductible (including those with a zero deductible) is $323 for single coverage for in-network services and $679 for family coverage for in-network services. If covered workers without deductibles were excluded from the average, the PPO deductibles for in-network services would average $455 for single coverage and $952 for family coverage (EXHIBITS 7.2, 7.3).
• Forty-four percent of covered workers in POS plans face a deductible for single coverage and 46% face a deductible for family coverage (EXHIBIT 7.7). The average annual deductible (including those with a zero deductible) for in-network services is $220 for single coverage and $494 for family coverage. If covered workers
without deductibles were excluded from the average, the POS deductibles for in-network services would average $495 for single coverage and $1,065 for family coverage (EXHIBITS 7.2, 7.3).
• Only a small percentage (13%) of covered workers in HMO plans face an annual deductible for both single and family coverage. The average deductible (including those with a zero deductible) for workers in HMO plans is $71 for single coverage and $141 for family coverage. If covered workers without deductibles were excluded from the average, the HMO deductibles for in-network services would average $568 for single coverage and $1,105 for family coverage (EXHIBITS 7.2, 7.3).
• Average annual deductibles are higher for covered workers with single coverage in small firms (3-199 workers) compared to large firms (200 or more workers), across all types of plans. For single coverage in PPO plans, average deductibles for preferred providers are $469 in small firms and $254 in large firms (EXHIBIT 7.4).
5 Newhouse, Joseph, et. al., Free for All? Lessons From the RAND Health Insurance Experiment. Harvard University Press, Cambridge, Massachusetts, 1993.
n o t e :

Em
ployee Cost S
harin
g
7
section
sevenEmployer Health Benefits 2 0 0 5 A n n ua l S u rve y
77
T H E K A I S E R F A M I LY F O U N D AT I O N - A N D - H E A LT H R E S E A R C H A N D E D U C AT I O N A L T R U S T
• Among covered workers in health plans with a deductible, 63% are in plans where the worker is reimbursed for preventive services without being required to meet the deductible.
C O S T S H A R I N G F O R P H Y S I C I A N O F F I C E V I S I T S
• The vast majority of covered workers (83%) face a fixed dollar copayment rather than a percentage coinsurance (10%) when they visit a physician. (EXHIBIT 7.11).
• Among covered workers with copayments, around 20% pay a copayment for in-network services of $5 or $10 per visit, 61% pay $15 or $20 per visit, and 17% pay $25 or $30 per visit (EXHIBIT 7.8).
H O S P I T A L C O S T S H A R I N G
• When admitted to a hospital, the majority of covered workers across all plans (52%) face separate cost sharing in various forms, such as a deductible, copayment, coinsurance, or a per diem charge (EXHIBIT 7.12). The most
common form of cost sharing for a hospital visit is a per admission copayment or deductible. On average across all plans, covered workers with deductibles or copayments for inpatient hospital admissions pay $241 per hospital admission (EXHIBIT 7.14). Covered workers facing coinsurance pay an average coinsurance rate of 16% (EXHIBIT 7.14). Two percent of covered workers face a per diem (charge per day) when admitted to a hospital (EXHIBIT 7.12).
T I E R E D C O S T S H A R I N G A R R A N G E M E N T S
• Tiered cost-sharing arrangements, where the health plan varies enrollee cost sharing for network hospitals or physicians based on their costs and quality, remain relatively uncommon. Eleven percent of workers enrolled in HMO plans have a tiered provider arrangement, 13% of covered workers in a PPO plan have such an arrangement, and 13% of workers enrolled in a POS plan have a tiered provider network arrangement (EXHIBIT 7.15).

Em
ployee Cost S
harin
g7
section
seven
Employer Health Benefits 2005 Annual Sur vey
78
T H E K A I S E R F A M I LY F O U N D AT I O N - A N D - H E A LT H R E S E A R C H A N D E D U C AT I O N A L T R U S T
Exhibit 7.1
Percentage of Covered Workers With the Following Types of Cost Sharing for Health Benefits, 2005
0%
20%
40%
60%
80%
100%95%
91%89%
79%
56%52%
10%
copayand/or
coinsurance or office visits
workercontributions
to familypremium
tiered costsharing for prescription
drugs
workercontributions
to singlepremium
separatehospital
costsharing§
plandeductiblefor singlecoverage‡
separatedeductible
for prescription drugs
‡ The percentage of covered workers with a plan deductible is calculated for workers with single coverage. For PPO and POS plans, deductibles are for in-network services.
§ Covered workers with separate hospital cost sharing includes those with a hospital deductible or copay, coinsurance, both a coinsurance and a deductible or copay, a charge per day, or an annual deductible.
Kaiser/HRET Survey of Employer-Sponsored Health Benefits, 2005.
s o u r c e :

Em
ployee Cost S
harin
g
7
section
sevenEmployer Health Benefits 2005 Annual Sur vey
79
T H E K A I S E R F A M I LY F O U N D AT I O N - A N D - H E A LT H R E S E A R C H A N D E D U C AT I O N A L T R U S T
Exhibit 7.2
Average Annual Deductibles for Covered Workers With Single Coverage, by Plan Type, 1988-2005
19881996
199920012003
20042005
conventional hmo ppo pos
163
267 249
384*414
^ ^ ^30 44
106
181 186
275*287
^
71 92*113
210
71
323
220
602
239
^
204
49
$0
$80
$160
$240
$320
$400
$480
$560
$640
* Estimate is statistically different from the previous year shown at p.05. No statistical tests were conducted for years prior to 1999.
^ Information was not obtained for HMO single coverage prior to 2003, or for POS plans in 1988.
Note: Average deductibles for PPO and POS plans are for in-network services. Averages include covered workers who do not have a deductible. If covered workers who do not face a deductible are excluded from the analysis, the average deductibles are higher. The average deductibles for single coverage among covered workers who face a deductible are as follows: conventional - $671, HMO - $568, PPO - $455, POS - $495.
Kaiser/HRET Survey of Employer-Sponsored Health Benefits, 1999-2005; KPMG Survey of Employer-Sponsored Health Benefits, 1996; The Health Insurance Association of America (HIAA), 1988.
s o u r c e :
Exhibit 7.3
Average Annual Deductibles for Covered Workers With Family Coverage, by Plan Type, 1988-2005
19881996
199920012003
20042005
conventional hmo ppo pos
375
600 606
785*861
^ ^ ^65 80
^ ^ ^ ^ ^ ^ ^ ^ ^ ^
141
679
494
1,192
598
^ ^ ^$0
$150
$300
$450
$600
$750
$900
$1,050
$1,200
* Estimate is statistically different from the previous year shown at p.05. No statistical tests were conducted for years prior to 1999.
^ Information was not obtained for HMO family coverage prior to 2003, or for PPO and POS family coverage prior to 2005.
Note: Average deductibles for PPO and POS plans are for in-network services. Averages include covered workers who do not have a deductible. If covered workers who do not face a deductible are excluded from the analysis, the average deductibles are higher. The average deductibles for family coverage among covered workers who face a deductible are as follows: conventional - $1,405, HMO - $1,105, PPO - $952, POS - $1,065.
Kaiser/HRET Survey of Employer-Sponsored Health Benefits, 1999-2005; KPMG Survey of Employer-Sponsored Health Benefits, 1996; The Health Insurance Association of America (HIAA), 1988.
s o u r c e :

Em
ployee Cost S
harin
g7
section
seven
Employer Health Benefits 2005 Annual Sur vey
80
T H E K A I S E R F A M I LY F O U N D AT I O N - A N D - H E A LT H R E S E A R C H A N D E D U C AT I O N A L T R U S T
Exhibit 7.4
Average Annual Deductibles for Covered Workers for Single and Family Coverage, by Plan Type and Firm Size, 2005
Single Coverage Family Coverage
CONVENTIONAL PLANS
ALL SMALL FIRMS (3 - 199 W ORKERS) $997 $1,737
Midsize (200 - 999 Workers) 219* 554*
Large (1,000 - 4,999 Workers) 188* 421*
Jumbo (5,000 or More Workers) 434 1,022
ALL LARGE FIRMS (200 OR MORE W ORKERS) 351 834
ALL FIRM SIZE S $602 $1,192
HMO PLANS
ALL SMALL FIRMS (3 - 199 W ORKERS) $187* $360*
Midsize (200 - 999 Workers) 66 135
Large (1,000 - 4,999 Workers) 44 103
Jumbo (5,000 or More Workers) 8* 18*
ALL LARGE FIRMS (200 OR MORE W ORKERS) 27* 58*
ALL FIRM SIZE S $71 $141
PPO PLANS
ALL SMALL FIRMS (3 - 199 W ORKERS) $469* $893*
Midsize (200 - 999 Workers) 343 770
Large (1,000 - 4,999 Workers) 238* 544*
Jumbo (5,000 or More Workers) 223* 517*
ALL LARGE FIRMS (200 OR MORE W ORKERS) 254* 581*
ALL FIRM SIZE S $323 $679
POS PLANS
ALL SMALL FIRMS (3 - 199 W ORKERS) $287 $664
Midsize (200 - 999 Workers) 149 332
Large (1,000 - 4,999 Workers) 230 431
Jumbo (5,000 or More Workers) 144 324*
ALL LARGE FIRMS (200 OR MORE W ORKERS) 159 344*
ALL FIRM SIZE S $220 $494
* Estimate is statistically different from All Firm Sizes within a plan type at p.05.
Note: Average deductibles for PPO and POS plans are for in-network services. Averages include covered workers who do not have a deductible.
Kaiser/HRET Survey of Employer-Sponsored Health Benefits, 2005.
s o u r c e :

Em
ployee Cost S
harin
g
7
section
sevenEmployer Health Benefits 2005 Annual Sur vey
81
T H E K A I S E R F A M I LY F O U N D AT I O N - A N D - H E A LT H R E S E A R C H A N D E D U C AT I O N A L T R U S T
Exhibit 7.5
Average Annual Deductibles for Covered Workers for Single and Family Coverage, by Plan Type and Region, 2005
Single Coverage Family Coverage
CONVENTIONAL PLANS
Northeast $630 $1,061
Midwest 460 861
South 652 1,318
West 641 1,542
ALL REGIONS $602 $1,192
HMO PLANS
Northeast $42 $97
Midwest 78 154
South 64 124
West 95 178
ALL REGIONS $71 $141
PPO PLANS
Northeast $191* $405*
Midwest 316 659
South 358 805
West 395 727
ALL REGIONS $323 $679
POS PLANS
Northeast $104* $272*
Midwest 335 638
South 246 609
West 230 462
ALL REGIONS $220 $494
* Estimate is statistically different from All Regions within a plan type at p.05.
Note: Average deductibles for PPO and POS plans are for in-network services. Averages include covered workers who do not have a deductible.
Kaiser/HRET Survey of Employer-Sponsored Health Benefits, 2005.
s o u r c e :

Em
ployee Cost S
harin
g7
section
seven
Employer Health Benefits 2005 Annual Sur vey
82
T H E K A I S E R F A M I LY F O U N D AT I O N - A N D - H E A LT H R E S E A R C H A N D E D U C AT I O N A L T R U S T
Exhibit 7.6
Distribution of Covered Workers With the Following Annual Deductibles for PPO Plans, Single and Family Coverage, 2000-2005
0% 10% 20% 30% 40% 50% 60% 70% 80% 90% 100%
2005
2005*
2004*
2003*
2002*
2001*
2000
$0
$1 - $499
$500 - $999
$1,000 - $1,999
$2,000 or more
ppo single
ppo family
34% 57% 8%
32% 54% 11%
31% 54% 11%
32% 47% 14%
30% 50% 14%
29% 47% 14%
29% 15% 32%
1%
1%
2%
2%
<1%
<1%
1%
16%
2%
4%
6%
4%
7%
8%
Exhibit 7.7
Distribution of Covered Workers With the Following Annual Deductibles for POS Plans, Single and Family Coverage, 2000-2005
0% 10% 20% 30% 40% 50% 60% 70% 80% 90% 100%
2005
2005*
2004*
2003*
2002*
2001
2000 pos single
pos family
$0
$1 - $499
$500 - $999
$1,000 - $1,999
$2,000 or more
77% 17% 4%
77% 17% 4%
79% 16% 4%
69% 23% 5%
67% 18% 8%
56% 26% 11%
54% 7% 18%
1%
<1%
1%
<1%2%
8%
14% 7%
3% 4%
3%
* Distribution is statistically different from previous year shown at p.05.
Note: Deductibles for PPO plans are for in-network services. We did not ask about deductibles for family coverage prior to 2005.
Kaiser/HRET Survey of Employer-Sponsored Health Benefits, 2000-2005.
s o u r c e :
* Distribution is statistically different from previous year shown at p.05.
Note: Deductibles for POS plans are for in-network services. We did not ask about deductibles for family coverage prior to 2005.
Kaiser/HRET Survey of Employer-Sponsored Health Benefits, 2000-2005.
s o u r c e :

Em
ployee Cost S
harin
g
7
section
sevenEmployer Health Benefits 2005 Annual Sur vey
83
T H E K A I S E R F A M I LY F O U N D AT I O N - A N D - H E A LT H R E S E A R C H A N D E D U C AT I O N A L T R U S T
Exhibit 7.8
Among Covered Workers Facing Copayments for Physician Office Visits, Distribution of Copayments by Plan Type, 2004-2005
0% 10% 20% 30% 40% 50% 60% 70% 80% 90% 100%
2005*2004
2005*2004
2005*2004
2005*2004
2005*2004
$5 per visit
$10 per visit
$15 per visit
$20 per visit
$25 per visit
$30 per visit
other
<1%
<1%
1%1%
4%1%
12% 5%6%
3%6%
11%15%
8%11%
9% 3%
12%
11%
3%4%
4%5%
6%
3%5%
21% 42% 19%7% 44% 31%
3% 28% 22%40%5% 23% 27%34%
1% 17% 28%35%16%<1% 34%25%
3% 34% 36%17%2% 35% 30%16%
19%1% 27%37%2% 17% 32%29%
conventionalplans
hmo plans
ppo plans
pos plans
all plans‡
1%
0%
<1%
4%3%
3%
* Distribution is statistically different from previous year shown at p.05.
‡ In calculating the distribution of copayments across all plan types, the copayments applicable to in-network services were used for PPO and POS plans.
Note: The distribution of copayments for physician office visits does not include covered workers who do not have a copayment.
Kaiser/HRET Survey of Employer-Sponsored Health Benefits: 2004-2005.
s o u r c e :
Exhibit 7.9
Among Covered Workers in HMOs Facing Copayments for Physician Office Visits, Percentage with Various Copayments, 1996-2005
0%
10%
20%
30%
40%
50%
60%
70%
$5 per visit $10 per visit $15 per visit $20 per visit other
1996
1999
2001
2003
2004
2005
24 23
15*
4* 3 5
59 6056
35*28
23
10 12
22*
37*40
34
1 1 3
12*
22*27
5 3 412*
711
* Estimate is statistically different from the previous year shown at p.05.
Kaiser/HRET Survey of Employer-Sponsored Health Benefits, 1999-2005. KPMG Survey of Employer-Sponsored Health Benefits: 1996.
s o u r c e :

Em
ployee Cost S
harin
g7
section
seven
Employer Health Benefits 2005 Annual Sur vey
84
T H E K A I S E R F A M I LY F O U N D AT I O N - A N D - H E A LT H R E S E A R C H A N D E D U C AT I O N A L T R U S T
Exhibit 7.10
Among Covered Workers Facing Coinsurance for Physician Office Visits, Average Coinsurance Rates, by Plan Type, 2005
10% or 15% 20% or 25% 30% 40% Other
COINSURANCE RATE S
Conventional Plans 5 94 0 0 1
PPO In-network Provider 32 62 3 0 3
PPO Out-of-network Provider 3 29 27 25 15
POS In-network Provider 28 32 0 0 40
POS Out-of-network Provider 3 32 33 16 16
Exhibit 7.11
Percentage of Covered Workers With the Following Types of Cost Sharing for Physician Office Visits, 2005
Coinsurance Both Copay Copay Only Only and Coinsurance‡ Neither
OFFICE VISITS
Conventional Plans 43% 32% 1% 24%
HMO Plans* 96 <1 1 3
PPO In-network Provider 78 13 2 7
POS In-netvwork Provider 93 1 3 3
ALL PLANS 83% 10% 2% 5%
* Distribution is significantly different from All Plans at p.05.
‡ This category includes less than 0.5% of covered workers who face either a copayment or a coinsurance – whichever is greater.
Kaiser/HRET Survey of Employer-Sponsored Health Benefits, 2005.
s o u r c e :
Note: HMO coinsurance rates are not included because less than 1% of covered workers in HMOs face coinsurance for office visits. The distribution of coinsurance rates for physician office visits does not include covered workers who do not have a coinsurance.
Kaiser/HRET Survey of Employer-Sponsored Health Benefits, 2005.
s o u r c e :

Em
ployee Cost S
harin
g
7
section
sevenEmployer Health Benefits 2005 Annual Sur vey
85
T H E K A I S E R F A M I LY F O U N D AT I O N - A N D - H E A LT H R E S E A R C H A N D E D U C AT I O N A L T R U S T
Exhibit 7.12
Distribution of Covered Workers With the Following Types of Cost Sharing for a Hospital Admission, 2005*
Deductible Both Copay or Copay Coinsurance and Charge Annual Only Only Coinsurance Per Day Deductible None
HOSPITAL ADMISSIONS
Conventional Plans 25% 14% 1% 0% 6% 54%
HMO Plans 55 3 1 4 0 37
PPO Plans 26 13 3 1 1 55
POS Plans 46 6 4 4 0 40
ALL PLANS 36% 10% 3% 2% 1% 48%
* Tests found no statistically different distributions from All Plans at p.05.
Kaiser/HRET Survey of Employer-Sponsored Health Benefits, 2005.
s o u r c e :
Exhibit 7.13
Among Covered Workers with a Separate Hospital Deductible or Copay, the Average Cost Sharing Per Admission, By Plan Type, 2005
$0
$50
$100
$150
$200
$250
$300
conventional hmo ppo pos all plans
$250
$171*
$277
$228$241
Kaiser/HRET Survey of Employer-Sponsored Health Benefits, 2005.
s o u r c e :
* Estimate is statistically different from All Plans at p.05.
Note: Averages do not include covered workers who do not have a separate hospital deductible or copay.
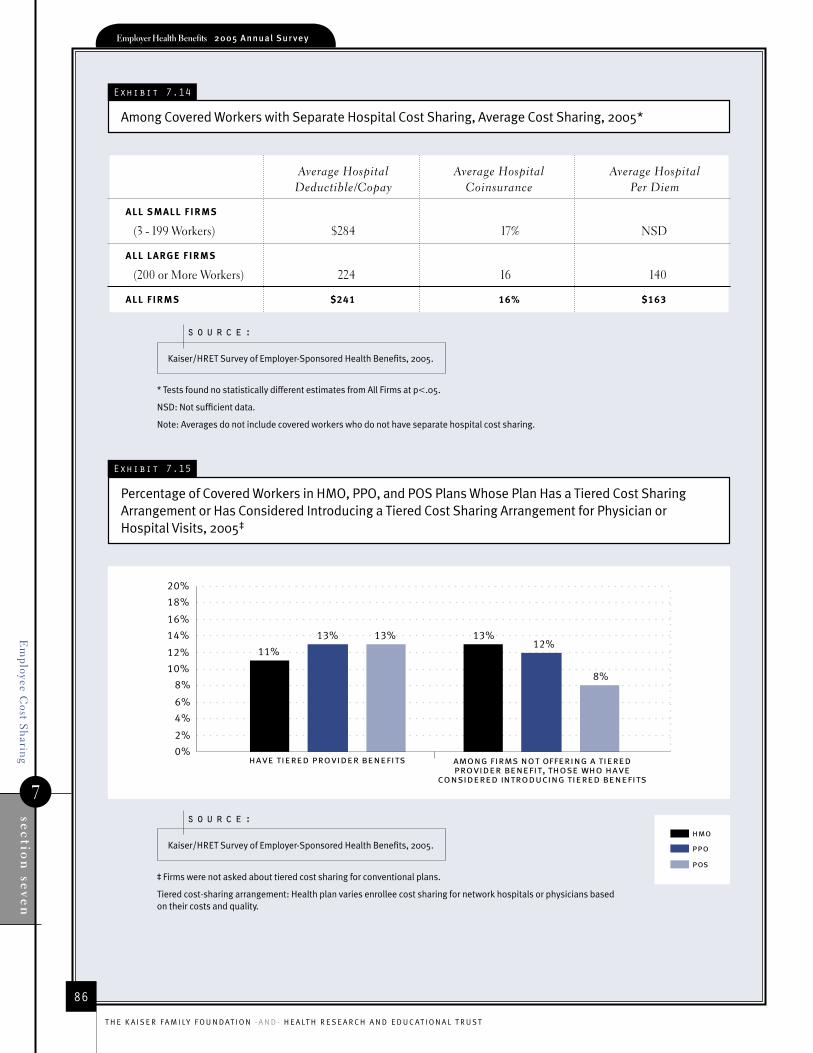
Em
ployee Cost S
harin
g7
section
seven
Employer Health Benefits 2005 Annual Sur vey
86
T H E K A I S E R F A M I LY F O U N D AT I O N - A N D - H E A LT H R E S E A R C H A N D E D U C AT I O N A L T R U S T
Exhibit 7.14
Among Covered Workers with Separate Hospital Cost Sharing, Average Cost Sharing, 2005*
Average Hospital Average Hospital Average Hospital Deductible/Copay Coinsurance Per Diem
ALL SMALL FIRMS
(3 - 199 Workers) $284 17% NSD
ALL LARGE FIRMS
(200 or More Workers) 224 16 140
ALL FIRMS $241 16% $163
* Tests found no statistically different estimates from All Firms at p.05.
NSD: Not sufficient data.
Note: Averages do not include covered workers who do not have separate hospital cost sharing.
Kaiser/HRET Survey of Employer-Sponsored Health Benefits, 2005.
s o u r c e :
Exhibit 7.15
Percentage of Covered Workers in HMO, PPO, and POS Plans Whose Plan Has a Tiered Cost Sharing Arrangement or Has Considered Introducing a Tiered Cost Sharing Arrangement for Physician or Hospital Visits, 2005‡
0%
2%
4%
6%
8%
10%
12%
14%
16%
18%
20%
11%
13% 13% 13%12%
8%
hmo
ppo
pos
have tiered provider benefits among firms not offering a tieredprovider benefit, those who have
considered introducing tiered benefits
Kaiser/HRET Survey of Employer-Sponsored Health Benefits, 2005.
s o u r c e :
‡ Firms were not asked about tiered cost sharing for conventional plans.
Tiered cost-sharing arrangement: Health plan varies enrollee cost sharing for network hospitals or physicians based on their costs and quality.

Em
ployee Cost S
harin
g
7
section
sevenEmployer Health Benefits 2005 Annual Sur vey
87
T H E K A I S E R F A M I LY F O U N D AT I O N - A N D - H E A LT H R E S E A R C H A N D E D U C AT I O N A L T R U S T
Exhibit 7.16
Distribution of Covered Workers With the Following Maximum Annual Out-of-Pocket Payment, Single Coverage, by Plan Type and Firm Size, 2005
0% 10% 20% 30% 40% 50% 60% 70% 80% 90% 100%
all large firms(200 or more workers)
all small firms(3-199 workers)
all large firms(200 or more workers)
all small firms(3-199 workers)
all large firms(200 or more workers)
all small firms(3-199 workers)
all large firms(200 or more workers)
all small firms(3-199 workers)
all large firms(200 or more workers)
all small firms(3-199 workers)
$999 or less
$1,000-$1,499
$1,500-$1,999
$2,000-$2,499
$2,500-$2,999
$3,000 or more (with a specified limit)no limit‡
conventional plans
hmo plans
ppo plans*
pos plans
all plans
all firms
18% 6%
18% 13%
28%
2% 42%
9% 17%
8% 15%
4% 28%
2% 28%
4%
8% 21%
7% 22%
7% 22%
11% 24% 7% 9%
10% 26% 13% 14% 7%
13% 14% 24% 9% 9%
9% 13% 21% 9% 5%
12% 21% 11% 13% 16%
7% 22% 19% 17% 11%
13% 26% 8% 13%
7% 20% 30% 5% 9%
8%
12% 22% 13% 13%11%
8% 20% 21% 13% 9%
9% 21% 18% 11%12%
25%
Kaiser/HRET Survey of Employer-Sponsored Health Benefits, 2005
s o u r c e :
* Distribution is statistically significant between All Small and All Large firms within a plan type at p.05.
‡ A substantial percentage of covered workers in plans with ‘No Limit’ on out-of-pocket maximum cost sharing are in plans with no deductibles and may not face large out of pocket cost sharing in their plan designs.

Em
ployee Cost S
harin
g7
section
seven
Employer Health Benefits 2005 Annual Sur vey
88
T H E K A I S E R F A M I LY F O U N D AT I O N - A N D - H E A LT H R E S E A R C H A N D E D U C AT I O N A L T R U S T
Exhibit 7.17
Distribution of Covered Workers With the Following Maximum Annual Out-of-Pocket Payment, Family Coverage, by Plan Type and Firm Size, 2005
0% 10% 20% 30% 40% 50% 60% 70% 80% 90% 100%
all large firms(200 or more workers)
all small firms(3-199 workers)
all large firms(200 or more workers)
all small firms(3-199 workers)
all large firms(200 or more workers)
all small firms(3-199 workers)
all large firms(200 or more workers)
all small firms(3-199 workers)
all large firms(200 or more workers)
all small firms(3-199 workers)
$1,999 or less
$2,000-$2,999
$3,000-$3,999
$4,000-$4,999
$5,000-$5,999
$6,000 or more (with a specified limit)no limit‡
conventional plans
hmo plans*
ppo plans
pos plans
all plans*
all firms
10% 10% 8% 29% 26%
14% 14% 19% 13% 18%
9% 22% 14% 16% 7%
8% 11% 18% 9% 6%
14% 17% 21% 12% 15%
9% 16% 18% 19% 14%
14% 20% 21% 9% 7%
12% 13% 29% 6% 12%
12% 19% 21% 11% 11%
9% 15% 20% 14% 12%
10% 16% 20% 13% 12%
9% 7%
11% 12%
10% 22%
3% 45%
8% 13%
5% 17%
6% 24%
28%
<1%
9% 17%
5% 24%
6% 22%
Kaiser/HRET Survey of Employer-Sponsored Health Benefits: 2005.
s o u r c e :
* Distribution is significantly different between All Small and All Large firms within a plan type at p.05.
‡ A substantial percentage of covered workers in plans with ‘No Limit’ on out-of-pocket maximum cost sharing are in plans with no deductibles and may not face large out of pocket cost sharing in their plan designs.

73%
9.2%$10,
880
810,000Employer Health Benefits
2005 Annual Survey
s e c t i o n
E m p l o y e e
C o v e ra g e ,
E l i g i b i l i t y, a n d
Pa r t i c i p a t i o n
3
73%
9.2%$10,
880
810,000Employer Health Benefits
2005 Annual Survey
s e c t i o n
H i g h - D e d u c t i b l e
H e a l t h P l a n s a n d
S a v i n g s A c c o u n t
O p t i o n s
8
High
-Dedu
ctible Health
Plan
s and S
avings A
ccoun
t Option
s
8
section eigh
t
Employer Health Benefits 2 0 0 5 A n n ua l S u rve y
90
T H E K A I S E R F A M I LY F O U N D AT I O N - A N D - H E A LT H R E S E A R C H A N D E D U C AT I O N A L T R U S T
HIGH-DEDUCTIBLE HEALTH PLANS AND SAVINGS ACCOUNT OPTIONS
E M P L O Y E R S A P P E A R T O B E E M B R A C I N G H I G H E R C O S T S H A R I N G A S A S T R A T E G Y F O R R E D U C I N G
T H E G R O W T H I N H E A L T H C A R E C O S T S . T W E N T Y P E R C E N T O F E M P L O Y E R S O F F E R I N G H E A L T H B E N -
E F I T S O F F E R A H E A L T H P L A N W I T H A H I G H - D E D U C T I B L E ( I . E . , D E F I N E D A S A T L E A S T $ 1 , 0 0 0
F O R S I N G L E C O V E R A G E A N D $ 2 , 0 0 0 F O R F A M I L Y C O V E R A G E ) . 6 J U M B O E M P L O Y E R S ( 5 , 0 0 0 O R
M O R E W O R K E R S ) A R E M O R E L I K E L Y T H A N S M A L L E R F I R M S T O O F F E R S U C H A P L A N .
R E C E N T C H A N G E S I N L A W A L S O H A V E P E R M I T T E D T H E E S T A B L I S H M E N T O F N E W T Y P E S O F S A V -
I N G S A R R A N G E M E N T S F O R H E A L T H C A R E , T H E T W O M O S T C O M M O N B E I N G H E A L T H R E I M B U R S E -
M E N T A R R A N G E M E N T S ( H R A S ) A N D H E A L T H S A V I N G S A C C O U N T S ( H S A S ) . H R A S A N D H S A S
A R E B O T H F I N A N C I A L A C C O U N T S T H A T W O R K E R S O R O T H E R I N D I V I D U A L S C A N U S E T O P A Y F O R
H E A L T H C A R E S E R V I C E S [ S E E S I D E B A R ] . W H I L E T H E Y S E R V E S I M I L A R P U R P O S E S , H S A S A N D
H R A S A R E S E T U P A N D O P E R A T E Q U I T E D I F F E R E N T L Y . T H E S E N E W S A V I N G S A R R A N G E M E N T S
M A Y B E ( O R M U S T B E I N T H E C A S E O F H S A S ) C O M B I N E D W I T H A H I G H - D E D U C T I B L E H E A L T H
P L A N , O R H D H P ( D E F I N E D I N T H I S S U R V E Y A S H A V I N G A D E D U C T I B L E O F A T L E A S T $ 1 , 0 0 0
F O R S I N G L E C O V E R A G E A N D $ 2 , 0 0 0 F O R F A M I L Y C O V E R A G E ) . I N T H E S U R V E Y , W E F O C U S E D
S P E C I F I C A L L Y O N H R A S T H A T A R E O F F E R E D A L O N G W I T H A N H D H P. F O R C O N V E N I E N C E , W E
W I L L R E F E R T O A N H D H P O F F E R E D W I T H A N H R A A S A N “ H D H P / H R A ” A N D T O A H D H P
T H A T M E E T S T H E L E G A L R E Q U I R E M E N T S T O P E R M I T A P E R S O N T O E S T A B L I S H A N H S A A S A N
“ H S A Q U A L I F I E D H D H P ” .
A L M O S T F O U R P E R C E N T O F E M P L O Y E R S T H A T O F F E R H E A L T H B E N E F I T S I N 2 0 0 5 O F F E R T H E I R
W O R K E R S A N H D H P / H R A O R A N H S A Q U A L I F I E D H D H P. A B O U T 2 . 4 M I L L I O N W O R K E R S A R E
E N R O L L E D I N A N H D H P / H R A O R A N H S A Q U A L I F I E D H D H P. T H I S E S T I M A T E O F T H E N U M B E R
O F W O R K E R S E N R O L L E D I N A N H D H P / H R A O R A N H S A Q U A L I F I E D H D H P D O E S N O T I N C L U D E
F E D E R A L W O R K E R S B E C A U S E T H E F E D E R A L G O V E R N M E N T I S N O T I N C L U D E D I N T H E S U R V E Y .
6 In 2003 and 2004, the survey used a different definition and asked firms if they offered a health plan with a deductible of more than $1,000 for single coverage. The 2003 and 2004 surveys did not specify a minimum deductible for family coverage. Some of the change in the prevalence of HDHPs may result from the change in the HDHP definition (e.g., a firm with a single deductible of exactly $1,000 may have reported not having a HDHP in 2003 or 2004).
7 See IRS Publication 969 (2004) Health Savings Accounts and Other Tax-Favored Health Plans.
n o t e :

High
-Dedu
ctible Health
Plan
s and S
avings A
ccoun
t Option
s
8
section eigh
tEmployer Health Benefits 2 0 0 5 A n n ua l S u rve y
91
T H E K A I S E R F A M I LY F O U N D AT I O N - A N D - H E A LT H R E S E A R C H A N D E D U C AT I O N A L T R U S T
P E R C E N T O F F E R I N G H D H P S
A N D S A V I N G S A C C O U N T O P T I O N S
• Twenty percent of firms offering health benefits offer an HDHP to at least some their workers. The prevalence of HDHPs is up from 10% in 2004 and 5% in 2003, although we note that the definition of a HDHP changed somewhat for the 2005 survey (see Footnote 6). This estimate is of all HDHPs, regardless of whether they are offered with an HRA, are HSA qualified, or neither. Jumbo firms (5,000 or more workers) are the most likely to offer an HDHP: 33% of jumbo firms offering health benefits offer such a plan to at least some of their workers (EXHIBIT 8.1).
• About 4% of all firms offering health benefits offer an HDHP/HRA, an HSA qualified HDHP, or both (EXHIBIT 8.2).
• Among firms offering health benefits, 1.9% offer an HDHP/HRA and 2.3% offer an HSA qualified HDHP. About 1.6 million workers are enrolled in an HDHP/HRA and about 810,000 workers are enrolled in an HSA qualified HDHP (EXHIBIT 8.2).
• Large firms (1,000 or more workers) are more likely to offer one of these arrangements than firms overall (10% compared to 4%).
• About 25% of workers offered an HDHP/HRA and about 15% of workers offered an HSA qualified HDHP participate in the arrangement that is offered (EXHIBIT 8.4). About half of the workers enrolled in an HDHP/HRA or an HSA qualified HDHP had the option of another health plan.
HRAs are medical care reimbursement plans established by employers that can be used by employees to pay for health care. HRAs are funded solely by employers. Employers typically commit to make up to a specified amount of money available in the HRA for expenses incurred by employees or their dependents. HRAs are accounting devices, and employers are not required to expend funds until an employee incurs expenses that would be covered by the HRA.
Employees may use the HRA to pay for medical expenses and premiums. Unspent funds in the HRA usually can be carried over to the next year (sometimes with a limit). Employees cannot take their HRA balances with them if they leave their job, although an employer can choose to make the remaining balance available to former employees to pay for health care.
HRAs often are offered along with a HDHP. In such cases, the employee pays for health care first out of his or her HRA and then out-of-pocket until the health plan deductible is met. Sometimes certain preventive services are paid for by the plan before the employee meets the deductible.
HSAs are savings accounts created by individuals to pay for health care. An individual may establish an HSA if he or
she is covered by a “qualified health plan” which is a plan with a high-deductible (i.e., a deductible of at least $1,000 for single coverage and $2,000 for family coverage) that also meets other requirements.7 Employers can encourage their employees to create HSAs by offering an HDHP that meets federal requirements. Employers in some cases also may assist their employees by identifying HSA options, facilitating applications, or negotiating favorable fees from HSA vendors.
Both employers and employees can contribute to an HSA, up to an annual limit equal to the lesser of the deductible in the HSA qualified health plan or a statutory cap. Employee contributions to the HSA are made on a pre-income tax basis, and some employers arrange for their employees to fund their HSAs through payroll deduction. Employers are not required to contribute to employee established HSAs, but if they elect to do so their contributions are not taxable to the employee. Interest and other earnings on amounts in an HSA are not taxable. Withdrawals from the HSA by the account owner to pay for qualified health care expenses are not taxed. The savings account is owned by the individual who creates the account, so employees retain their HSA balances if they leave their job.

High
-Dedu
ctible Health
Plan
s and S
avings A
ccoun
t Option
s
8
section eigh
t
Employer Health Benefits 2 0 0 5 A n n ua l S u rve y
92
T H E K A I S E R F A M I LY F O U N D AT I O N - A N D - H E A LT H R E S E A R C H A N D E D U C AT I O N A L T R U S T
D E D U C T I B L E L E V E L S
A N D O U T - O F - P O C K E T L I M I T S
• Average annual deductibles in these arrangements, as expected, are relatively high when compared to the average annual deductibles for health plans generally.
• In HDHP/HRAs, the average annual deductible is $1,870 for single coverage and $3,686 for family coverage. Workers in HDHP/HRAs on average face a maximum annual out-of-pocket liability for cost-sharing of $2,859 for single coverage and $5,075 annually for family coverage (EXHIBIT 8.4).8
• In HSA qualified HDHPs, the average annual deductible is $1,901 for single coverage and $4,070 for family coverage. Workers in HSA qualified HDHPs on average face an annual maximum out-of-pocket liability for cost-sharing of $2,551 for single coverage and $4,661 for family coverage (EXHIBIT 8.4).9
P R E M I U M S A N D F I R M C O N T R I B U T I O N S
T O T H E H S A O R H R A
• As expected, average premiums for HDHP/HRAs and HSA qualified HDHPs are lower than average premiums in the market.
• Annual premiums for HDHP/HRAs average $3,503 for single coverage and $8,530 for family coverage. When employer contributions to HRAs are added to the premiums for the HDHPs plans offered with HRAs, the annual “total cost” for HDHP/HRAs averages $4,295 for single coverage and $10,193 for family coverage. If these total costs for HDHP/HRAs are compared to the average single and family annual premiums for all health plans ($4,024 for single coverage and $10,880 for family coverage), the differences are not statistically significant (Exhibit 8.5).
• Annual premiums in HSA qualified HDHPs average $2,700 for single coverage and $7,909 for family coverage. When employer contributions to HSAs are added to the premiums for the HSA qualified HDHP, the annual “total cost” for HSA qualified HDHPs averages $3,280 for single coverage and $9,001 for family coverage. These amounts are significantly lower than the average annual single and family premiums in health plans overall ($4,024 and $10,880) (EXHIBIT 8.5).
W O R K E R C O N T R I B U T I O N S T O P R E M I U M S
• Average annual employee premium contributions to HSA qualified HDHPs for single coverage ($431) are not significantly lower than average annual employee contributions for single coverage in health plans overall ($610). Average annual employee premium contributions to HSA qualified HDHPs for family coverage, however, are significantly lower than average annual employee contributions to family coverage overall ($1,664 compared to $2,713). Employee contributions to HDHP/HRAs are nominally lower than employee contributions to health plans overall, but the differences are not statistically significant (EXHIBIT 8.5).
W H A T E M P L O Y E R S C O N T R I B U T E
• Employers contribute to these new arrangements in two ways: through their contributions toward the premium for the HDHP and through their contribution (if any) to the savings account option. When these contributions are added together for each employer offering such an arrangement, the average total employer contribution provided for covered workers in these arrangements is generally similar to the average employer contribution provided for covered workers for health plans overall.
8 Employers reported no annual maximum out-of-pocket limits for 3% of workers enrolled in HDHP/HRAs; these workers are excluded from the calculation.
9 For HSA qualified HDHPs, we excluded cases where employers reported annual out-of-pocket limits that exceeded the legal maximums ($5,100 for single coverage and $10,200 for family coverage for 2005).
n o t e :

High
-Dedu
ctible Health
Plan
s and S
avings A
ccoun
t Option
s
8
section eigh
tEmployer Health Benefits 2 0 0 5 A n n ua l S u rve y
93
T H E K A I S E R F A M I LY F O U N D AT I O N - A N D - H E A LT H R E S E A R C H A N D E D U C AT I O N A L T R U S T
• Covered workers in HDHP/HRAs on average have an employer that contributes (premium and HRA contribution combined) $3,872 toward single coverage and $7,538 towards family coverage. The $3,872 average contribution for single coverage is significantly higher than the average contribution covered workers have from their employers for single coverage overall ($3,413). The average contribution for family coverage ($7,538) is not statistically different than the average contribution that covered workers have from their employers for family coverage overall ($8,167) (EXHIBIT 8.5).
• As noted above, HRAs are structured in such a way that employers may not actually spend the whole amount that they make available to their employees’ HRAs.10 Funds the employee does not use generally roll over and can be used in future years and the balance may revert back to the employer if the employee leaves his or her job (REFER BACK TO SIDEBAR FOR DETAILS). Thus, the employer contribution amounts to HRAs that we capture in the survey may exceed the amount that employers will actually spend (EXHIBIT 8.4).
• Covered workers in HSA qualified HDHPs on average have an employer that contributes (premium and HSA contribution combined) $2,850 toward single coverage and $7,337 towards family coverage annually. Neither the $2,850 average total annual contribution for single coverage nor the $7,337 average total annual contribution toward family coverage is statistically different than the average annual contribution covered workers have from their employers for single or family coverage overall. We note that approximately one in three firms offering an HSA qualified HDHP (covering about 35% of workers in such plans) make no contribution to their employees’ HSA for either single or family coverage (EXHIBIT 8.5).
• Covered workers in HDHP/HRAs on average have an annual employer contribution to their HRA of $792 for single coverage and
$1,556 for family coverage. Covered workers in HSA qualified HDHPs on average have an annual employer contribution to their HSA of $553 for single coverage and $1,185 for family coverage (Exhibit 8.4). The average annual contribution to HSAs includes the cases where workers receive no employer contribution for their HSA. We note that the average HRA and HSA contribution shown in Exhibit 8.4 are different from the amounts that can be calculated by subtracting the average employer contribution toward single and family premiums for each arrangement from the average total employer contributions (premium plus account contribution) for single and family coverage for the same arrangements (see EXHIBIT 8.5). This is due to missing data for some questions for several firms in the sample. In other words, different sample sizes are used to generate average values for total premium, worker contribution to premium, employer contribution to premium, and employer contribution to the spending account.
F U T U R E P L A N S
• The number of employers offering HDHP/HRAs and HSA qualified HDHPs appears likely to grow over the next year.
• Four percent of firms not currently offering an HDHP/HRA report that they are “very likely” to offer an HDHP/HRA in the next year, and another 22% of such firms report that they are “somewhat likely” to do so (Exhibit 8.6). Two percent of firms not currently offering a HSA qualified HDHPs report that they are very likely to offer an HSA qualified HDHPs within the next year, with another 25% reporting that they are “somewhat likely” to do so. Large firms (200 or more workers), which provide coverage to more than one-half of covered workers, have a greater interest in these plans than firms overall, with 7% of large firms not currently offering a HSA qualified HDHP reporting that they are very likely to offer such a plan in the next year (EXHIBIT 8.7).
10 In the survey, we ask firms, “Up to what dollar amount does your firm promise to contribute each year to an employee’s HRA?” We refer to the amount that the employer commits to make available to an HRA as a contribution for ease of discussion. As discussed above, HRAs are notional accounts, and employers are not required to actually transfer funds until an employee incurs expenses. Employers may not expend the entire amount that they make available to their employees through an HRA.
n o t e :

High
-Dedu
ctible Health
Plan
s and S
avings A
ccoun
t Option
s
8
section eigh
t
Employer Health Benefits 2005 Annual Sur vey
94
T H E K A I S E R F A M I LY F O U N D AT I O N - A N D - H E A LT H R E S E A R C H A N D E D U C AT I O N A L T R U S T
0%
20%
40%
30%
10%
50%
60%
70%
all small firms(3-199 workers)
midsize firms(200-999 workers)
large firms(1,000-4,999
workers)
jumbo firms(5,000 or more
workers)
all firms
2003
2004
2005
5%10%
20%*
5% 7%
20%*
5% 9%*
20%* 17% 20%
33%*
5%10%
20%*
Exhibit 8.1
Among Firms Offering Health Benefits, Percentage That Offer an HDHP, by Firm Size, 2003-2005
* Estimate is statistically different from previous year shown at p.05.
High-deductible health plan (HDHP): A plan with an annual deductible of at least $1,000 for single coverage and $2,000 for family coverage. In 2003 and 2004 the survey used a different definition and asked firms if they offered a health plan with a deductible of more than $1,000 for single coverage. The 2003 and 2004 surveys did not specify a minimum deductible for family coverage. Some of the change in the HDHP prevalence may be the result of a change in the HDHP definition for 2005.
Note: The prevalence shown above is for all HDHPs, regardless of whether they are offered with an HRA, are HSA qualified, or neither.
Source: Kaiser/HRET Survey of Employer-Sponsored Health Benefits, 2003-2005.
s o u r c e :
Exhibit 8.2
Among Firms Offering Health Benefits, Percentage That Offer an HDHP/HRA and/or an HSA Qualified HDHP, 2005
0%
10%
hdhp/hra hsa qualified hdhp either (hdhp/hra or hsaqualified hdhp or both)‡
1.9% 2.3% 3.9%
20%
30%
40%
50%
‡ This includes 0.3% of all firms offering health benefits that offer both an HDHP/HRA and HSA qualified HDHP. .
High-deductible health plan (HDHP): A plan with an annual deductible of at least $1,000 for single coverage and $2,000 for family coverage.
HDHP/HRA: The survey asks about health reimbursement arrangements (HRAs) that are offered with a high-deductible health plan (HDHP). An HRA is a medical care reimbursement plan sponsored by an employer. HRAs are funded on a pre-tax basis ONLY by an employer, not the worker (see section 8 text for additional information about HRAs).
HSA qualified HDHP: The survey asks about high-deductible health plans that are health savings account (HSA) qualified. An HSA qualified HDHP includes an annual deductible of at least $1,000 for single coverage ($2,000 for family coverage) and maximum out-of-pocket cost-sharing of $5,100 for single coverage ($10,200 for family coverage) for 2005 (see section 8 text for additional information about HSAs).
Kaiser/HRET Survey of Employer-Sponsored Health Benefits, 2005.
s o u r c e :
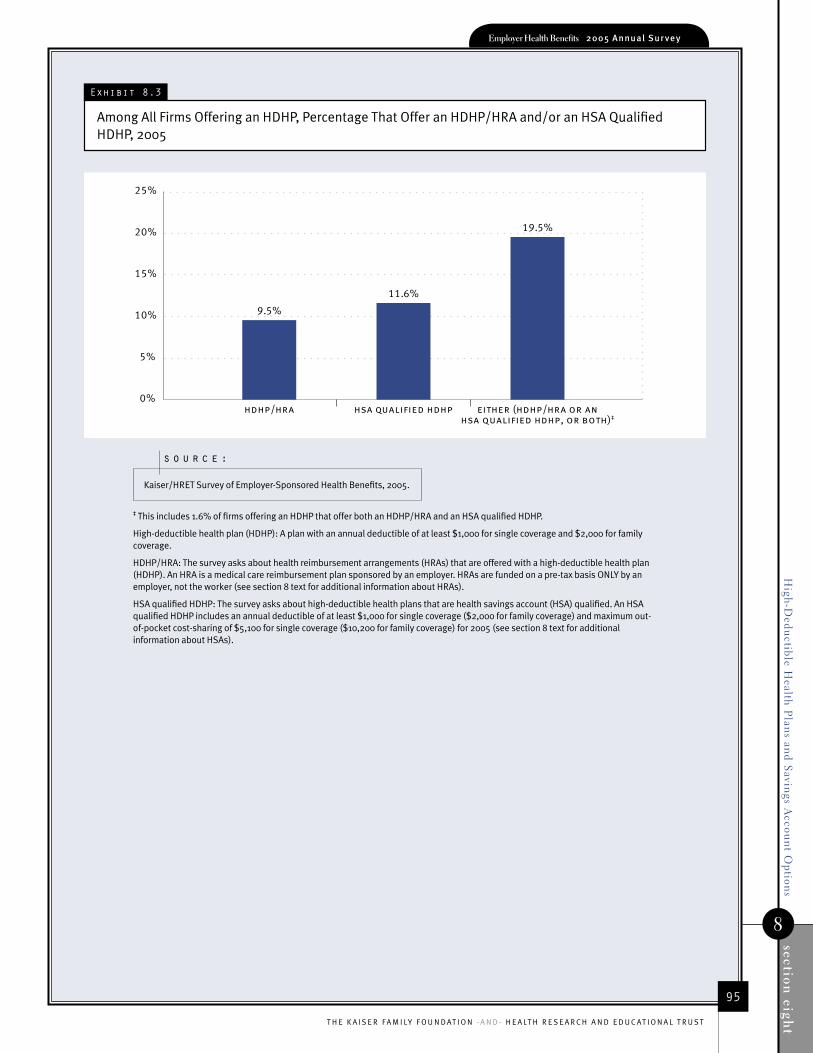
High
-Dedu
ctible Health
Plan
s and S
avings A
ccoun
t Option
s
8
section eigh
tEmployer Health Benefits 2005 Annual Sur vey
95
T H E K A I S E R F A M I LY F O U N D AT I O N - A N D - H E A LT H R E S E A R C H A N D E D U C AT I O N A L T R U S T
Exhibit 8.3
Among All Firms Offering an HDHP, Percentage That Offer an HDHP/HRA and/or an HSA Qualified HDHP, 2005
0%
5%
10%
15%
20%
25%
hdhp/hra hsa qualified hdhp either (hdhp/hra or anhsa qualified hdhp, or both)‡
9.5%
11.6%
19.5%
‡ This includes 1.6% of firms offering an HDHP that offer both an HDHP/HRA and an HSA qualified HDHP.
High-deductible health plan (HDHP): A plan with an annual deductible of at least $1,000 for single coverage and $2,000 for family coverage.
HDHP/HRA: The survey asks about health reimbursement arrangements (HRAs) that are offered with a high-deductible health plan (HDHP). An HRA is a medical care reimbursement plan sponsored by an employer. HRAs are funded on a pre-tax basis ONLY by an employer, not the worker (see section 8 text for additional information about HRAs).
HSA qualified HDHP: The survey asks about high-deductible health plans that are health savings account (HSA) qualified. An HSA qualified HDHP includes an annual deductible of at least $1,000 for single coverage ($2,000 for family coverage) and maximum out-of-pocket cost-sharing of $5,100 for single coverage ($10,200 for family coverage) for 2005 (see section 8 text for additional information about HSAs).
Kaiser/HRET Survey of Employer-Sponsored Health Benefits, 2005.
s o u r c e :

High
-Dedu
ctible Health
Plan
s and S
avings A
ccoun
t Option
s
8
section eigh
t
Employer Health Benefits 2005 Annual Sur vey
96
T H E K A I S E R F A M I LY F O U N D AT I O N - A N D - H E A LT H R E S E A R C H A N D E D U C AT I O N A L T R U S T
HDHP/HRA H SA QUALIFIED HDHP
Average Enrollment (Among Firms Offering Plan Type)
25% 15%
ANNUAL PLAN AVERAGES FOR: Single Family Single Family
Premium $3,503 $8,530 $2,700 $7,909
Worker Contribution to Premium $423 $2,654 $431 $1,664
Deductible $1,870 $3,686 $1,901 $4,070
Out-of-Pocket Maximum Liability ‡ $2,859 $5,075 $2,551 $4,661
Firm Contribution to HSA or HRA $792 $1,556 $553 $1,185
Exhibit 8.4
HDHP/HRA and HSA Qualified HDHP Features, for Single and Family Coverage, by Plan Type, 2005
Kaiser/HRET Survey of Employer-Sponsored Health Benefits, 2005.
s o u r c e :
‡ Employers reported no maximum out-of-pocket limits for 3% of workers enrolled in HDHP/HRAs; these workers are excluded from the calculation. For HSA qualified HDHPs, we excluded cases where employers reported out-of-pocket limits that exceeded the legal maximums ($5,100 for single coverage and $10,200 for family coverage).
High-deductible health plan (HDHP): A plan with an annual deductible of at least $1,000 for single coverage and $2,000 for family coverage.
HDHP/HRA: The survey asks about health reimbursement arrangements (HRAs) that are offered with a high-deductible health plan (HDHP). An HRA is medical care reimbursement plan sponsored by an employer. HRAs are funded on a pre-tax basis ONLY by an employer, not the worker (see section 8 text for additional information about HRAs).
HSA qualified HDHP: The survey asks about high-deductible health plans that are health savings account (HSA) qualified. An HSA qualified HDHP includes an annual deductible of at least $1,000 for single coverage ($2,000 for family coverage) and maximum out-of-pocket cost-sharing of $5,100 for single coverage ($10,200 for family coverage) for 2005 (see section 8 text for additional information about HSAs).
Note: The average firm contributions to HSAs for single coverage ($553) and family coverage ($1,185) include covered workers whose firm makes no contribution to the account. Average Firm Contributions to the HSA or HRA cannot be calculated by subtracting the average Total Annual Premium from the average Total Annual Spending (see Exhibit 8.5) due to varying sample sizes. Some firms provided data for premiums and worker contributions that were inconsistent with other data they provided about their HDHP/HRA or HSA qualified HDHP. These data were excluded from estimates of the average premium, worker contribution, and firm contribution for the HDHP; therefore there are fewer cases used in calculating those averages than for the average firm contribution to the HSA or HRA.

High
-Dedu
ctible Health
Plan
s and S
avings A
ccoun
t Option
s
8
section eigh
tEmployer Health Benefits 2005 Annual Sur vey
97
T H E K A I S E R F A M I LY F O U N D AT I O N - A N D - H E A LT H R E S E A R C H A N D E D U C AT I O N A L T R U S T
HDHP/HRA H SA QUALIFIED HDHP ALL PLANS‡
Single Family Single Family Single Family
TOTAL ANNUAL PREMIUM $3,503* $8,530* $2,700* $7,909* $4,024 $10,880
Worker Contribution to Premium $423 $2,654 $431 $1,664* $610 $2,713
Firm Contribution to Premium $3,080 $5,876* $2,270* $6,245* $3,413 $8,167
TOTAL ANNUAL FIRM CONTRIBUTION
(FIRM SHARE OF PREMIUM PLUS $3,872* $7,538 $2,850 $7,337 $3,413 $8,167
FIRM CONTRIBUTION TO HRA OR HSA)
TOTAL ANNUAL SPENDING
(TOTAL PREMIUM PLUS FIRM $4,295 $10,193 $3,280* $9,001* $4,024 $10,880
CONTRIBUTION TO HRA OR HSA)
Exhibit 8.5
Average Annual Premiums and Contributions to Spending Accounts For Covered Workers in HDHP/HRAs and HSA Qualified HDHPs Compared to All Plans, 2005
Kaiser/HRET Survey of Employer-Sponsored Health Benefits, 2005.
s o u r c e :
* Estimate is statistically different from All Plans by coverage type at p.05.
‡ All Plans refers to all conventional, HMO, PPO, and POS plans in the survey, not just HDHP/HRAs or HSA qualified HDHPs. Average firm contributions to the premium are the same as those shown in Exhibit 6.3.
High-deductible health plan (HDHP): A plan with an annual deductible of at least $1,000 for single coverage and $2,000 for family coverage.
HDHP/HRA: The survey asks about health reimbursement arrangements (HRAs) that are offered with a high-deductible health plan (HDHP). An HRA is medical care reimbursement plan sponsored by an employer. HRAs are funded on a pre-tax basis ONLY by an employer, not the worker (see section 8 text for additional information about HRAs).
HSA qualified HDHP: The survey asks about high-deductible health plans that are health savings account (HSA) qualified. An HSA qualified HDHP includes an annual deductible of at least $1,000 for single coverage ($2,000 for family coverage) and maximum out-of-pocket cost-sharing of $5,100 for single coverage ($10,200 for family coverage) for 2005 (see section 8 text for additional information about HSAs).
Note: Average Firm Contributions to the HSA or HRA (see Exhibit 8.4) cannot be calculated by subtracting the average Total Annual Premium from the average Total Annual Spending due to varying sample sizes. Some firms provided data for premiums and worker contributions that were inconsistent with other data they provided about their HDHP/HRA or HSA qualified HDHP. These data were excluded from estimates of the average premium, worker contribution, and firm contribution for the HDHP; therefore there are fewer cases used in calculating those averages than for the average firm contribution to the HSA or HRA.

High
-Dedu
ctible Health
Plan
s and S
avings A
ccoun
t Option
s
8
section eigh
t
Employer Health Benefits 2005 Annual Sur vey
98
T H E K A I S E R F A M I LY F O U N D AT I O N - A N D - H E A LT H R E S E A R C H A N D E D U C AT I O N A L T R U S T
0%
10%
20%
30%
40%
50%
all small firms(3-199
workers)
midsize firms(200-999workers)
large firms(1,000-4,999
workers)
jumbo firms(5,000 or
more workers)
all firms
very likely
somewhat likely
22%
3%
20%
6%
28%
5%
21%
7%
22%
4%
Exhibit 8.6
Among Firms Not Currently Offering an HDHP/HRA, Percentage That Say They Are “Very Likely” or “Somewhat Likely” to Offer an HDHP/HRA in the Next Year, 2005*
* Tests found no statistically different estimates from All Firms at p.05.
High-deductible health plan (HDHP): A plan with an annual deductible of at least $1,000 for single coverage and $2,000 for family coverage.
HDHP/HRA: The survey asks about health reimbursement arrangements (HRAs) that are offered with a high-deductible health plan (HDHP). An HRA is a medical care reimbrusement plan sponsored by an employer. HRAs are funded on a pre-tax basis ONLY by an employer, not the worker (see section 8 text for additional information about HRAs).
Source: Kaiser/HRET Survey of Employer-Sponsored Health Benefits, 2005.
s o u r c e :
Exhibit 8.7
Among Firms Not Currently Offering an HSA Qualified HDHP, Percentage That Say They Are “Very Likely” or “Somewhat Likely” to Offer an HSA Qualified HDHP in the Next Year, 2005
0%
10%
20%
30%
40%
50%
all small firms(3-199
workers)
midsize firms(200-999workers)
large firms(1,000-4,999
workers)*
jumbo firms(5,000 or
more workers)
all firms
somewhat likely
very likely
25%
2%
23%
6%
32%
8%
25%
10%
25%
2%
* Estimate is statistically different from All Firms at p.05.
High-deductible health plan (HDHP): A plan with an annual deductible of at least $1,000 for single coverage and $2,000 for family coverage.
HSA qualified HDHP: The survey asks about high-deductible health plans that are health savings account (HSA) qualified. An HSA qualified HDHP includes an annual deductible of at least $1,000 for single coverage ($2,000 for family coverage) and maximum out-of-pocket cost-sharing of $5,100 for single coverage ($10,200 for family coverage) for 2005 (see section 8 text for additional information about HSAs).
Kaiser/HRET Survey of Employer-Sponsored Health Benefits, 2005.
s o u r c e :

73%
9.2%$10,
880
810,000Employer Health Benefits
2005 Annual Survey
s e c t i o n
P re s c r i p t i o n
D r u g
B e n e f i t s
9

Employer Health Benefits 2 0 0 5 A n n ua l S u rve y
section
nin
ePrescription D
rug Benefits
9
100
T H E K A I S E R F A M I LY F O U N D AT I O N - A N D - H E A LT H R E S E A R C H A N D E D U C AT I O N A L T R U S T
PRESCRIPTION DRUG BENEFITS
I N R E S P O N S E T O R A P I D G R O W T H I N P R E S C R I P T I O N D R U G C O S T S O V E R T H E P A S T F E W Y E A R S ,
E M P L O Y E R S A N D H E A L T H P L A N S H A V E I M P L E M E N T E D C H A N G E S A N D S T R A T E G I E S I N A N E F F O R T T O
C O N S T R A I N D R U G S P E N D I N G . T H E M O S T P R O M I N E N T S T R A T E G Y A D O P T E D B Y E M P L O Y E R S I S T H E
U S E O F T I E R E D C O S T S H A R I N G A R R A N G E M E N T S , W H I C H G I V E W O R K E R S A F I N A N C I A L I N C E N -
T I V E T O C H O O S E L E S S E X P E N S I V E D R U G S . A L M O S T T H R E E I N F O U R C O V E R E D W O R K E R S A R E
I N P L A N S W I T H A T H R E E - T I E R O R F O U R - T I E R C O S T S H A R I N G A R R A N G E M E N T . S O M E C O V E R E D
W O R K E R S W I T H D R U G B E N E F I T S ( 1 0 % ) M U S T A L S O M E E T A S E P A R A T E P R E S C R I P T I O N D R U G
D E D U C T I B L E .
• As in prior years, nearly all (98%) covered workers in employer-sponsored plans have a prescription drug benefit.
• A majority of covered workers (89%) in 2005 have some sort of tiered cost sharing formula for prescription drugs (EXHIBIT 9.4). Cost sharing tiers generally are associated with the placement by a health plan of a drug on a formulary or preferred drug list. The formulary or drug list generally classifieds drugs as a generic, a preferred brand named, or a nonpreferred brand named drug. Recently, a few plans have created a fourth tier of cost sharing, which is used in some cases for lifestyle drugs or expensive biologics. Seventy-four percent of covered workers are enrolled in plans with three or four tiers of cost sharing for prescription drugs (EXHIBIT 9.1).
• The majority of covered workers with tiered benefits face copayments rather than coinsurance for generic, preferred, and non-preferred drugs. Average drug copayments increased slightly over the last year. The average drug copayments for preferred ($22), nonpreferred ($35), and fourth-tier ($74) drugs increased slightly over their level in 2004, while the average copayment for generic drugs is statistically unchanged from last year at $10 (EXHIBIT 9.2).11
• For workers with coinsurance rather than copayments for prescription drugs, cost sharing levels average 20% for generic drugs, 25% for preferred drugs, 33% for nonpreferred drugs, and 43% for fourth-tier drugs (EXHIBIT 9.3).12
• Other strategies used by firms and health plans to curb the rising cost of prescription drug coverage include a separate prescription drug deductible. Among covered workers with a drug benefit, 10% face a separate prescription drug deductible in 2005. The average annual deductible faced by covered workers for prescription drugs is $122 (EXHIBIT 9.5).
11 The average copayments for generic, preferred, and nonpreferred drugs are calculated by combining the weighted average copayments for those types of drugs among firms with a single copayment amount or a multi-tier cost sharing structure. Because in some cases drugs covered as fourth-tier drugs may be covered by health plans through other portions of their coverage (e.g., as part of major medical coverage), the average copayment for fourth-tier drugs is calculated using information from only those plans that have a fourth-tier copayment amount.
12 The average coinsurance rates for generic, preferred, and nonpreferred drugs are calculated by combining the weighted average coinsurance for those types of drugs among firms with a single coinsurance amount or a multi-tier cost sharing structure. Because in some cases drugs covered as fourth-tier drugs may be covered by health plans through other portions of their coverage (e.g., as part of major medical coverage), the average coinsurance for fourth-tier drugs is calculated using information from only those plans that have a fourth-tier coinsurance amount.
n o t e :

section
nin
e
9
Prescription Drug B
enefitsEmployer Health Benefits 2005 Annual Sur vey
101
T H E K A I S E R F A M I LY F O U N D AT I O N - A N D - H E A LT H R E S E A R C H A N D E D U C AT I O N A L T R U S T
Exhibit 9.1
Distribution of Covered Workers Facing Different Cost Sharing Formulas for Prescription Drug Benefits, 2000-2005
0% 10% 20% 30% 40% 50% 60% 70% 80% 90% 100%
2005*
2004
2003*
2002*
2001
2000
four-tier
three-tier
two-tier
payment is the same regardlessof type or cost of drugother
2%
1%
1%
2%
1%
2%
27% 49% 22%
41% 41% 18%
55% 30% 13%
63% 23% 13%
65% 20% 10%3%
70% 15% 8%4%
* Distribution is statistically different from the previous year shown at p.05 No statistical tests were conducted between 2003 and 2004 due to the addition of a new category.
Note: Fourth-tier drug copay information was not obtained prior to 2004.
Kaiser/HRET Survey of Employer-Sponsored Health Benefits, 2000-2005.
s o u r c e :
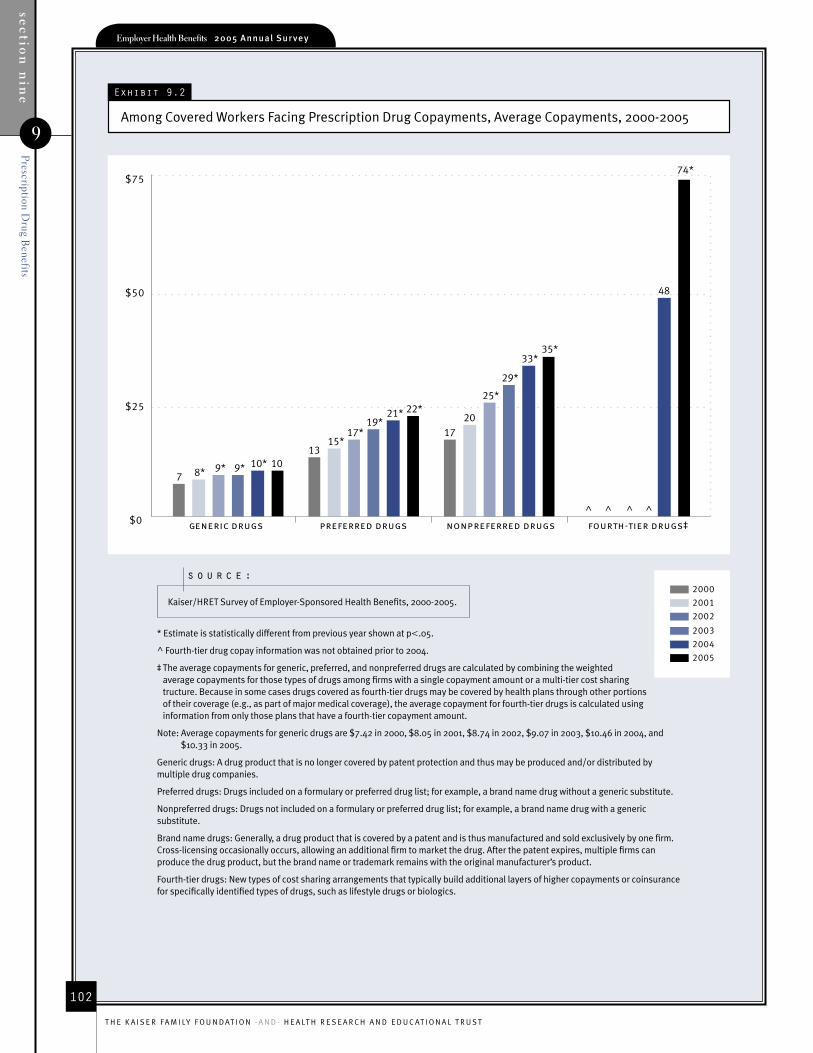
section
nin
ePrescription D
rug Benefits
9
Employer Health Benefits 2005 Annual Sur vey
102
T H E K A I S E R F A M I LY F O U N D AT I O N - A N D - H E A LT H R E S E A R C H A N D E D U C AT I O N A L T R U S T
Exhibit 9.2
Among Covered Workers Facing Prescription Drug Copayments, Average Copayments, 2000-2005
$0
$25
$50
$75
generic drugs preferred drugs nonpreferred drugs fourth-tier drugs‡
2000
2001
2002
2003
2004
2005
7 8* 9* 9* 10* 1013
15*17*
19*21* 22*
35*
1720
25*
29*
33*
^ ^ ^ ^
48
74*
* Estimate is statistically different from previous year shown at p.05.
^ Fourth-tier drug copay information was not obtained prior to 2004.
‡ The average copayments for generic, preferred, and nonpreferred drugs are calculated by combining the weighted average copayments for those types of drugs among firms with a single copayment amount or a multi-tier cost sharing tructure. Because in some cases drugs covered as fourth-tier drugs may be covered by health plans through other portions of their coverage (e.g., as part of major medical coverage), the average copayment for fourth-tier drugs is calculated using information from only those plans that have a fourth-tier copayment amount.
Note: Average copayments for generic drugs are $7.42 in 2000, $8.05 in 2001, $8.74 in 2002, $9.07 in 2003, $10.46 in 2004, and $10.33 in 2005.
Generic drugs: A drug product that is no longer covered by patent protection and thus may be produced and/or distributed by multiple drug companies.
Preferred drugs: Drugs included on a formulary or preferred drug list; for example, a brand name drug without a generic substitute.
Nonpreferred drugs: Drugs not included on a formulary or preferred drug list; for example, a brand name drug with a generic substitute.
Brand name drugs: Generally, a drug product that is covered by a patent and is thus manufactured and sold exclusively by one firm. Cross-licensing occasionally occurs, allowing an additional firm to market the drug. After the patent expires, multiple firms can produce the drug product, but the brand name or trademark remains with the original manufacturer’s product.
Fourth-tier drugs: New types of cost sharing arrangements that typically build additional layers of higher copayments or coinsurance for specifically identified types of drugs, such as lifestyle drugs or biologics.
Kaiser/HRET Survey of Employer-Sponsored Health Benefits, 2000-2005.
s o u r c e :

section
nin
e
9
Prescription Drug B
enefitsEmployer Health Benefits 2005 Annual Sur vey
103
T H E K A I S E R F A M I LY F O U N D AT I O N - A N D - H E A LT H R E S E A R C H A N D E D U C AT I O N A L T R U S T
Exhibit 9.3
Among Covered Workers Facing Coinsurance for Prescription Drugs, Average Coinsurance, 2000-2005
generic drugs preferred drugs nonpreferred drugs fourth-tier drugs‡
2000
2001
2002
2003
2004
2005
1918
21*20 20 20
2321
24* 2426
25
33
2224
28*29
31
^ ^ ^ ^
31
43*
0%
10%
20%
30%
40%
50%
* Estimate is statistically different from previous year shown at p.05.
^ Fourth-tier drug copay information was not obtained prior to 2004.
‡ The average coinsurance for generic, preferred, and nonpreferred drugs are calculated by combining the weighted average coinsurance for those types of drugs among firms with a single coinsurance amount or a multi-tier cost sharing structure. Because in some cases drugs covered as fourth-tier drugs may be covered by health plans through other portions of their coverage (e.g., as part of major medical coverage), the average coinsurance for fourth-tier drugs is calculated using information from only those plans who have a fourth tier coinsurance amount.
Generic drugs: A drug product that is no longer covered by patent protection and thus may be produced and/or distributed by multiple drug companies.
Preferred drugs: Drugs included on a formulary or preferred drug list; for example, a brand name drug without a generic substitute.
Nonpreferred drugs: Drugs not included on a formulary or preferred drug list; for example, a brand name drug with a generic substitute.
Brand name drugs: Generally, a drug product that is covered by a patent and is thus manufactured and sold exclusively by one firm. Cross-licensing occasionally occurs, allowing an additional firm to market the drug. After the patent expires, multiple firms can produce the drug product, but the brand name or trademark remains with the original manufacturer’s product.
Fourth-tier drugs: New types of cost sharing arrangements that typically build additional layers of higher copayments or coinsurance for specifically identified types of drugs, such as lifestyle drugs or biologics.
Kaiser/HRET Survey of Employer-Sponsored Health Benefits, 2000-2005.
s o u r c e :
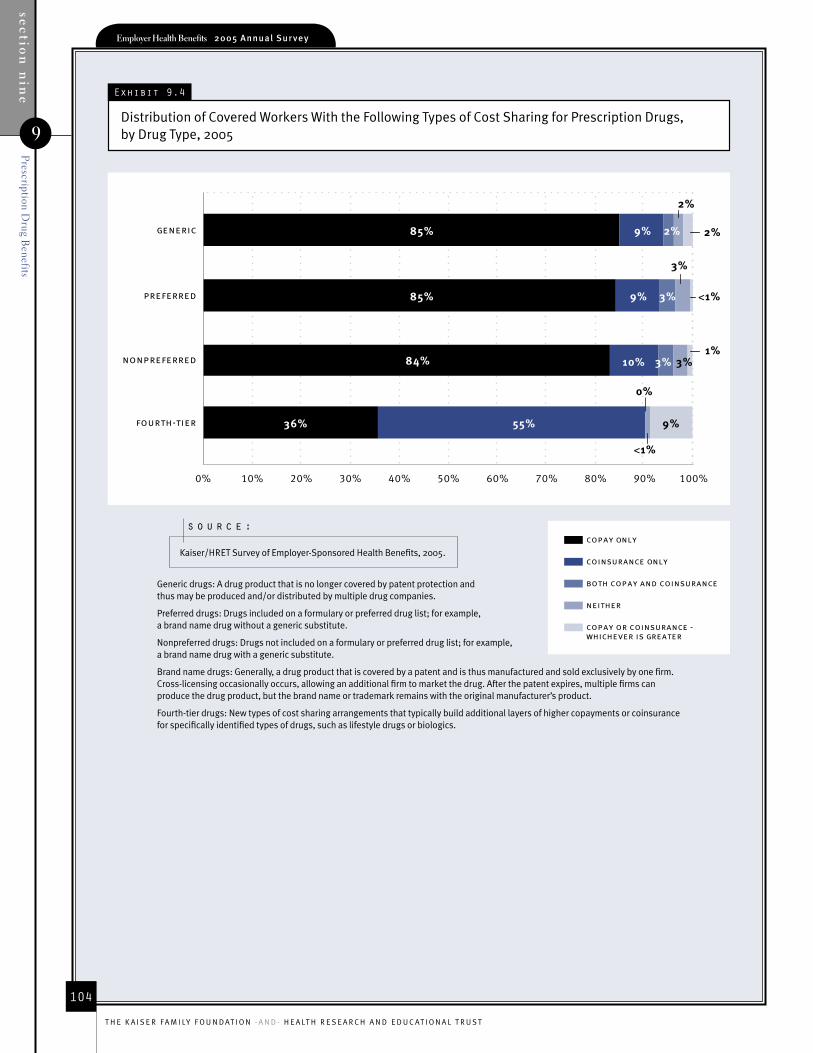
section
nin
ePrescription D
rug Benefits
9
Employer Health Benefits 2005 Annual Sur vey
104
T H E K A I S E R F A M I LY F O U N D AT I O N - A N D - H E A LT H R E S E A R C H A N D E D U C AT I O N A L T R U S T
Exhibit 9.4
Distribution of Covered Workers With the Following Types of Cost Sharing for Prescription Drugs, by Drug Type, 2005
0% 10% 20% 30% 40% 50% 60% 70% 80% 90% 100%
fourth-tier
nonpreferred
preferred
generic
copay only
coinsurance only
both copay and coinsurance
neither
copay or coinsurance - whichever is greater
85% 9% 2%
85% 9% 3%
84% 10% 3%
36% 55%
2%
1%
9%
2%
<1%
<1%
3%
0%
3%
Generic drugs: A drug product that is no longer covered by patent protection and thus may be produced and/or distributed by multiple drug companies.
Preferred drugs: Drugs included on a formulary or preferred drug list; for example, a brand name drug without a generic substitute.
Nonpreferred drugs: Drugs not included on a formulary or preferred drug list; for example, a brand name drug with a generic substitute.
Brand name drugs: Generally, a drug product that is covered by a patent and is thus manufactured and sold exclusively by one firm. Cross-licensing occasionally occurs, allowing an additional firm to market the drug. After the patent expires, multiple firms can produce the drug product, but the brand name or trademark remains with the original manufacturer’s product.
Fourth-tier drugs: New types of cost sharing arrangements that typically build additional layers of higher copayments or coinsurance for specifically identified types of drugs, such as lifestyle drugs or biologics.
Kaiser/HRET Survey of Employer-Sponsored Health Benefits, 2005.
s o u r c e :

section
nin
e
9
Prescription Drug B
enefitsEmployer Health Benefits 2005 Annual Sur vey
105
T H E K A I S E R F A M I LY F O U N D AT I O N - A N D - H E A LT H R E S E A R C H A N D E D U C AT I O N A L T R U S T
Exhibit 9.5
Percentage of Covered Workers with Drug Coverage Who Face a Separate Drug Deductible, by Plan Type, 2005‡
0%
5%
10%
15%
20%
25%
conventional hmo* ppo pos all plans
12%
4%
11% 11%10%
* Estimate is statistically different from All Plans at p.05.
‡ Prevalence is among 98% of covered workers who have a prescription drug benefit.
Note: The average annual prescription drug deductible among covered workers facing a deductible is $122.
Kaiser/HRET Survey of Employer-Sponsored Health Benefits, 2005.
s o u r c e :


73%
9.2%$10,
880
810,000Employer Health Benefits
2005 Annual Survey
s e c t i o n
E m p l o y e e
C o v e ra g e ,
E l i g i b i l i t y, a n d
Pa r t i c i p a t i o n
3
73%
9.2%$10,
880
810,000Employer Health Benefits
2005 Annual Survey
s e c t i o n
P l a n
F u n d i n g
10

Employer Health Benefits 2 0 0 5 A n n ua l S u rve y
sec
tion
ten
Plan Funding
10
108
T H E K A I S E R F A M I LY F O U N D AT I O N - A N D - H E A LT H R E S E A R C H A N D E D U C AT I O N A L T R U S T
PLAN FUNDING
T H E E M P L O Y E E R E T I R E M E N T I N C O M E A N D S E C U R I T Y A C T ( E R I S A ) O F 1 9 7 4 E X E M P T S S E L F -
F U N D E D P L A N S F R O M S T A T E I N S U R A N C E A N D O T H E R L A W S , I N C L U D I N G R E S E R V E R E Q U I R E -
M E N T S , M A N D A T E D B E N E F I T S , P R E M I U M T A X E S , A N D C O N S U M E R P R O T E C T I O N R E G U L A T I O N S . 1 3
B E C A U S E L A R G E R F I R M S H A V E M O R E E M P L O Y E E S O V E R W H O M T O S P R E A D T H E R I S K O F C O S T L Y
C L A I M S , S E L F - F U N D I N G I S M O R E C O M M O N A N D L E S S R I S K Y A M O N G L A R G E R F I R M S T H A N
A M O N G S M A L L E R O N E S .
• Similar to last year, 54% of covered workers in 2005 are in a plan that is completely or partially self funded (EXHIBIT 10.1).
• Covered workers in smaller firms are less likely to be in a self-funded plan compared to covered workers in larger firms. On average, 13% of covered workers in small firms (3-199 workers) are in a self-funded plan, compared with 53%
of covered workers in midsize firms (200-999 workers), 78% in large firms (1,000-4,999 workers), and 82% in jumbo firms (5,000 or more workers) (EXHIBIT 10.1).
• The prevalence of self funding is relatively high in PPO plans (65% of covered workers in PPOs are in a self-funded plan) compared to HMO plans (32%) and POS plans (36%) (EXHIBIT 10.2).
13 A self-funded plan is one in which the employer assumes direct responsibility for the costs of enrollees’ medical claims. Employers sponsoring self-funded plans typically contract with a third-party administrator or insurer to provide administrative services for the self-funded plan.
n o t e :

sec
tion
ten
Plan FundingEmployer Health Benefits 2005 Annual Sur vey
109
T H E K A I S E R F A M I LY F O U N D AT I O N - A N D - H E A LT H R E S E A R C H A N D E D U C AT I O N A L T R U S T
10
Exhibit 10.1
Percentage of Covered Workers in Partially or Completely Self-Funded Plans, by Firm Size, 1999-2005
0%
20%
40%
60%
80%
100%
all small firms(3-199 workers)
midsize firms(200-999 workers)
large firms(1,000-4,999
workers)
jumbo firms(5,000 or
more workers)
all firms
1999
2001
2003
2004
2005
1317
10* 1013
51 5250 50
53
6266
71
78 78
62
70
79 8082
44
4952 54 54
* Estimate is statistically different from the previous year shown at p.05.
Self-funded plan: An insurance arragement in which the employer assumes direct financial responsibility for the costs of enrollees’ medical claims. Employers sponsoring self-funded plans typically contract with a third-party administrator or insurer to provide administrative services for the self-funded plan.
Kaiser/HRET Survey of Employer-Sponsored Health Benefits, 1999-2005.
s o u r c e :

Employer Health Benefits 2005 Annual Sur vey
110
T H E K A I S E R F A M I LY F O U N D AT I O N - A N D - H E A LT H R E S E A R C H A N D E D U C AT I O N A L T R U S T
sec
tion
ten
Plan Funding
10
Exhibit 10.2
Percentage of Covered Workers in Partially or Completely Self-Funded Plans, by Plan Type, 1999-2005
0%
20%
40%
60%
80%
100%
conventional hmo ppo pos all plans
1999
2001
2003
2004
2005
65 65
49
43
53
16
31* 29 2932
60 61 6164 65
42 4244
46
36
44
49*52 54 54
* Estimate is statistically different from the previous year shown at p.05.
Self-funded plan: An insurance arrangement in which the employer assumes direct financial responsibility for the costs of enrollees’ medical claims. Employers sponsoring self-funded plans typically contract with a third-party administrator or insurer to provide administrative services for the self-funded plan.
Kaiser/HRET Survey of Employer-Sponsored Health Benefits, 1999-2005.
s o u r c e :

sec
tion
ten
Plan FundingEmployer Health Benefits 2005 Annual Sur vey
111
T H E K A I S E R F A M I LY F O U N D AT I O N - A N D - H E A LT H R E S E A R C H A N D E D U C AT I O N A L T R U S T
10
Exhibit 10.3
Percentage of Covered Workers in Partially or Completely Self-Funded HMO Plans, by Firm Size, 1999-2005
0%
20%
40%
60%
80%
100%
all small firms(3-199 workers)
midsize firms(200-999 workers)
large firms(1,000-4,999
workers)
jumbo firms(5,000 or
more workers)
all firms
1999
2001
2003
2004
2005
514
5 410
1423 21 18 17
22
3237
49 50
19
40*44
4044
16
31* 29 29 32
Exhibit 10.4
Percentage of Covered Workers in Partially or Completely Self-Funded PPO Plans, by Firm Size, 1999-2005
0%
20%
40%
60%
80%
100%
all small firms(3-199 workers)
midsize firms(200-999 workers)
large firms(1,000-4,999
workers)
jumbo firms(5,000 or
more workers)
all firms
1999
2001
2003
2004
2005
1923
13* 1318
69 6660 63
67
84 87 85 88 88 87 8793 93 95
60 61 61 64 65
* Estimate is statistically different from the previous year shown at p.05.
Self-funded plan: An insurance arrangement in which the employer assumes direct financial responsibity for the costs of enrollees’ medical claims. Employers sponsoring self-funded plans typically contract with a third-party administrator or insurer to provide administrative services for the self-funded plan.
Kaiser/HRET Survey of Employer-Sponsored Health Benefits, 1999-2005.
s o u r c e :
* Estimate is statistically different from the previous year shown at p.05.
Self-funded plan: An insurance arrangement in which the employer assumes direct financial responsibility for the costs of enrollees’ medical claims. Employers sponsoring self-funded plans typically contract with a third-party administrator or insurer to provide administrative services for the self-funded plan.
Kaiser/HRET Survey of Employer-Sponsored Health Benefits, 1999-2005.
s o u r c e :

Employer Health Benefits 2005 Annual Sur vey
112
T H E K A I S E R F A M I LY F O U N D AT I O N - A N D - H E A LT H R E S E A R C H A N D E D U C AT I O N A L T R U S T
sec
tion
ten
Plan Funding
10
Fully Insured Self-Funded (Coverage Underwritten (Employer Bears Some by an Insurer) or All of Financial Risk)
ALL PL ANS
Mining/Construction/Wholesale 60%* 40%*Manufacturing 26* 74*Transportation/Communications/Utility 28* 72*Retail 46 54Finance 49 51Service 61* 39*State/Local Government 39 61Health Care 35* 65*
ALL INDUSTRIE S 46% 54%
Kaiser/HRET Survey of Employer-Sponsored Health Benefits: 2005.
s o u r c e :
Exhibit 10.6
Percentage of Covered Workers With Different Funding Arrangements, by Industry, 2005
Exhibit 10.5
Percentage of Covered Workers in Partially or Completely Self-Funded POS Plans, by Firm Size, 1999-2005*
0%
20%
40%
60%
80%
100%
all small firms(3-199 workers)
midsize firms(200-999 workers)
large firms(1,000-4,999
workers)
jumbo firms(5,000 or
more workers)
all firms
1999
2001
2003
2004
2005
10 10 8 9 9
3540 42 42
31
62 60
7363
48
75 7671
78 74
42 42 44 4636
* Estimates are statistically different from All Industries at p.05.
Fully insured plan: An insurance arrangement in which the employer contracts with a health plan to assume financial responsibility for the costs of enrollees’ medical claims.
Self-funded plan: An insurance arrangement in which the employer assumes direct financial responsibility for the costs of enrollees’ medical claims. Employers sponsoring self-funded plans typically contract with a third-party administrator or insurer to provide administrative services for the self-funded plan.
* Tests found no statistically different estimates from the prior year shown at p.05.
Self-funded plan: An insurance arrangement in which the employer assumes direct financial responsibility for the costs of enrollees’ medical claims. Employers sponsoring self-funded plans typically contract with a third-party administrator or insurer to provide administrative services for the self-funded plan.
Kaiser/HRET Survey of Employer-Sponsored Health Benefits, 1999-2005.
s o u r c e :

73%
9.2%$10,
880
810,000Employer Health Benefits
2005 Annual Survey
s e c t i o n
R e t i re e
H e a l t h
B e n e f i t s
11

Employer Health Benefits 2 0 0 5 A n n ua l S u rve y
section
elevenR
etiree Health B
enefits
11
114
T H E K A I S E R F A M I LY F O U N D AT I O N - A N D - H E A LT H R E S E A R C H A N D E D U C AT I O N A L T R U S T
RETIREE HEALTH BENEFITS
R E T I R E E H E A L T H B E N E F I T S A R E A N I M P O R T A N T C O N S I D E R A T I O N F O R O L D E R W O R K E R S M A K I N G
T H E I R D E C I S I O N S A B O U T R E T I R E M E N T . H E A L T H B E N E F I T S F O R R E T I R E E S A L S O P R O V I D E A N
I M P O R T A N T S U P P L E M E N T T O M E D I C A R E F O R R E T I R E E S A G E 6 5 A N D O V E R . L A R G E F I R M S ( 2 0 0
O R M O R E W O R K E R S ) A R E M U C H M O R E L I K E L Y T H A N S M A L L F I R M S ( 3 - 1 9 9 W O R K E R S ) T O O F F E R
R E T I R E E H E A L T H B E N E F I T S . A F T E R F A L L I N G D R A M A T I C A L L Y I N T H E L A T E 1 9 8 0 S A N D E A R L Y
1 9 9 0 S , T H E P E R C E N T A G E O F L A R G E F I R M S ( 2 0 0 O R M O R E W O R K E R S ) O F F E R I N G R E T I R E E
H E A L T H B E N E F I T S H A S R E M A I N E D R E L A T I V E L Y C O N S T A N T .
A V A I L A B I L I T Y O F R E T I R E E B E N E F I T S
• Thirty-three percent of large firms (200 or more workers) offer retiree coverage in 2005, similar to 36% in 2004 but down from 66% in 1988 (EXHIBIT 11.1).
• Retiree benefits vary substantially by firm size, industry, and the presence of union workers.
• Large firms (200 or more workers) are much more likely to offer retiree benefits than small firms (3-199 workers). Thirty-three percent of large firms offer retiree benefits, compared to just 7% percent of small firms (EXHIBIT 11.2).
• Among large firms (200 or more workers), state and local governments are more likely than other firms in other industries to offer retiree benefits (84% vs. 33%) (EXHIBIT 11.2).
• Large firms (200 or more workers) with union workers are significantly more likely to offer retiree health benefits than large firms without union workers—49% of all large firms with union employees offer retiree benefits, compared with 24% for all large firms that do not have union employees (EXHIBIT 11.3).
• Virtually all large firms (200 or more workers) that offer retiree benefits offer them to early retirees under the age of 65 (94%). A lower percentage (81%) of large firms offering retiree benefits offer them to Medicare-age retirees (EXHIBIT 11.4).

section
elevenR
etiree Health B
enefits
11
Employer Health Benefits 2005 Annual Sur vey
115
T H E K A I S E R F A M I LY F O U N D AT I O N - A N D - H E A LT H R E S E A R C H A N D E D U C AT I O N A L T R U S T
Exhibit 11.1
Percentage of All Large Firms‡ (200 or More Workers) Offering Retiree Health Benefits, 1988-2005*
0%
10%
20%
30%
40%
50%
60%
70%
80%
1988 1991 1993 1995 1998 1999 2000 2001 2002 2003 2004 2005
66%
46%
36%
40% 40% 40%
35%37% 36%
38%36%
33%
* Tests found no statistically different estimates from the previous year shown at p.05. No statistical tests were conducted for years prior to 1999.
‡ Among firms that offer health benefits to active workers.
Kaiser/HRET Survey of Employer-Sponsored Health Benefits, 1999-2005; KPMG Survey of Employer-Sponsored Health Benefits, 1991, 1993, 1995, 1998; The Health Insurance Association of America (HIAA), 1988.
s o u r c e :

section
elevenR
etiree Health B
enefits
11
Employer Health Benefits 2005 Annual Sur vey
116
T H E K A I S E R F A M I LY F O U N D AT I O N - A N D - H E A LT H R E S E A R C H A N D E D U C AT I O N A L T R U S T
All Small Firms All Large Firms (3 - 199 Workers) (200 or More Workers)
FIRM SIZE
Small (3 - 24 Workers) 6% –
Small (25 - 49 Workers) 6 –
Small (50 - 199 Workers) 18* –
Midsize (200 - 999 Workers) – 28%
Large (1,000 - 4,999 Workers) – 43*
Jumbo (5,000 or More Workers) – 55*
REGION
Northeast 8% 34%
Midwest 10 42
South 4 33
West 7 21*
INDUSTRY
Mining/Construction/Wholesale 9% 20%*
Manufacturing 8 40
Transportation/Communications/Utility 15 45
Retail 1* 6*
Finance 6 40
Service 6 29
State/Local Government 41* 84*
Health Care 5 22*
ALL FIRM SIZE S, REGIONS, AND INDUSTRIE S 7% 33%
Exhibit 11.2
Percentage of Firms Offering Retiree Health Benefits‡, by Firm Size, Region, and Industry, 2005
* Estimate is statistically different from All Firm Sizes, Regions, and Industries at p.05.
‡ Among firms that offer health benefits to active workers.
Kaiser/HRET Survey of Employer-Sponsored Health Benefits, 2005.
s o u r c e :

section
elevenR
etiree Health B
enefits
11
Employer Health Benefits 2005 Annual Sur vey
117
T H E K A I S E R F A M I LY F O U N D AT I O N - A N D - H E A LT H R E S E A R C H A N D E D U C AT I O N A L T R U S T
Exhibit 11.3
Percentage of All Large Firms (200 or More Workers) Offering Retiree Health Benefits, by Firm Characteristics, 2005‡
0% 10% 20% 30% 40% 50%
24%
49%
24%
35%
19%
36%higher wage (less than 35%earn $20,000 a year or less)
lower wage(35% or moreearn $20,000 a year or less)
few workers are part-time(less than 35% work part-time)
many workers are part-time(35% or more work part-time)
wage level*
part-time workers*
unions*firm has at least
some union workers
firm does not haveany union workers
* Estimates are statistically different from each other within categories at p.05.
Among firms that offer health benefits to active workers.
Kaiser/HRET Survey of Employer-Sponsored Health Benefits, 2005.
s o u r c e :
Exhibit 11.4
Among All Large Firms (200 or More Workers) Offering Retiree Coverage, Percentage Offering Health Benefits to Early and Medicare-Age Retirees, 1999-2005‡
0%10%20%30%40%50%60%70%80%90%
100%
offer health benefitsto early retirees
93%98%*
93% 96% 94%
76% 73%78% 75%
81%
1999
2001
2003
2004
2005
offer health benefitsto medicare-age retirees
* Estimate is statistically different from the previous year shown at p.05.
‡ Among firms that offer health benefits to active workers.
Early retiree: Workers retiring before age 65.
Kaiser/HRET Survey of Employer-Sponsored Health Benefits, 1999-2005.
s o u r c e :

section
elevenR
etiree Health B
enefits
11
Employer Health Benefits 2005 Annual Sur vey
118
T H E K A I S E R F A M I LY F O U N D AT I O N - A N D - H E A LT H R E S E A R C H A N D E D U C AT I O N A L T R U S T
Percentage of Employers Percentage of Employers Offering Retiree Offering Retiree HealthBenefits Health Benefits to Early Retirees to Medicare-Age Retirees
FIRM SIZE
Midsize (200 - 999 Workers) 94% 78%
Large (1,000 - 4,999 Workers) 94 83
Jumbo (5,000 or More Workers) 96 86
REGIONS
Northeast 95% 87%
Midwest 97 85
South 94 74
West 85 78
INDUSTRY
Mining/Construction/Wholesale 99%* 90%
Manufacturing 93 84
Transportation/Communications/Utility 99* 82
Retail NSD NSD
Finance 99* 83
Service 93 74
State/Local Government 95 81
Health Care 88 69
ALL LARGE FIRMS, REGIONS, AND INDUSTRIE S 94% 81%
Exhibit 11.5
Among All Large Firms (200 or More Workers) Offering Retiree Health Coverage, Percentage Offering Retiree Benefits to Early and Medicare-Age Retirees, by Firm Size, Region, and Industry, 2005‡
* Estimate is statistically different from All Large Firms, Regions, and Industries at p.05.
‡ Among firms that offer health benefits to active workers.
Early retiree: Workers retiring before age 65.
NSD: Not Sufficient Data.
Kaiser/HRET Survey of Employer-Sponsored Health Benefits, 2005.
s o u r c e :

73%$1
0,88
0810,000
Employer Health Benefits2005 Annual Survey
s e c t i o n
1 2
9.2%
E m p l o y e r
O p i n i o n s
a n d H e a l t h
M a n a g e m e n t
P ro g ra m s

Employer Health Benefits 2 0 0 5 A n n ua l S u rve y
section tw
elveE
mployer O
pinions and Health M
anagement Program
s
12
120
T H E K A I S E R F A M I LY F O U N D AT I O N - A N D - H E A LT H R E S E A R C H A N D E D U C AT I O N A L T R U S T
EMPLOYER OPINIONS AND HEALTH MANAGEMENT PROGRAMS
E M P L O Y E R S P L A Y A S I G N I F I C A N T R O L E I N T H E H E A L T H I N S U R A N C E C O V E R A G E O F A M E R I C A N S
— P R O V I D I N G H E A L T H B E N E F I T S T O M O R E T H A N T H R E E O U T O F E V E R Y F I V E O F T H E
N O N E L D E R L Y 1 4 — S O T H E I R A T T I T U D E S , K N O W L E D G E , A N D E X P E R I E N C E S A R E I M P O R T A N T
F A C T O R S I N H E A L T H P O L I C Y D I S C U S S I O N S .
T H I S Y E A R ’ S S U R V E Y A S K E D E M P L O Y E R S A N U M B E R O F Q U E S T I O N S A B O U T T H E I R O P I N I O N S
O N V A R I O U S I S S U E S A N D O N P O S S I B L E F U T U R E C H A N G E S I N H E A L T H B E N E F I T S , I N C L U D I N G
W H E T H E R T H E Y S H O P P E D F O R N E W C O V E R A G E , H O W T H E Y V I E W D I F F E R E N T A P P R O A C H E S T O
C O N T A I N I N G C O S T I N C R E A S E S , A N D H O W T H E Y P L A N T O C H A N G E T H E I R H E A L T H B E N E F I T P L A N S
I N T H E N E A R F U T U R E . A L A R G E S H A R E O F F I R M S S H O P P E D F O R A N E W P L A N O R H E A L T H I N S U R -
A N C E C A R R I E R I N T H E P A S T Y E A R A N D R E L A T I V E L Y F E W F I R M S T H I N K T H A T A N Y O F T H E C U R -
R E N T L Y A V A I L A B L E C O S T - C O N T A I N M E N T S T R A T E G I E S A R E “ V E R Y E F F E C T I V E ” .
T H I S Y E A R , F O R T H E F I R S T T I M E I N S E V E R A L Y E A R S , W E A S K E D E M P L O Y E R S A B O U T T H E U S E
O F 3 U T I L I Z A T I O N M A N A G E M E N T P R O V I S I O N S A N D 4 D I S E A S E M A N A G E M E N T P R O G R A M S . W E
F I N D T H A T A S U B S T A N T I A L P E R C E N T A G E O F W O R K E R S A R E E N R O L L E D I N A H E A L T H P L A N W I T H
A U T I L I Z A T I O N M A N A G E M E N T P R O V I S I O N A N D / O R A D I S E A S E M A N A G E M E N T P R O G R A M .
• Overall, 60% of firms offering health benefits say that they shopped for a new plan or insurance carrier in the past year (EXHIBIT 12.1).
• Among firms offering health benefits that shopped, 24% say that they switched carriers within the past year and 30% report that they changed the type of health plan they offer.15 Although less likely to have shopped for a new plan or insurance carrier, jumbo firms (5,000 or more workers) that shopped are more likely than all firms that shopped to report switching carriers (45% vs. 24%) (EXHIBIT 12.1).
• Jumbo firms (5,000 or more workers) are less likely than all firms to report that they shopped for a new plan or insurance carrier in the past year (EXHIBIT 12.1).
• All firms, including both those that offer and do not offer health benefits, were asked to rate how effective several different strategies are in reducing the growth of health care costs. Few firms rated any one strategy as “very effective” at controlling costs.
• Consumer-driven health plans are rated as “very effective” at reducing cost growth by 16% of firms, 14% of firms report that disease management is “very effective”, 12% say that higher employee cost sharing is “very effective” and 7% report that tighter managed care networks are “very effective”. Around 45% of firms report that consumer-driven health plans and higher cost sharing are “somewhat effective” at controlling costs (EXHIBIT 12.5).
14 Kaiser Family Foundation, Kaiser Commission on Medicaid and the Uninsured. Health Insurance Coverage in America 2003, Data Update November 2004.
15 These answers are not exclusive: 10% of firms that shopped switched both carrier and type of health plan offered.
n o t e :

section tw
elveE
mployer O
pinions and Health M
anagement Program
s
12
Employer Health Benefits 2 0 0 5 A n n ua l S u rve y
121
T H E K A I S E R F A M I LY F O U N D AT I O N - A N D - H E A LT H R E S E A R C H A N D E D U C AT I O N A L T R U S T
• Ninety-three percent of all covered workers are enrolled in health plan with at least one of the following utilization management provisions: case management for large claims, pre-admission certification for hospital care, or pre-admission certification for outpatient surgery.
• Among covered workers, 81% have case management for large claims, 75% have pre-admission certification for inpatient hospital care, and 55% have pre-admission certification for outpatient surgery (EXHIBIT 12.3).
• Over half of all covered workers (56%) are enrolled in a health plan with a disease management program (EXHIBIT 12.4).
• Among covered workers in plans with a disease management program, 99% have a diabetes program, 86% have an asthma program, 82% have a hypertension program, and 66% have a high cholesterol program (EXHIBIT 12.4).
• Each year we ask employers whether they expect to change the contributions, cost sharing, or eligibility for health benefits in the next year. Generally, large firms (200 or more workers) are more likely than small firms (3-199 workers) to say that they intend to increase employee costs (EXHIBIT 12.6).
• Almost half (43%) of large firms (200 or more workers) say that they are “very likely” to increase the amount employees pay for health insurance next year, compared to 15% of small firms (3-199 workers) (EXHIBIT 12.6).
• Employer interest in tiered cost sharing for physician or hospital services remains limited: less than 0.5% of employers say that they are “very likely” to offer a tiered network, while 14% say that they are “somewhat likely” to offer tiered cost sharing.
• As observed in previous years, relatively small percentages of employers report that they are likely to restrict eligibility or drop coverage altogether (EXHIBIT 12.6).

section tw
elveE
mployer O
pinions and Health M
anagement Program
s
12
Employer Health Benefits 2005 Annual Sur vey
122
T H E K A I S E R F A M I LY F O U N D AT I O N - A N D - H E A LT H R E S E A R C H A N D E D U C AT I O N A L T R U S T
Exhibit 12.1
Among Firms That Offer Health Benefits, Percentage That Shopped for a New Plan or Insurance Carrier, and the Percentage of These Firms That Changed Plan Types or Insurance Carriers in the Last Year, by Firm Size, 2005
all small firms midsize firms(200-999 workers)
large firms(1,000-4,999
workers)
PERCENTAGE OF FIRMS THAT SHOPPED FOR A NEW PLAN OR HEALTH INSURANCE CARRIER
jumbo firms(5,000 or
more workers)
all firms
60%56%
40%*35%*
60%
0%
10%
20%
30%
40%
50%
60%
AMONG FIRMS THAT SHOPPED FOR A NEW PLAN OR INSURANCE CARRIER, PERCENTAGE REPORTING THAT THEY CHANGED INSURANCE CARRIER
AND/OR HEALTH PLAN TYPE IN THE LAST YEAR, BY FIRM SIZE‡
all small firms(3-199 workers)
midsize firms(200-999 workers)
large firms(1,000-4,999
workers)
jumbo firms(5,000 or
more workers)
all firms0%
10%
20%
30%
40%
50%
60%
24%
31%
25%23%
39%*
22%
45%*
30%
24%
30%
changed insurance carrier
changed health plan type
* Estimate is statistically different from All Firms at p.05.
‡ These answers are not exclusive; 10% of firms that shopped switched both carrier and type of plan offered.
Kaiser/HRET Survey of Employer Sponsored Health Benefits, 2005.
s o u r c e :
* Estimate is statistically different from All Firms at p.05.

section tw
elveE
mployer O
pinions and Health M
anagement Program
s
12
Employer Health Benefits 2005 Annual Sur vey
123
T H E K A I S E R F A M I LY F O U N D AT I O N - A N D - H E A LT H R E S E A R C H A N D E D U C AT I O N A L T R U S T
Percentage of Percentage of Firms Offering Percentage of Firms Offering Percentage of Fitness Programs Firms Offering Injury Firms Offering or On-Site Smoking Prevention Weight Health Club Cessation Prevention Loss Facilities Programs Programs Programs
FIRM SIZE
3 - 24 Workers 6% 3% 15% 4%
25 - 199 Workers 15* 9* 25* 6
ALL SMALL FIRMS (3 - 199 W ORKERS) 8 4 16 4
Midsize (200 - 999 Workers) 31* 31* 30* 24*
Large (1,000 - 4,999 Workers) 41* 41* 40* 36*
Jumbo (5,000+ Workers) 44* 43* 41* 42*
ALL LARGE FIRMS (200 OR MORE W ORKERS) 34* 34* 33* 28*
REGION
Northeast 12% 10% 12% 9%
Midwest 7 4 15 5
South 4* 2* 14 1*
West 13 5 28 5
INDUSTRY
Mining/Construction/Wholesale 7% 2% 35%* 6%
Manufacturing 7 11* 30 6
Transportation/Communications/Utility 16 5 13 6
Retail 6 5 9 5
Finance 9 4 6* 6
Service 9 4 11 3
State/Local Government 9 5 29 3
Health Care 9 7 12 6
ALL FIRM SIZE S, REGIONS, AND INDUSTRIE S 8% 5% 17% 5%
Exhibit 12.2
Among All Firms Both Offering and Not Offering Health Benefits, Percentage Offering Wellness Programs To Their Employees, by Firm Size, Region, and Industry, 2005
* Estimate is statistically different from All Firm Sizes, Regions, and Industries at p.05.
Kaiser/HRET Survey of Employer-Sponsored Health Benefits, 2005.
s o u r c e :

section tw
elveE
mployer O
pinions and Health M
anagement Program
s
12
Employer Health Benefits 2005 Annual Sur vey
124
T H E K A I S E R F A M I LY F O U N D AT I O N - A N D - H E A LT H R E S E A R C H A N D E D U C AT I O N A L T R U S T
Percentage of Covered Percentage of Covered Percentage of Covered Workersin Plans Workers in Plans Workers in Plans with Pre-Admission with Pre-Admission with Case Certification Certification for Management for Inpatient Outpatient for Large Hospital Care Surgery Claims
FIRM SIZE
3 - 24 Workers 69% 61% 59%*
25 - 199 Workers* 68* 58 60*
ALL SMALL FIRMS (3-199 W ORKERS)* 68* 59 59*
Midsize (200 - 999 Workers) 74 55 81
Large (1,000 - 4,999 Workers)* 83* 52 93*
Jumbo (5,000+ Workers) 80 51 95*
ALL LARGE FIRMS (200 OR MORE W ORKERS) 79 52 91*
PLAN T YPE
Conventional 57%* 44% 66%*
HMO 69* 58 82
PPO 78 52 81
POS 78 66* 79
REGION
Northeast 73% 53% 79%
Midwest 72 45* 81
South 81 61 80
West 72 57 83
INDUSTRY
Mining/Construction/Wholesale 73% 53% 71%*
Manufacturing 79 45 91*
Transportation/Communications/Utility 72 53 85
Retail 79 47 74
Finance 78 50 80
Service 74 64* 76
State/Local Government 67 51 88*
Health Care 79 58 84
ALL FIRM SIZE S, REGIONS, AND INDUSTRIE S 75% 55% 81%
Exhibit 12.3
Percentage of Covered Workers in Plans with Utilization Management Provisions, by Firm Size, Plan Type, Region, and Industry, 2005
* Estimate is statistically different from All Firm Sizes, Regions, and Industries at p.05.
Kaiser/HRET Survey of Employer-Sponsored Health Benefits, 2005.
s o u r c e :

section tw
elveE
mployer O
pinions and Health M
anagement Program
s
12
Employer Health Benefits 2005 Annual Sur vey
125
T H E K A I S E R F A M I LY F O U N D AT I O N - A N D - H E A LT H R E S E A R C H A N D E D U C AT I O N A L T R U S T
Exhibit 12.4
Percentage of Covered Workers in Plans With A Disease Management Program and, Among Those, Percentage with Specific Programs, 2005
* Estimate is statistically different from All Firm Sizes and Plan Types at p.05.
Note: The survey defines disease management programs as programs that try to improve the health and reduce the costs associated with people with chronic illnesses by teaching patients about their disease, suggesting treatment options, and assessing the treatment process and outcomes.
s o u r c e :
Kaiser/HRET Survey of Employer-Sponsored Health Benefits, 2005.
* Estimate is statistically different from All Plans at p.05.
AMONG COVERED WORKERS ENROLLED IN A PLAN WITH DISEASE MANAGEMENT PROGRAMS, PERCENTAGE WITH PARTICULAR DISEASE MANAGEMENT, BY PLAN TYPE AND FIRM SIZE, 2005
Diabetes Asthma Hypertension High Cholesterol
FIRM SIZE
All Small Firms (3 - 199 Workers) 99% 84% 85% 82%
All Large Firms (200 or More Workers) 98 86 82 62
PLAN T YPE
Conventional 98% 61%* 62% 65%
HMO 98 91 83 72
PPO 99 84 79 61
POS 99 90 87 74
ALL FIRM SIZE S AND PLAN T YPE S 99% 86% 82% 66%
0%
10%
20%
30%
40%
50%
60%
70%
conventional hmo ppo pos all plans
50%
65%*
54% 52%56%
PERCENTAGE OF COVERED WORKERS IN PLANS WITH A DISEASE MANAGEMENT PROGRAM, 2005
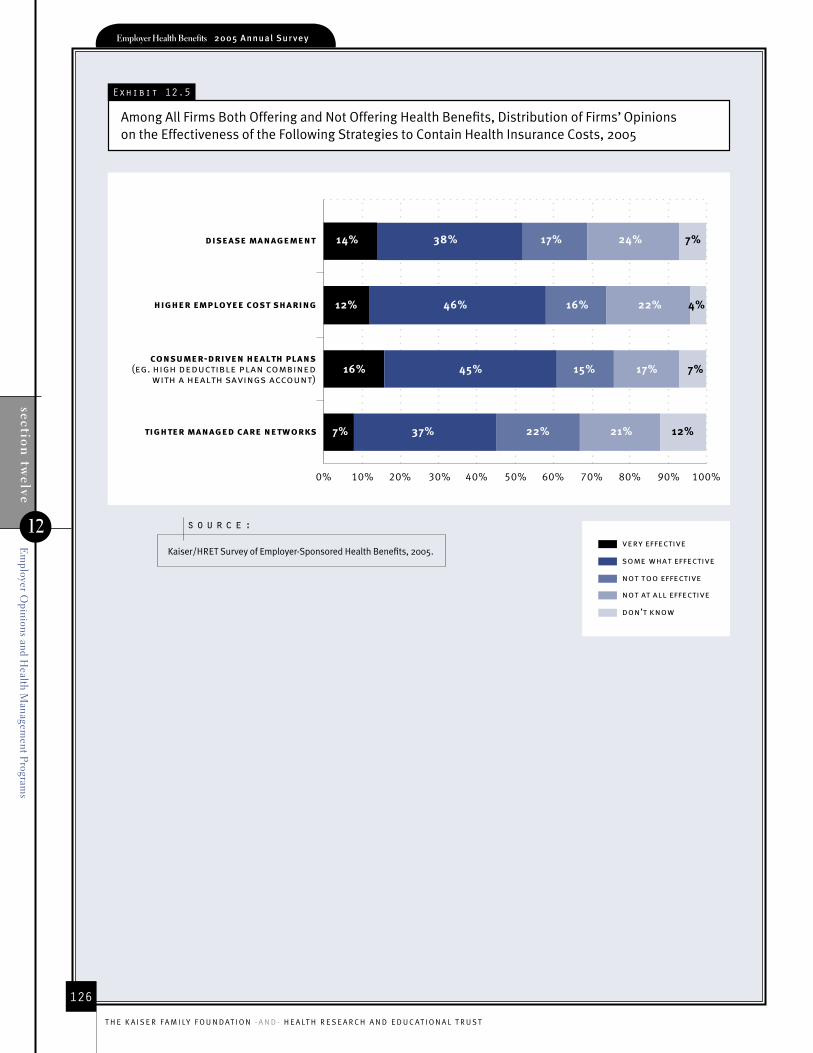
section tw
elveE
mployer O
pinions and Health M
anagement Program
s
12
Employer Health Benefits 2005 Annual Sur vey
126
T H E K A I S E R F A M I LY F O U N D AT I O N - A N D - H E A LT H R E S E A R C H A N D E D U C AT I O N A L T R U S T
Exhibit 12.5
Among All Firms Both Offering and Not Offering Health Benefits, Distribution of Firms’ Opinions on the Effectiveness of the Following Strategies to Contain Health Insurance Costs, 2005
0% 10% 20% 30% 40% 50% 60% 70% 80% 90% 100%
tighter managed care networks
higher employee cost sharing
disease management
very effective
some what effective
not too effective
not at all effective
don’t know
consumer-driven health plans(eg. high deductible plan combined
with a health savings account)
14% 38% 17% 24%
12% 46% 16% 22%
16% 45% 15% 17%
7% 37% 22% 21%
7%
4%
7%
12%
Kaiser/HRET Survey of Employer-Sponsored Health Benefits, 2005.
s o u r c e :

section tw
elveE
mployer O
pinions and Health M
anagement Program
s
12
Employer Health Benefits 2005 Annual Sur vey
127
T H E K A I S E R F A M I LY F O U N D AT I O N - A N D - H E A LT H R E S E A R C H A N D E D U C AT I O N A L T R U S T
Very Somewhat Not Not Don’t Likely Likely Too Likely At All Likely Know
INCREA SE THE AMOUNT EMPLOYEE S PAY FOR HEALTH INSURANCE*
All Small Firms 15% 27% 21% 36% 1%All Large Firms 43% 31% 13% 12% <1%
INCREA SETHE AMOUNT EMPLOYEES PAY FOR PRESCRIPTION DRUGS*
All Small Firms 7% 26% 28% 38% 1%All Large Firms 12% 33% 36% 18% 1%
INCREA SETHE AMOUNT EMPLOYEES PAY FOR DEDUCTIBLES*
All Small Firms 8% 24% 27% 41% 1%All Large Firms 16% 32% 33% 18% 1%
INCREA SE THE AMOUNT EMPLOYEE S PAY FOR OFFICE VISIT COPAYS OR COINSURANCE*
All Small Firms 7% 22% 30% 39% 1%All Large Firms 12% 31% 37% 20% 1%
INTRODUCE TIERED COST SHARING FOR DOCTOR VISITS OR HOSPITAL STAYS*
All Small Firms <1% 14% 32% 51% 4%All Large Firms 2% 16% 39% 40% 3%
RE STRICT EMPLOYEE S ELIGIBILIT Y FOR COVERAGE*
All Small Firms 1% 9% 21% 66% 2%All Large Firms 2% 6% 34% 56% 1%
DROP COVERAGE ENTIRELY
All Small Firms 1% 2% 7% 89% 1%All Large Firms 0% 2% 5% 93% <1%
Exhibit 12.6
Distribution of Firms Reporting The Likelihood of Making the Following Changes in the Next Year, by Firm Size, 2005
* Distributions are statistically different between All Small and All Large Firms within categories at .05.
All Small Firms: 3-199 Workers
All Large Firms: 200 or More Workers
Kaiser/HRET Survey of Employer-Sponsored Health Benefits, 2005.
s o u r c e :

0%
2%
4%
6%
8%
10%
12%
14%
16%
18%
1993 19941988 1989 1990 1991 1992 1995 1996
5.3%*
8.5%
12.0%
18.0%
14.0%12.9%*
11.2%*
9.2%*
13.9%†
0.8%
19991997 1998 20012000 2002 2003 2004 200520
05
The Henry J. Kaiser Family Foundation2400 Sand Hill Road
Menlo Park, CA 94025Phone: 650-854-9400 Fax: 650-854-4800
Washington Office:
1330 G Street NW
Washington, DC 20005
Phone: 202-347-5270 Fax: 202-347-5274
www.kff.org
Individual copies of this publication (#7315)
are available on the Kaiser Family Foundation’s website at www.kff.org.
Multiple copies may be obtained from HRET by calling 1-800-242-2626 (order #097514).
The Kaiser Family Foundation is a nonprofit, private operating foundation dedicated to providing information and
analysis on health care issues to policymakers, the media, the health care community, and the general public.
The Foundation is not associated with Kaiser Permanente or Kaiser Industries.
September 2005
Employer H
ealth Benefits 20
05
an
nu
al
su
rv
ey
T
HE
KA
ISE
R F
AM
ILY F
OU
ND
AT
ION
-AN
D- H
EA
LTH
RE
SE
AR
CH
AN
D E
DU
CA
TIO
NA
L T
RU
ST
-and-
the kaiser family foundation- A N D -
health research and educational trust
2 0 0 5 A n n u a l S u r v e y
E m p l o y e rH e a l t h
B e n e f i t s